Abstract
In this paper, improvement in the power transfer capacity of transmission lines (TLs) by utilizing a multi-terminal high voltage direct current (MT-HVDC) grid is discussed. A multi-terminal HVDC grid designed for wind power can be used as an extra transmission path in interconnected systems during low wind conditions, and provides extra dynamic stability and security. This paper deals with the power transfer capacity as well as the small signal (SS) stability assessments in less damped oscillations accompanying inter area modes. Computation of the maximum allowable power transfer capability is assessed via DC optimal power flow-based control architecture, permitting more power transfer with a definite security margin. The test system is assessed with and without the exploitation of MT-HVDC grid. Simulation work is done using a generic computational framework i.e., international council on large electric systems (CIGRE) B4 test bench with a Kundur’s two area system, shows that voltage source converters (VSCs) provide excellent control and flexibility, improving the power transfer capability keeping the system stable.
1. Introduction
Recent researches proved that voltage source converter (VSC) based multi-terminal high voltage direct current (MT-HVDC) has a great potential to deal with the challenges of future transmission networks. Along with many advantages, MT-HVDC grids have some promising applications [1,2]. One of the main applications is integration of offshore wind farms (WFs) to mainland alternating current grids [3] as suggested for European super-grid [4]. Also, the North Sea wind farms can be interconnected with Mediterranean solar and Scandinavian hydropower plants [2]. No charging current exists in MT-HVDC grids as seen in long AC lines. In 2013, Rongxin Power Electronics (RXPE) commissioned the world’s first Nan’ao multi-terminal flexible HVDC project in China [5].
In the near future, a lot of new challenges will be faced by power system operators (PSOs) with the provision of flexible and robust controlled infrastructures of MT-HVDC [6]. The consumer-ends’ demands like high degree of reliability, security and good power quality will also be the part of those challenges. The system planning and operation is highly affected by the fitful nature associated with the renewable generation, especially with wind power and solar power plants [1]. Hence, the power electronics and power system companies are compelled to design such control schemes to enhance the system security, reliability and efficiency [7].
In [8], a novel transmission system topology of MT-HVDC grids for offshore wind farms is presented. Major hindrance in development of MT-HVDC systems is lack of protection scheme to interrupt DC faults [9,10]. However, numerous studies have been reported to develop appropriate models and control techniques [11,12,13]. The requirements of HVDC circuit breaker parameters and analysis of different types of faults in DC networks are discussed in [14]. Fault ride-through capacity of hybrid line commutated converter (LCC)-VSC based MT-HVDC transmission system is investigated in [15]. A general mathematically derived model, suitable for any topology of DC network, is discussed in [16]. Chaudhuri et al. discussed the interaction between MT-HVDC grid and multi machine AC systems in [17]. S. Jafarishiadeh et al. proposed a novel dc/dc converter for interconnecting multiple DC grids with different voltage levels as well as controlling the power flow between them [18]. In [19], a methodology for droop control in MT-HVDC systems is proposed and the impact of variable droop control technique for independent power sharing during transient conditions is analyzed. Prieto-Araujo et al. proposed a control scheme for MT-HVDC gird by providing a methodology to design coefficients for the DC droop-control [20]. During the large and small disturbances, impacts of the MT-HVDC grid control parameters are discussed by Kalcon et al. in [21]. In order to provide additional damping to onshore VSC stations, impacts of installing power system stabilizer (PSS) is discussed in [22].
The optimal power flow (OPF) of a combined AC/DC system is explored with a nonlinear model in [23] and [24]. Security constrained OPF (SC-OPF) in an AC only grid is proposed in [25]. Chatzivasileiadis et al. presented SC-OPF for two terminal HVDC system with post-contingency control [26]. Calculation of maximum allowable power transfer from generating station to load is done in [27] considering the system stability margins, using particle swarm optimization technique (PSO). A steady-state security region is a combination of active and reactive power injections for which the security constraints and the power flow equations enforced by equipment operating limits are satisfied [28]. Xiau et al. presented detailed study regarding definition, model and applications of security regions in power systems [29]. An OPF based control is presented in [30] to minimize the losses in MT-HVDC girds. Grijalva proposed an algorithm to enhance the linear available power transfer capability by incorporating the reactive power flow [31] but this is limited to AC networks. Methods on enhancing the inter-area power transfer capability with security region determination is lacking in the literature. The influence of MT-HVDC on AC grids is discussed in [32] but without DC OPF. Even the international council on large electric systems (in French: Conseil International des Grands Réseaux Électriques, CIGRE) joint working group B4, C1 and C4 did not discuss the inter-area power transfer capability and security margins in its report [33].
Despite the fact that a lot of research has already been done to develop appropriate DC grid models and control schemes but the impacts of MT-HVDC system on dynamic security and stability of power systems (PS) has not been discussed fully yet. For this concern, an important feature is the transfer capacity in inter-area mode that shows how much power can be transferred without violating the system stability limits. To the authors best knowledge, the impacts of MT-HVDC systems on enhancing the power transmission capability (PTC) has not been addressed in literature yet. Transfer capability is an important factor that influences the planning and operation of electrical power systems [34]. Topological changes caused by unexpected events and scheduled maintenance can extremely modify the reliable transfer of electric power [34]. The intermittent behavior of renewable energy resources may vary the power flow and impose negative or positive impact on system operation. Especially during low wind conditions, a space in dedicated DC transmission line may be observed that can be used for increased power transmission capacity.
This work suggests the use of MT-HVDC grids to enhance power transfer capability of transmission lines. The DC grid is exploited as an extra transmission route, specifically during low wind conditions. This idea relates with the theme of capacity factor. In [35], it is observed that Danish WFs have an average capacity factor of 41%, which means that the associated DC system is free for 59% of the time and available for some alternate use.
The main contributions of this paper are:
- Small signal stability during bulk power transfer over long transmission path, when damping criterion is violated by any small change.
- Transfer capability is assessed by analyzing power transfer through a specific corridor and security region determination. The DC network is used as an additional inter-area transmission path especially under low wind scenarios.
- Computation of maximum allowable power transfer capability through security regions (Nomogram) using OPF based control architecture.
- Proposed strategy is evaluated via simulations developed in Matlab/Simulink for Kundur’s two area AC system integrated with CIGRE B4 5-terminal VSC-HVDC system and security region nomograms.
- Established that power transfer capability and security of AC system can be enhanced by coupling it with an HVDC grid.
2. Test System Under Study
Single line diagram of Kunder’s two area AC network is shown in Figure 1 (yellow highlighted). Two-area system consist of two generating groups, each group having two generators and a load. Operating parameters of synchronous generators are given in Table 1 with base power and voltage as 900 MVA and 20 kV, respectively. Parameters for AC transmission lines connecting different buses are given in Table 2, on 100 MVA and 230 kV basis. Values of load and shunt capacitors attached at bus-7 and 9 are given in Table 3. The DC grid, 5-terminal CIGRE B4 test system, is shown in Figure 1 (grey highlighted). CIGRE B4 test network consist of two wind farm side VSCs (WF-VSC) and three onshore grid side VSCs (GS-VSCs). Each VSC have its own sole control, discussed in Section 4.1. The connection of bi-polar transmission cables is done through positive and negative DC voltages. Transmission lines data of CIGRE B4 is given in Table 4 while VSC station parameters are given in Table 5. Each line includes a 100 mH DC inductor to imitate a real-time DC system but they lack the capability to overcome the DC-grid faults. To assess the impacts of MT-HVDC grid on AC systems, integration of CIGRE B4 system is made with Kunder’s two area AC network via buses 7 and 9, respectively, as shown in Figure 1. The connections are developed via star-delta transformers.
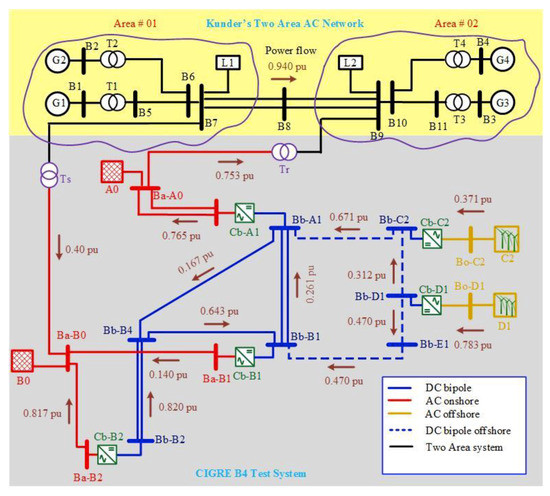
Figure 1.
Interconnected AC/DC systems.

Table 1.
Operating parameters of synchronous generator.
Table 2.
Line parameters of Kunder’s AC network.
Table 3.
Load and shunt capacitance connected in Kunder’s AC network.
Table 4.
CIGRE B4 transmission lines data.
Table 5.
VSC-HVDC stations parameters.
3. Power Transfer Capability Evaluation
Power transfer capability means the maximum power transfer between different zones keeping the system within its security limits. Conventionally, static security assessment is employed to study transfer capability due to limitations in computational time, specifically in online environment. Thus, load flow analysis (LFA) is deployed to observe thermal and voltage limits. The linearized power flow technique [31] and continuation power flow algorithm [36] are used to evaluate the voltage and thermal limits considering the list of credible contingencies.
However, the dynamic performance of the system must be considered while evaluating the transfer capability. Hence, precise limits can only be obtained if dynamic security assessment (DSA) is done, observing small-signal stability and transient voltages [37]. However, conflict of objectives may occur if two or more aspects are considered simultaneously for security evaluation [38]. As authors focused on inter-area power transfer capability in this paper, thus only small-signal stability is studied with static evaluation. In order to analyze power transmission capability, two aspects are focused and discussed in subsequent sections; (i) power transmission through a specific corridor and (ii) security region determination.
3.1. Power Treansfer Capability in Particular Corridor
Transmission capacity can be observed by changing (i) load demand and (ii) power generation. In this paper, system load is kept constant and generation in importer area is decreased while generation in an exporter area is increased with the same amount, once the transmission link is established. If the exchange variation is (ΔE), Equation (1) gives the expression to determine the power change in generator i (ΔPi):
where, Pi denotes the prior output power of i generator, while NA is the number of synchronous generators in specific area. In importer area, ΔPi is negative while it would be positive in exporter area. Further, ΔPi should be selected based on the maximum rating of each generator.
Power dispatch corresponds to the exchange value and, for every dispatched power, static and dynamic security assessments are accomplished based on pre-determined criteria. System will be considered secured only if no security violation is observed and thus additional re-dispatch will be performed according to Equation (1). However, if any security criterion is violated, a step back in re-dispatch is performed via binary hunt until a safe region is reached.
3.2. Security Regions
Transmission capability can also be assessed through the security regions [37]. Security regions determination is a graphical method to indicate safe re-dispatch of power between different zones/areas. This is important in online applications as it provides visualization to the power system operator as to how power transfer can be altered, preserving the system integrity. Almeida et.al. presented a methodology to develop security regions, known as nomogram [39]. Although authors have discussed only static security aspects but the presented technique can be extended for dynamic security analysis.
Typically to construct security regions (nomogram), three generation groups (Group-1, Group-2 and Group-3) are considered. Group-3 (Gp3) acts as slack bus and power is transferred between other two groups. As a result, a three-dimensional graph is obtained, whose security boundaries constitute power generation in each group. Voltage security analysis is done using nomogram in [40], offer provision to use for security assessment to PSO’s.
Figure 2 shows a security nomogram, relating the power produced by two generation groups: Group-1 (Gp1) and Group-2 (Gp2). The group Gp3 is not in the nomogram of Figure 2 as the nomogram is just an orthogonal projection onto one of the generation planes, e.g., (Gp1 × Gp2). However, it is emphasized that two additional nomograms (Gp2 × Gp3) and (Gp3 × Gp1) can be plotted and would be analogous to the one demonstrated in Figure 2.
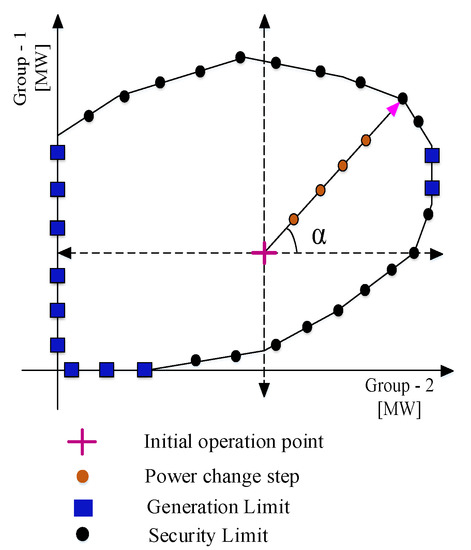
Figure 2.
Security region nomogram.
Re-dispatch directions are defined using initial operating point and the angle α. Angle α establish the direction, as shown in Figure 2, and determine the proportion of power to be re-dispatched in each group. Once defined, the re-dispatch direction (α), total re-dispatched power (ΔR), and power changes in Gp1 (Δ Gp1) and Gp2 (Δ Gp2) are obtained as in (2):
and α can be determined from (3) [39]:
where α0 is the initial angle and ND represents the number of directions; j = 0, 1, 2, 3……ND. While change in power (ΔPi) from each generator i within each group can be:
where Pi represents prior output power of generator i while NG shows number of generators within selected group. ΔPi can be positive or negative based on the direction of re-dispatched power.
During the construction of nomogram, power balance is needed and provided by the slack bus, Gp3, while the system load is kept constant. For instance, considering the operating point in the 1st quadrant, where generations from both groups Gp1 and Gp2 are increasing and thus Gp3 would have to reduce its power for system security.
System security is evaluated for each power change step, for both dynamic and static securities. If any security standard is violated, a step back in re-dispatch is realized via binary search until a safe limit is reached. However, sometimes the power limit is enforced by the generation capability of one specific group as shown in Figure 2 with squares (boxes). The accuracy of the security boundary increased with the number of directions (ND).
4. Modeling and Computation Structure
Complete knowledge and investigation of HVDC technology and wind power generation in existing PS requires a generic model to represent all key elements in a shared structure. A generic modeling layout has been developed for small-signal stability research and control design [41] and, is used for simulations in this paper. Simulations are developed in Matlab/Simulink. The modeling involves, converters, dynamic representation of synchronous generators, AC networks, DC connections, and wind farms. The simulation framework’s graphical representation is illustrated in Figure 3.
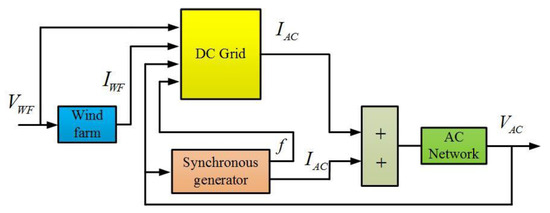
Figure 3.
Generic simulation layout.
In Figure 3, VWF and IWF are the AC voltages and currents of WFs, respectively. The frequency of synchronous generators is represented by f. IAC represents the currents of the AC grid and the synchronous generators. VAC gives the value of AC voltages of the mainland AC network.
The main AC grid block includes the onshore AC network model (Kunder’s two area system). All generators except wind farms are represented by the block of synchronous generators. The wind farm block represents the offshore wind farms which are tied to an onshore AC network, contains the offshore VSC converter stations. The interconnection of main AC grid and the offshore WFs is modeled by the DC grid block. This block contains the area between AC converter bus and the AC system bus. Consequently, the DC grid block’s interface voltages and currents are AC parameters, shown in Figure 3. By using this generic model, number of WFs, the DC grid configuration, the main AC system, the amount and the position of generators can easily be selected and modified to enable the analysis of various solutions to extend planning for any power system. The literature has well demonstrated the modeling of the main AC grid, control structure and synchronous machines [42].
4.1. Control Layout for CIGRE B4 Test System
The control scheme adopted for MT-HVDC grid is illustrated in Figure 4. The proposed framework has a hierarchical control configuration consisting of grid control and power converter stations control layers. Actually, the low-level VSC station control is devoted to problems such as optimizing control parameters for VSCs and upper control layer is dedicated to the droop/WF control. Optimal power flow (OPF) process calculations are done in the grid level unit (dispatch center).
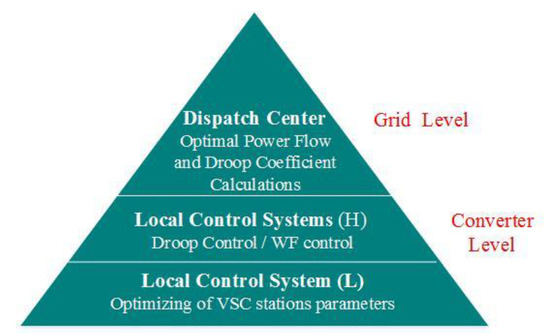
Figure 4.
Control organization for CIGRE B4 test grid.
4.1.1. Dispatch Center
As reactive power is not present in the MT-HVDC grid, DC OPF is considered as a confined variant of AC OPF. Different objective functions for an OPF operation are defined in [30,43]. The power flow algorithm used in this paper contains an optimization algorithm designed in [44] for transmission loss minimization. Details on DC OPF are not added to limit the length of the paper. The DC OPF is a non-linear optimization problem that can be addressed by employing a gradient descent approach, and results as [44,45]:
where λ represents the vector of Lagrange multipliers for equality parameter. V shows dc-link voltages, I gives the value of DC currents and q is the penalty function for the inequality constraints. P is the active power of the converter stations. IDC, i max is the upper limit of the permissible IDC transmitted through the ith transmission line. , , and symbolize the penalty factors for maximum and minimum limits of DC-link voltage, VSC stations limits and TL limits, respectively [43].
The DC OPF result can be calculated by equating the Lagrangian derivative of unknown variables to zero, and then to solve iteratively [44]:
4.1.2. Local Controllers
MT-HVDC grid performance is highly dependent on the used control approach, while control relies primarily on the type of AC network connection and the configuration of the DC grid [8]. The P-Vac control is deployed to regulate the AC voltages of WFs at precise level [11]. To generate stable AC voltage at 50 Hz, proportional integral (PI) control is used to reduce voltage error (e = VWF* − VWF), which then employed as performance index [11,46]. Table 6 lists the specifications for PI control parameters.
Table 6.
PI controller parameters.
As illustrated in Figure 5, VDC and Q are regulated at GS-VSCs for the evaluation of MT-HVDC grid. The DC OPF is executed in the dispatch center while generalized voltage-droop control for each VSC is done locally and at the primary level [44,46]. Moreover, Figure 6 displays a droop controller structure used to regulate DC grid voltage. Where Vg* pu and P* pu are direct voltage and real power references, respectively, while k is the slope of the droop characteristic [47,48].
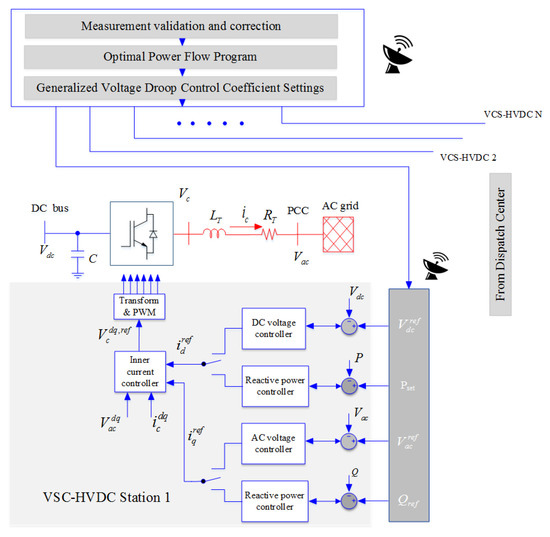
Figure 5.
Droop control using d-q control.
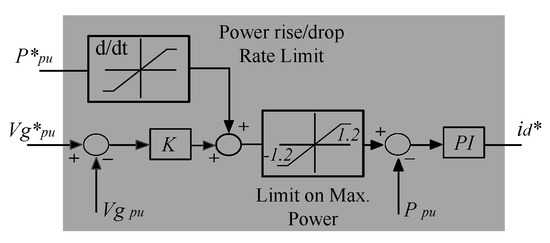
Figure 6.
The DC droop controller.
It is worth noting that the d–q control approach [49] is employed at the primary (VSC station) level. The OPF at dispatch center is performed in the time scale of second while the time constant for the primary control system is in the range of milliseconds. The computational cost of DC OPF is 1.64 s in this paper.
An average two-level VSCs value model is used for MT-HVDC grid modeling, while WFs are demonstrated as fixed power sources.
5. Simulations and Results
The proposed research is assessed via interconnected Kundur’s two area AC network and CIGRE B4 5-terminal VSC-HVDC systems as shown in Figure 1. The connections are developed through bus 7 and 9 of the two area system. Simulations are developed in Matlab/Simulink to observe the impact of MT-HVDC grids on the transfer capacity of AC transmission networks. Power transfer capability of test system is further illustrated via security regions (nomograms). The generation groups Gp1 and Gp2 are selected from the generation units of area-1 and area-2, respectively, of Figure 1 (with slack bus). Generating capacity of each group is taken 1800 MW. For the power balance, a third slack group (Gp3), generator 5 (G5) connected at bus 8, is introduced within the system as shown in Figure 7. Slack group is mandatory in order to maintain a power balance within all quadrants.
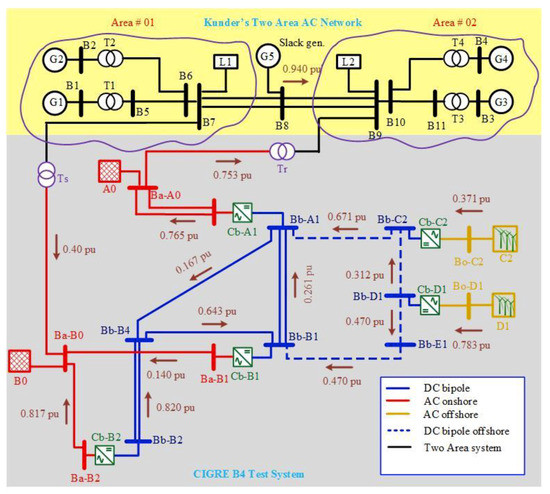
Figure 7.
Interconnected AC/DC grid with slack bus.
To compute security regions (standalone AC grid and integrated AC/DC systems, respectively), 16 directions have been assumed as shown in Figure 8. Thus the anticipated angles are 22.5°, 45°, 67.5°, 90°,…, 360°, using (3). In each direction, the power to be re-dispatched in Gp1 and Gp2, calculated using (2). Power change steps are shown in Figure 8 by the points a, b, c, d, e, and f in the direction of arrow. The power-sharing by each generator within the group is computed by (4). Power balance must be maintained and achieved through Gp3. Then, three cases are discussed with the help of power transfer capacity evaluation and security regions.
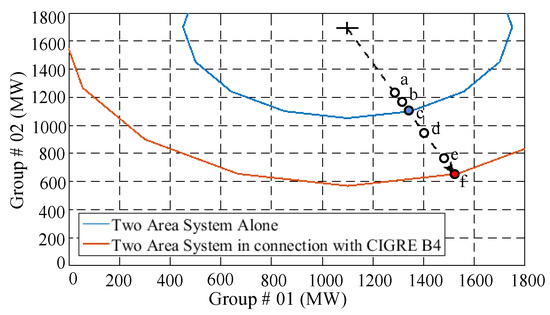
Figure 8.
Security nomogram for (i) standalone Kunder’s AC network (blue lines) and (ii) interconnected AC/DC systems (red lines).
5.1. Standalone AC Network Simulations and Nomogram
Kunder’s two area AC network of Figure 1 is assessed alone to evaluate the maximum power transmission towards the area-2 from area-1 by means of the transmission lines via Matlab/Simulink with parameters given in Table 1, Table 2 and Table 3. Security criteria focuses on the safe thermal and voltage limits in steady-state operation, i.e., load flow analysis and damping factor. Power transfer variations based on change in power of each generator is computed by (1) for each step as shown in Figure 9 with blue wave. This phenomenon is further illustrated in Figure 8 of security regions with blue curve. Initially, power transmitted is 535 MW, also revealed in Figure 9 by point ‘a’. To check the stability, power transmission is raised to 600 MW and then to 649 MW, respectively. As the power transmission is raised further from 649 MW, Kunder’s AC network becomes unstable as revealed in Figure 9 at 18 s and same is portrayed by the outer surface area of blue curve in Figure 8. The blue curve is the boundary line showing the flow of 649 MW. Standalone AC system remains stable within this blue boundary. Thus, Kunder’s two area AC network alone cannot transfer power more than 649 MW from the exporter area to importer region.
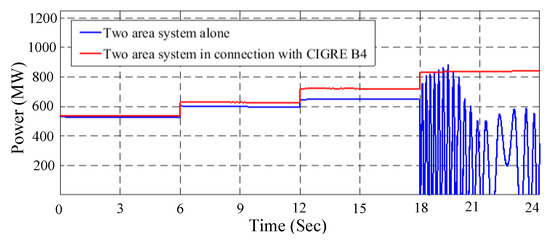
Figure 9.
Power profile for (i) standalone Kunder’s AC network (blue lines) and (ii) interconnected AC/DC systems of Figure 1 (red lines).
5.2. Interconnected AC/DC Grid Simulations and Nomogram
Interconnected Kunder’s AC network with CIGRE B4 DC system of Figure 1 is assessed with Matlab/Simulink simulations, using parameters given in Table 4, Table 5 and Table 6. Security region nomogram is shown in Figure 10 with red curve drawn with technique explained in Section 3. Power transfer and stability evaluation for interconnected AC/DC configuration is shown in Figure 9 through red wave. Figure 9 also provides comparison between case 1 and 2. As the power transmission is increased beyond 649 MW, the stand-alone system becomes unstable but the interconnected AC/DC system remains stable. This can also be seen in Figure 8, as we move towards point ‘d’, the system is still in the secured region. Load flow analysis results are given in Table 7. It shows that whence DC grid is employed with two-area system some of the power flows through the HVDC network, hence enhancing the power transmission capability as well as the stability of the system.
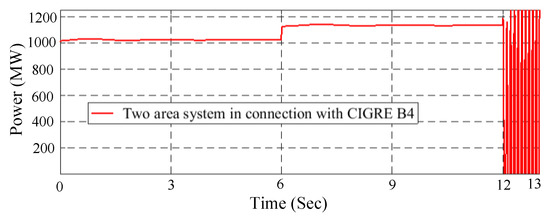
Figure 10.
Power profile for interconnected AC/DC systems till the system becomes unstable.
Table 7.
Load flow results at transmission limits of Standalone Kunder’s network and Interconnected AC/DC grid.
5.3. Stability of AC Network with MT-HVDC Grid
The same circuit is assessed as in previous section. This section deals with the power transfer capability limit of interconnected AC/DC system. The power exchange from area-1 to area-2 is further increased in steps and a limit is reached at 1130 MW as shown in Figure 10. When the power exchange is increased beyond 1130 MW, the system of Figure 1 becomes unstable and oscillations are observed. The same results are shown in Figure 8, i.e., interconnected AC/DC grid remains stable till point ‘f’ (1130 MW). It is evident that interconnected system has larger secured operation area than standalone two area AC system. MT-HVDC system provides additional path for flow of power and extra stability to Kunder’s two area system.
In [32], the authors computed 749 MW as maximum power transfer capability of Kunder’s two area system which is 381 MW less than 1130 MW. Thus, proposed approach based on DC OPF gives improved power transmission results for AC systems when connected with MT-HVDC girds.
6. Conclusions
This article discussed the exploitation of MT-HVDC grids for improvement in power transfer capability, especially during low wind conditions. Original dedicated DC grids for wind power transmission were employed as an additional transmission path, providing extra dynamic security. Computation of maximum allowable power transfer capability is determined through security regions (Nomogram) using OPF based control architecture. The anticipated idea was assessed using Kunder’s two area system considering small signal stability assessment. Simulations were developed in Matlab/Simulink for a standalone AC two area network and interconnected five-terminal CIGRE B4 DC grid with Kunder’s two-area systems to investigate the power transmission capability via two aspects, namely (i) power transmission through a specific corridor and (ii) security region determination, respectively. Firstly, PTC of standalone Kunder’s network was assessed. It was observed that the system becomes unstable after 649 MW power transfer. Later on, the interconnected AC/DC grid was evaluated and established that system is more stable with increased power transfer capability to 1130 MW. Results from simulations and security nomograms were well matched and proved that the adequate power set in the DC grid can ease the limit of AC systems, permitting more power transfer with a definite security margin.
Author Contributions
Conceptualization; A.R.; Formal analysis, A.R., A.S., A.R.Y.; resources, A.R., A.R.Y.; Investigation, A.R., A.S., A.A., A.R.Y.; Software A.S.; Validation, A.R., A.S.; writing—original draft preparation, A.S., A.A.; writing—review and editing, A.S., A.R., M.O.A., A.R.Y.; supervision, A.R.; project administration, A.R., M.O.A.; funding acquisition, A.R., A.A., M.O.A. All authors have read and agreed to the published version of the manuscript.
Funding
This project was funded by the Deanship of Scientific Research (DSR), King Abdulaziz University, Jeddah, under grant No. (DF-468-611-1441). The authors, therefore, gratefully acknowledge DSR technical and financial support.
Acknowledgments
Authors are thankful to the Department of Electrical Engineering, The University of—Pakistan and Department of Information Technology, King Abdulaziz University, Jeddah, Saudi Arabia for providing facilities to conduct this research.
Conflicts of Interest
The authors declare no conflict of interest.
References
- An, T.; Tang, G.; Wang, W. Research and application on multi-terminal and DC grids based on VSC-HVDC technology in China. High Volt. 2017, 2, 1–10. [Google Scholar] [CrossRef]
- Global Wind Energy Council Global Wind Report: Annual Market Update 2017. Available online: https://theswitch.com/2018/04/25/global-wind-report-annual-market-update/ (accessed on 14 October 2019).
- Negra, T.A.N.B.; Todorovic, J.; Lazaridis, L. Evaluation of electrical transmission concepts for large offshore wind farms. In Proceedings of the Copenhagen Offshore Wind Conference and Exhibition, Copenhagen, Denmark, 26-28 October 2005. [Google Scholar]
- Arrillaga, J.; Liu, Y.H.; Watson, N.R. Flexible Power Transmission: The HVDC Options; John Wiley: Hoboken, NJ, USA, 2007. [Google Scholar]
- Rongxin Power Electronic (RXPE) Commissions the World’s First VSC Multi-Terminal HVDC Project. 2013. Available online: http://goo.gl/1sZhMo (accessed on 17 December 2019).
- Li, G.; Li, C.; van Hertem, D. HVDC technology overview. In HVDC Grids: For Offshore and Supergrid of the Future, Chapter 3; Wiley-IEEE Press: Hoboken, NJ, USA, 2016; pp. 45–78. [Google Scholar]
- Chaudhuri, N.; Chaudhuri, B.; Majumder, R.; Yazdani, A. Multi-terminal Direct-Current Grids: Modeling, Analysis, and Control; Wiley-IEEE Press: Hoboken, NJ, USA, 2014. [Google Scholar]
- Raza, A.; Dianguo, X.; Xunwen, S.; Weixing, L.; Williams, B.W. A Novel Multi-terminal VSC-HVDC Transmission Topology for Offshore Wind Farms. IEEE Trans. Ind. Appl. 2017, 53, 1316–1325. [Google Scholar] [CrossRef]
- Raza, A.; Akhtar, A.; Jamil, M.; Abbas, G.; Gilani, S.O.; Yuchao, L.; Williams, B.W. A Protection Scheme for Multi-Terminal VSC-HVDC Transmission Systems. IEEE Access 2018, 6, 3159–3166. [Google Scholar] [CrossRef]
- Azizi, S.; Sanaye-Pasand, M.; Abedini, M.; Hassani, A. A traveling-wave-based methodology for wide-area fault location in multiterminal DC Systems. IEEE Trans. Power Del. 2014, 29, 2552–2560. [Google Scholar] [CrossRef]
- Raza, A.; Dianguo, X.; Yuchao, L.; Xunwen, S.; Williams, B.W.; Cecati, C. Coordinated Operation and Control of VSC Based Multiterminal High Voltage DC Transmission Systems. IEEE Trans. Sustain. Energy 2016, 7, 364–373. [Google Scholar] [CrossRef]
- Hannan, M.A.; Hussin, I.; ker, P.J.; Hoque, M.M.; Lipu, M.H.; Hussain, A.; Blaabjerg, F. Advanced Control Strategies of VSC Based HVDC Transmission System: Issues and Potential Recommendations. IEEE Access 2018, 6, 78352–78369. [Google Scholar] [CrossRef]
- Beerten, J.; D’Arco, S.; Suul, J.A. Identification and small signal analysis of interaction modes in VSC MTDC systems. IEEE Trans. Power Del. 2016, 31, 888–897. [Google Scholar] [CrossRef]
- Belda, N.A.; Plet, C.A.; Smeets, R.P.P. Analysis of Faults in Multiterminal HVDC Grid for Definition of Test Requirements of HVDC Circuit Breakers. IEEE Trans. Power Del. 2018, 33, 403–411. [Google Scholar] [CrossRef]
- Haleem, M.N.; Rajapakse, A.D.; Gole, A.M.; Fernando, T. Investigation of Fault Ride-Through Capability of Hybrid VSC-LCC Multi-Terminal HVDC Transmission Systems. IEEE Trans. Power Del. 2019, 34, 241–250. [Google Scholar] [CrossRef]
- Cole, S.; Beerten, J.; Belmans, R. Generalized dynamic VSC MTDC model for power system stability studies. IEEE Trans. Power Syst. 2010, 25, 1655–1662. [Google Scholar] [CrossRef]
- Chaudhuri, N.R.; Majumder, R.; Chaudhuri, B.; Pan, J. Stability analysis of VSC MTDC grids connected to multi machine AC systems. IEEE Trans. Power Deliv. 2011, 26, 2774–2784. [Google Scholar] [CrossRef]
- Jafarishiadeh, S.; Dargahi, V.; Sadigh, A.K.; Farasat, M. Novel multi-terminal MMC-based dc/dc converter for MVDC grid interconnection. IET Power Electron. 2018, 11, 1266–1276. [Google Scholar] [CrossRef]
- Chaudhuri, N.R.; Chaudhuri, B. Adaptive droop control for effective power sharing in multi-terminal DC (MTDC) Grids. IEEE Trans. Power Syst. 2013, 28, 21–29. [Google Scholar] [CrossRef]
- Prieto-Araujo, E.; Bianchi, F.D.; Junyent-Ferre, A.; Gomis-Bellmunt, O. Methodology for droop control dynamic analysis of multiterminal VSC-HVDC grids for offshore wind farms. IEEE Trans. Power Deliv. 2011, 26, 2476–2485. [Google Scholar] [CrossRef]
- Kalcon, G.O.; Adam, G.P.; Anaya-Lara, O.; Lo, S.; Uhlen, K. Small-signal stability analysis of multi-terminal VSC-based DC transmission systems. IEEE Trans. Power Syst. 2012, 27, 1818–1830. [Google Scholar] [CrossRef]
- Resende, F.O.; Vasconcelos, M.H.; Lopes, J.A.P. Simultaneous tuning of power system stabilizers installed in the VSC-based MTDC networks of large offshore wind farms. In Proceedings of the IEEE 2014 Power Systems Computation Conference (PSCC), Wroclaw, Poland, 18–22 August 2014. [Google Scholar]
- Wiget, R.; Andersson, G. Optimal power flow for combined AC and multi-terminal HVDC grids based on VSC converters. In Proceedings of the IEEE 2012 Power and Energy Society General Meeting, San Diego, CA, USA, 22–26 July 2012; pp. 1–8. [Google Scholar]
- Baradar, M.; Hesamzadeh, M.; Ghandhari, M. Modelling of multiterminal HVDC systems in optimal power flow formulation. In Proceedings of the IEEE Electrical Power and Energy Conference (EPEC), London, ON, Canada, 10–12 October 2012; pp. 170–175. [Google Scholar]
- Capitanescu, F.; Ramos, J.M.; Panciatici, P.; Kirschen, D.; Marcolini, A.M.; Platbrood, L.; Wehenkel, L. State-of-theart, challenges, and future trends in security constrained optimal power flow. Electr. Power Syst. Res. 2011, 81, 1731–1741. [Google Scholar] [CrossRef]
- Chatzivasileiadis, S.; Krause, T.; Andersson, G. Securityconstrained optimal power flow including post-contingency control of vsc-hvdc lines. In Proceedings of the XII SEPOPE, Rio de Janeiro, Brazil, 20–23 May 2012; pp. 1–12. [Google Scholar]
- Patchanee, S.; Chaitusaney, S.; Eua-arporn, B. Calculation of Maximum Power Transfer Capability between Two Interconnected Areas by using Particle Swarm Optimization. In Proceedings of the IEEE 2014 11th International Conference on Electrical Engineering/Electronics, Computer, Telecommunications and Information Technology (ECTI-CON), Nakhon Ratchasima, Thailand, 14–17 May 2014. [Google Scholar]
- Wu, F.; Kumagai, S. Steady-State Security Regions of Power Systems. IEEE Trans. Circuits Syst. 1982, 29, 703–711. [Google Scholar] [CrossRef]
- Xiao, J.; Gu, W.; Wang, C.; Li, F. Distribution system security region: Definition, model and security assessment. IET Gener. Transm. Distrib. 2012. [Google Scholar] [CrossRef]
- Aragüés-Peñalba, M.; Egea-Àlvarez, A.; Gomis-Bellmunt, O.; Sumper, A. Optimum voltage control for loss minimization in HVDC multi-terminal transmission systems for large offshore wind farms. Electr. Power Syst. Res. 2012, 89, 54–63. [Google Scholar] [CrossRef]
- Grijalva, S.; Sauer, P.W.; Weber, J.D. Enhancement of linear ATC calculations by the incorporation of reactive power flows. IEEE Trans. Power Syst. 2003, 18, 619–624. [Google Scholar] [CrossRef]
- Assis, T.M.L.; Kuenzel, S.; Pal, B.C. Impact of Multi-terminal HVDC Grids on Enhancing Dynamic Power Transfer Capability. IEEE Trans. Power Syst. 2017, 32, 2652–2662. [Google Scholar] [CrossRef]
- Henry, S.; Despouys, O.; Adapa, R.; Barthold, C.; Bell, K.; Binard, J.L.; Karady, G. Influence of Embedded HVDC Transmission on System Security and AC Network Performance; Working group JWG C4/B4/C1—604; CIGRE: Paris France, 2013; Available online: https://e-cigre.org/publication/536-influence-of-embedded-hvdc-transmission-on-system-security-and-ac-network-performance (accessed on 17 December 2019).
- NERC Available Transfer Capability Definitions and Determination. North American Electric Reliability Corporation. June 1996. Available online: http://www.ece.iit.edu/~flueck/ece562/atcfinal.pdf (accessed on 16 December 2019).
- Energy Numbers Capacity Factors at Danish Offshore Wind Farms. Available online: http://energynumbers.info/capacity-factors-at-danish-offshore-wind-farms (accessed on 14 October 2019).
- Ejebe, G.C.; Tong, J.; Waight, J.G.; Frame, J.G.; Wang, X.; Tinney, W.F. Available transfer capability calculations. IEEE Trans. Power Syst. 1998, 13, 1521–1527. [Google Scholar] [CrossRef]
- Morison, K.; Wang, L.; Kundur, P. Power System Security Assessment. IEEE Power Energy Mag. 2004, 2, 30–39. [Google Scholar] [CrossRef]
- Assis, T.M.; Falcão, D.M.; Taranto, G.N. Dynamic transmission capability calculation using integrated analysis tools and intelligent systems. IEEE Trans. Power Syst. 2007, 22, 1760–1770. [Google Scholar] [CrossRef]
- Almeida, F.B.; Passos, J.A.; Pereira, J.L.; Henriques, R.M. Assessment of load modeling in power system security analysis based on static security regions. J. Control Autom. Electr. Syst. 2013, 24, 148–161. [Google Scholar] [CrossRef]
- Sarmiento, H.; Pampin, G.; Barajas, R.; Castellanos, R.; Villa, G.; Mirabal, M. Nomogram for assistance in voltage security visualization. In Proceedings of the 2009 IEEE/PES Power Systems Conference and Exposition, Seattle, WA, USA, 15–18 March 2009. [Google Scholar]
- Kuenzel, S. Modelling and Control of an ACDC System with Significant Generation from Wind. Ph.D. Thesis, Imperial College London, London, UK, 2014. [Google Scholar]
- Kundur, P. Power System Stability and Control; McGraw-Hill: New York, NY, USA, 1994. [Google Scholar]
- Zhu, J. Optimization of Power System Operation; Wiley: New York, NY, USA, 2009. [Google Scholar]
- Rouzbehi, K.; Miranian, A.; Luna, A.; Rodriguez, P. DC Voltage Control and Power Sharing in Multiterminal DC Grids Based on Optimal DC Power Flow and Voltage-Droop Strategy. IEEE J. Emerg. Sel. Top. Power Electron. 2014, 2, 1171–1180. [Google Scholar] [CrossRef]
- Raza, A.; Mustafa, A.; Rouzbehi, K.; Jamil, M.; Gilani, S.O.; Abbas, G.; Shehzad, M.N. Optimal Power Flow and Unified Control Strategy for Multi-Terminal HVDC Systems. IEEE Access 2019, 7, 92642–92650. [Google Scholar] [CrossRef]
- Rouzbehi, K.; Miranian, A.; Candela, J.I.; Luna, A.; Rodriguez, P. A Generalized Voltage Droop Strategy for Control of Multiterminal DC Grids. IEEE Trans. Ind. Appl. 2015, 51, 607–618. [Google Scholar] [CrossRef]
- Raza, A.; Yuchao, L.; Rouzbehi, K.; Jamil, M.; Gilani, S.O.; Dianguo, X.; Williams, B.W. Power Dispatch and Voltage Control in Multiterminal HVDC Systems: A Flexible Approach. IEEE Access 2017, 5, 24608–24616. [Google Scholar] [CrossRef]
- Egea-Alvarez, A.; Bianchi, F.; Junyent-Ferré, A.; Gross, G.; Gomis-Bellmunt, O. Voltage control of multiterminal VSC-HVDC transmission systems for offshore wind power plants: Design and implementation in a Scaled Platform. IEEE Trans. Ind. Electron. 2013, 60, 2381–2391. [Google Scholar] [CrossRef]
- Raza, A.; Dianguo, X.; Sunwen, S.; Wiexing, L. Modeling and control of multi terminal VSC HVDC transmission system for integrating large offshore wind farms. In Proceedings of the 17th IEEE International Multi Topic Conference, Karachi, Pakistan, 8–10 December 2014; pp. 467–472. [Google Scholar]
© 2019 by the authors. Licensee MDPI, Basel, Switzerland. This article is an open access article distributed under the terms and conditions of the Creative Commons Attribution (CC BY) license (http://creativecommons.org/licenses/by/4.0/).