Visual Detection of Surface Defects Based on Self-Feature Comparison in Robot 3-D Printing


Abstract
:1. Introduction
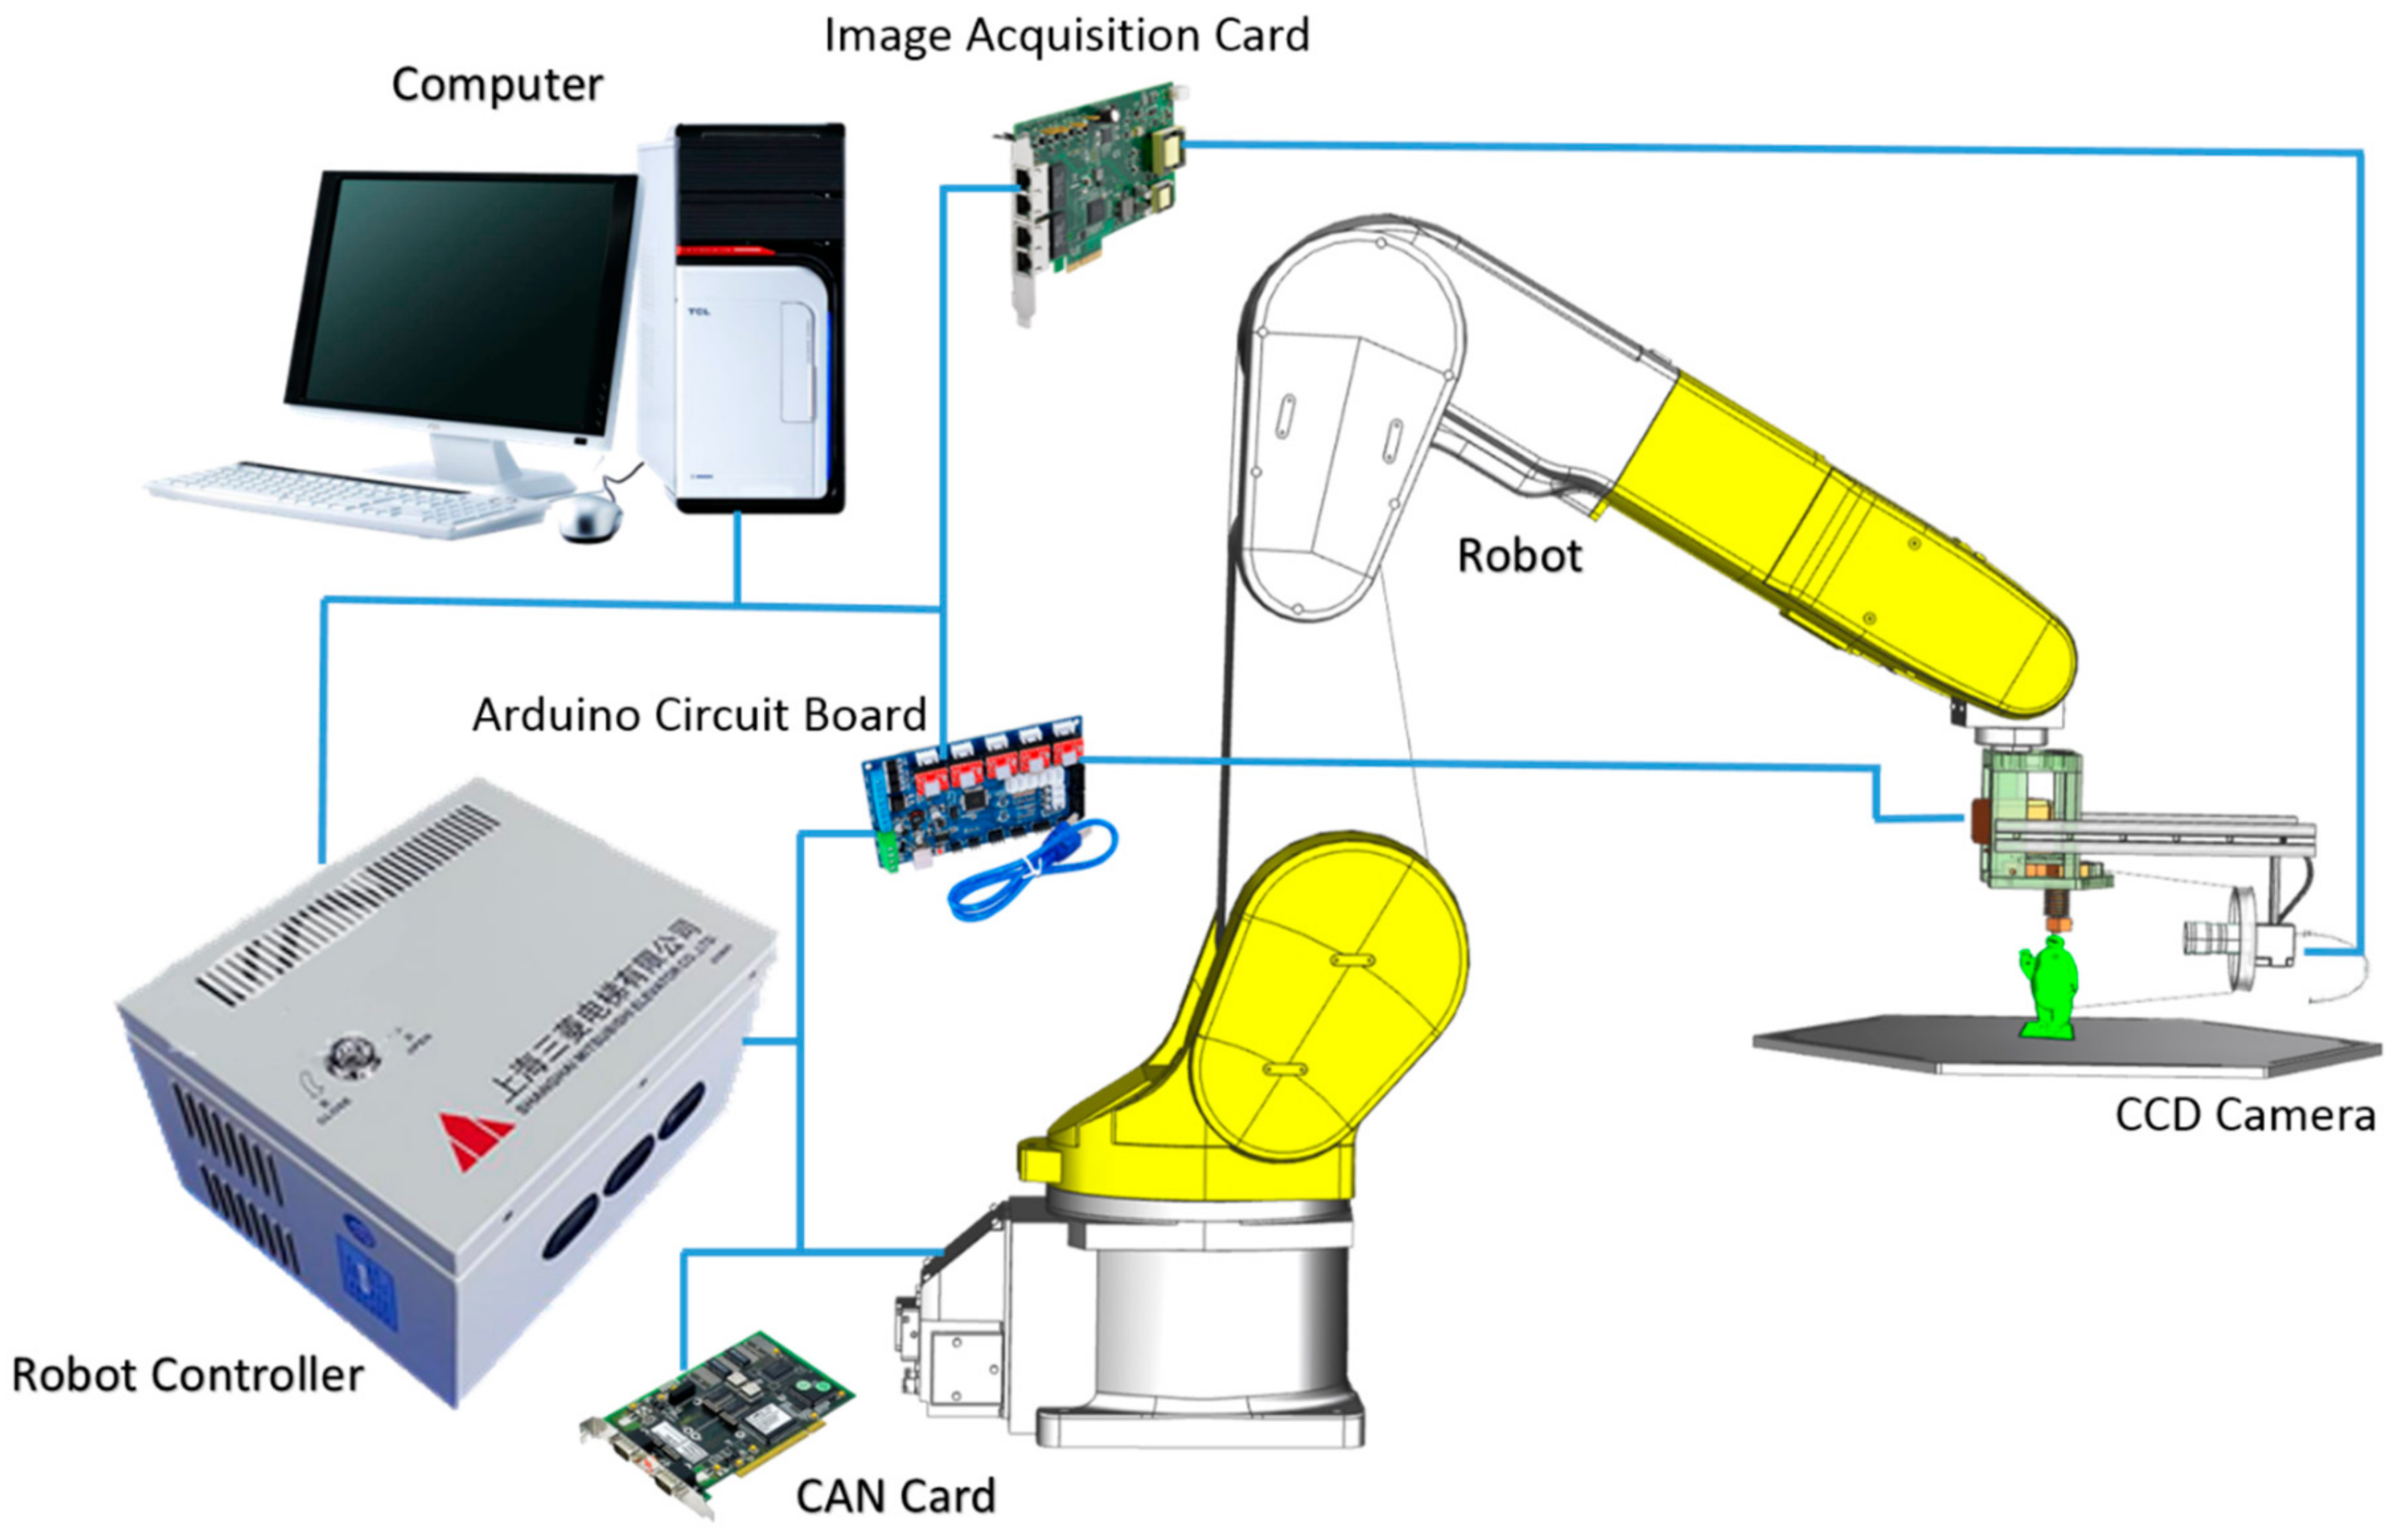
2. Methodology
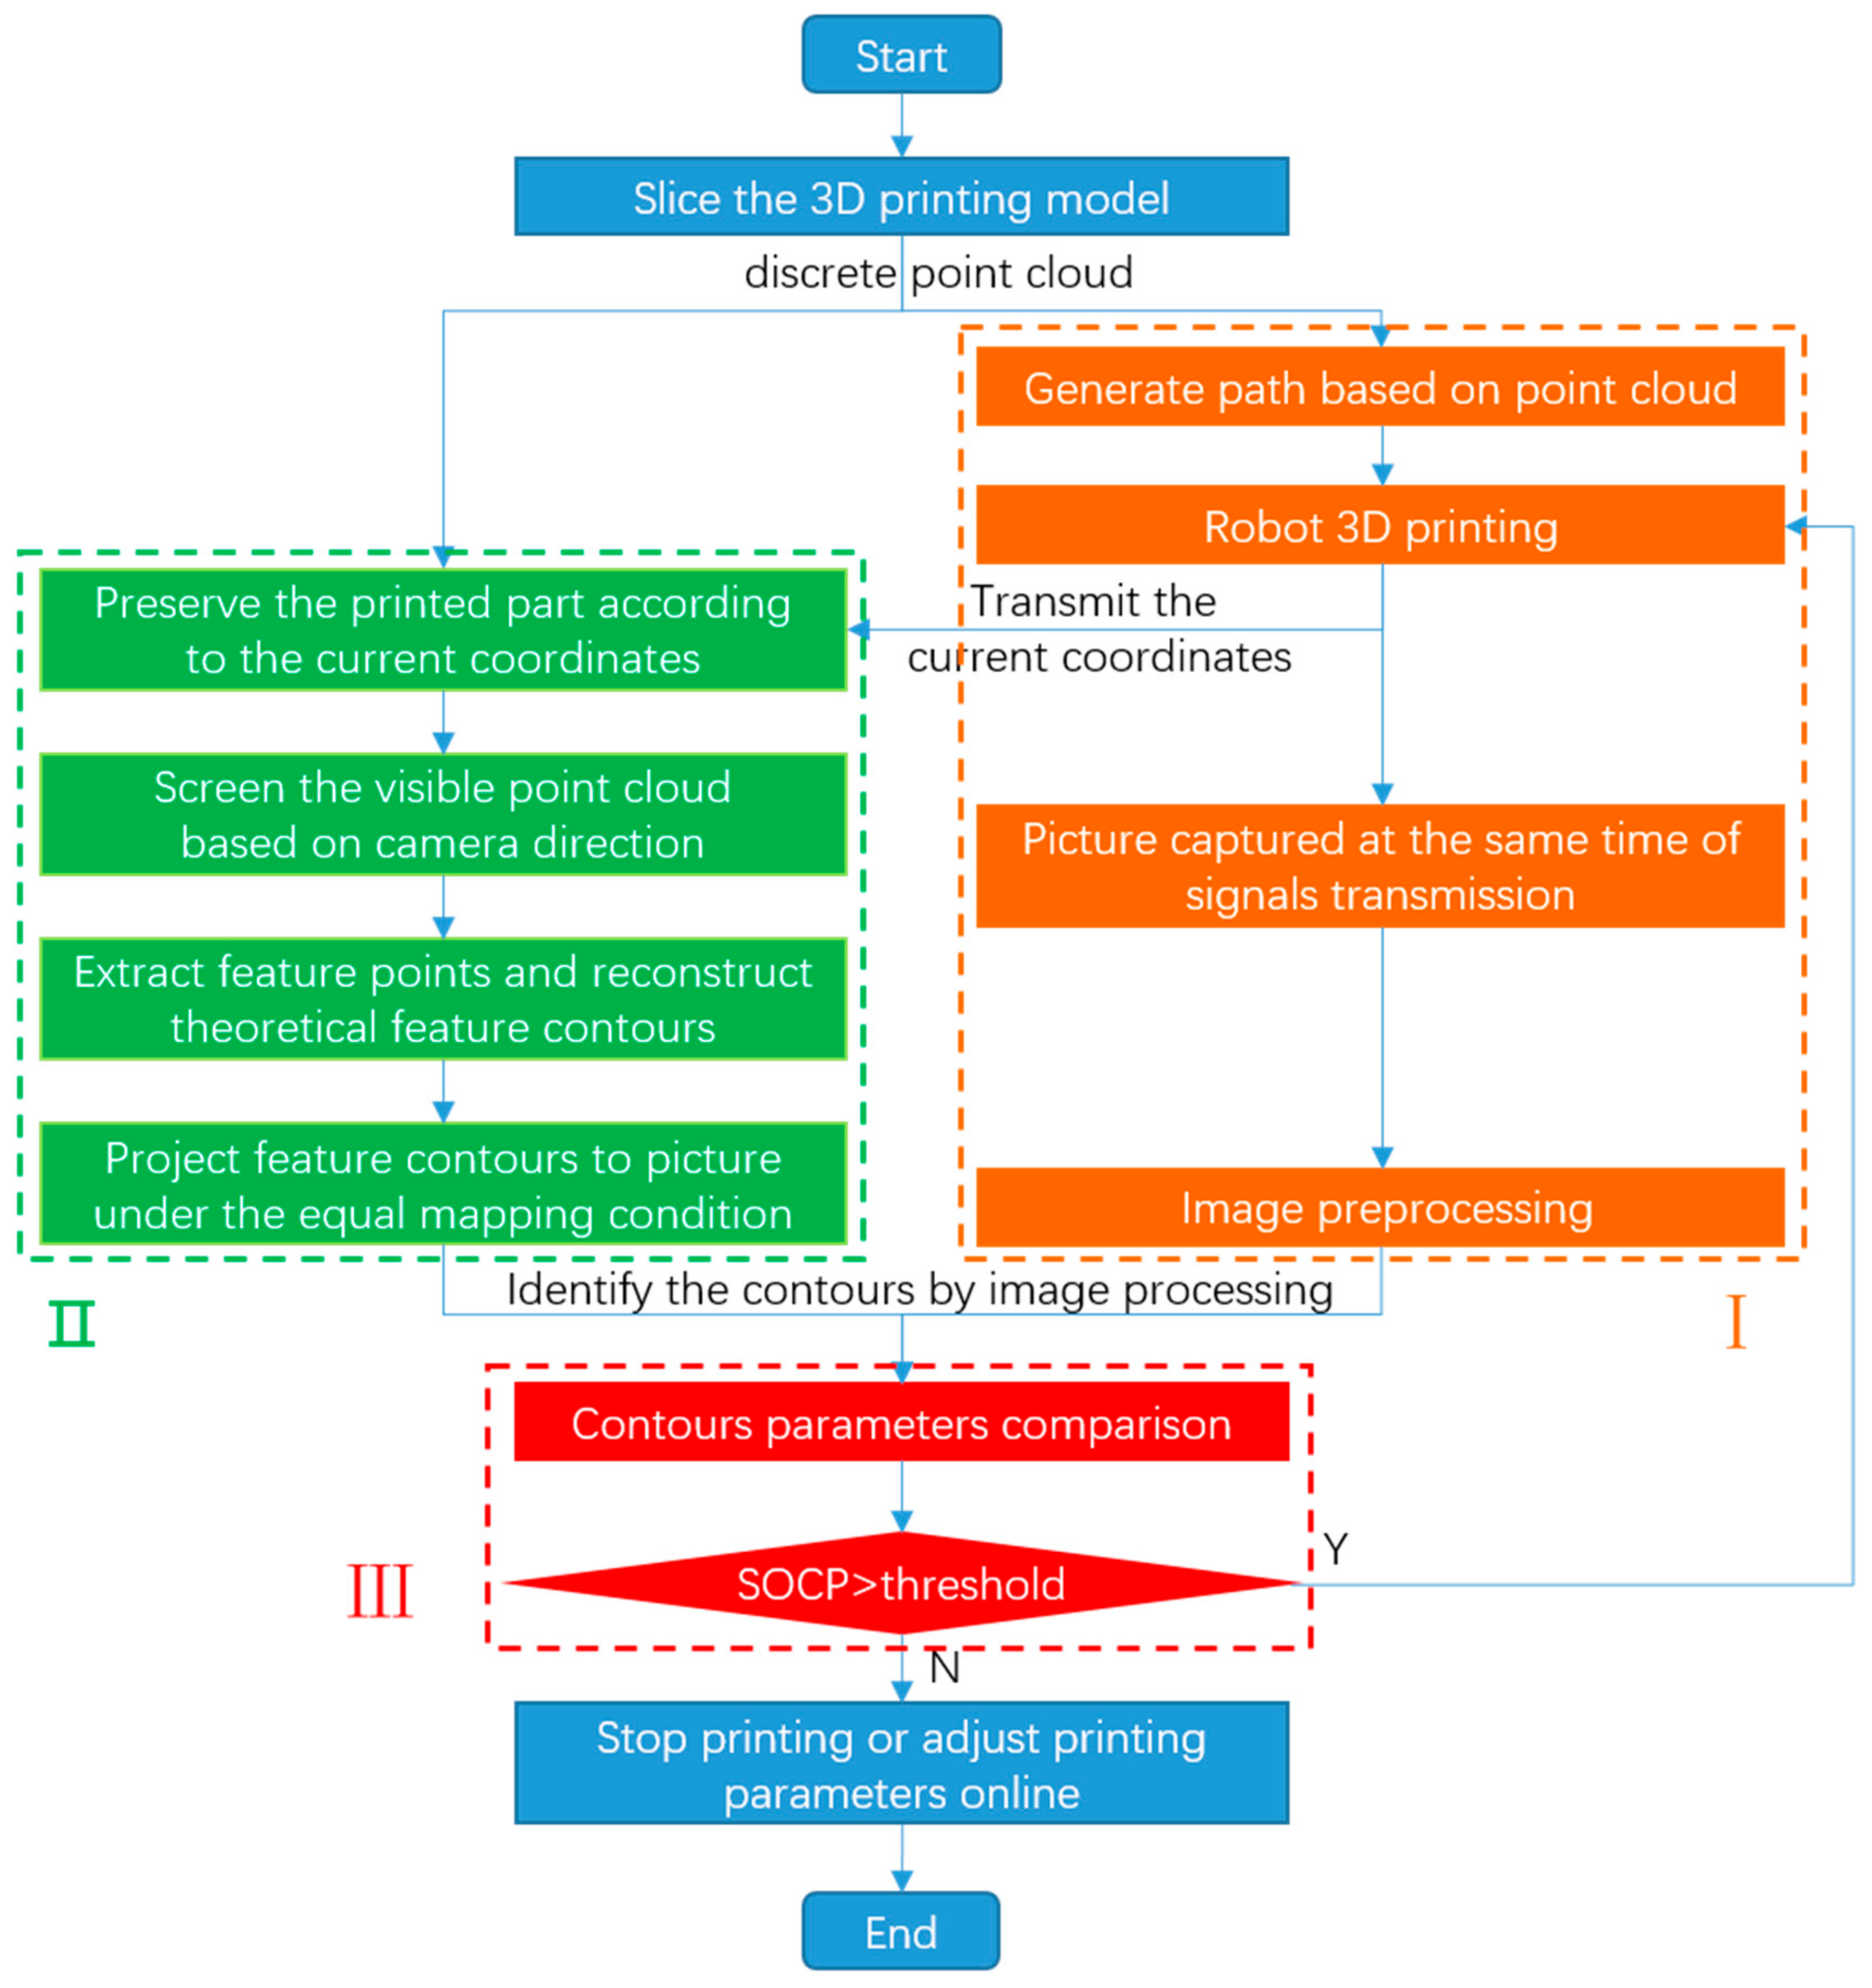
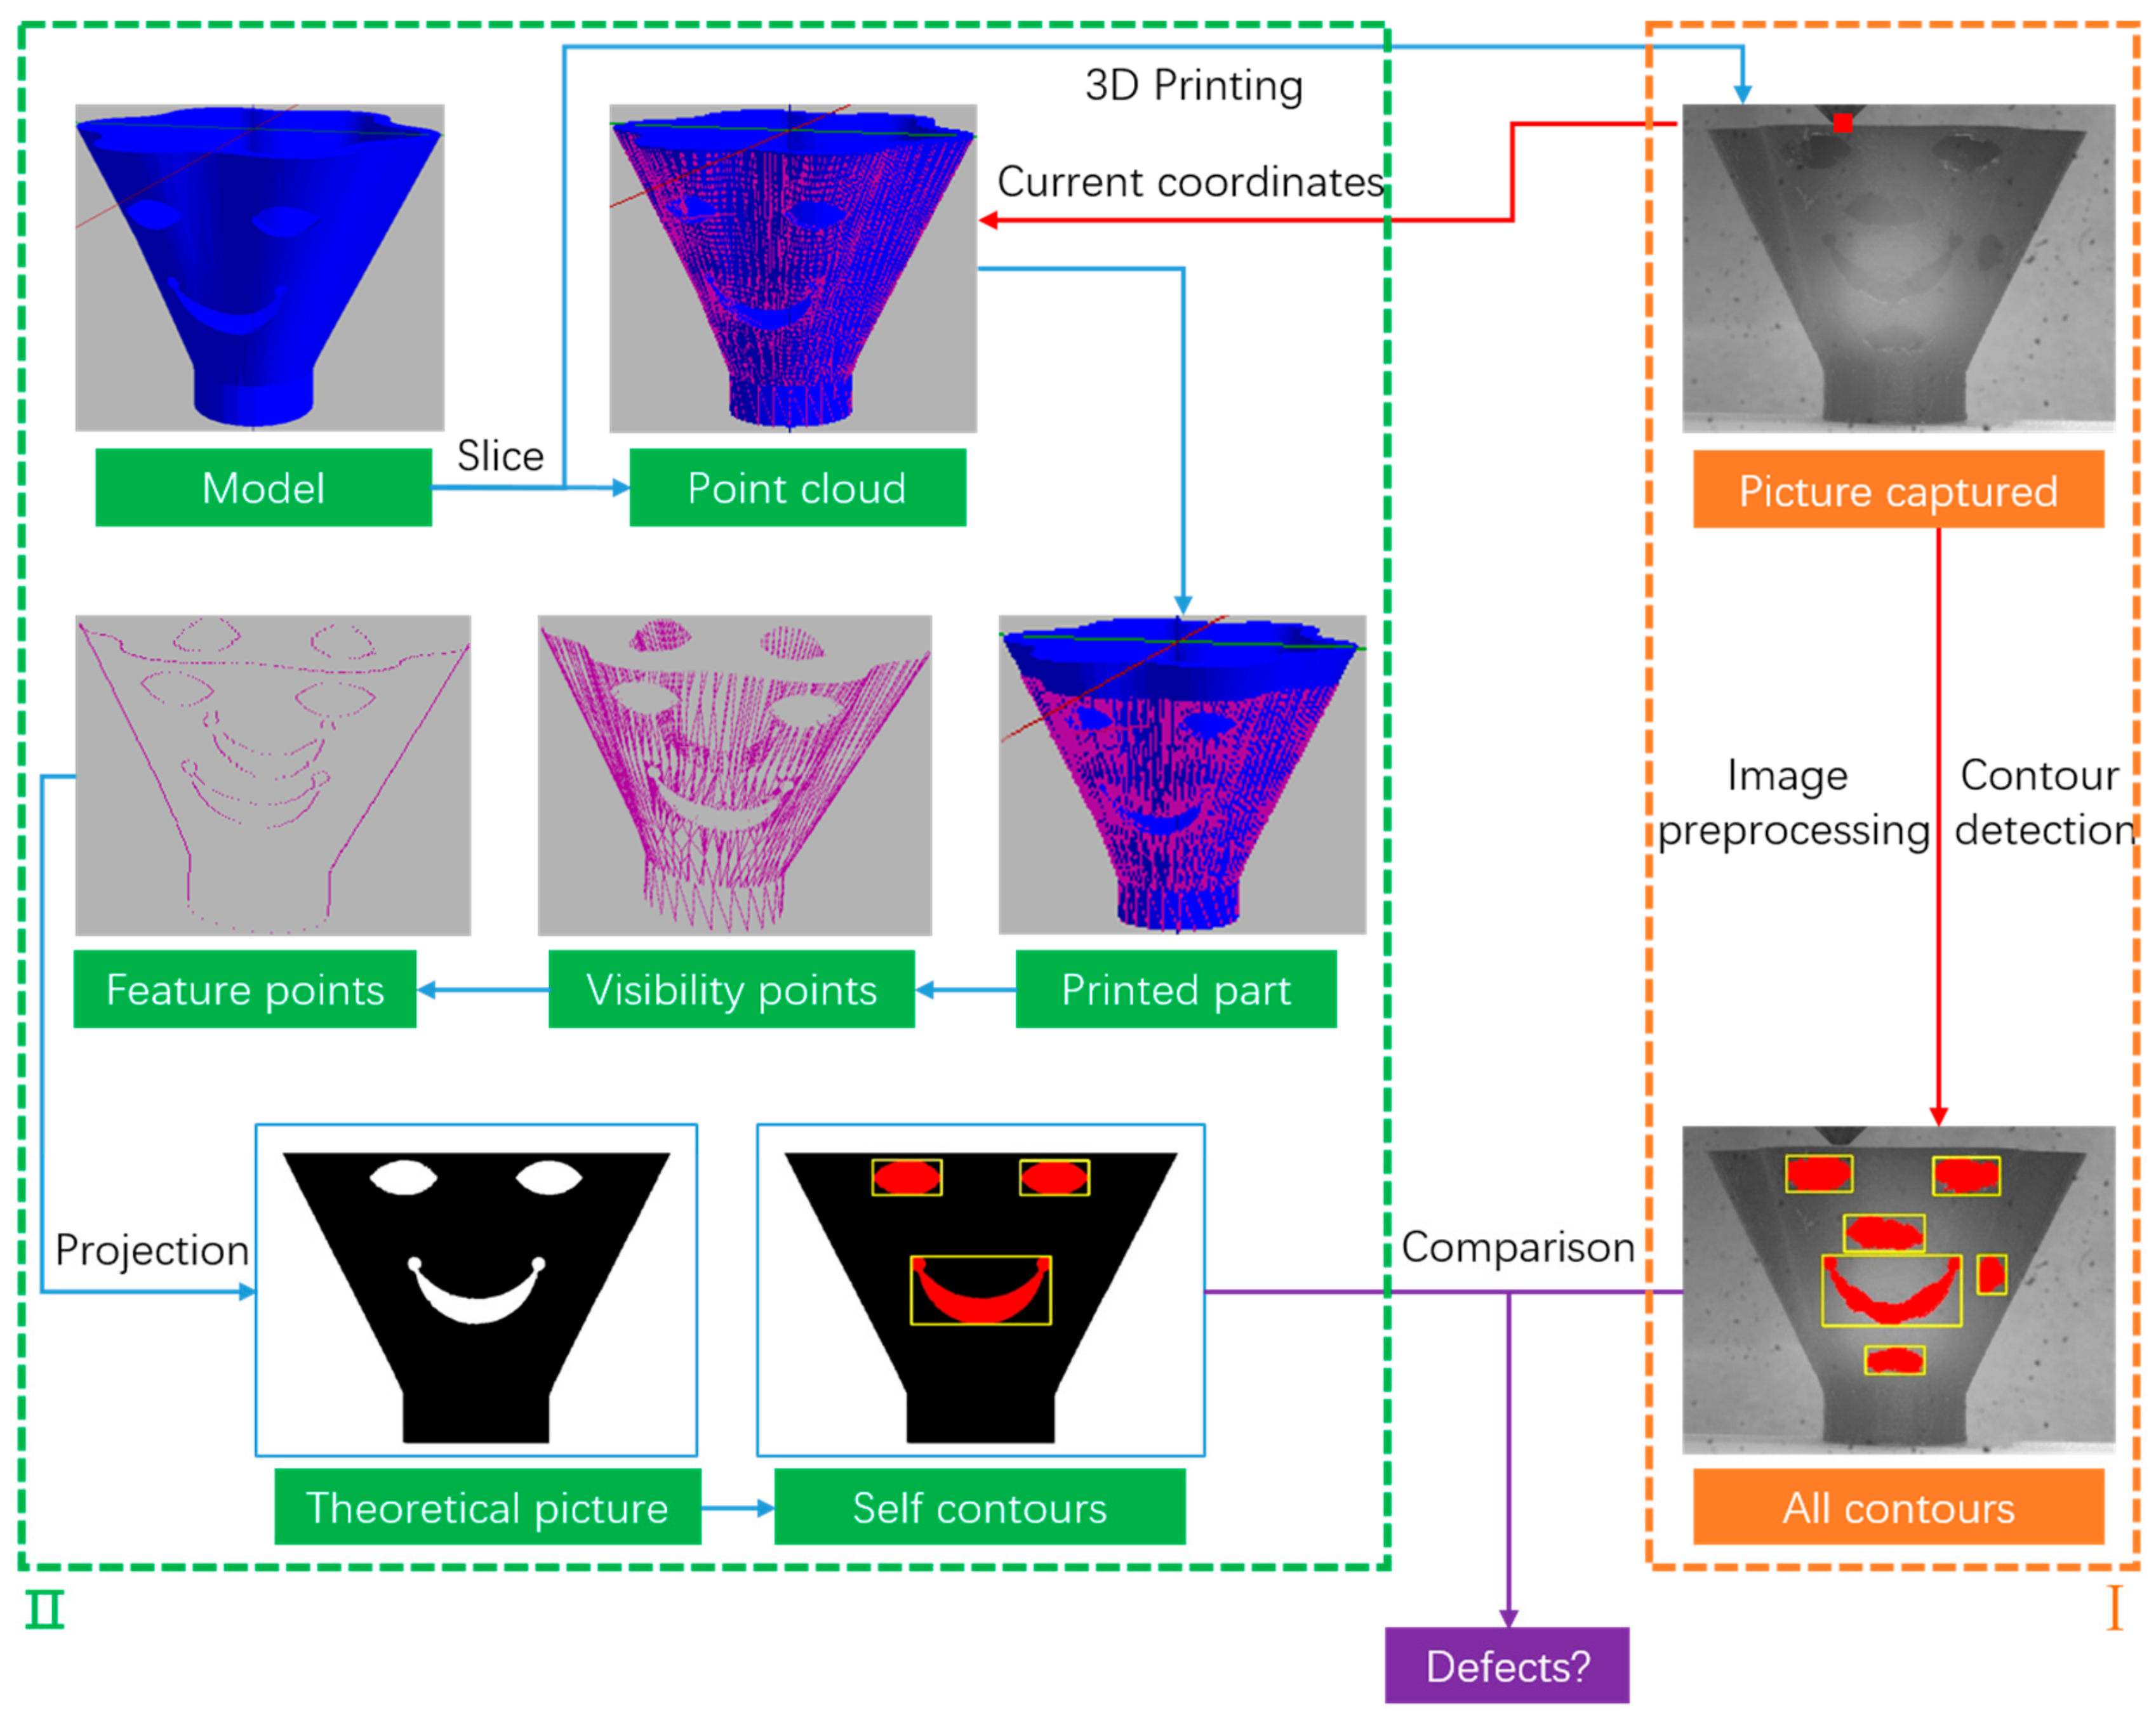
2.1. The Whole Process of Identifying Defects and Their Own Characteristics
- ①
- Generate the machining path and send G-code to robot;
- ②
- The robot receives instructions and starts printing. Then, at a certain interval, the host computer transmits the current coordinates to the theoretical model while sending acquisition instructions to the camera.
- ③
- The picture captured will be preprocessed by histogram equalization, Local Binary Patter (LBP), median filtering to be identified and processed easily by the computer.
- ①
- The printed part will be preserved according to the current coordinates, and the unprinted part will be ignored.
- ②
- According to the current camera direction, the visual point clouds are selected.
- ③
- Under established rules, feature points are extracted and theoretical contours are reconstructed.
- ④
- By calibrating the experimental platform, the mapping relationship between part and picture captured is obtained. Then the program projects the feature contours extracted above to the picture under the equal mapping condition.
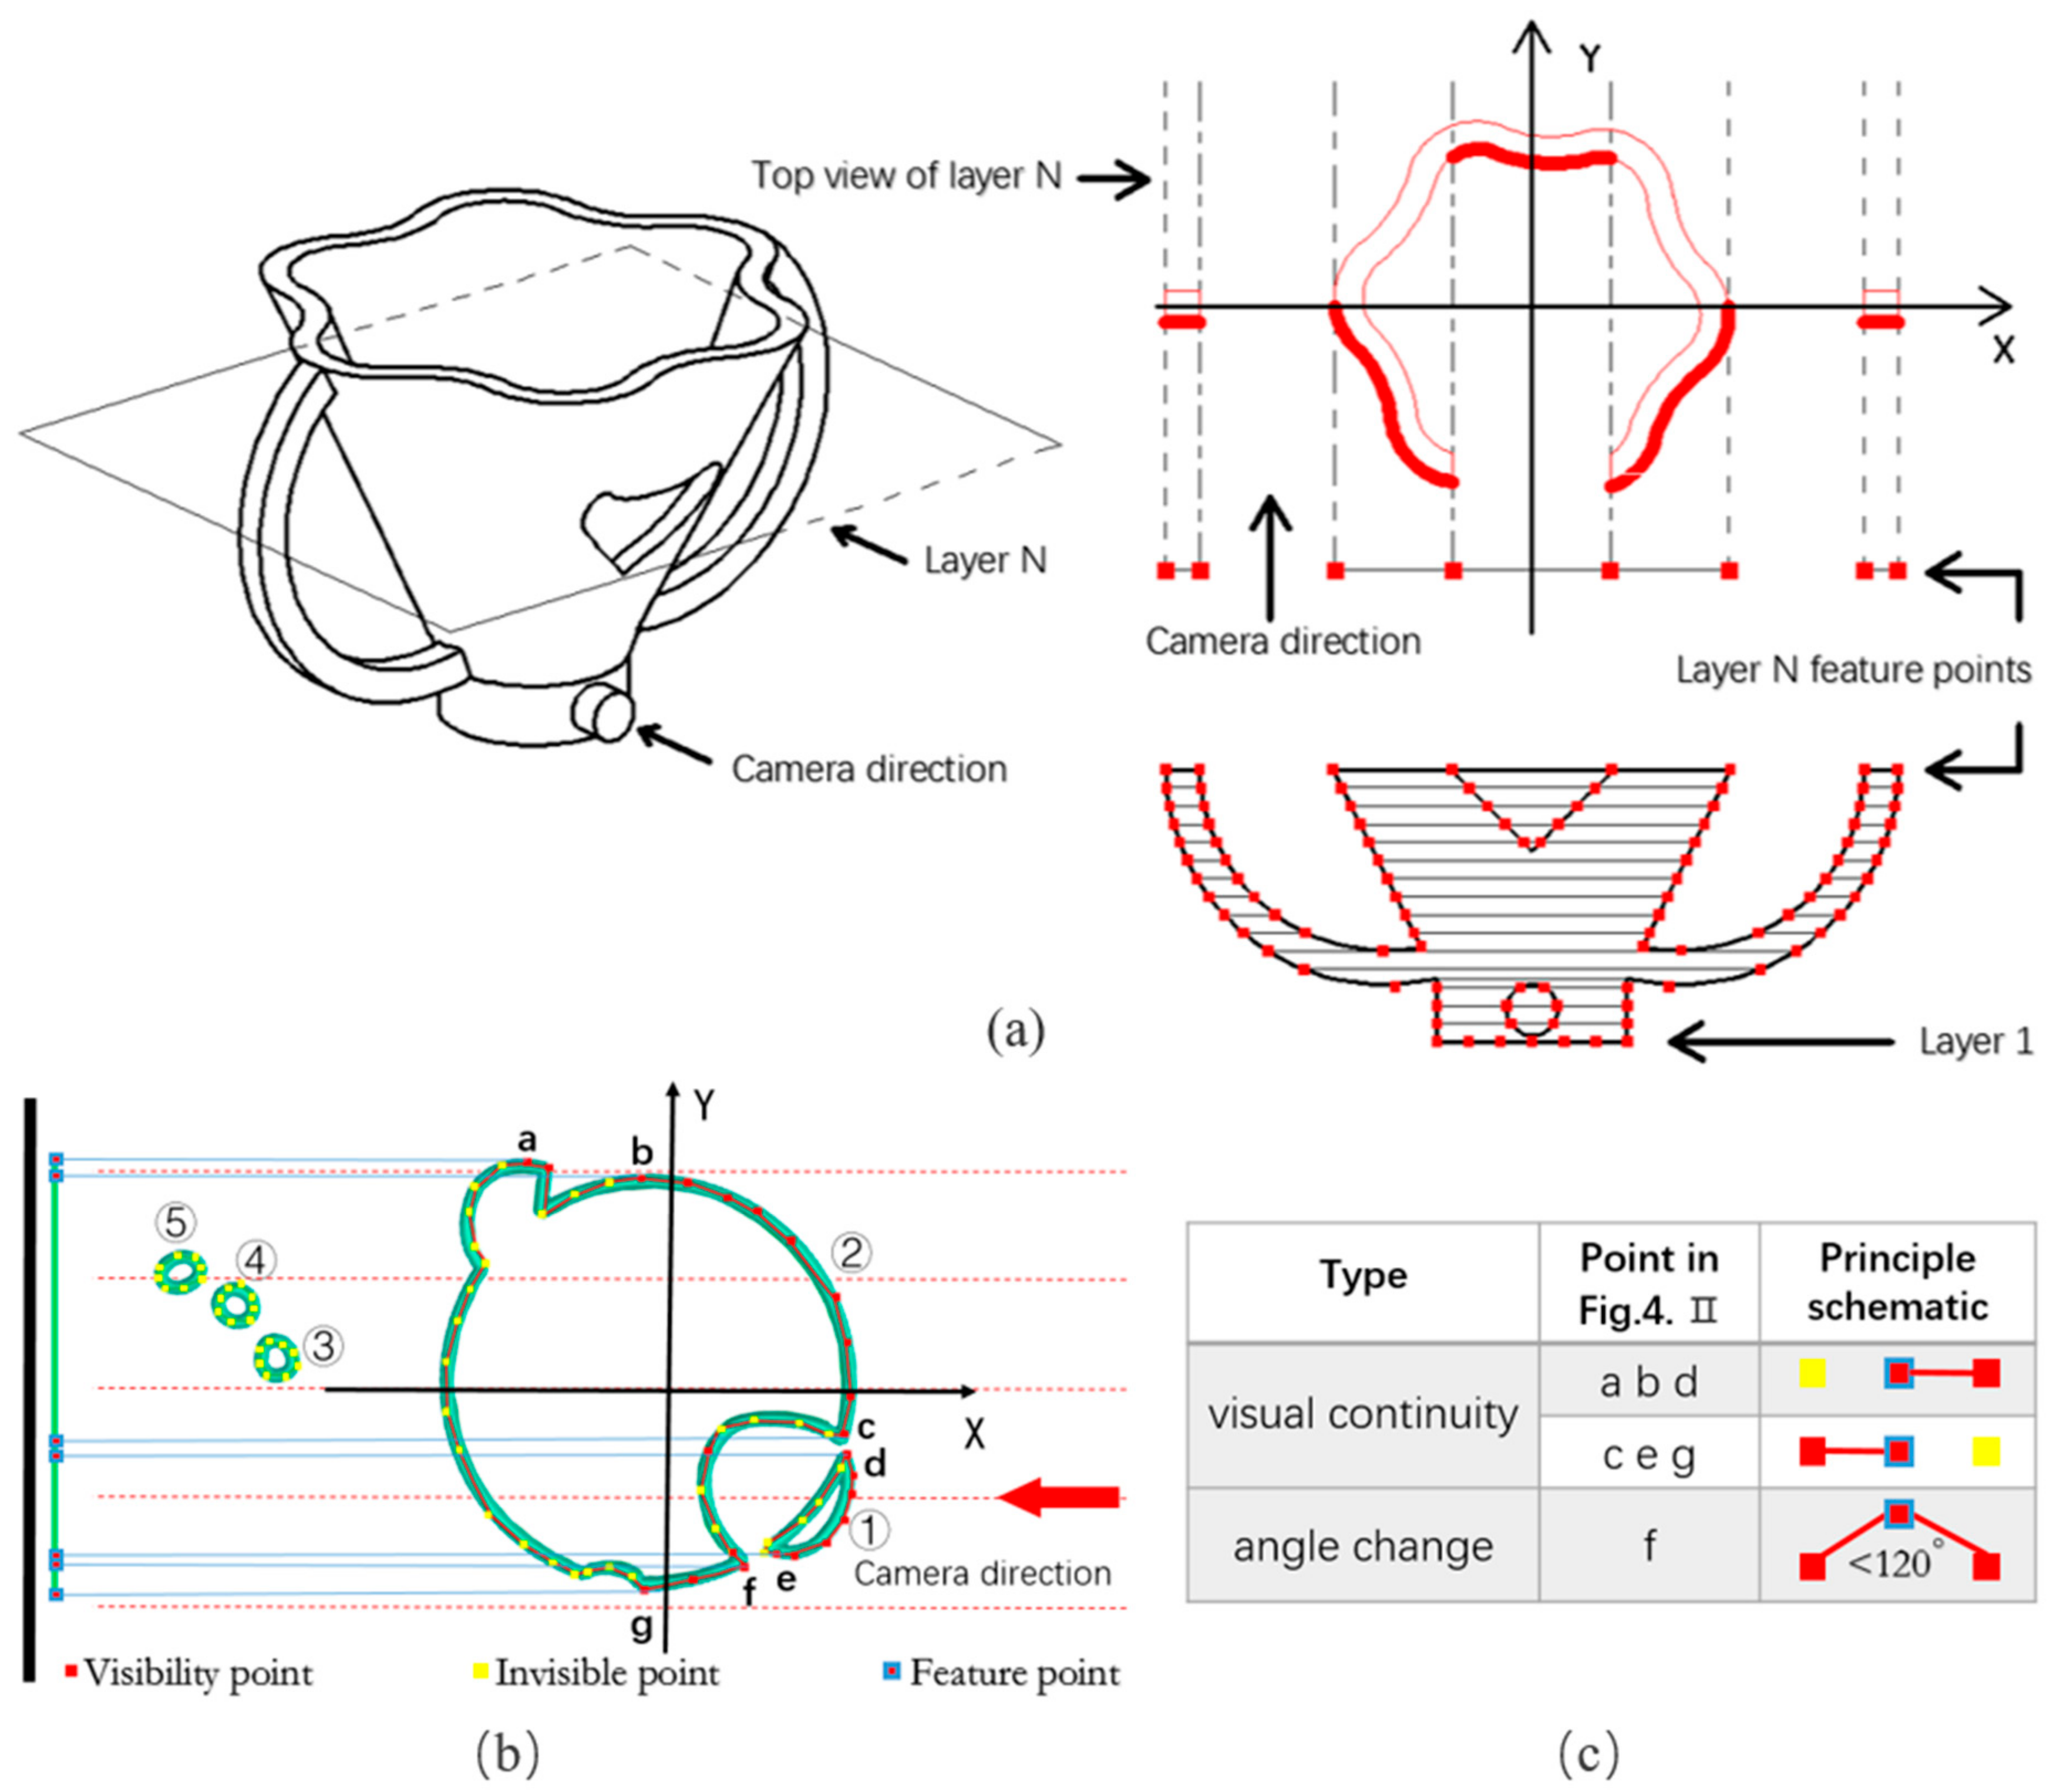
2.2. Self-Feature Extraction of Model Itself Based on the Location Relation of Point Cloud
- ①
- Adjust the coordinate system to take the camera direction as the y-axis
- ②
- Sort all visual points by y values and then travel through each visual point layer by layer.
- ③
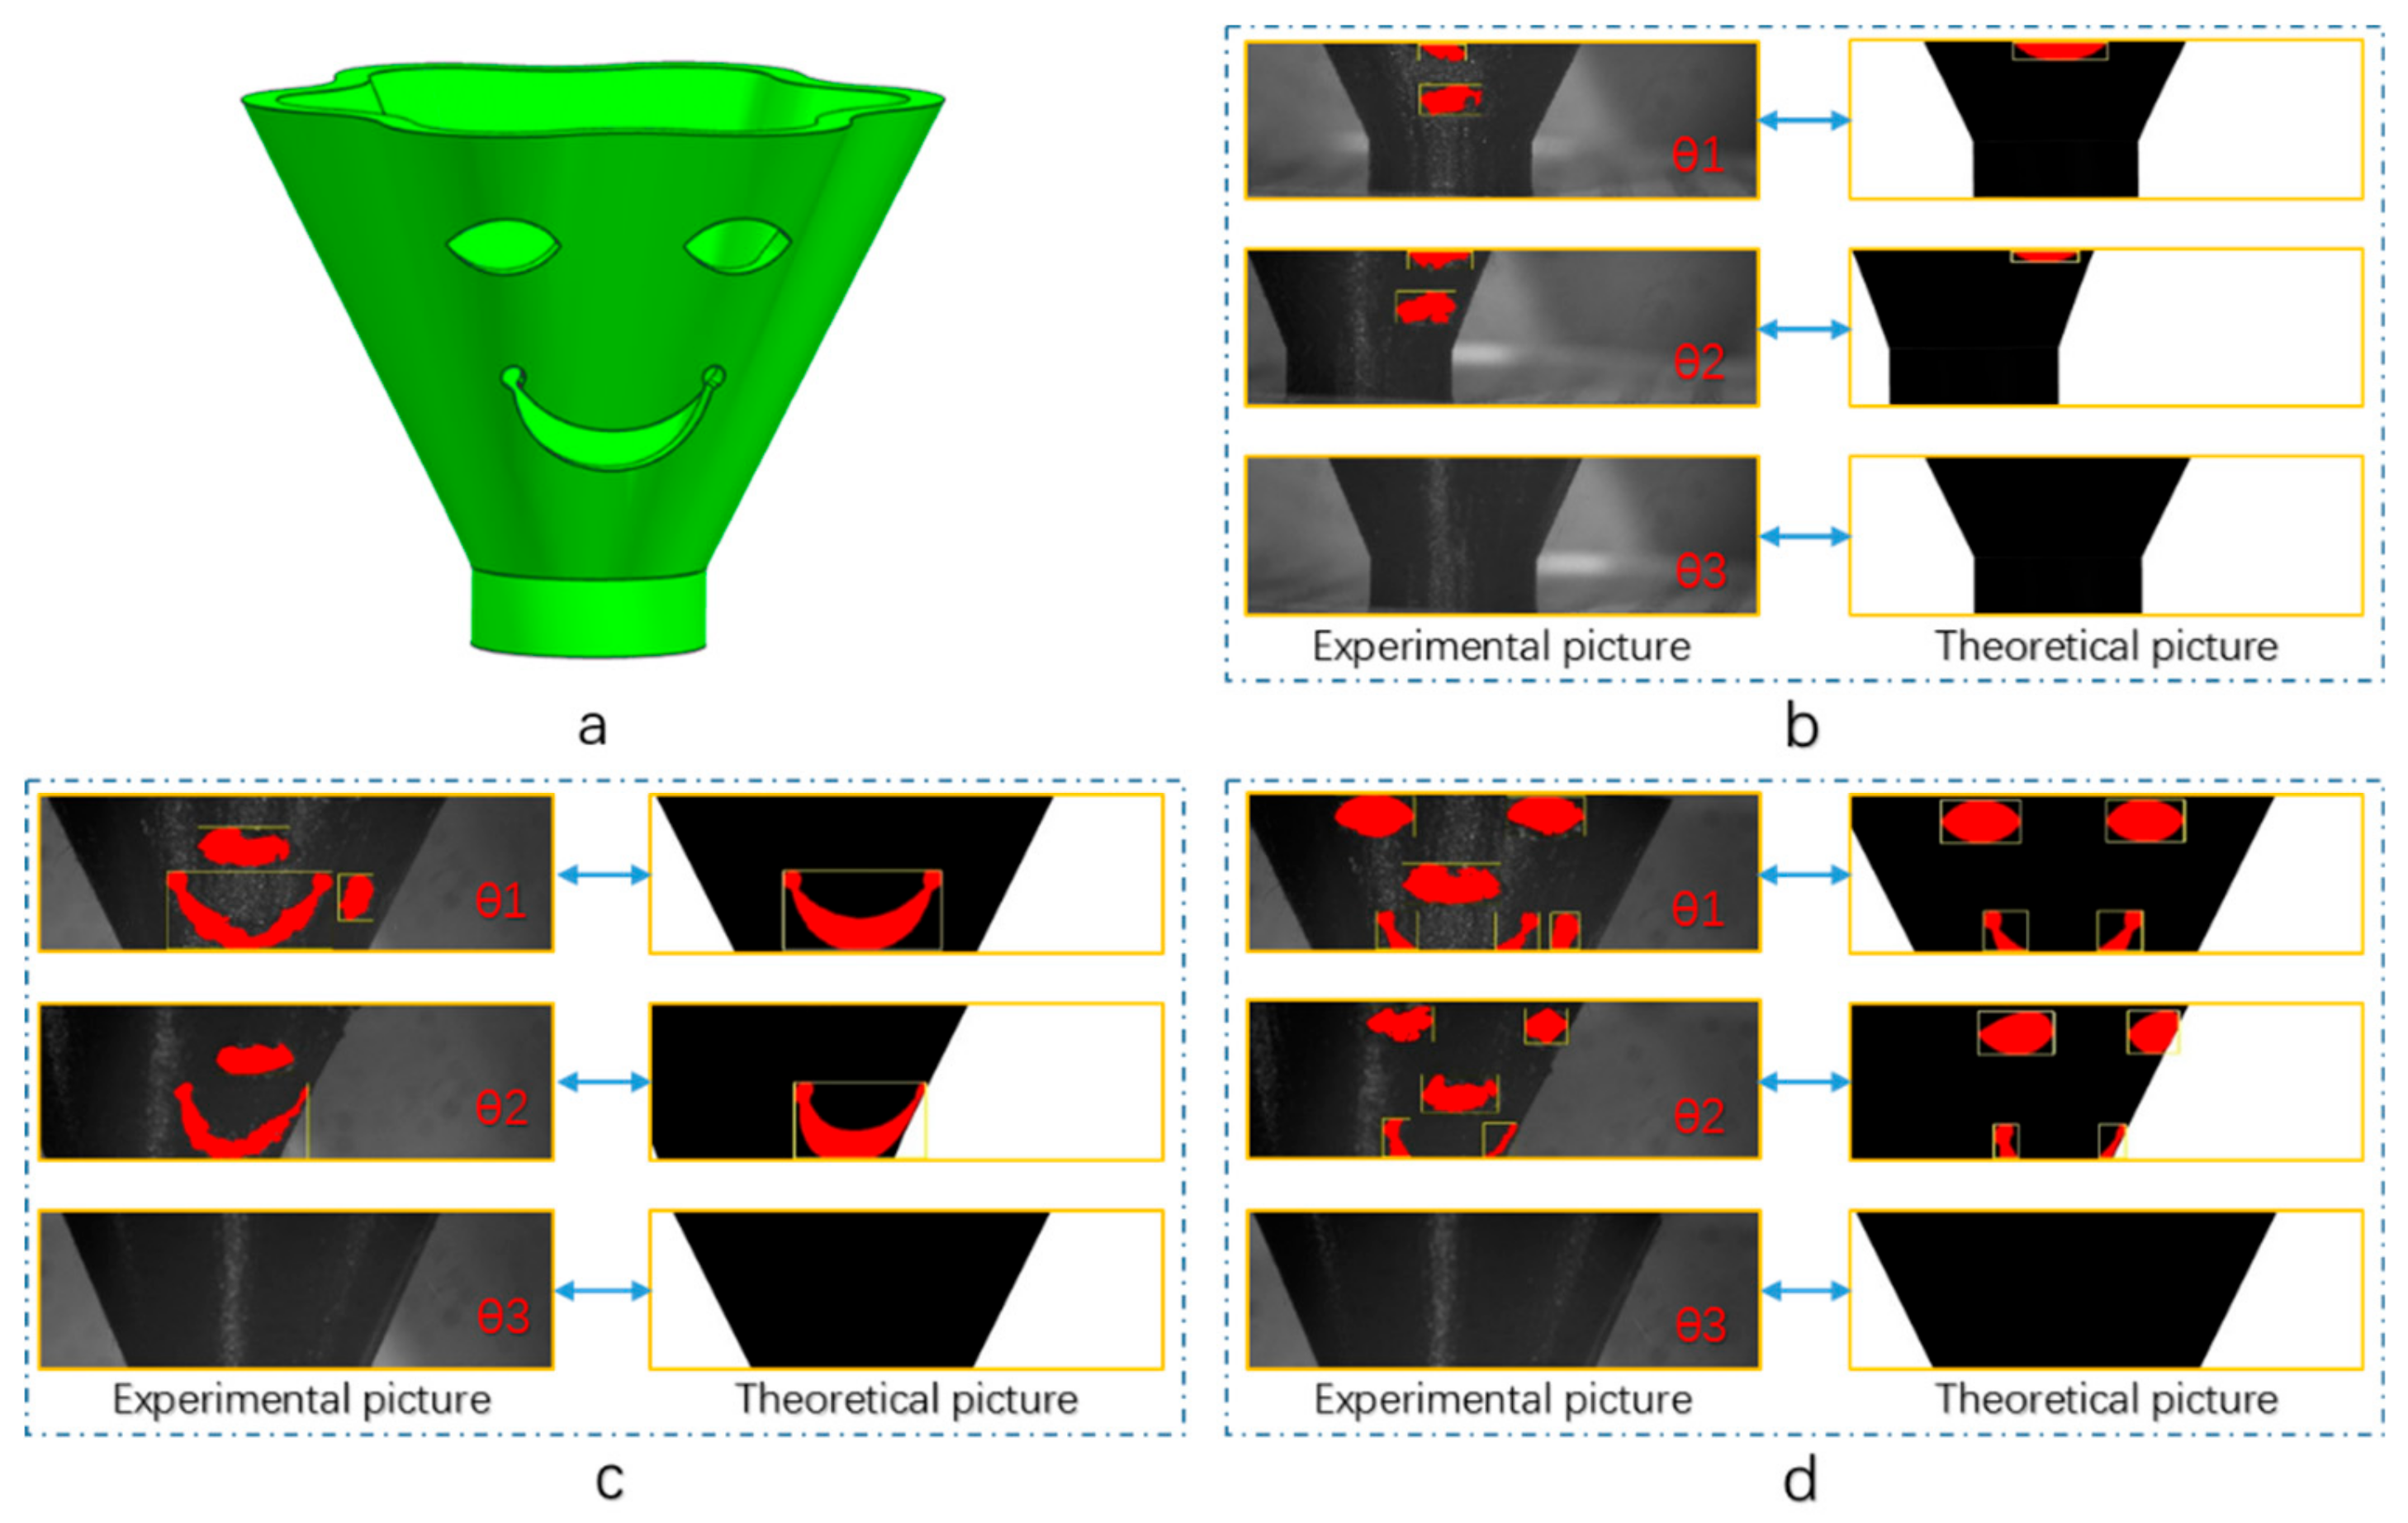
- Judge whether the point is a feature point by the three-point feature judgment method that is the analysis of visual continuity and angle change of three adjacent points in the same contour (as shown in Figure 4c).
3. Evaluation of Contour Similarity Based on Empirical Formula
4. Conclusions and Future Work
- (1)
- A visual detection system of surface defects based on self-feature comparison has been designed, where both path planning in 3-D printing and self-feature extraction are from discrete point clouds after model slicing.
- (2)
- A self-feature extraction method is introduced. The visual points of the printed part can be selected according to the current coordinates and camera direction. Then the feature points judged by the three-point feature judgment method are projected onto the theoretical pictures to achieve the self-feature pictures.
- (3)
- This paper presents an evaluation of contour similarity based on empirical formula based on the contour parameters detected by image processing technology.
Author Contributions
Funding
Acknowledgments
Conflicts of Interest
References
- Galantucci, L.M.; Lavecchia, F.; Percoco, G. Study of compression properties of topologically optimized FDM made structured parts. CIRP Ann. Manuf. Technol. 2008, 57, 243–246. [Google Scholar] [CrossRef]
- Dudek, P. FDM 3D printing technology in manufacturing composite elements. Arch. Metall. Mater. 2013, 58, 1415–1418. [Google Scholar] [CrossRef]
- Novakova-Marcincinova, L.; Novak-Marcincin, J.; Barna, J.; Torok, J. Special materials used in FDM rapid prototyping technology application. In Proceedings of the IEEE International Conference on Intelligent Engineering Systems, Lisbon, Portugal, 13–15 June 2012; pp. 73–76. [Google Scholar]
- Chua, C.K.; Leong, K.F. 3D Printing and Additive Manufacturing: Principles and Applications (with Companion Media Pack) Fourth Edition of Rapid Prototyping, 4th ed.; World Scientific Publishing Company: Singapore, 2014. [Google Scholar]
- Bochmann, L.; Bayley, C.; Hel, M.; Transchel, R.; Wegener, K.; Dornfeld, D. Understanding error generation in fused deposition modeling. Surf. Topogr. 2015, 3, 014002. [Google Scholar] [CrossRef]
- Anitha, R.; Arunachalam, S.; Radhakrishnan, P. Critical parameters influencing the quality of prototypes in fused deposition modelling. J. Mater. Process. Technol. 2001, 118, 385–388. [Google Scholar] [CrossRef]
- Lin, W.; Shen, H.; Fu, J.; Wu, S. Online quality monitoring in material extrusion additive manufacturing processes based on laser scanning technology. Precis. Eng. 2019, 60, 76–84. [Google Scholar] [CrossRef]
- Liu, Z.; Wu, S.; Wu, Q.; Quan, C.; Ren, Y. A Novel Stereo Vision Measurement System Using Both Line Scan Camera and Frame Camera. IEEE Trans. Instrum. Meas. 2019, 68, 3563–3575. [Google Scholar] [CrossRef]
- Ren, M.; Wang, X.; Xiao, G.; Chen, M.; Fu, L. Fast Defect Inspection Based on Data-Driven Photometric Stereo. IEEE Trans. Instrum. Meas. 2019, 68, 1148–1156. [Google Scholar] [CrossRef]
- Chang, F.; Liu, M.; Dong, M.; Duan, Y. A mobile vision inspection system for tiny defect detection of smooth car-body surface based on deep ensemble learning. Meas. Sci. Technol. 2019, 30, 125905. [Google Scholar] [CrossRef]
- Tabernik, D.; Šela, S.; Skvarč, J.; Skočaj, D. Segmentation-based deep-learning approach for surface-defect detection. J. Intell. Manuf. 2019. [Google Scholar] [CrossRef] [Green Version]
- Villalba-Diez, J.; Schmidt, D.; Gevers, R.; Ordieres-Meré, J.; Buchwitz, M.; Wellbrock, W. Deep Learning for Industrial Computer Vision Quality Control in the Printing Industry 4.0. Sensors 2019, 19, 3987. [Google Scholar] [CrossRef] [PubMed] [Green Version]
- Zhang, D.; Song, K.; Xu, J.; He, Y.; Yan, Y. Unified detection method of aluminium profile surface defects: Common and rare defect categories. Opt. Lasers Eng. 2020, 126, 105936. [Google Scholar] [CrossRef]
- Du, W.; Shen, H.; Fu, J.; Zhang, G.; He, Q. Approaches for improvement of the X-ray image defect detection of automobile casting aluminum parts based on deep learning. NDT E Int. 2019, 107, 102144. [Google Scholar] [CrossRef]
- Zhou, Q.; Chen, R.; Huang, B.; Liu, C.; Yu, J.; Yu, X. An Automatic Surface Defect Inspection System for Automobiles Using Machine Vision Methods. Sensors 2019, 19, 644. [Google Scholar] [CrossRef] [PubMed] [Green Version]
- Wang, Z.; Zhu, D. An accurate detection method for surface defects of complex components based on support vector machine and spreading algorithm. Measurement 2019, 147, 106886. [Google Scholar] [CrossRef]
- Abul’khanov, S.R.; Kazanskiy, N.L. Information Pattern in Imaging of a Rough Surface. IOP Conf. Ser. Mater. Sci. Eng. 2018, 302, 012068. [Google Scholar] [CrossRef]
- Chervyakov, N.I.; Lyakhov, P.A.; Orazaev, A.R. Two methods of adaptive median filtering of impulse noise in images. Comput. Opt. 2018, 42, 667–678. [Google Scholar] [CrossRef]
- Shen, H.; Sun, W.; Fu, J. Multi-view online vision detection based on robot fused deposit modeling 3D printing technology. Rapid Prototyp. J. 2018, 25, 343–355. [Google Scholar] [CrossRef]


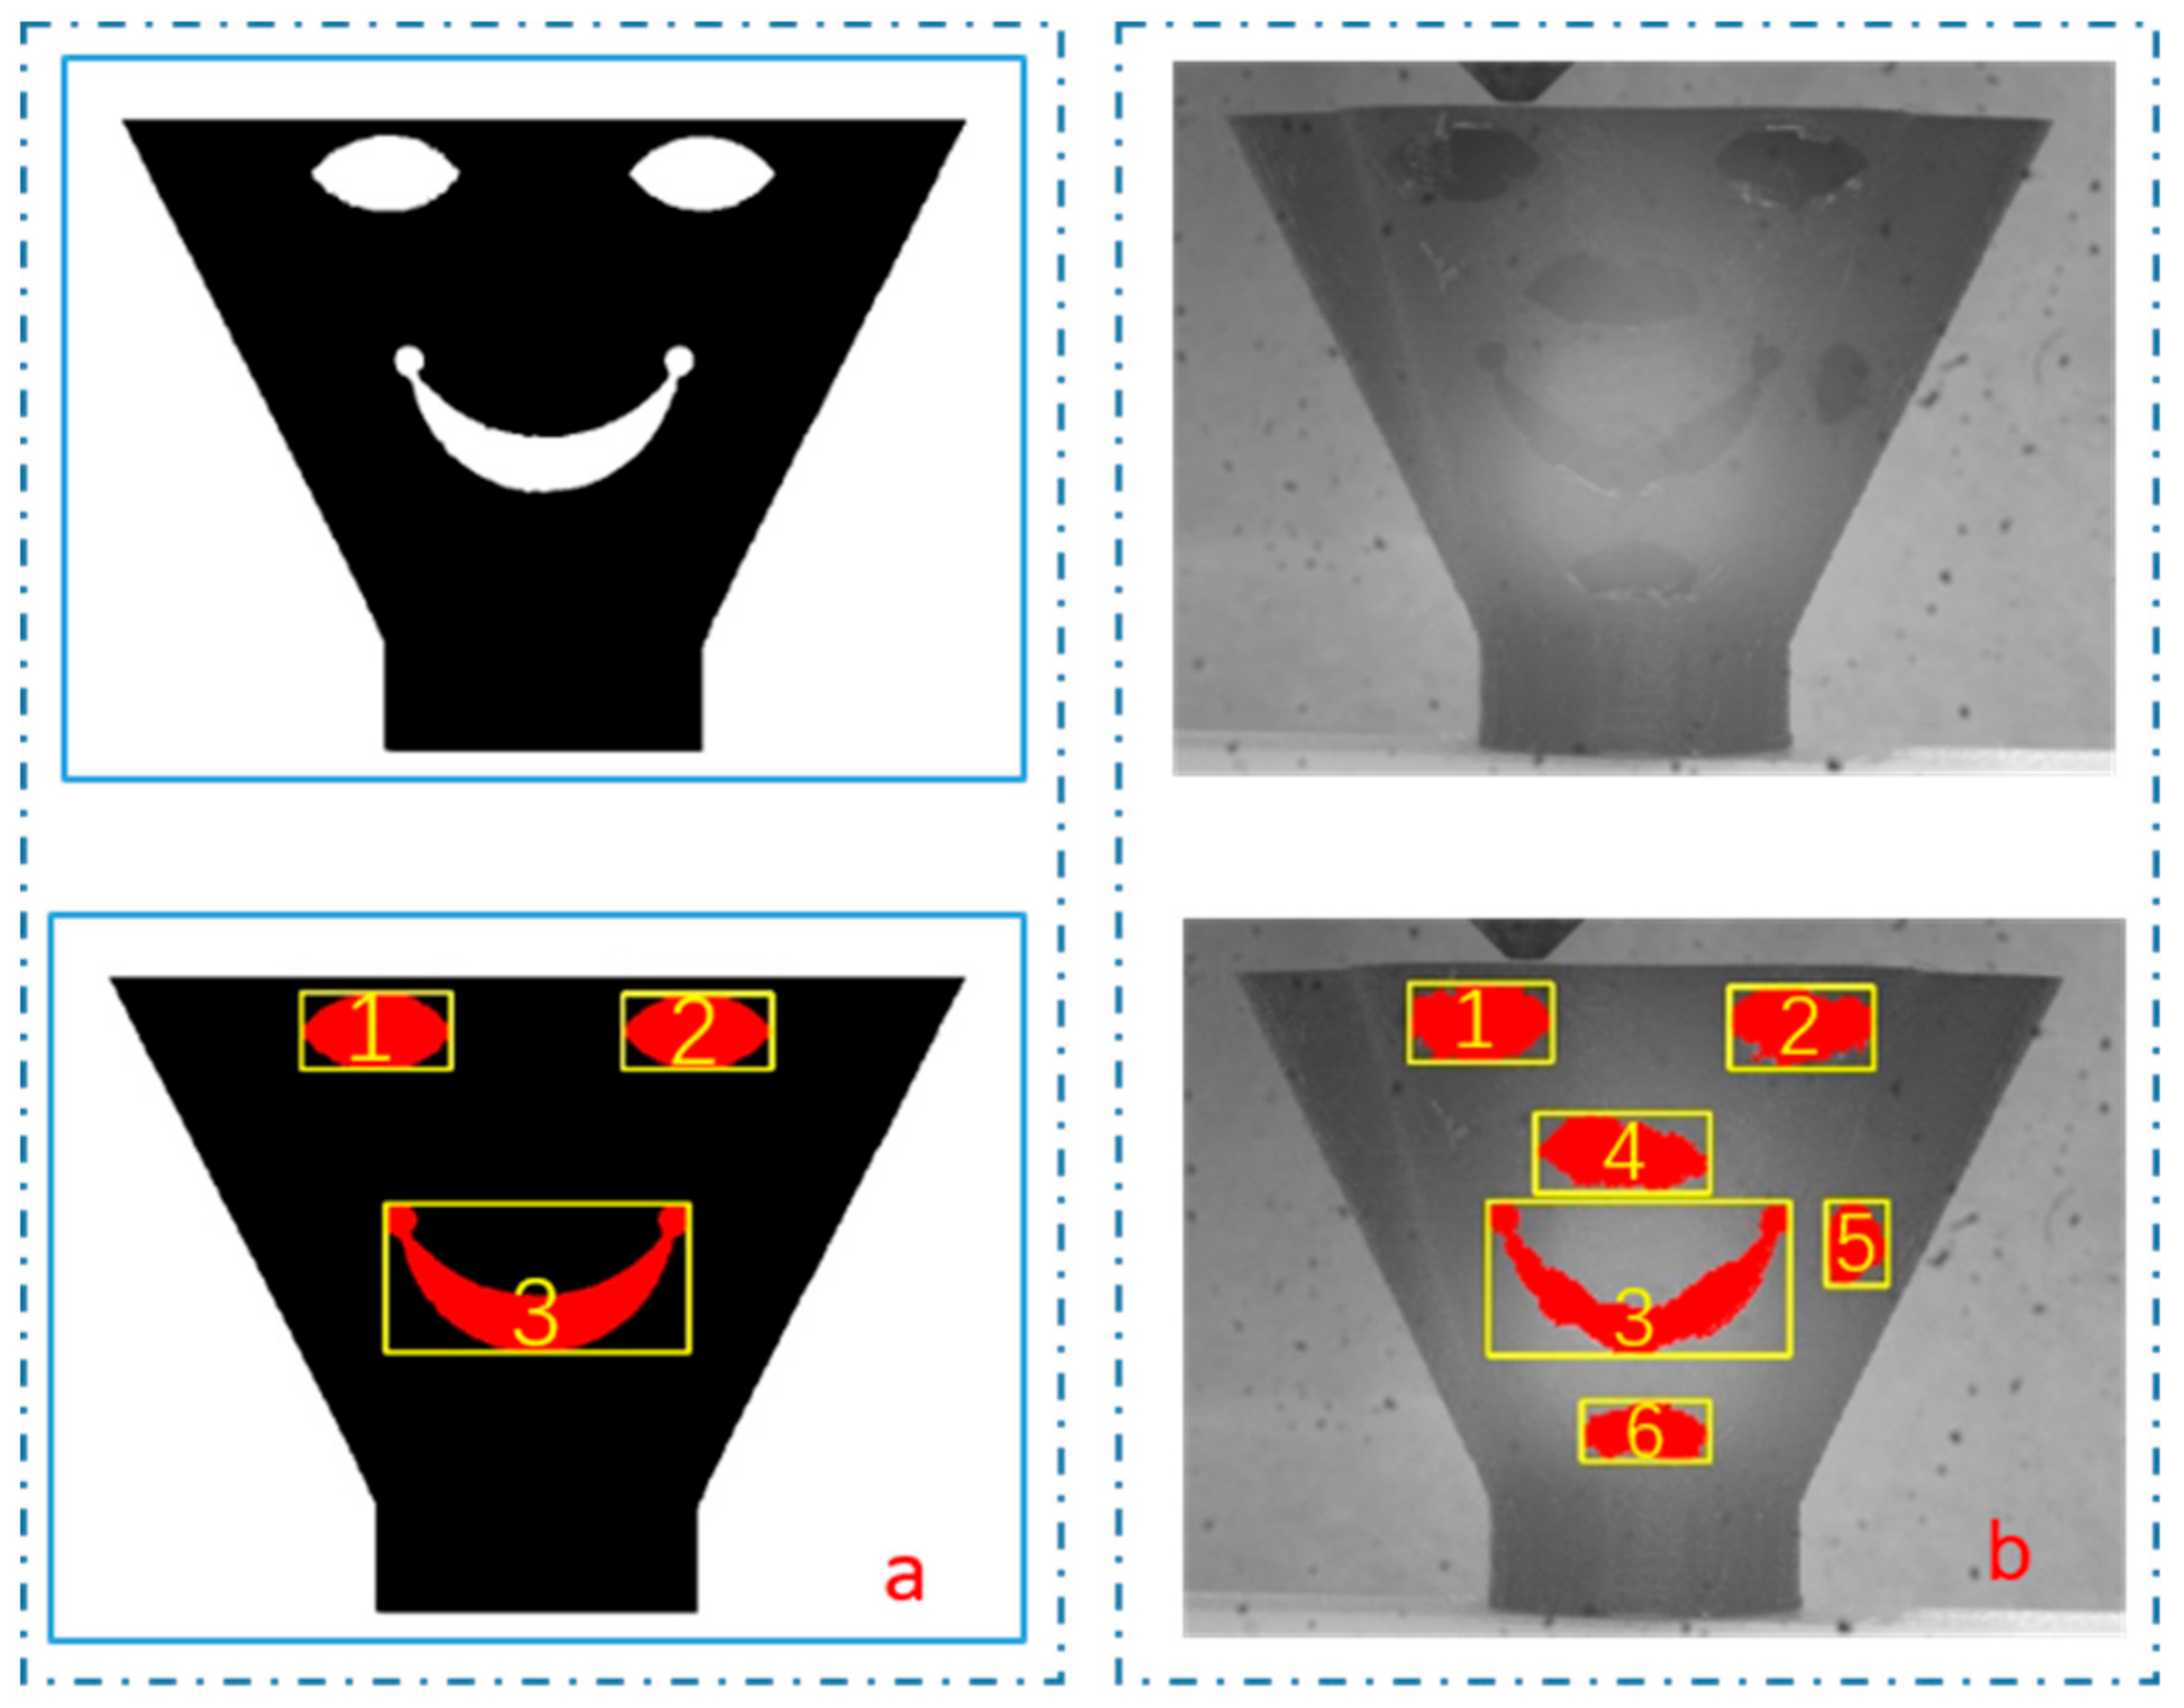
| Rectangle/Contour | Center Coordinates | Width | Height | Aspect Ratio Width to Height | Contour Area (Statistical Value of the Interior Red Pixels) |
|---|---|---|---|---|---|
| No. 1 | (543, 189) | 253 | 139 | 1.820 | 23,496 |
| No. 2 | (1084, 190) | 252 | 127 | 1.984 | 22,374 |
| No. 3 | (814, 604) | 512 | 251 | 2.040 | 41,760 |
| Rectangle/Contour | Center Coordinates | Width | Height | Aspect Ratio Width to Height | Contour Area (Statistical Value of the Interior Red Pixels) |
|---|---|---|---|---|---|
| No. 1 | (514, 180) | 247 | 135 | 1.830 | 24,109 |
| No. 2 | (1067, 189) | 249 | 143 | 1.741 | 23,177 |
| No. 3 | (786, 619) | 522 | 266 | 1.962 | 39,168 |
| No. 4 | (758, 404) | 302 | 139 | 2.173 | 25,243 |
| No. 5 | (1162, 559) | 106 | 147 | 0.721 | 10,068 |
| No. 6 | (798, 882) | 221 | 105 | 2.105 | 15,249 |
| SOCP | 1 | 2 | 3 | 4 | 5 | 6 |
|---|---|---|---|---|---|---|
| a | 83.9% | −163.7% | −151.2% | −74.0% | −290.7% | −283.8% |
| b | −189.5% | 86.8% | −164.9% | −114.1% | −120.5% | −285.7% |
| c | −175.5% | −160.8% | 71.1% | −28.4% | −96.7% | −59.2% |
© 2019 by the authors. Licensee MDPI, Basel, Switzerland. This article is an open access article distributed under the terms and conditions of the Creative Commons Attribution (CC BY) license (http://creativecommons.org/licenses/by/4.0/).
Share and Cite
Shen, H.; Du, W.; Sun, W.; Xu, Y.; Fu, J. Visual Detection of Surface Defects Based on Self-Feature Comparison in Robot 3-D Printing. Appl. Sci. 2020, 10, 235. https://doi.org/10.3390/app10010235
Shen H, Du W, Sun W, Xu Y, Fu J. Visual Detection of Surface Defects Based on Self-Feature Comparison in Robot 3-D Printing. Applied Sciences. 2020; 10(1):235. https://doi.org/10.3390/app10010235
Chicago/Turabian StyleShen, Hongyao, Wangzhe Du, Weijun Sun, Yuetong Xu, and Jianzhong Fu. 2020. "Visual Detection of Surface Defects Based on Self-Feature Comparison in Robot 3-D Printing" Applied Sciences 10, no. 1: 235. https://doi.org/10.3390/app10010235