Article

Wind-Load Response and Evacuation Efficiency Analysis of Marine Evacuation Inflatable Slide

1
College of Mechanical and Electrical Engineering, Harbin Engineering University, Harbin 150001, China
2
College of Shipbuilding Engineering, Harbin Engineering University, Harbin 150001, China
*
Authors to whom correspondence should be addressed.
Appl. Sci. 2020, 10(1), 21; https://doi.org/10.3390/app10010021
Submission received: 28 October 2019 / Revised: 14 December 2019 / Accepted: 16 December 2019 / Published: 18 December 2019
(This article belongs to the Section Applied Industrial Technologies)

Abstract

:
Flexible inflatable membrane structure has the characteristics of light weight, large span, and small stiffness, and it is very sensitive to wind load. Aiming at the dynamic response of marine evacuation inflatable slides under complex and changeable wind loads at sea, the response law of the inflatable slide under different wind directions, wind speeds, and internal pressure conditions is studied by using fluid–solid coupling theory. The most dangerous conditions of evacuation system installation and the ideal internal pressure of the inflatable slide meeting the stability requirements are deduced. The LS-DYNA module is used to simulate the inflation process of the slide. The evacuation sliding is rationally simplified. By changing the inflatable internal pressure of the slide, the variation law of displacement, deformation, and sliding speed of the slide is obtained, and the optimal inflation internal pressure satisfying the evacuation efficiency requirement is obtained. The results show that the inflow wind direction angle of 30° is the most dangerous condition for slideway installation, and the internal pressure of 4000 Pa is the ideal internal pressure to meet the double standards of stability and evacuation efficiency. The numerical results obtained are valuable for analyzing wind resistance of offshore inflatable membrane structures and their practical design and application in evacuation systems.

1. Introduction

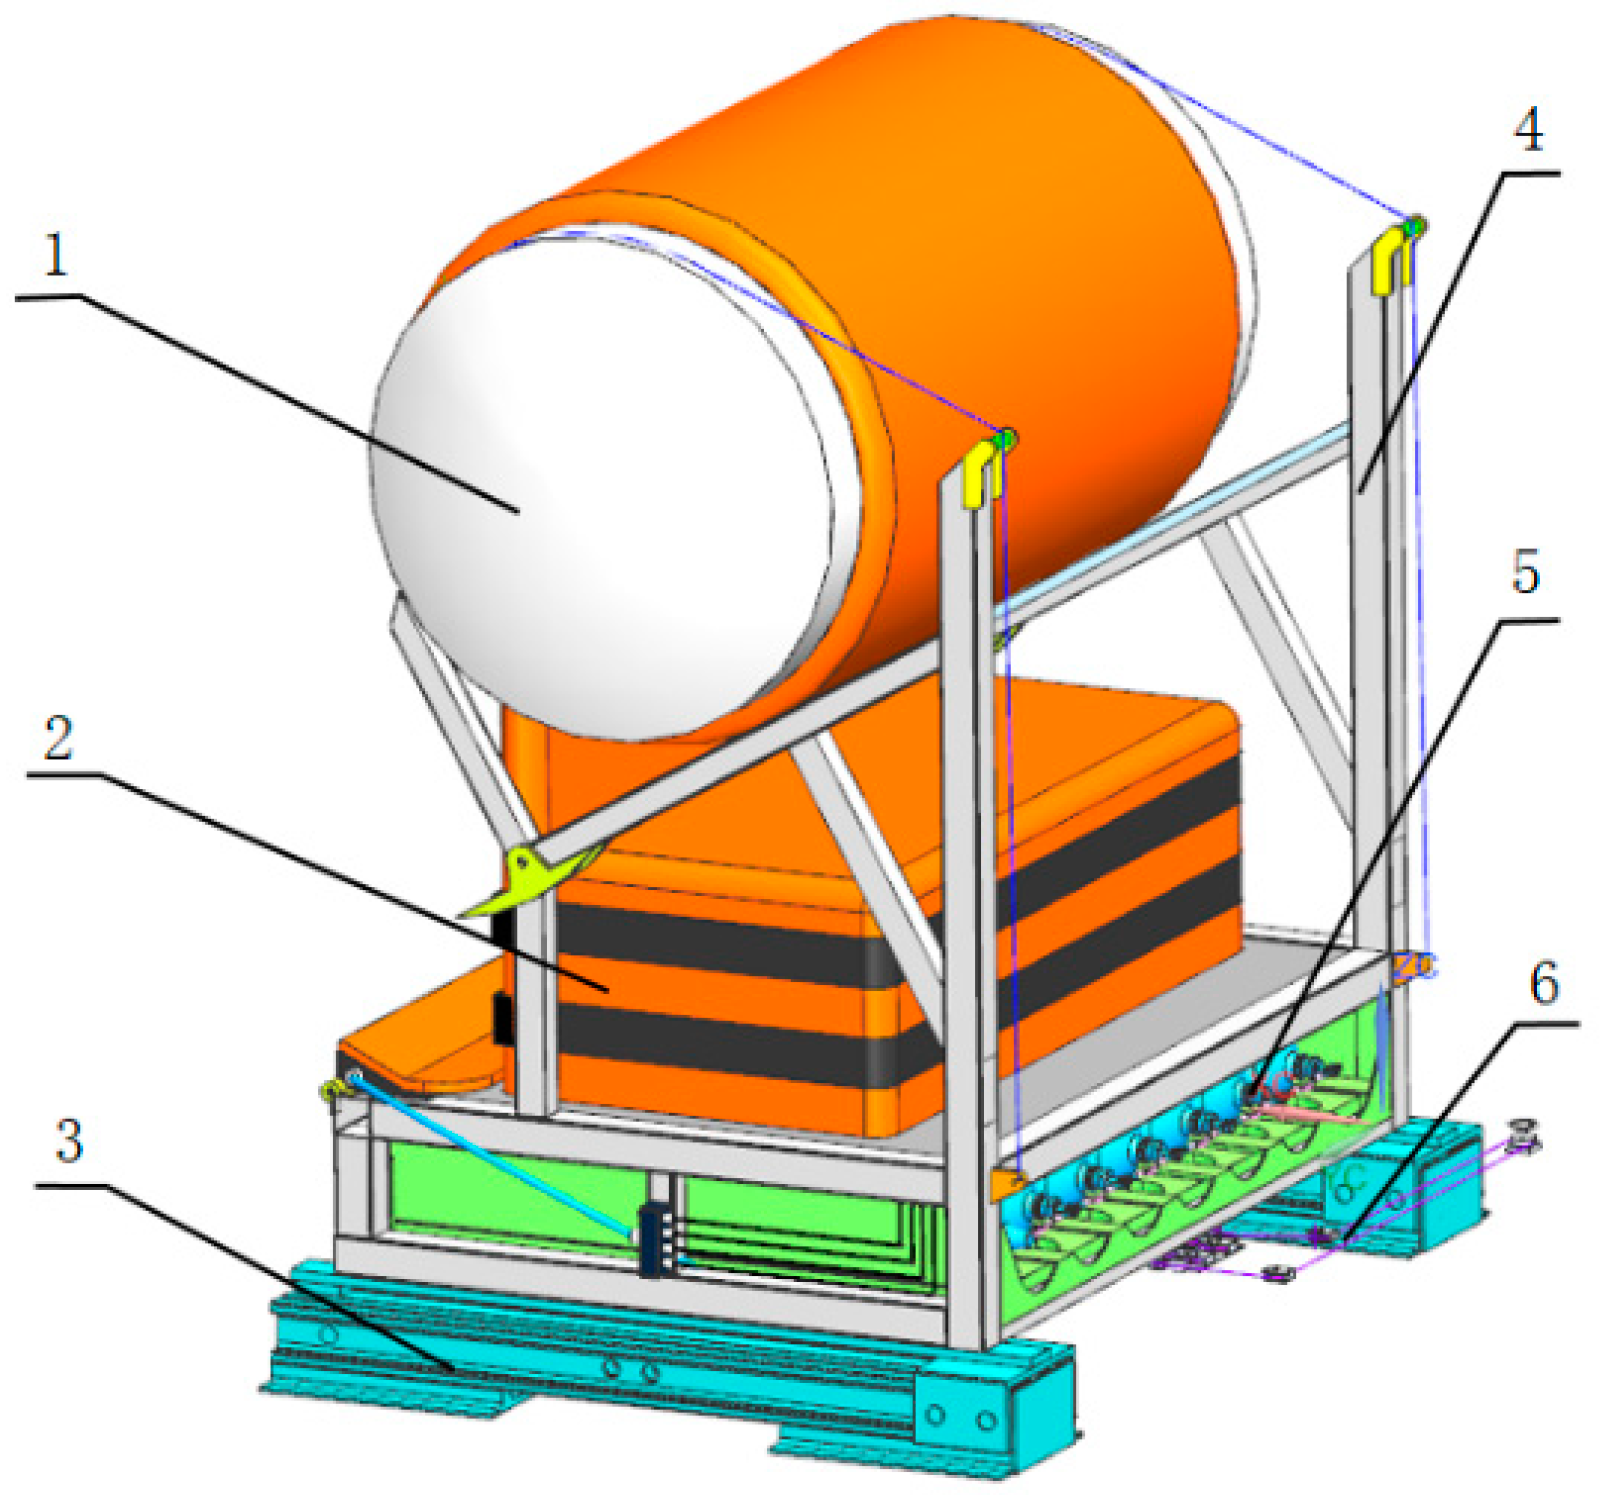
With the increasing dependence of economic development on marine trade, shipping routes are complex and the incidence of various maritime accidents is gradually increasing [1]. The ocean evacuation system is a kind of lifesaving equipment which can effectively and safely complete the evacuation of ship distress personnel [2]. The importance and urgency of its research and development are being paid attention by researchers in related fields. The inflatable slide evacuation system is a kind of lifesaving equipment mainly used in the evacuation of distressed persons on roll-on ships. Generally, it is composed of an evacuation box frame, integrated inflatable slide and sea mounting platform, telescopic guide rail, load-carrying frame and air charging device [3]. The whole system, as shown in Figure 1, is stored in the evacuation frame and fixed on the decks on both sides of the shipboard in the receiving state.
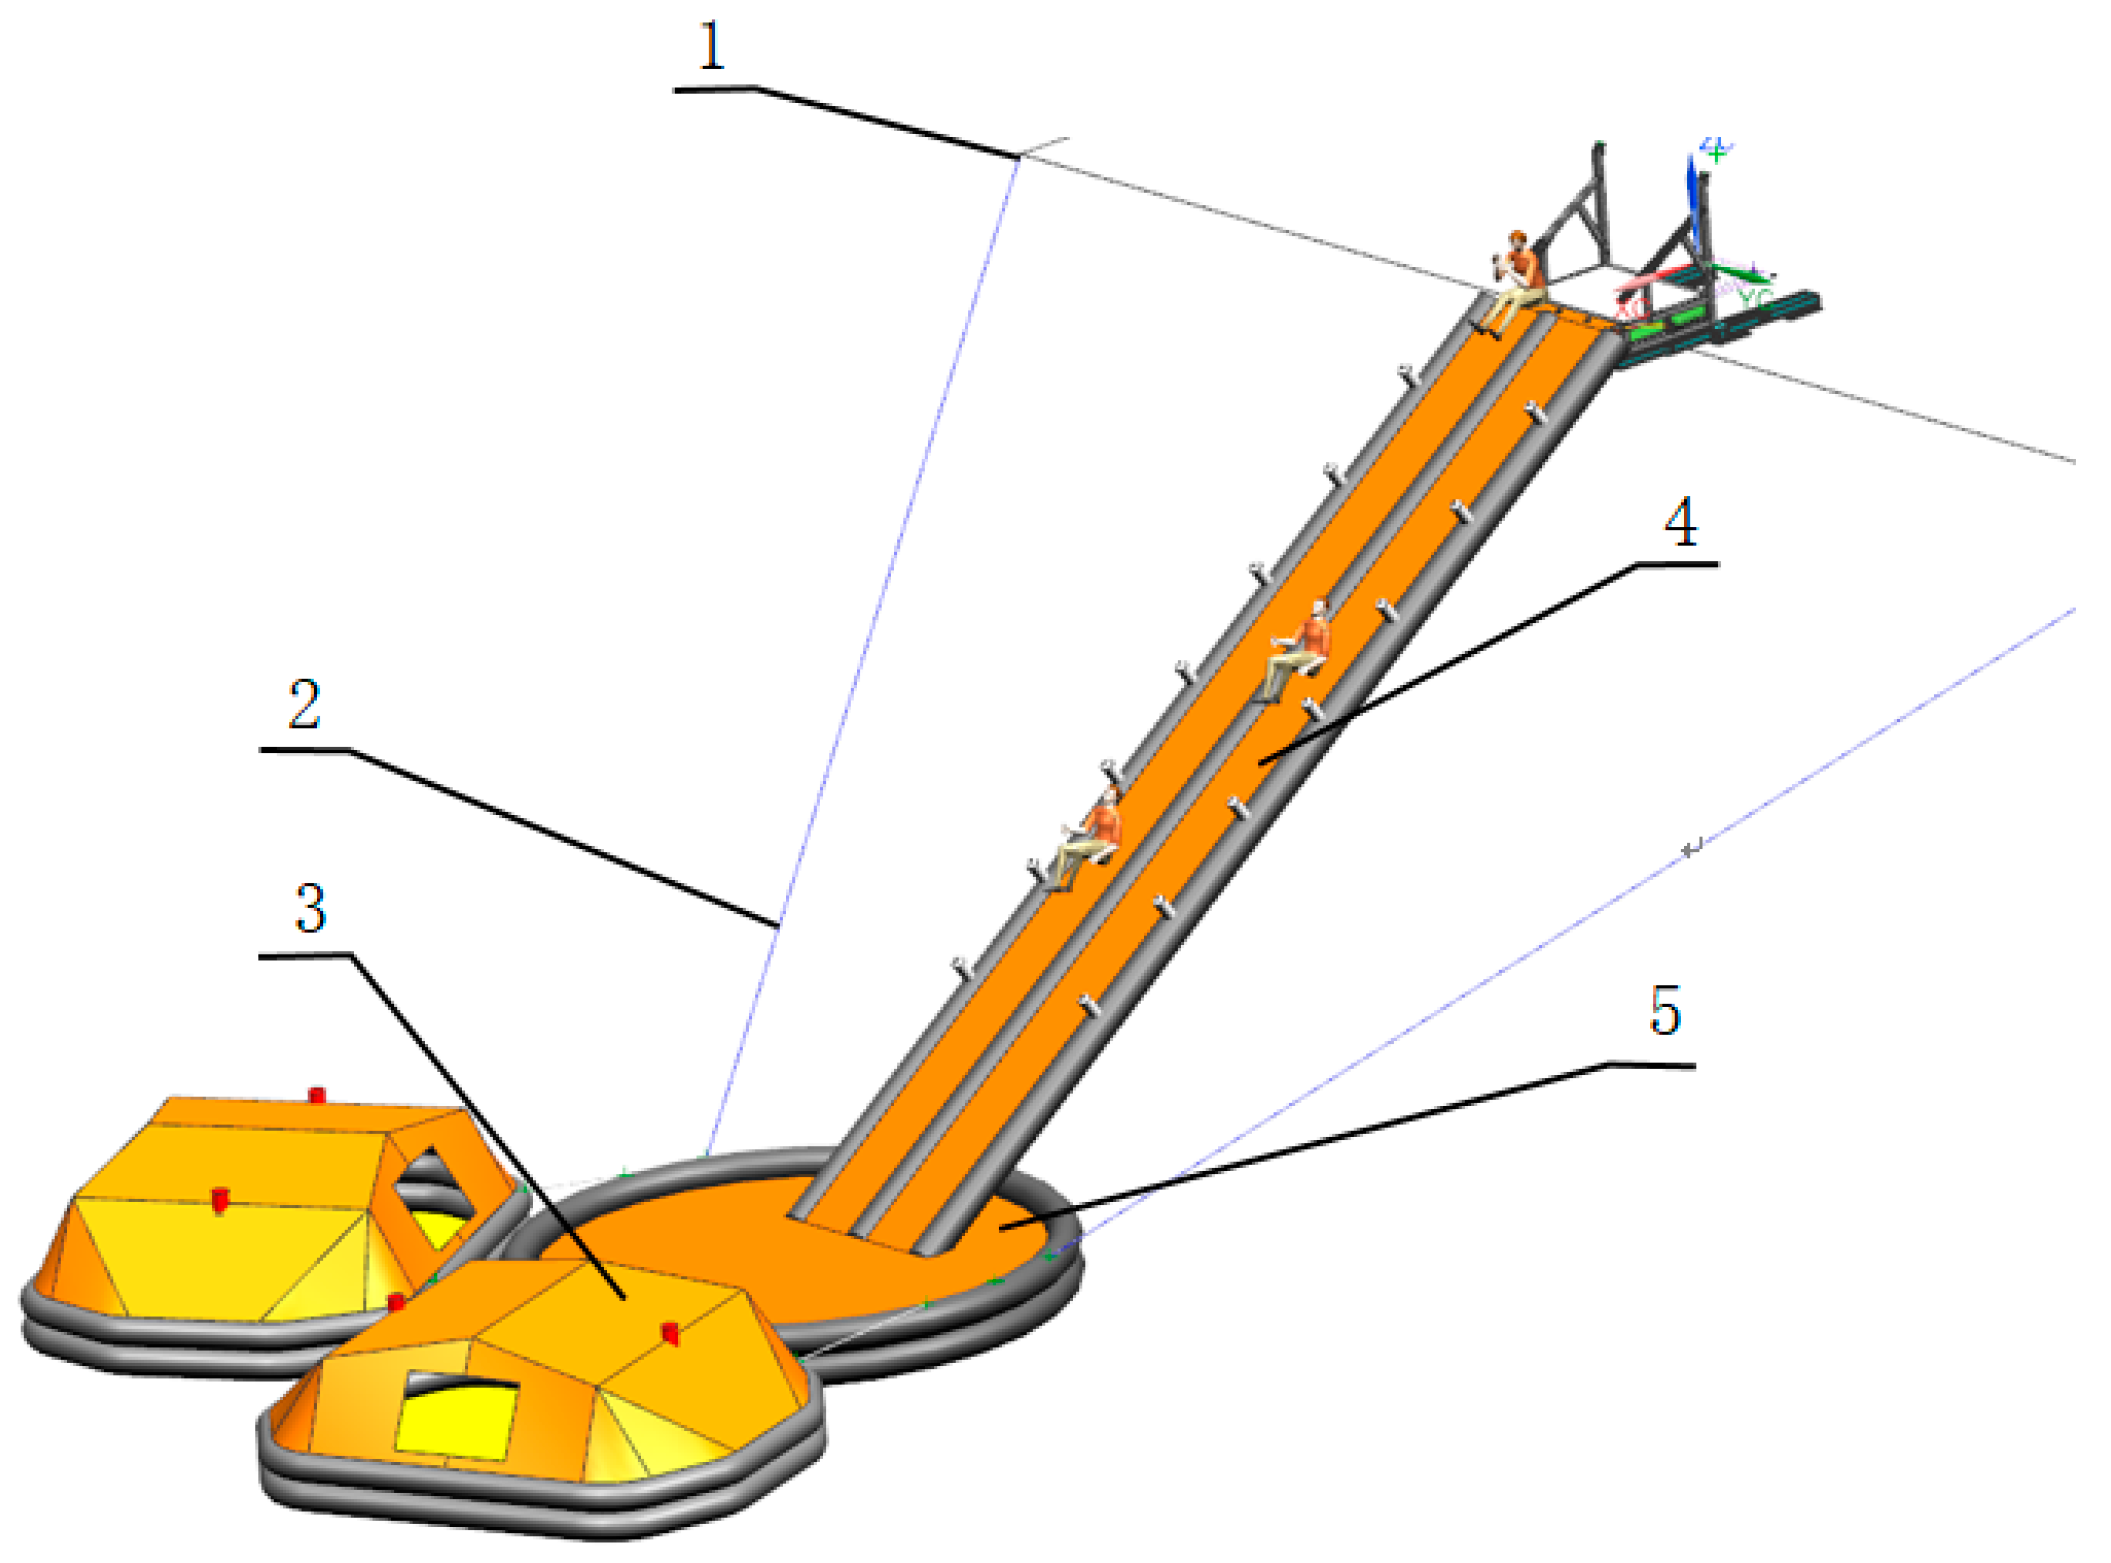
When the evacuation system is in operation, the slide and the sea lifesaving devices are inflated and deployed, and the connecting cables are fixed on the side of the ship to ensure the stability of the sea lifesaving devices. As shown in Figure 2, the external geometry of the inflatable slide is irregular, and its surface is made of rubber film, which bears a large area of wind load. At present, there is no validation standard for the response state of a lifesaving inflatable slide under wind load. In practical engineering, the displacement, deformation and wind pressure distribution of flexible film under wind load generally need to be obtained by aeroelastic model wind tunnel test. This method has a long test period, a large investment, and often uses the scaled rigid model in the test, ignoring the effect of fluid–solid coupling effect, and cannot completely and accurately reflect the actual situation.
Experts and scholars in related fields have made pioneering explorations on the application of finite element numerical simulation methods in response analysis of flexible membrane structures. With the deepening of research and the development of scientific research means, the physical model test method is gradually replaced by the computer numerical simulation analysis method [4].
Xiang carried out wind tunnel tests on the umbrella rigid roof structure, changing wind speed, wind direction and other conditions, and obtained the corresponding fluid pressure distribution of different input parameters on specific structure, and further obtained the law of fluid pressure distribution [5]. Glück carried out data transmission between CFD (computational fluid dynamics) and CSD (computational structural dynamics) through an intermediate data exchange platform. The indirect calculation method was used to simulate the fluid–structure coupling between wind and membrane structures [6]. A time-varying fluid–structure coupling method for thin shell large displacement membrane structures was also proposed [7]. Zhu used the numerical simulation method of interaction between the enclosed saddle-shaped membrane and wind to study structural vibration and the interaction′s effects on the membrane′s wind response [8]. Wood studied fluid–structure interaction of hemispherical membrane structures of three Reynolds numbers (50,000, 75,000, 100,000) by using wind tunnels, and obtained deformation responses of hemispherical membrane structures under different flow conditions [9]. Ran investigated the wind load and wind environment of three typical air-supported membrane structures with different rise–span ratios in different wind directions by using the LK k-ε model [10].
The above research has made great progress in the analysis of the wind-load response of inflatable membrane structures, but in the process of research, the simple verifiable model was often used instead of the actual engineering model, and no detailed quantitative analysis of the response law was carried out, so the research results cannot directly provide data support for the actual engineering problems. In a wind tunnel test, the rigid model was often used to replace the real model in the early test of the wind-load response of thin films. The results will inevitably have some errors. This defect also reflects the necessity of using CFD virtual simulation to solve such problems.
In this paper, based on an inflatable evacuation system for a passenger-rolling ship, numerical models of wind field and inflatable membrane sliding structure are established, and a mathematical model of information transfer and exchange between multi-field interaction interfaces is established by using simplified theory. The dynamic response law of inflatable sliding under multi-variable wind field load is obtained by using CFX fluid–solid coupling algorithm. The most dangerous condition of the evacuation system and the ideal inflatable internal pressure satisfying the stability requirement are reached. The LS-DYNA module is used to complete the inflation simulation of the inflatable slide and the simulation of the personnel sliding process. The influence law of the change of air pressure on the structural rigidity and the personnel evacuation efficiency is obtained, and the ideal inflatable internal pressure meeting the evacuation efficiency standard is obtained. The purpose is to provide some technical data support for the offshore application of inflatable membrane structures.

2. Wind-Load Response Analysis Method of Inflatable Slide and Establishment of Numerical Model

2.1. Formulation of Weak Coupling Solution Scheme

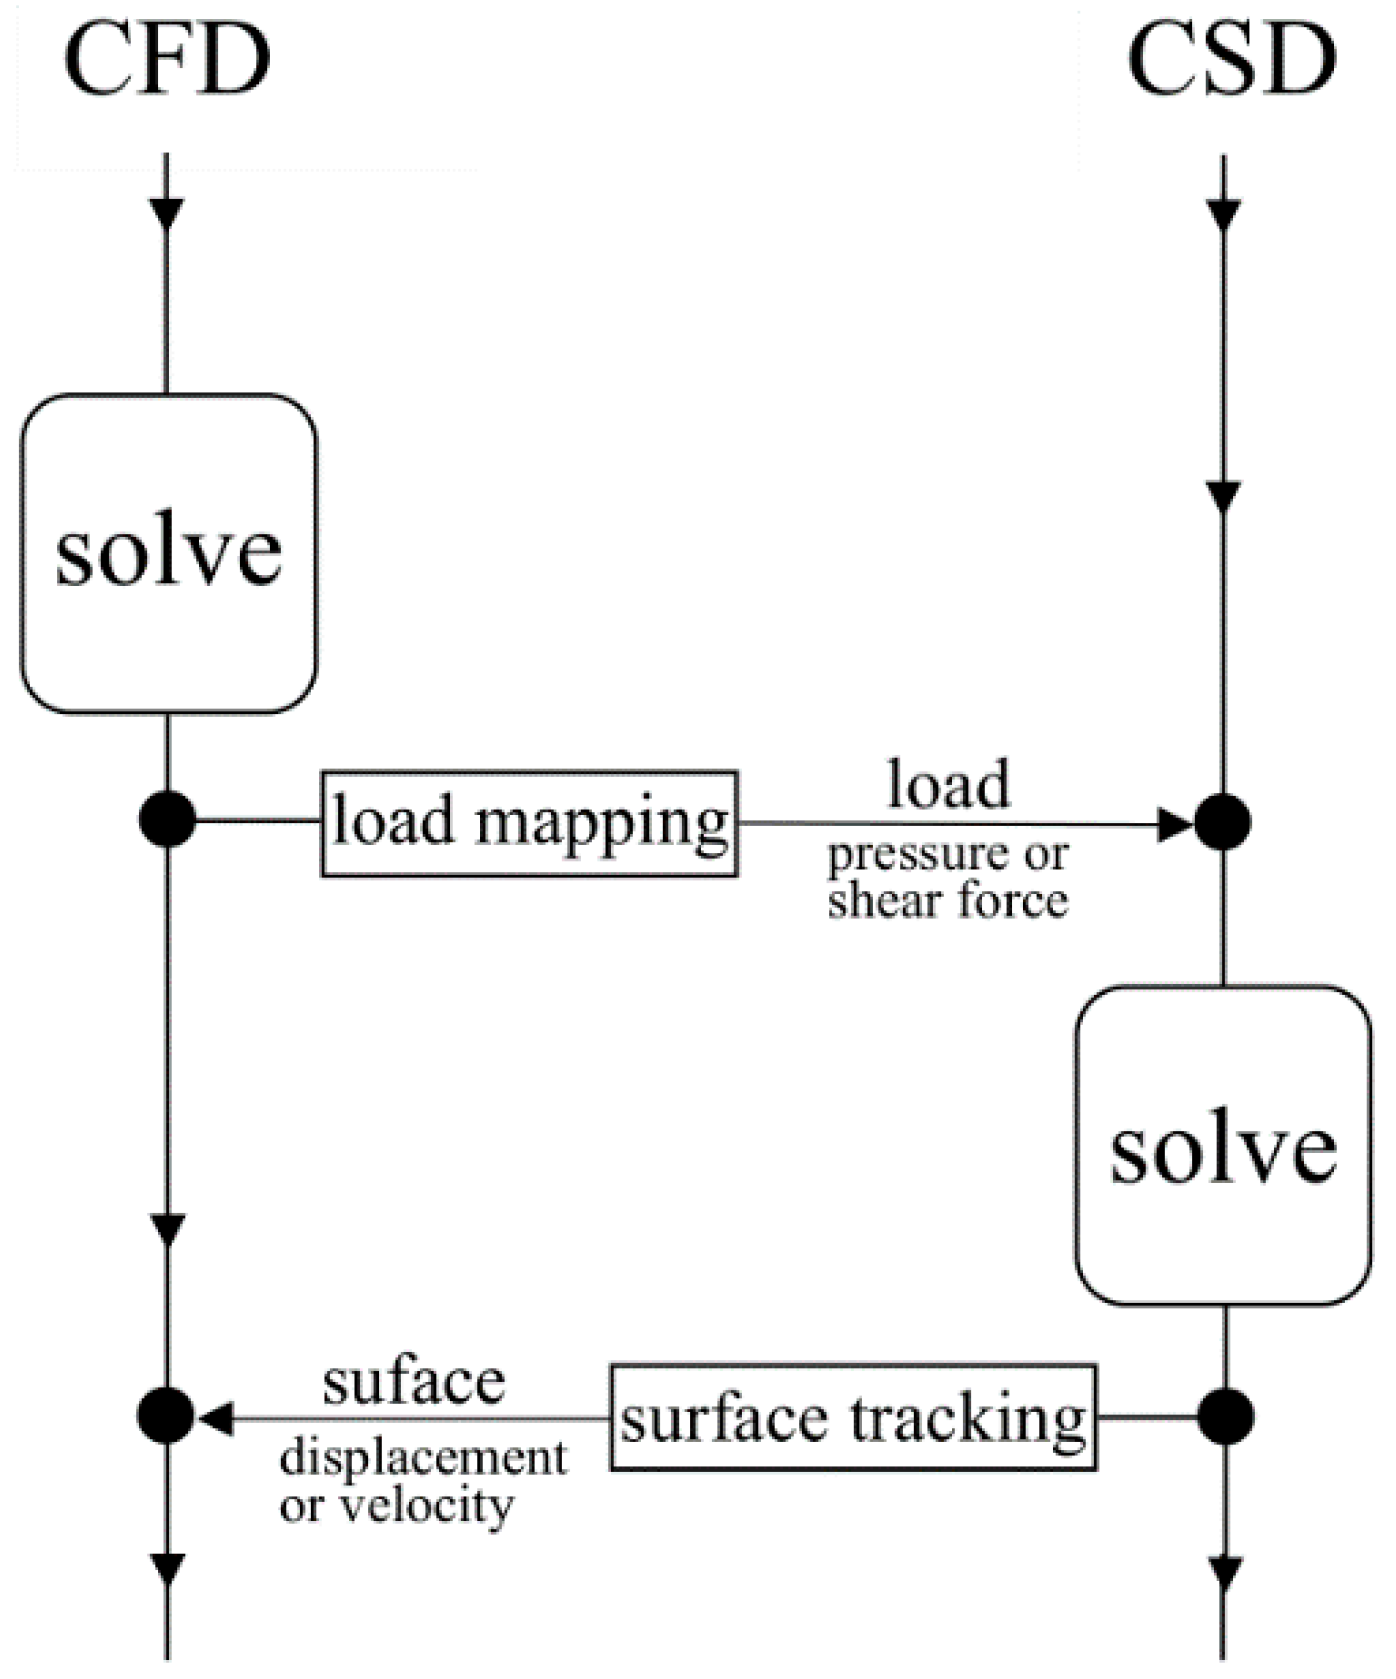
Because the geometric size of the inflatable slide is small relative to the wind field, the effective response we need to obtain is the displacement deformation and wind pressure distribution on the surface of the inflatable membrane structure. Based on the above, the interface between fluid domain and structure domain is mainly studied. That is to say, information acquisition is carried out when the solution of interaction transfer calculation in the two domains of structure and fluid reaches stable convergence state [11]. Therefore, the selection of weak coupling solution strategy can greatly reduce the computational workload. The basic scheme of weak coupling solution method is shown in Figure 3. In the process of this research, the force factor is transferred to the surface of the inflatable film through the fluid–solid coupling surface through the setting calculation of wind load in the fluid analysis software, and the response results of displacement and wind pressure are formed in the structure domain [12]. It is necessary to simplify the process by establishing a simplified information transfer model.
To illustrate the basic idea of this method, we consider only the case of pressure transfer from the fluid domain to the structural domain. p f represents the fluid pressure at the interface and p s represents the pressure on the structure, we expect:
p s ( x ) = p f ( x ) .
This equation can be satisfied by using the weighted residual method. Multiply both sides by a set of weight functions { W i } , and then integrate on the interface Γ to get:
Γ W i p s d Γ = Γ W i p f d Γ .
The finite element method can be used to calculate the pressure:
p s ( x ) = N s j ( x ) p ^ s j
p f ( x ) = N f j ( x ) p ^ f j
where, p ^ s j and p ^ f j respectively represent the estimated pressure of the structure and fluid at the corresponding unit node j.
The Galerkin method W i = W s i is adopted in Equation (2), and the calculated value of pressure is inserted:
Γ N s i N s j p ^ s j d Γ = Γ N f i N f j p ^ f j d Γ .
After further substituting each term into the solution, a non-zero pressure value can be obtained at all structural integral points, and then the preliminary calculation of pressure transfer on the FSI (fluid-structure-interaction) surface can be completed.
In this paper, the wind-load response research was carried out by ANSYS Workbench simulation tool, and the fluid part was simulated by CFD (Computational Fluid Dynamics) module. It is expected that the surface wind pressure, velocity vector and wind field streamline of the inflatable film slide can be obtained.

2.2. Establishment of Numerical Models for Wind Field Domain and Structure Domain of Inflatable Slide

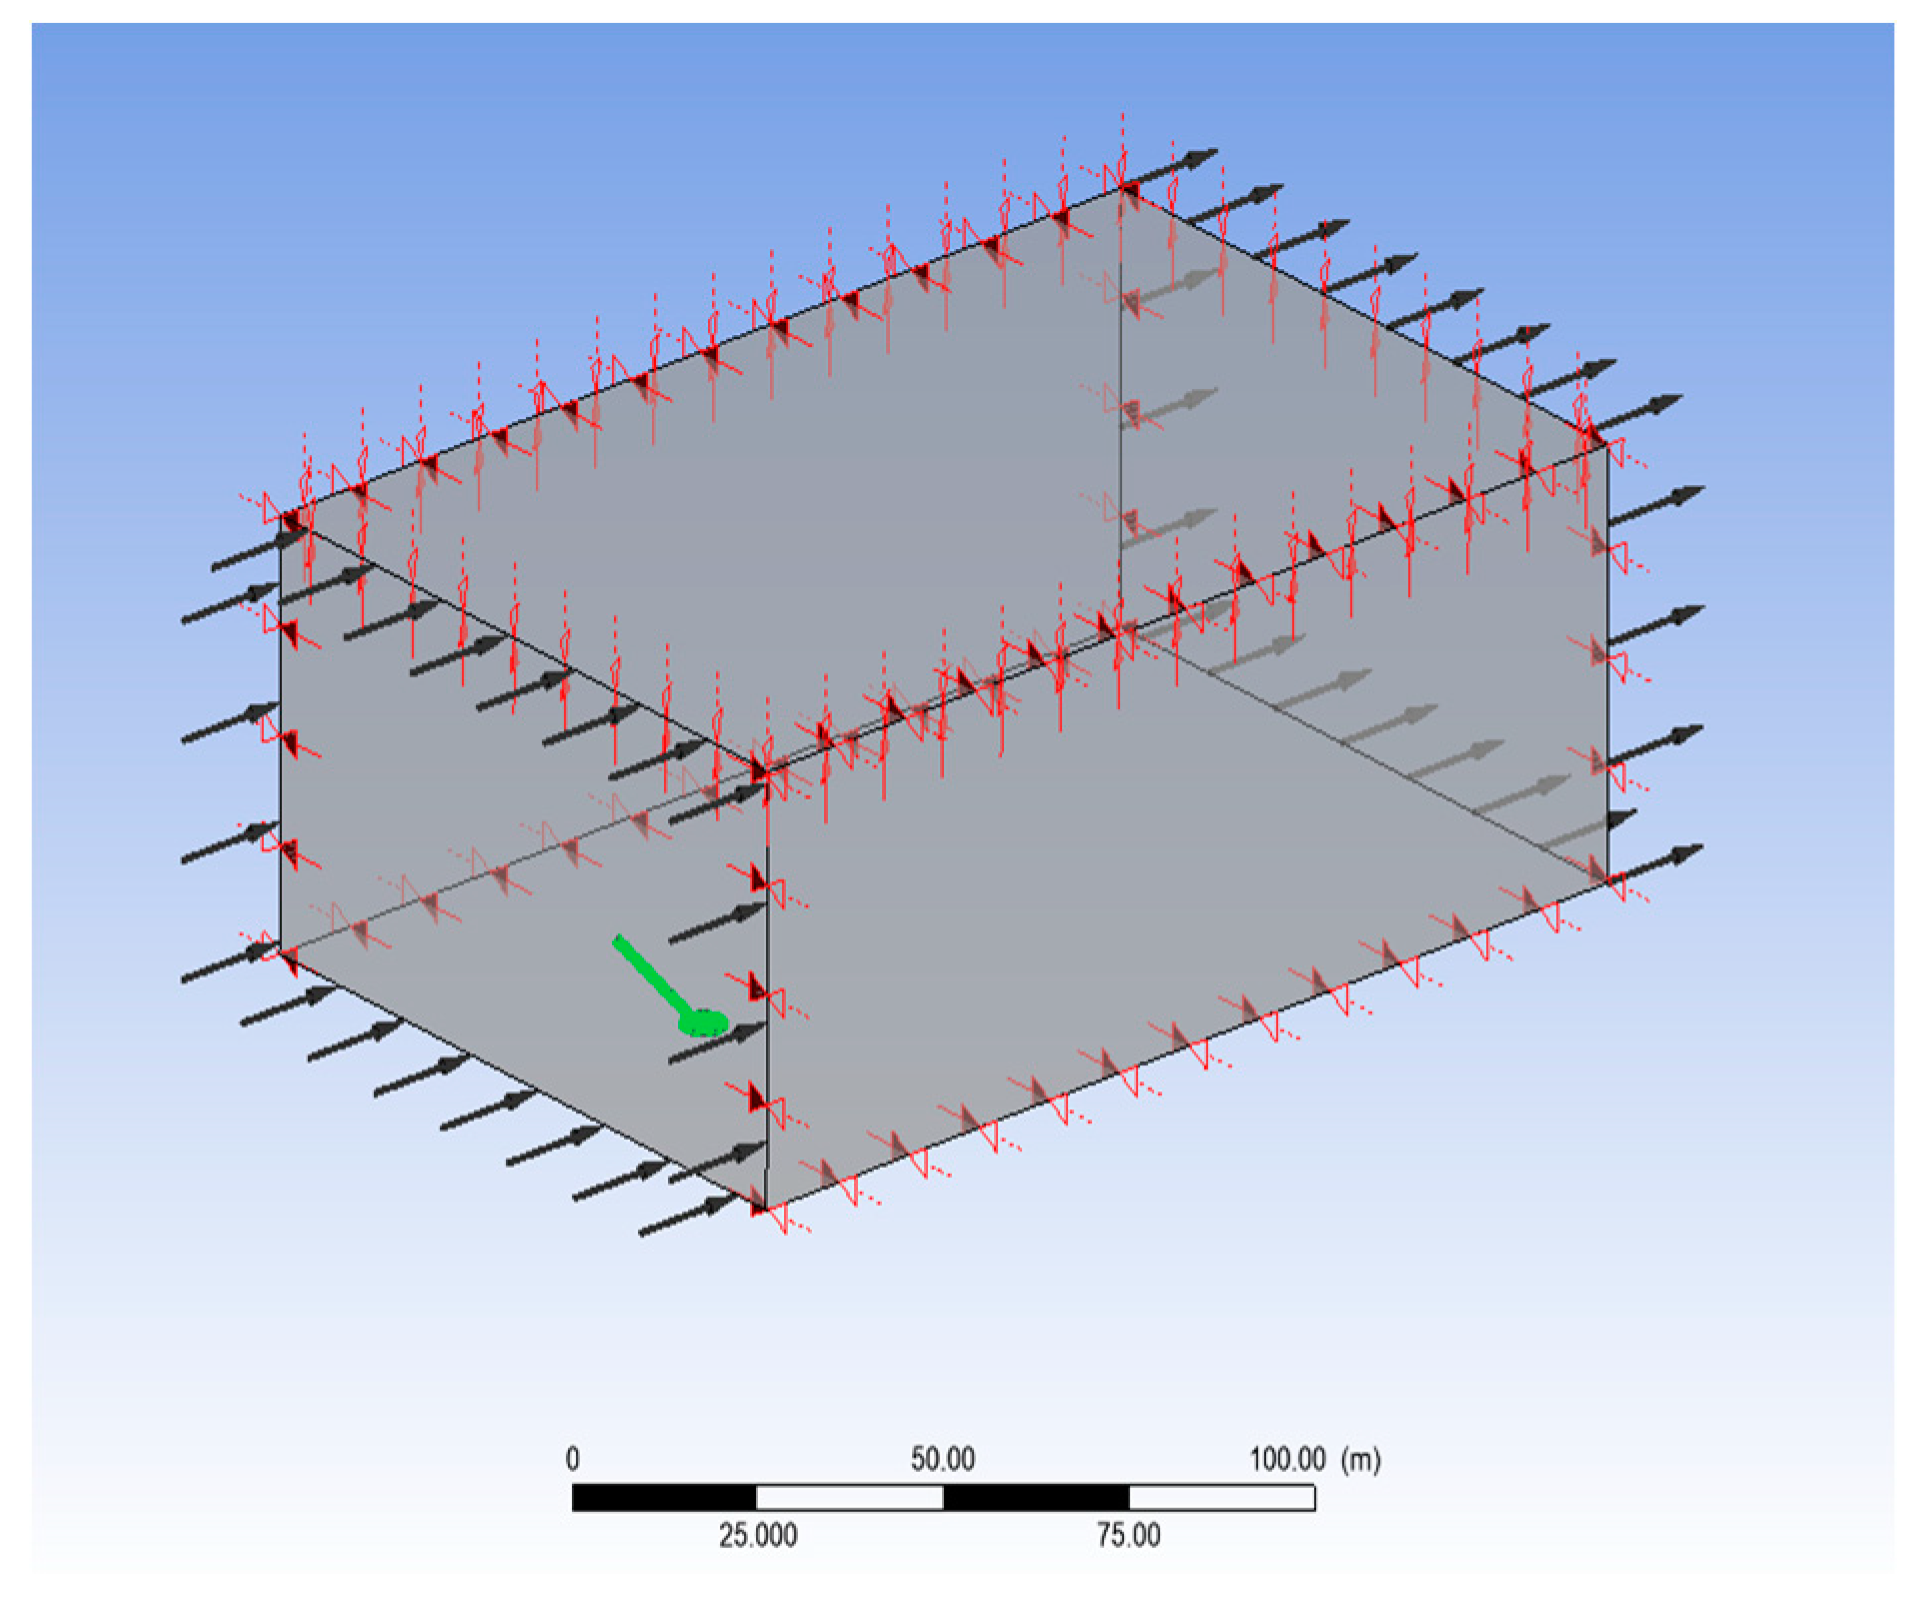
In order to establish the numerical model of wind field, boundary conditions should be set first. The boundary conditions of wind field include inlet, outlet, opening boundary, walls and symmetry [13]. The establishment criterion of calculation area is to approximate the actual situation as much as possible, and to minimize the influence of the simulation solution on calculation results [14]. It should be ensured that the boundary of the simulated wind field is far enough from the inflatable film slide, and the calculation area should not be too small. According to the size specifications of the inflatable slide, the sea surface wind field size is 150 m × 100 m × 50 m, as shown in Figure 4. The injected fluid is set to be 20 m/s subsonic fluid with turbulence intensity of 0.05 and temperature of 25 °C. The mass and momentum of the ejected fluid are set at 0 Pa of average static pressure and 0.05 of turbulence intensity, and the wall is set as a forbidden boundary for the fluid in the fluid field, which is passable for heat transfer and other additional variables.
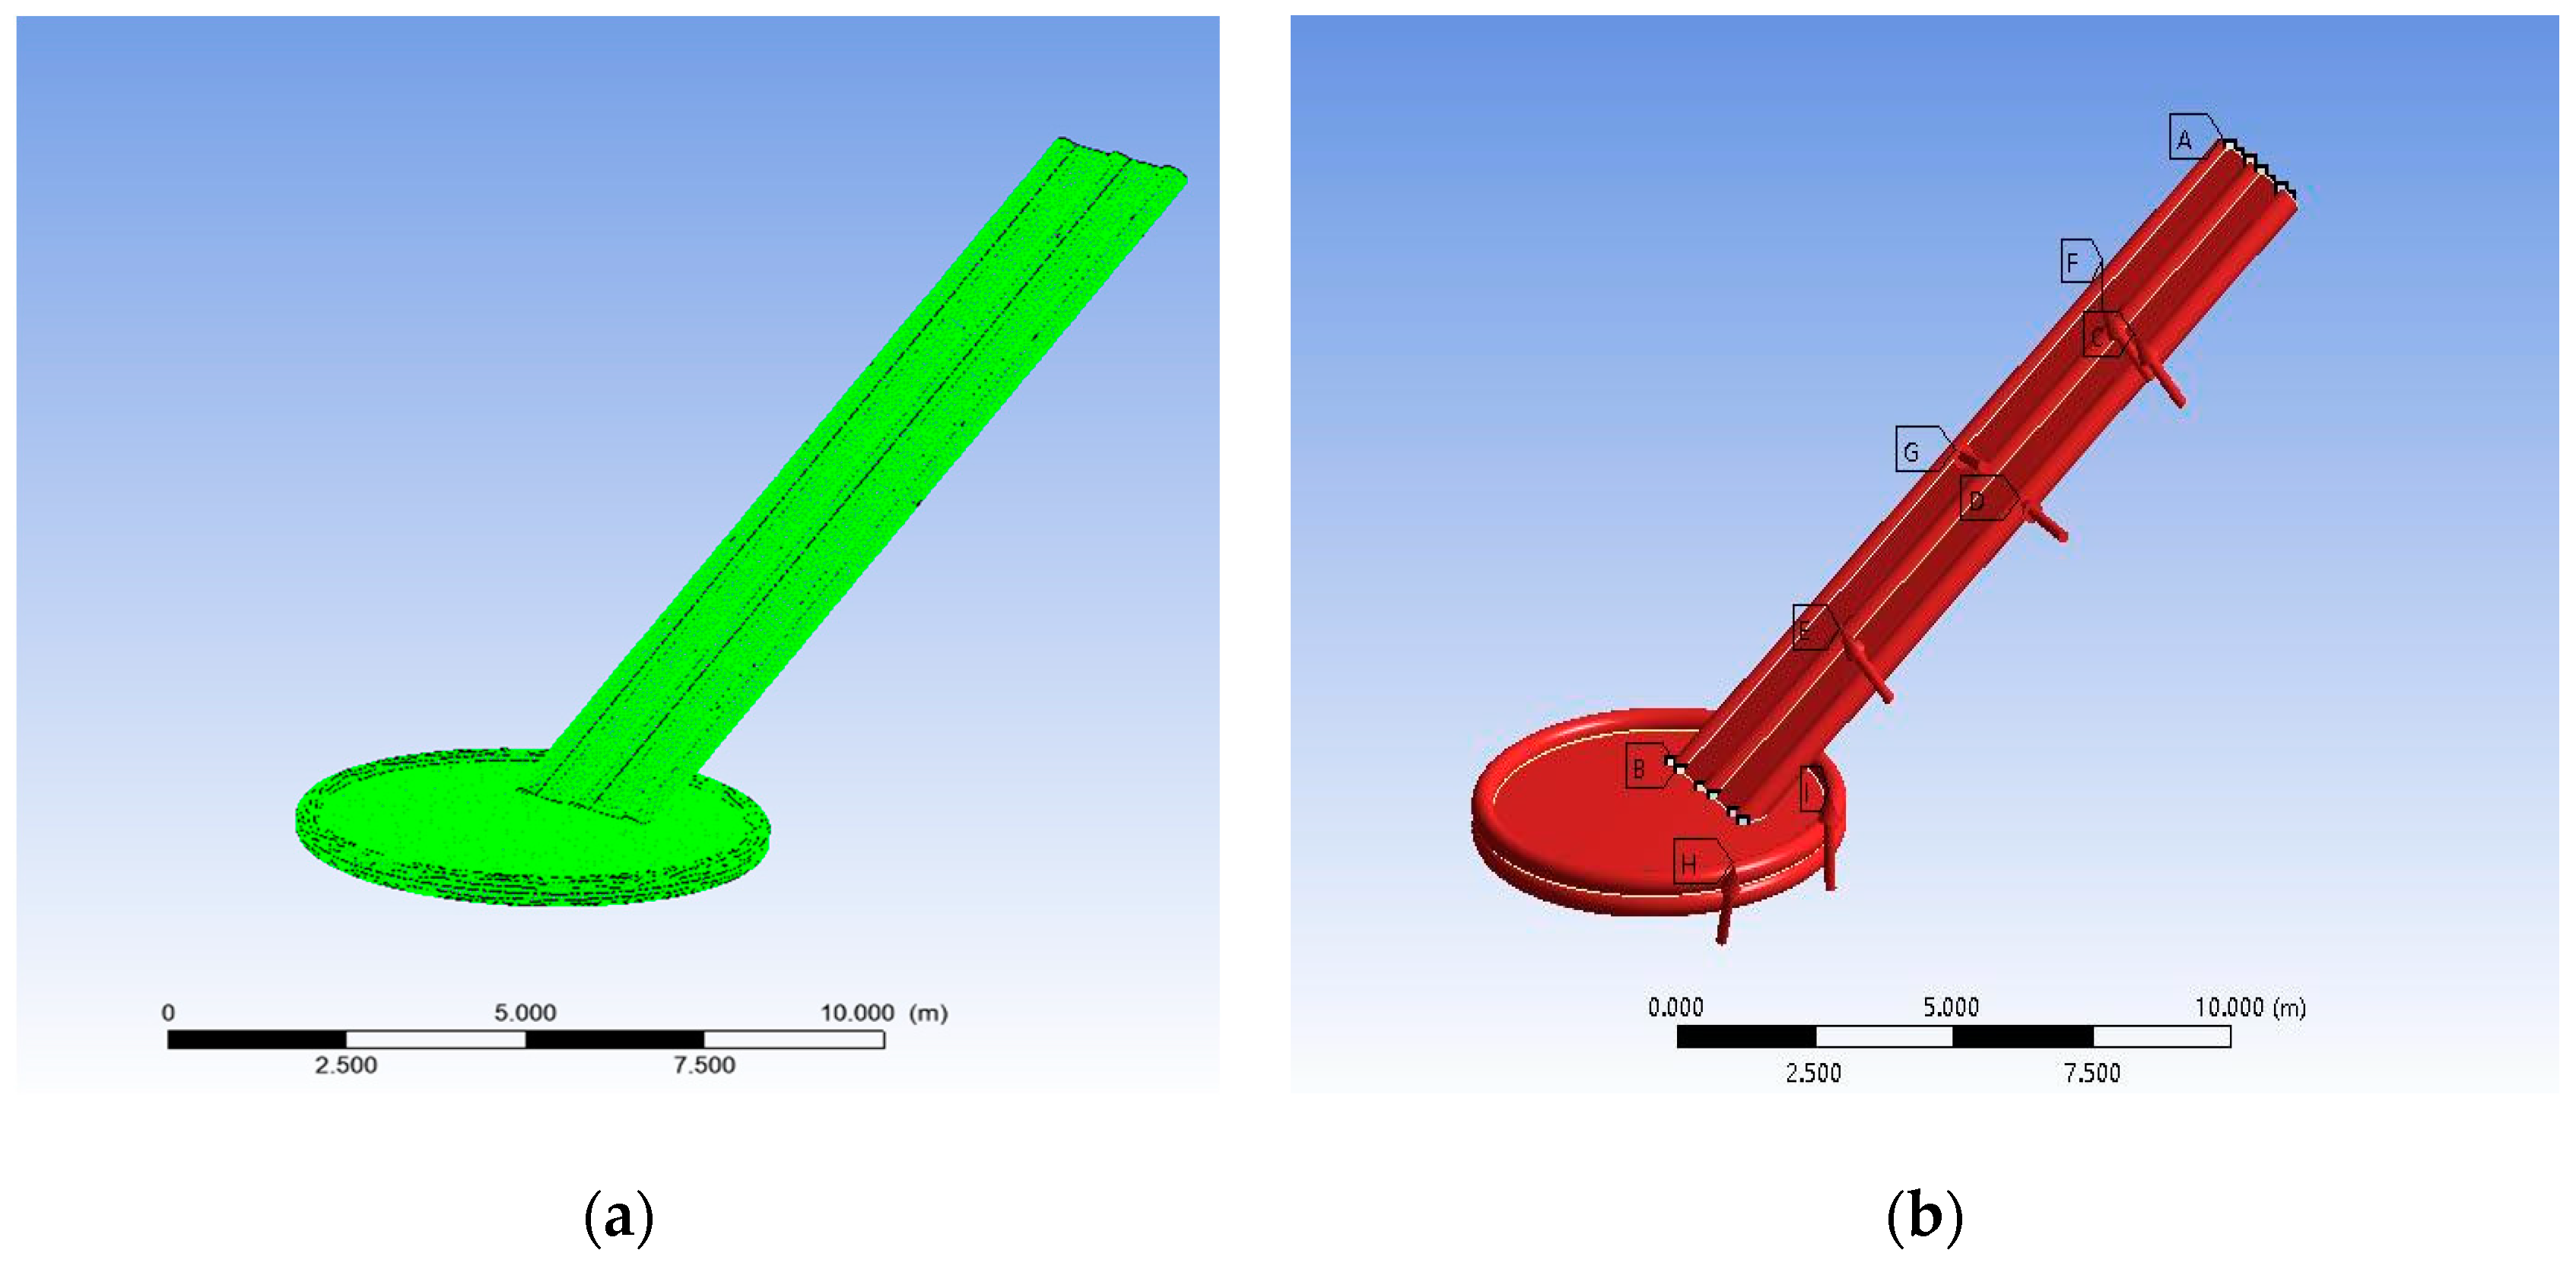
Next, the numerical model of the structure domain of the inflatable slide is established. The length of the inflatable slide surface is 14 m, the total width of the slide is 1.8 m, and the width of the unilateral slide surface is 0.8 m. The angle between the film surface and the sea surface is 35°, and the diameter of the boarding platform is 6 m. The PVDF (polyvinylidene fluoride) membrane material with a thickness of 1 mm is selected as the membrane material. Its advantages are high mechanical strength and toughness, high wear resistance, high permeability to gases and liquids, good anti-ultraviolet and anti-impact properties [15]. It is suitable for use in complex marine environments. The material density of the model is 1250 kg/m3, the modulus of elasticity is 5.0 × 10⁹ Pa and Poisson’s ratio is 0.35. Because the inflatable slide is composed of multi-compartments, it is necessary to add air pressure to each compartment independently in the simulation environment, and the internal pressure is set to 4000 Pa.
During mesh generation, five inflation layers are set for the FSI surface, and the mesh is refined. The purpose of this setting is that when the wind acts on the surface of the inflatable membrane, the gas velocity decreases near the FSI surface, and the flow is relatively stable. The fluid viscosity at this time will appear. Therefore, the mesh near the surface should be finely divided to make the calculation process converge as soon as possible. The structure domain numerical model of the inflatable slide is shown in Figure 5.
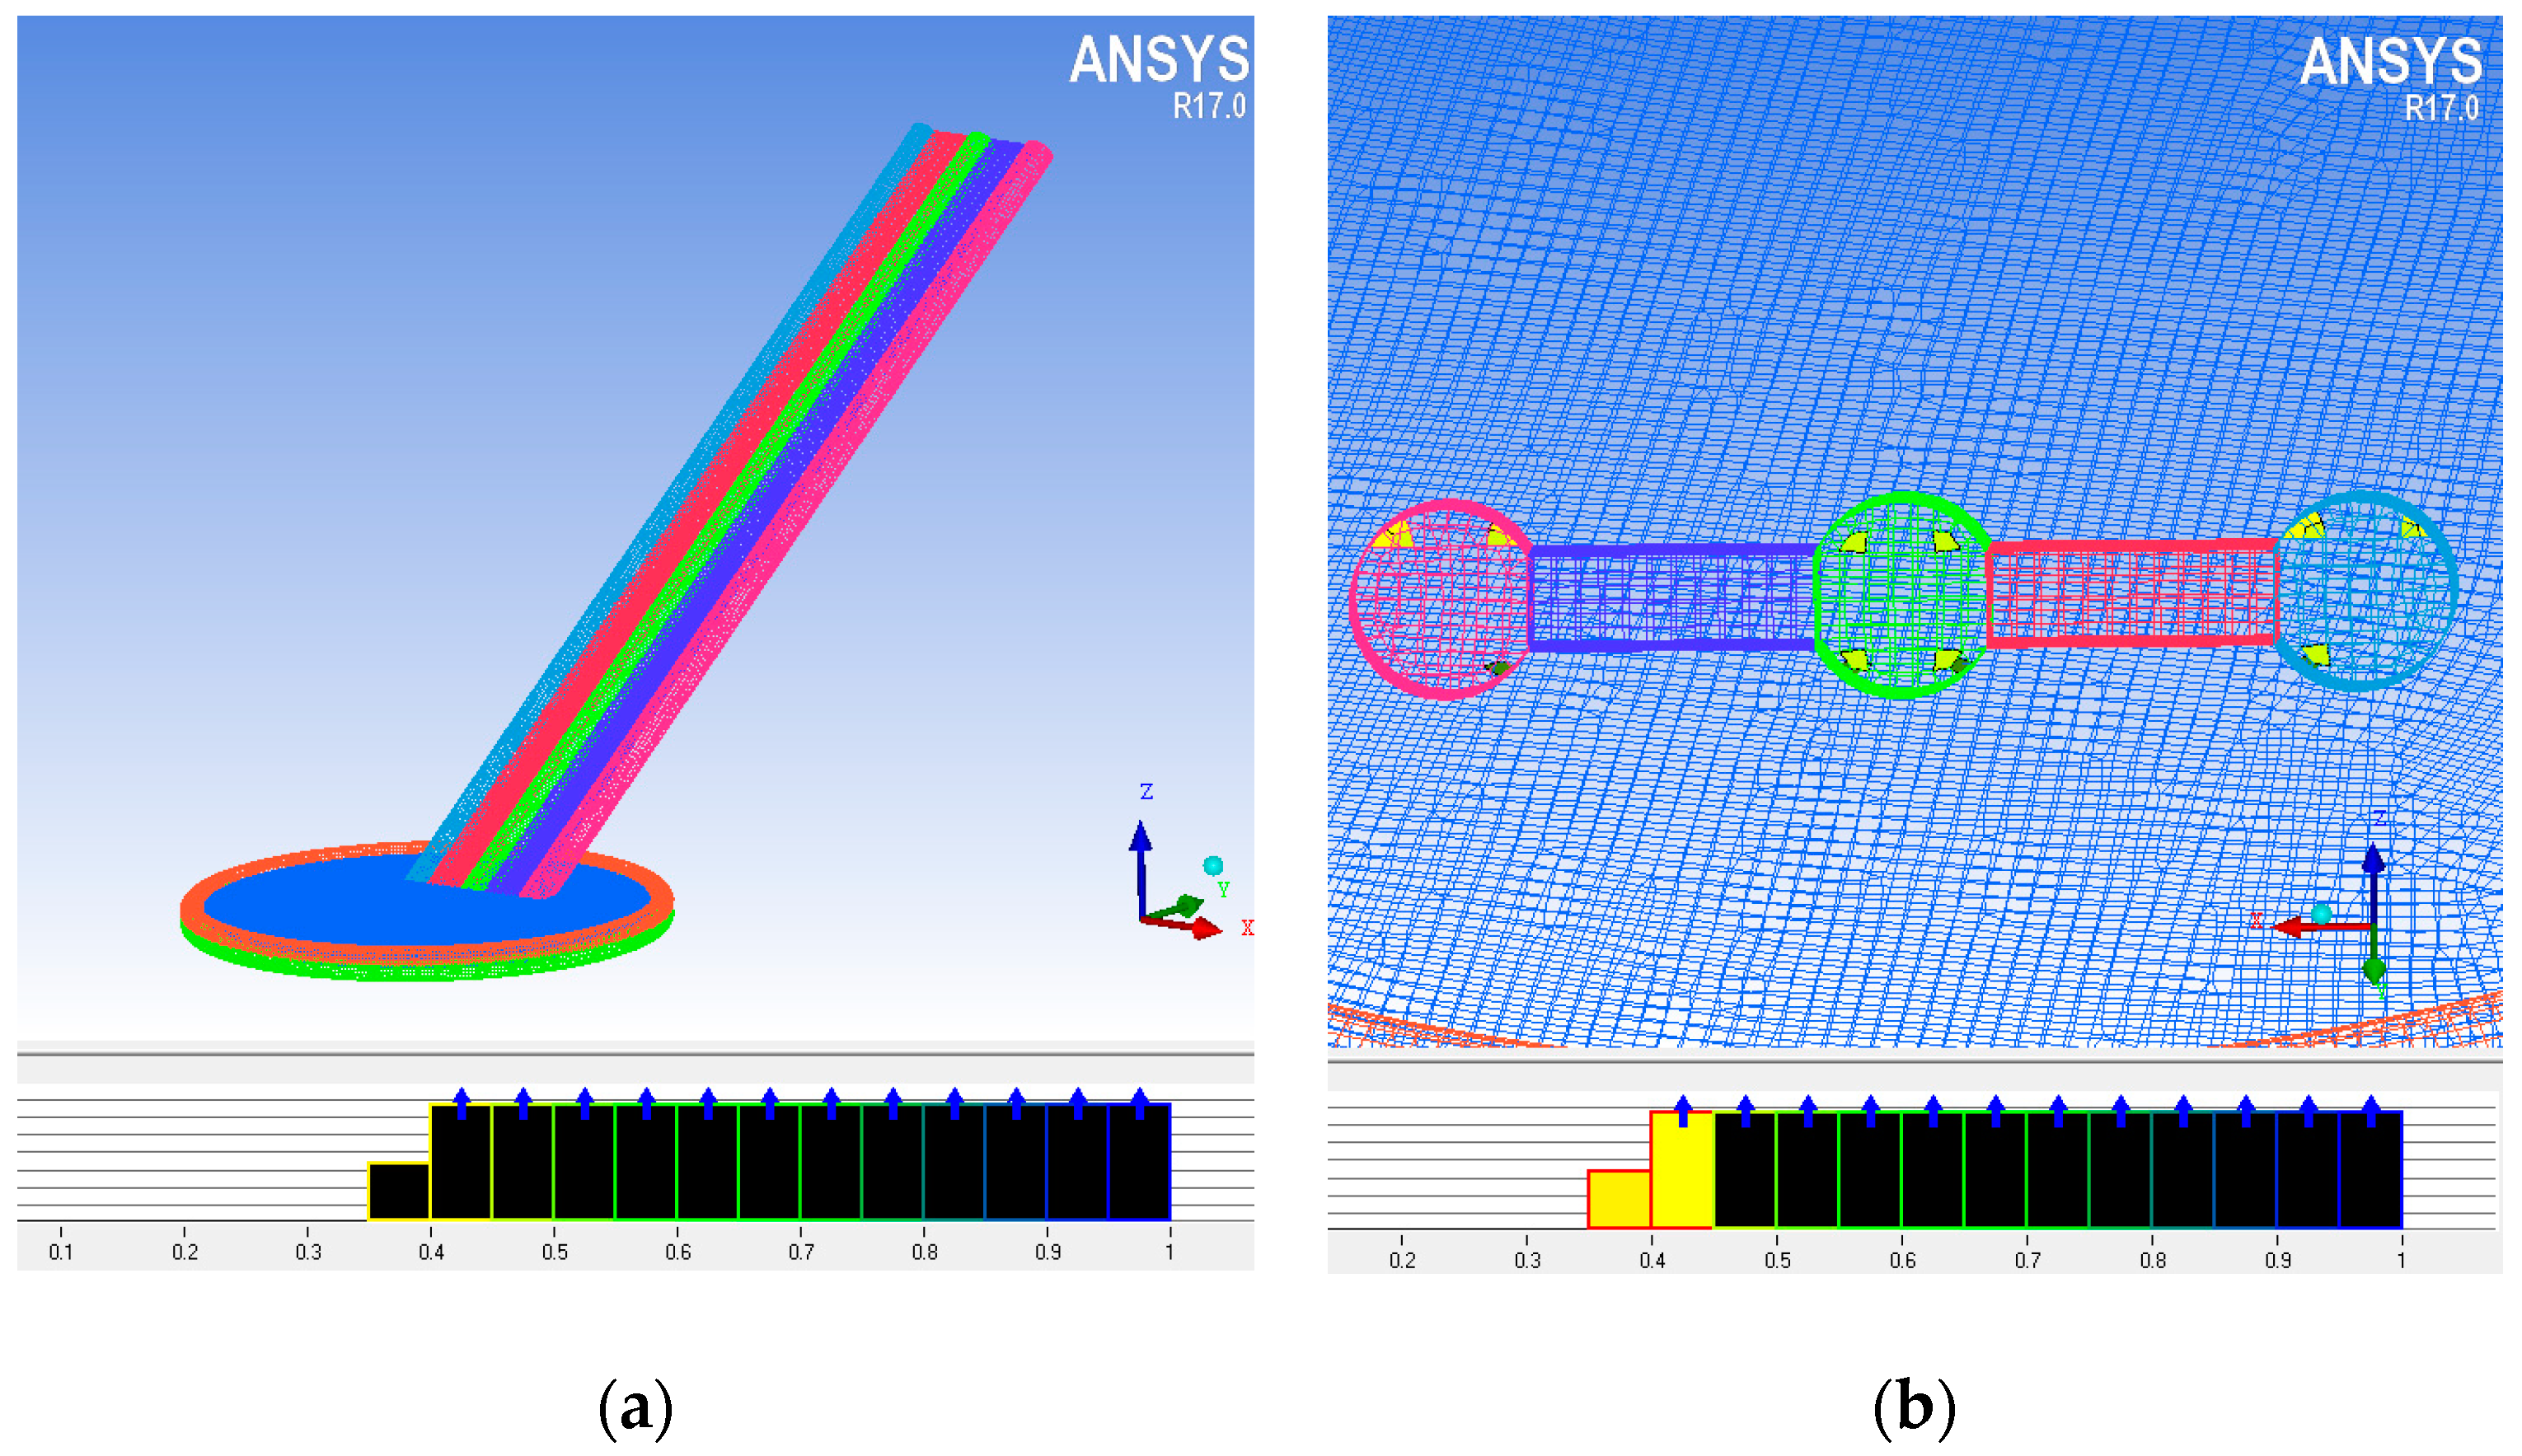
After checking the mesh quality, most of the mesh topology quality is greater than 0.5, and the mesh skew coefficient values are all close to 1. The mesh quality is good. The quadrilateral element is used as the structural mesh for the mesh generation of wind field domain. The mesh of the inflatable slide domain also uses quadrilateral elements as the structural mesh, as shown in Figure 6a. The area with poor quality after mesh division is shown in Figure 6b.
It can be seen from the partition results that the poor quality area of the mesh appears at the top connection of the inflatable slide. In the simulation process, the fixed constraint is applied to this part, and the analysis of the FSI surface will not be affected, so the quality of the mesh partition meets the requirements.

3. Wind-Load Response Analysis of Inflatable Slide under Fluid-Solid Coupling

In order to analyze and simulate the response of the emergency inflatable slide in the wind field during the actual work of the sea surface, it is necessary to take full account of the wind field variables, and through the introduction of different parameters, the results of the overall wind pressure distribution and displacement response of the inflatable slide are obtained. The wind direction angles considered here are 0°, 30°, 60° and 90°, and the sea surface wind speeds are 15 m/s, 20 m/s, and 25 m/s. According to the pressure regulation of the inflatable life raft in the international lifesaving equipment and rules, the pressure of the inflatable life raft in combination with the fishery lifesaving equipment is 30 mm mercury column (4000 Pa). The simulated atmospheric pressures are 3000 Pa, 3500 Pa, 4000 Pa, 4500 Pa, and 5000 Pa as the atmospheric pressure varies. When adjusting the variables, the sea surface wind field is guaranteed to remain unchanged.

3.1. Wind-Load Response of Emergency Inflatable Slide under Different Wind Direction Angles

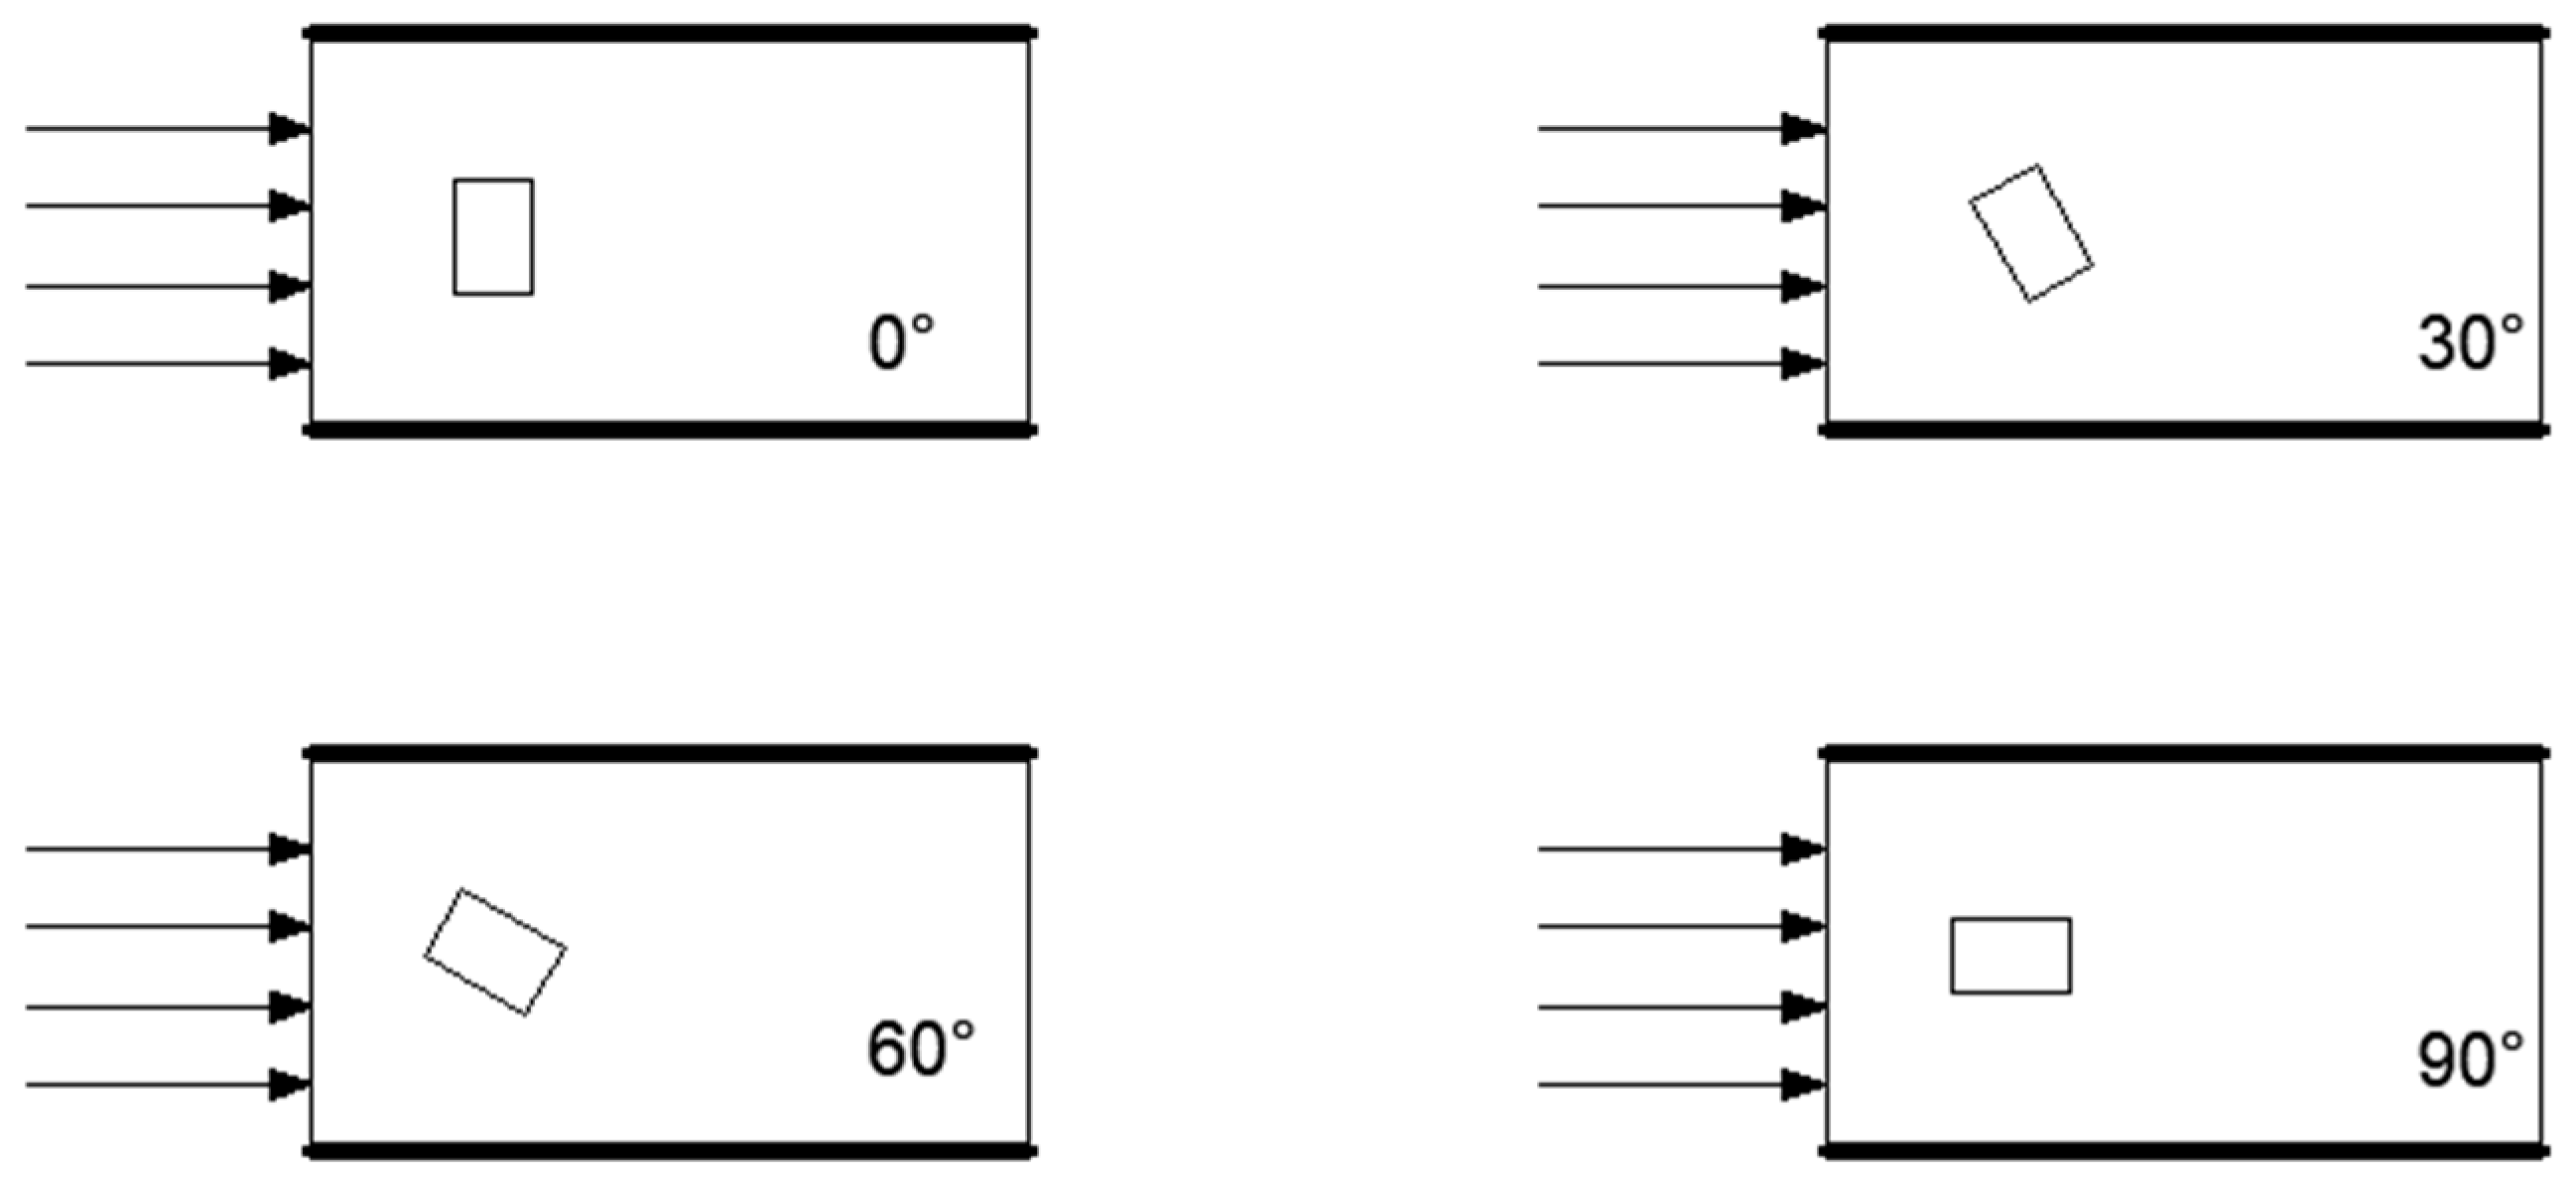
Different wind directions have great influence on the motion response of offshore structures. When a ship is in distress at sea, the most unfavorable wind direction can be obtained during the analysis of the deformation and wind pressure distribution data of its evacuation system caused by different incoming winds [16]. According to the size characteristics of the evacuation system involved in this paper, the geometrical size of the flow field area is set to 150 m × 100 m × 50 m. We set air pressure variable (4000 Pa) and wind speed variable (20 m/s), and carried out numerical simulation analysis. The layout of inflatable slide at different wind directions on the sea surface is shown in Figure 7.
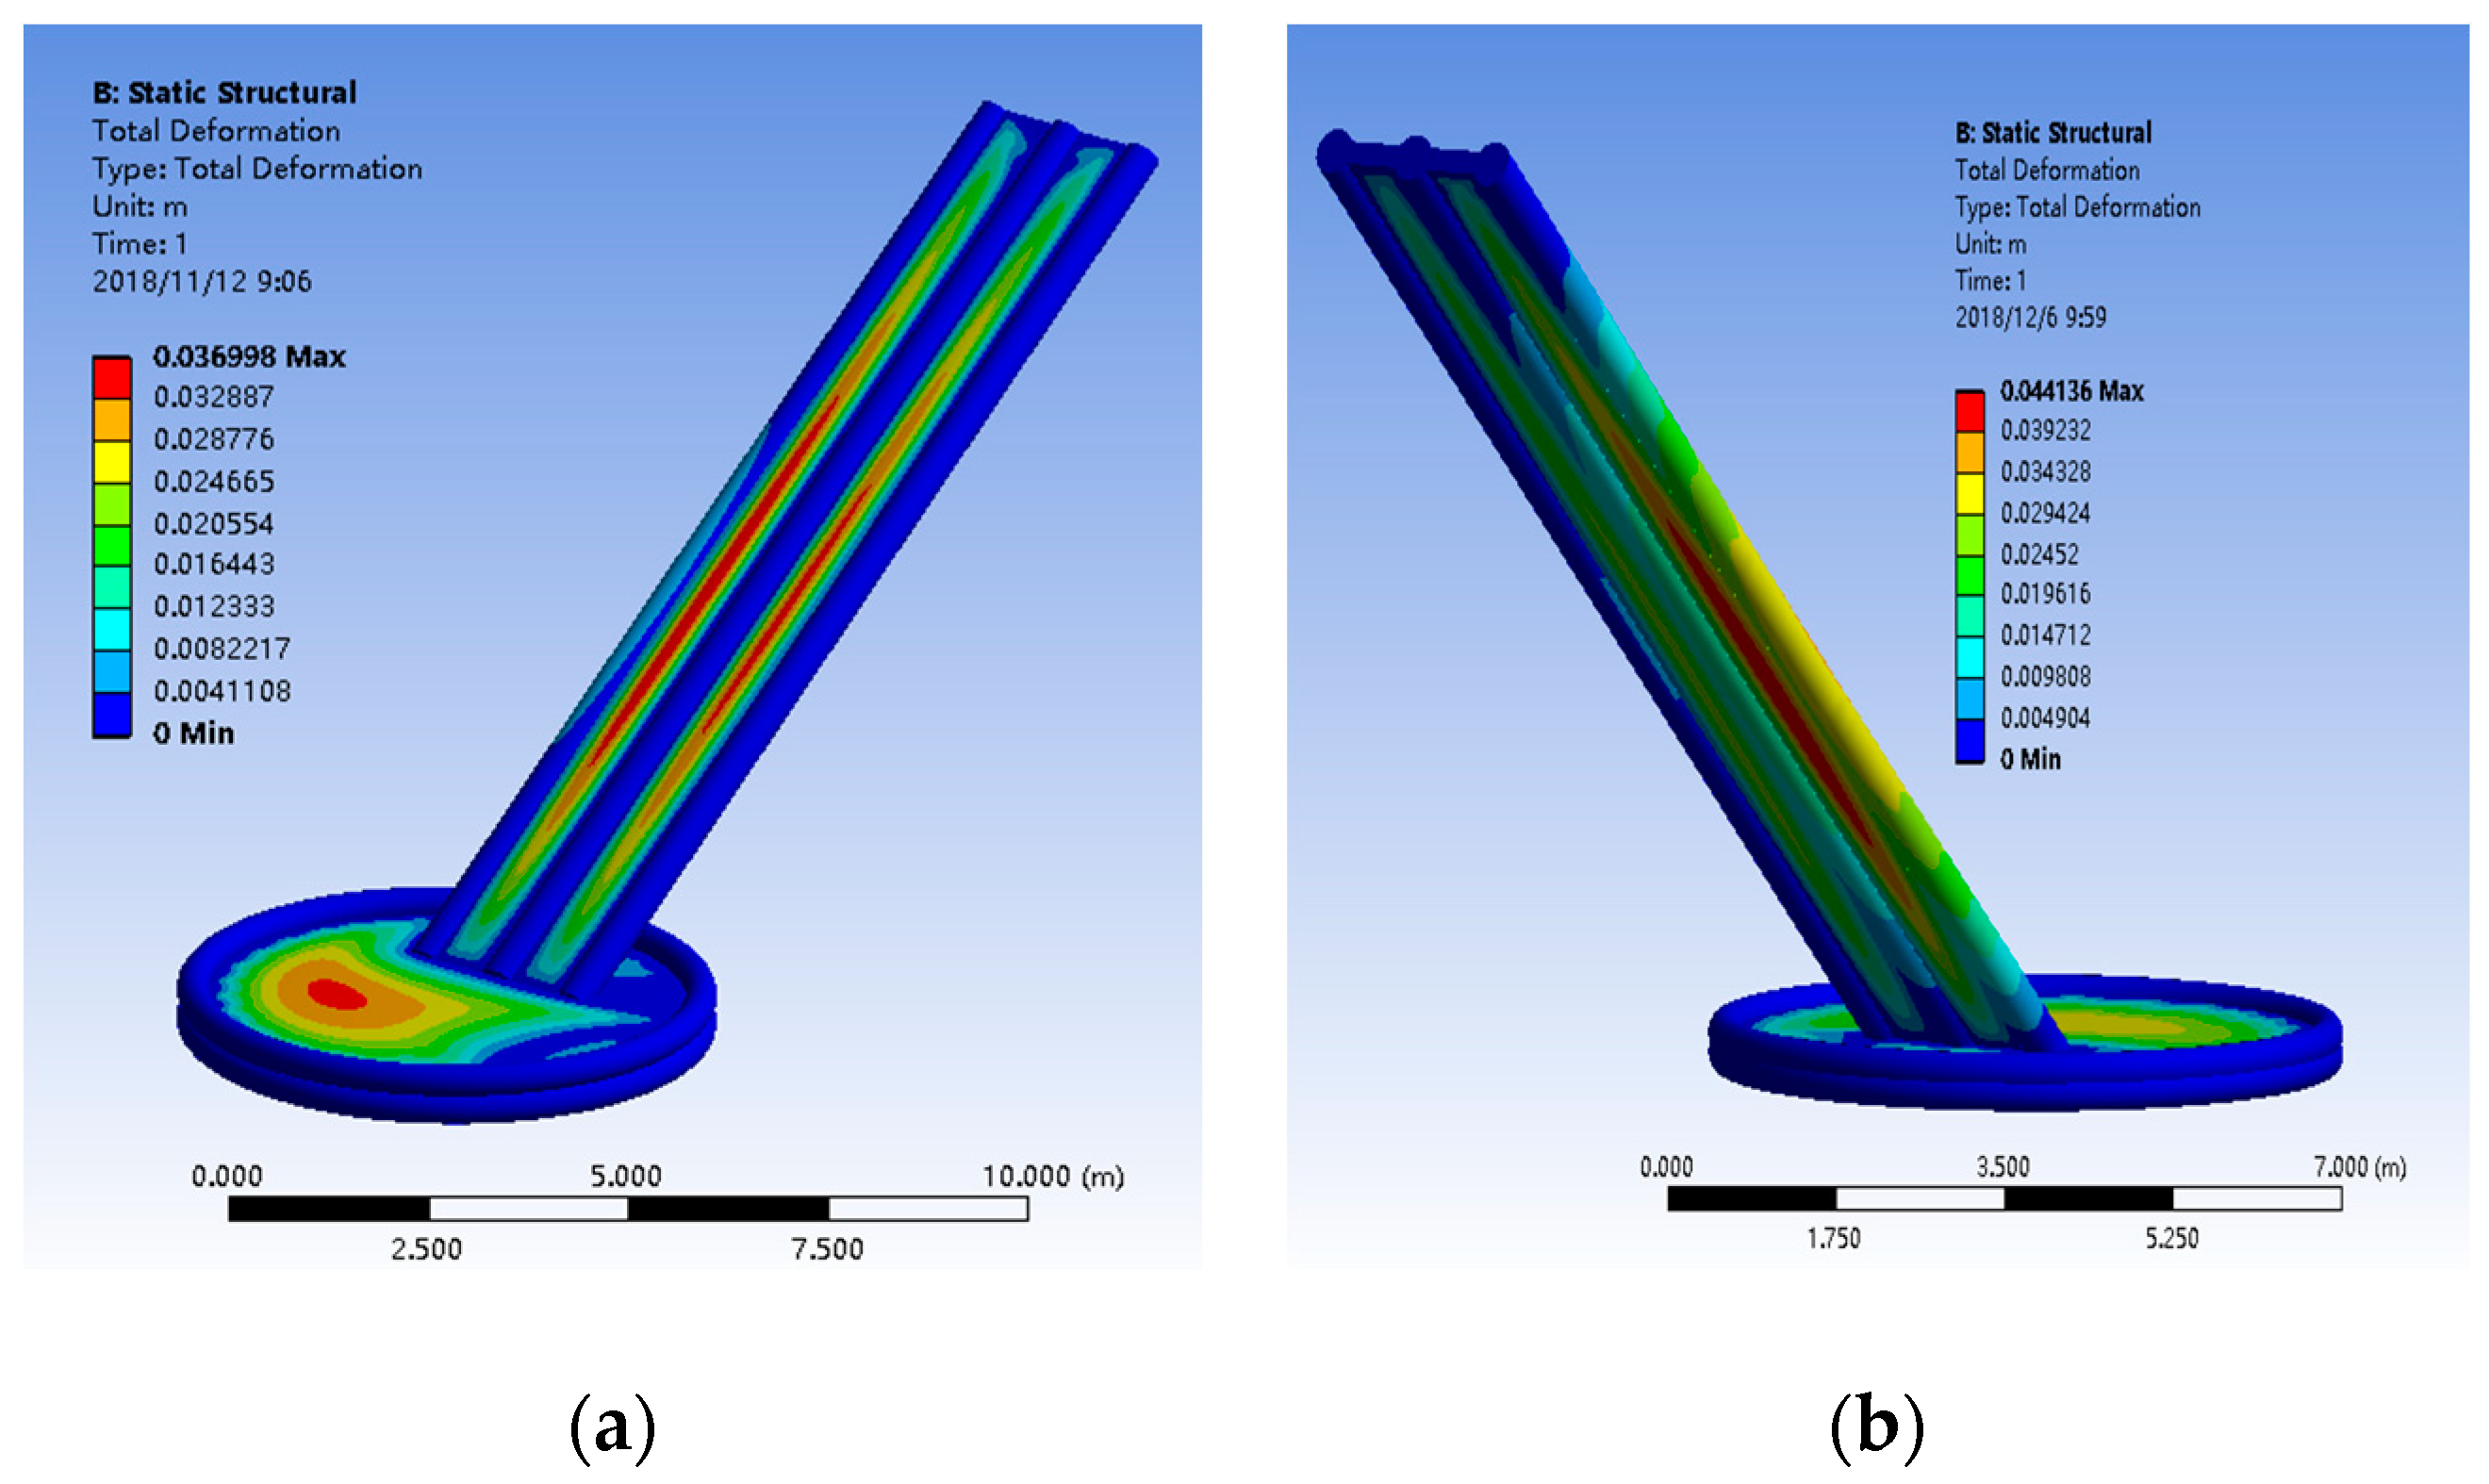
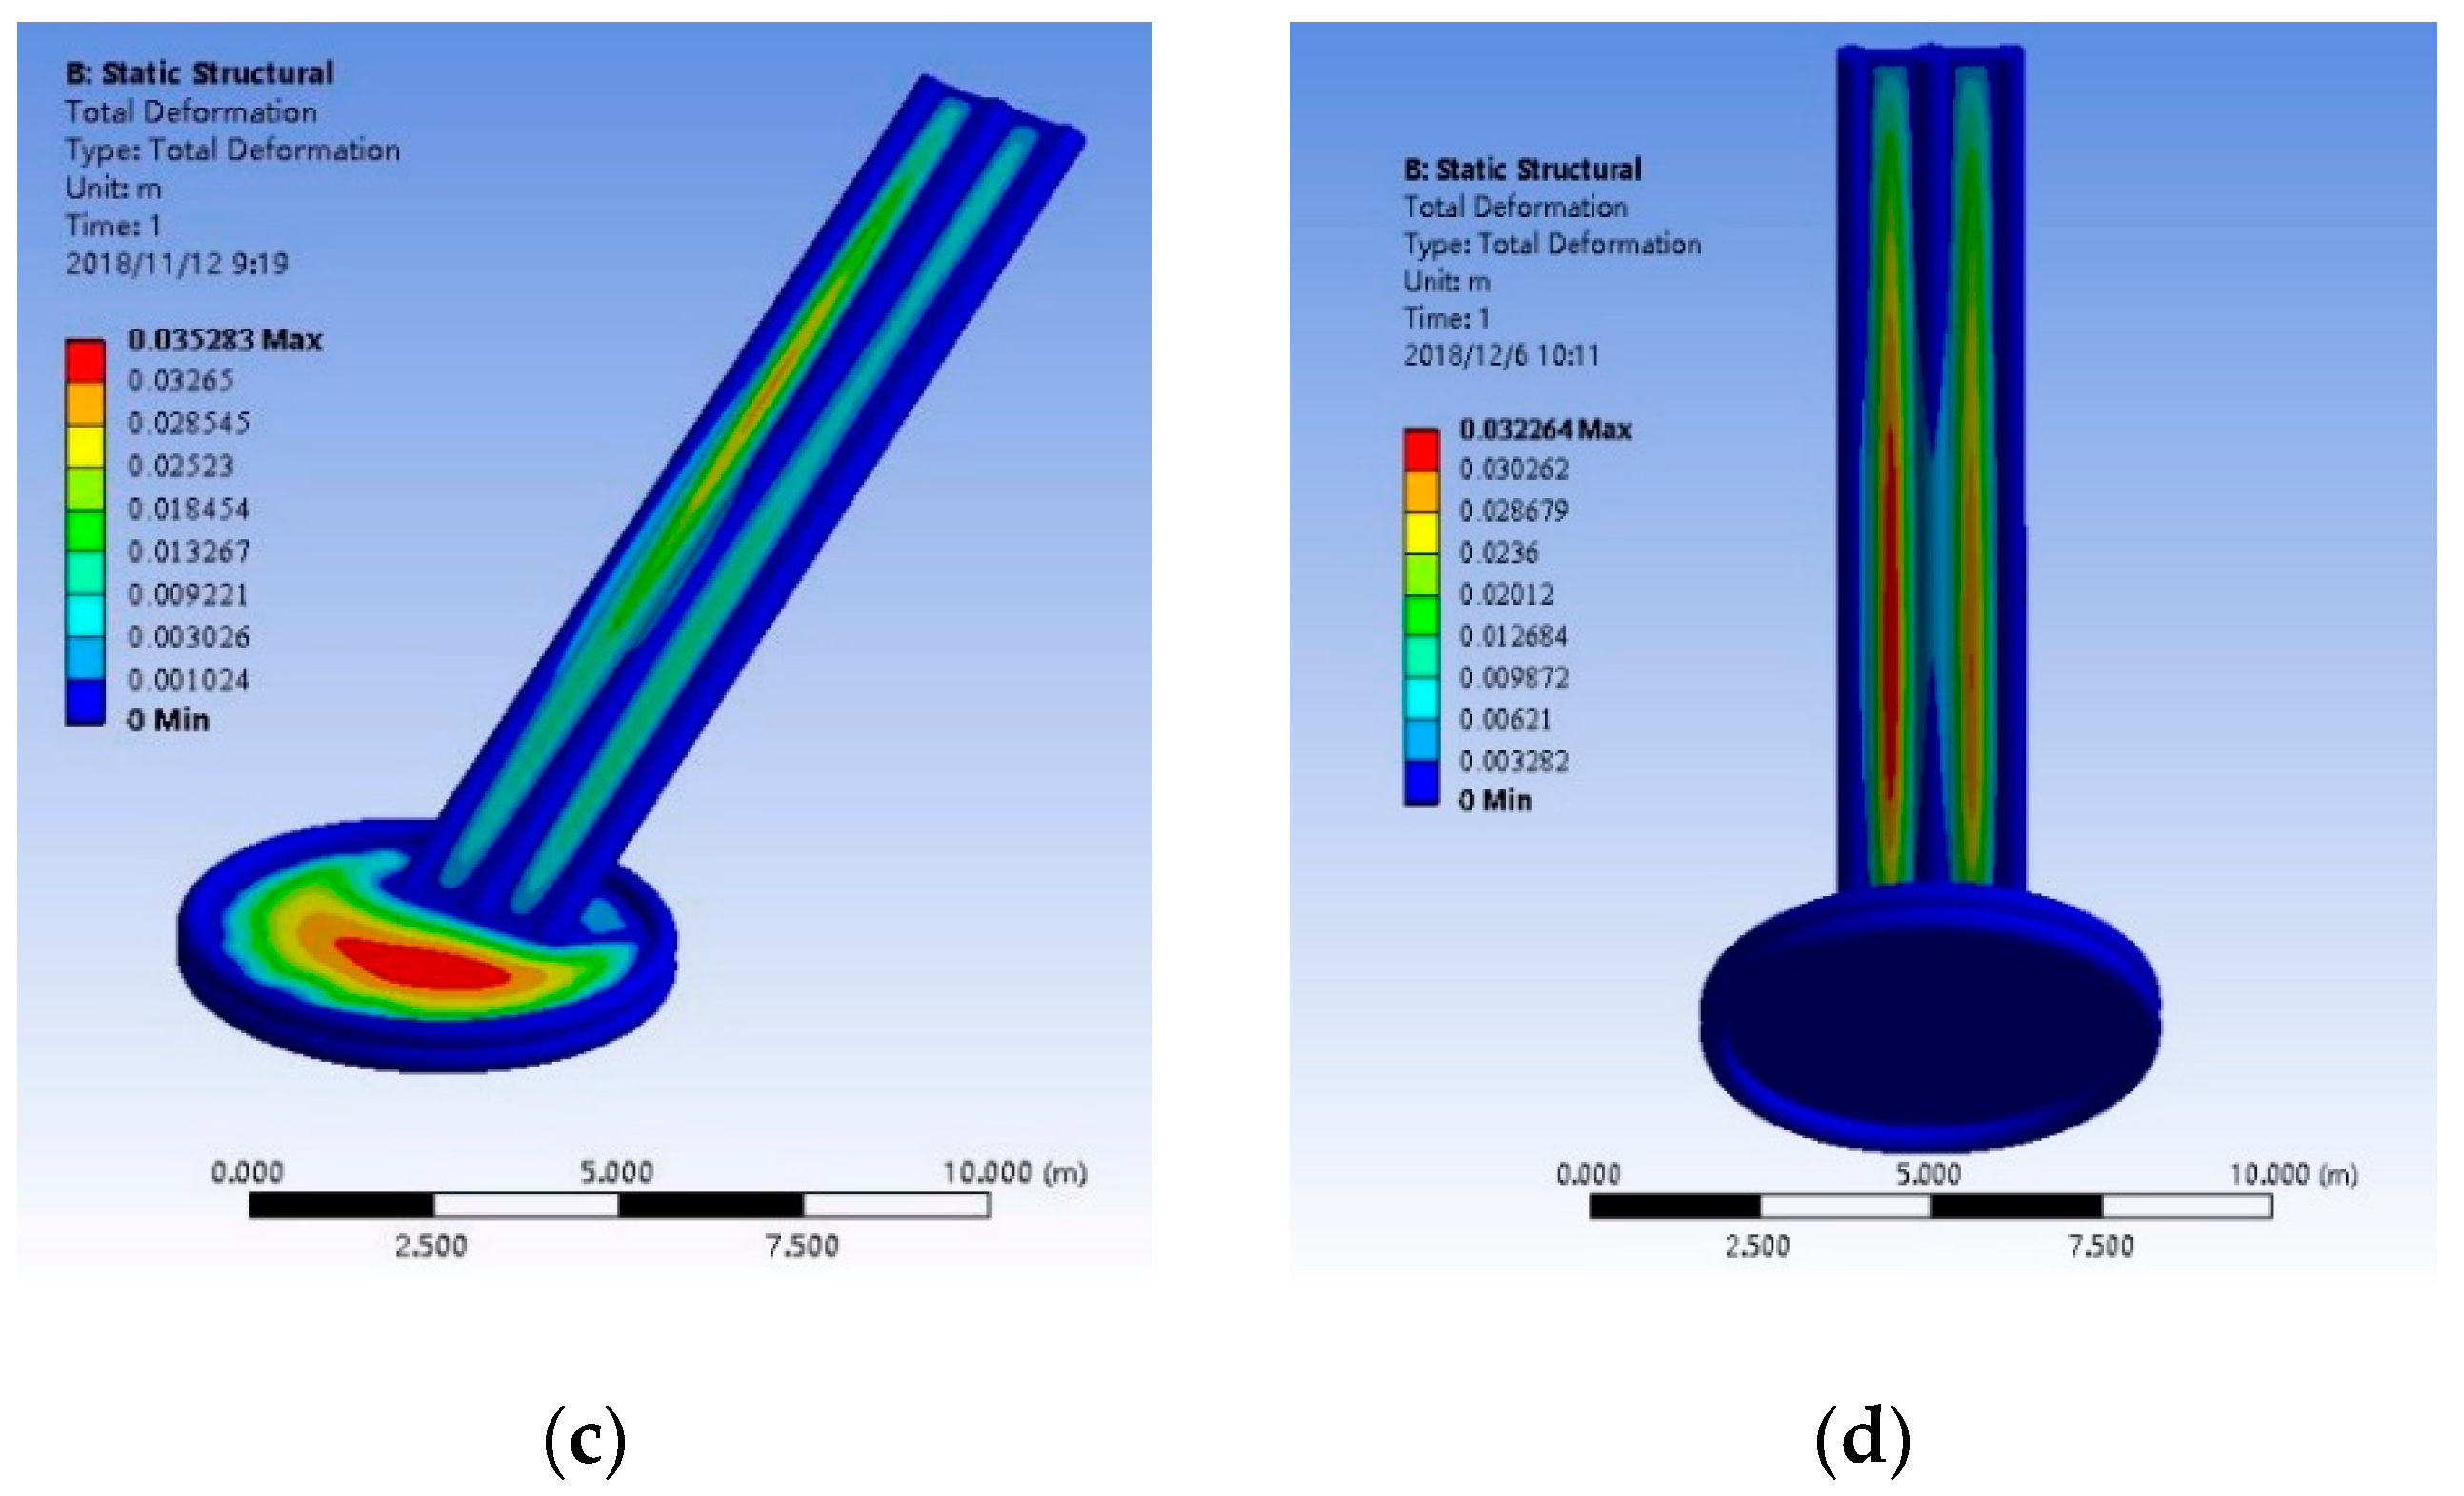
Due to the fluid–solid coupling response, the inflatable slide is deformed by wind loads, which in turn will give feedback to the wind pressure distribution on the surface of the inflatable slide [17]. The numerical simulation of the airflow field of the inflatable slide is carried out under different wind direction angles and the simulation results are obtained. The displacement and deformation of the inflatable slide under different wind directions are shown in Figure 8.
When the wind direction is 0°, the maximum displacement deformation occurs on the surface of the inflatable slide and on the platform area, which is about 0.037 m. When the wind direction is 30°, the maximum displacement occurs at the back of the slide, which is about 0.044 m. This deformation is also the maximum of the displacement deformation of the slide at each wind direction angle. When the wind direction is 60°, the maximum displacement occurs on the surface of the landing platform of the inflatable slide, which is about 0.035 m. When the wind direction is 90°, the maximum displacement deformation occurs at the back of the slide surface, which is about 0.032 m. The displacement extremes under different condition variables are summarized in Table 1.
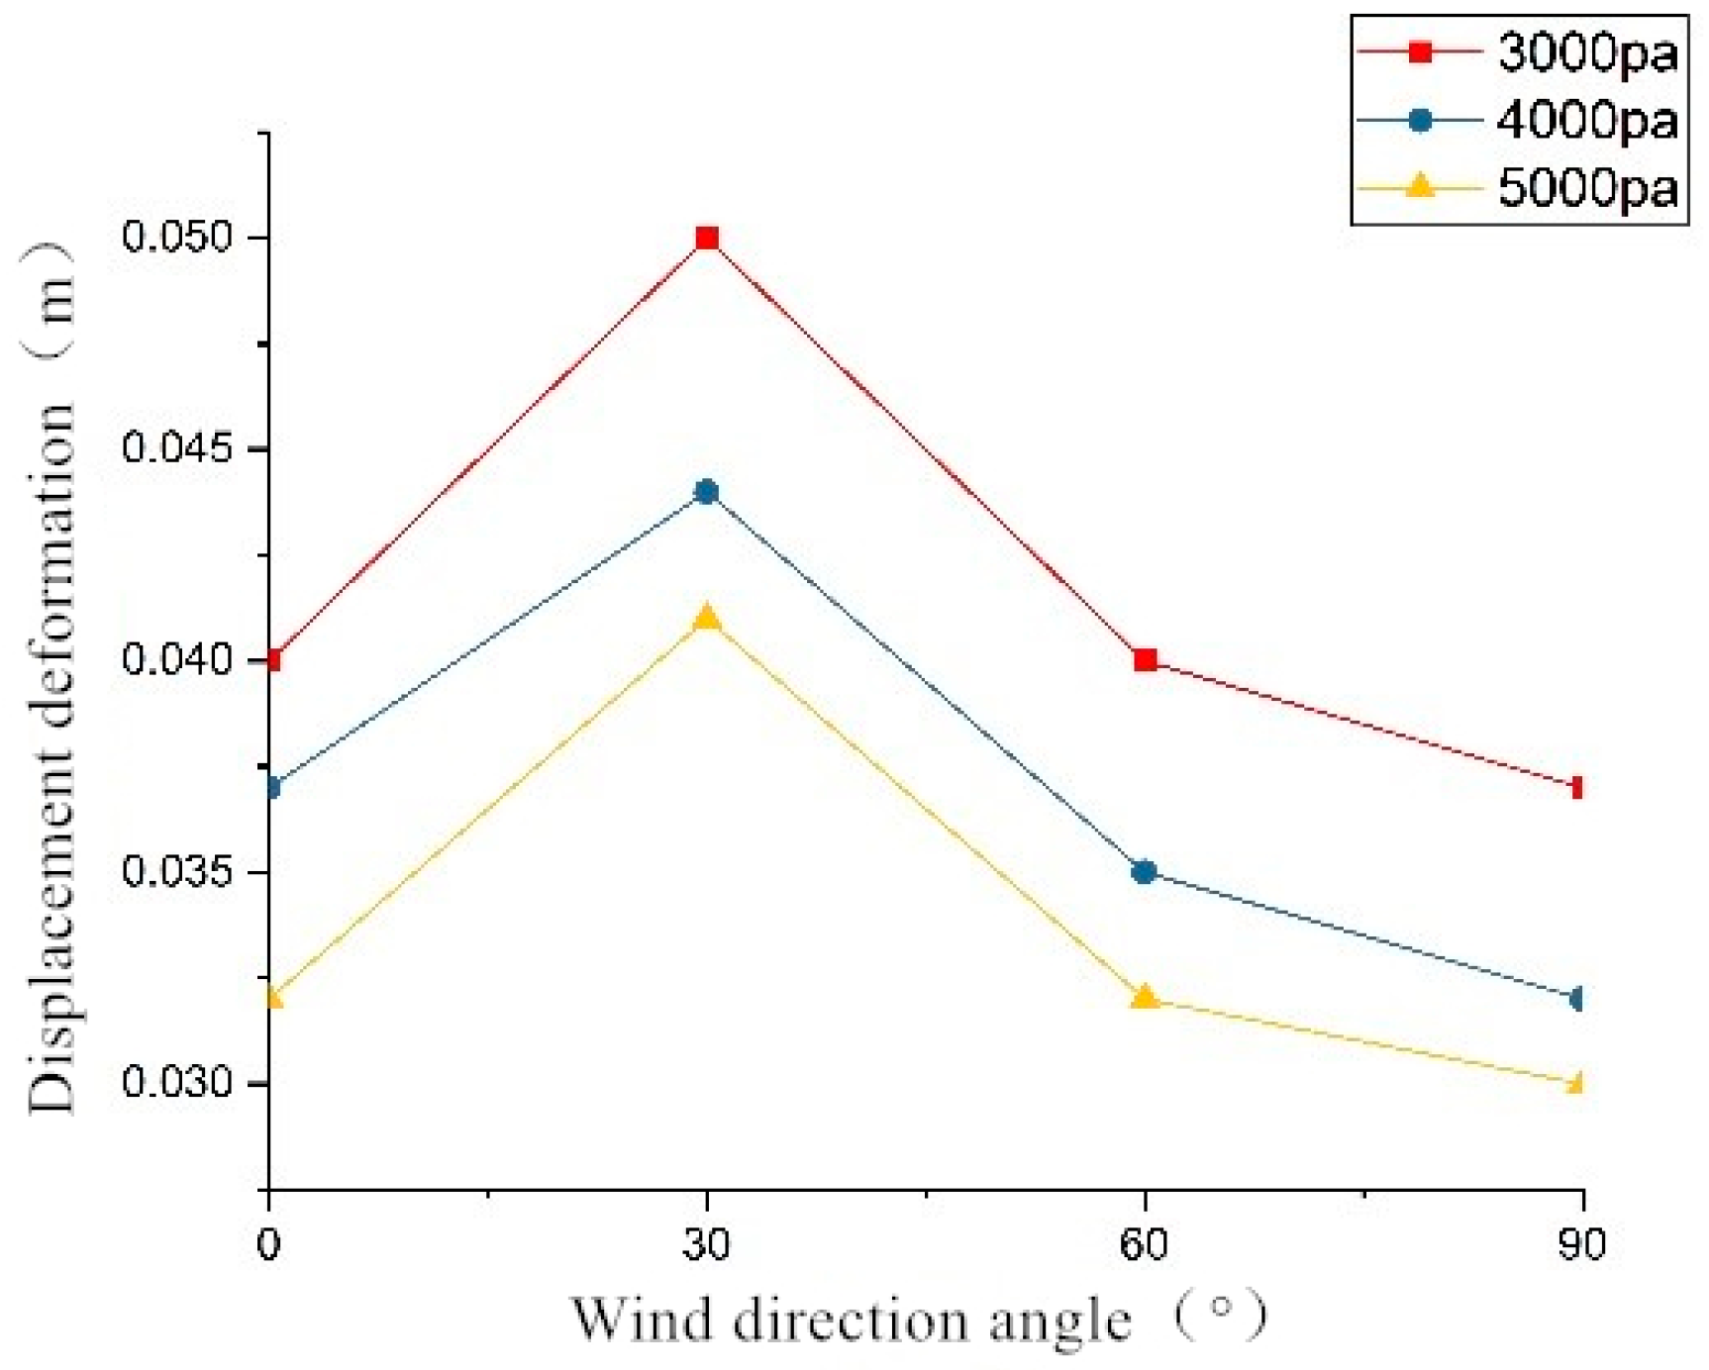
From the above simulation data, as shown in Figure 9, it can be seen that the different wind direction angles have great influence on the displacement deformation of the flexible inflatable membrane. Among the effects of each wind direction angle, the wind direction angle of 30° has the most obvious effect on the inflatable slide, and the displacement deformation is the largest.
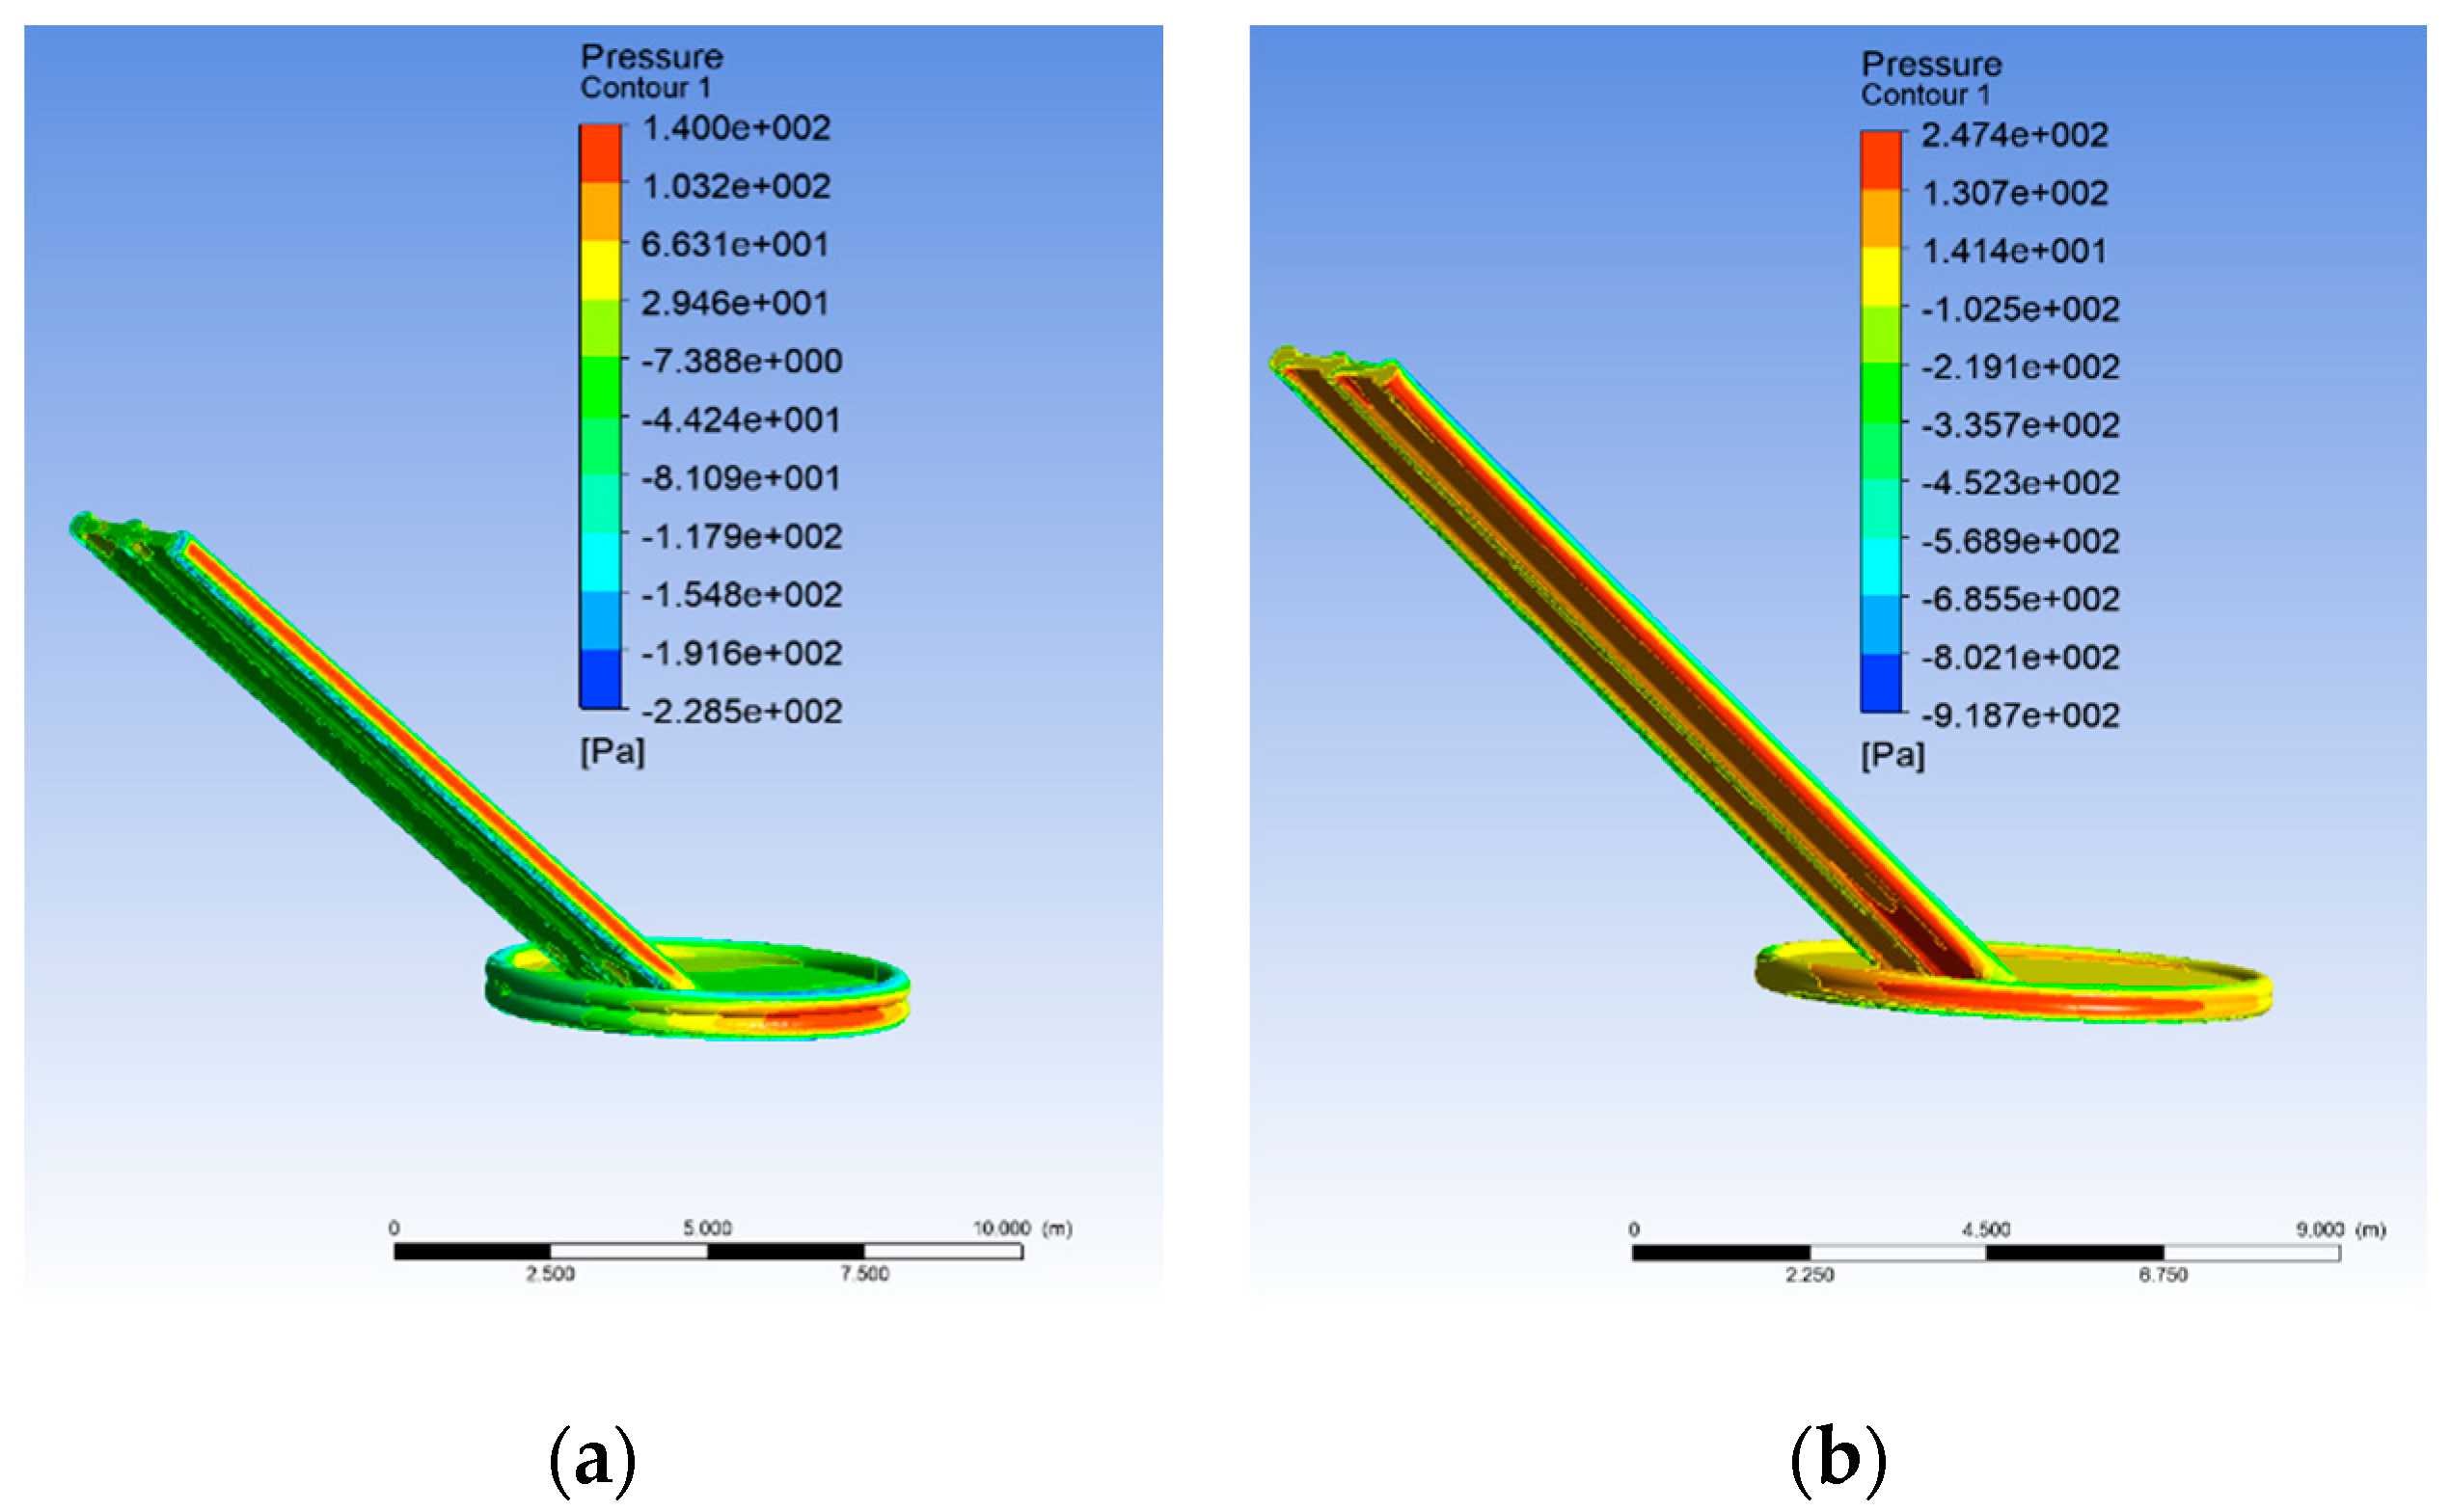
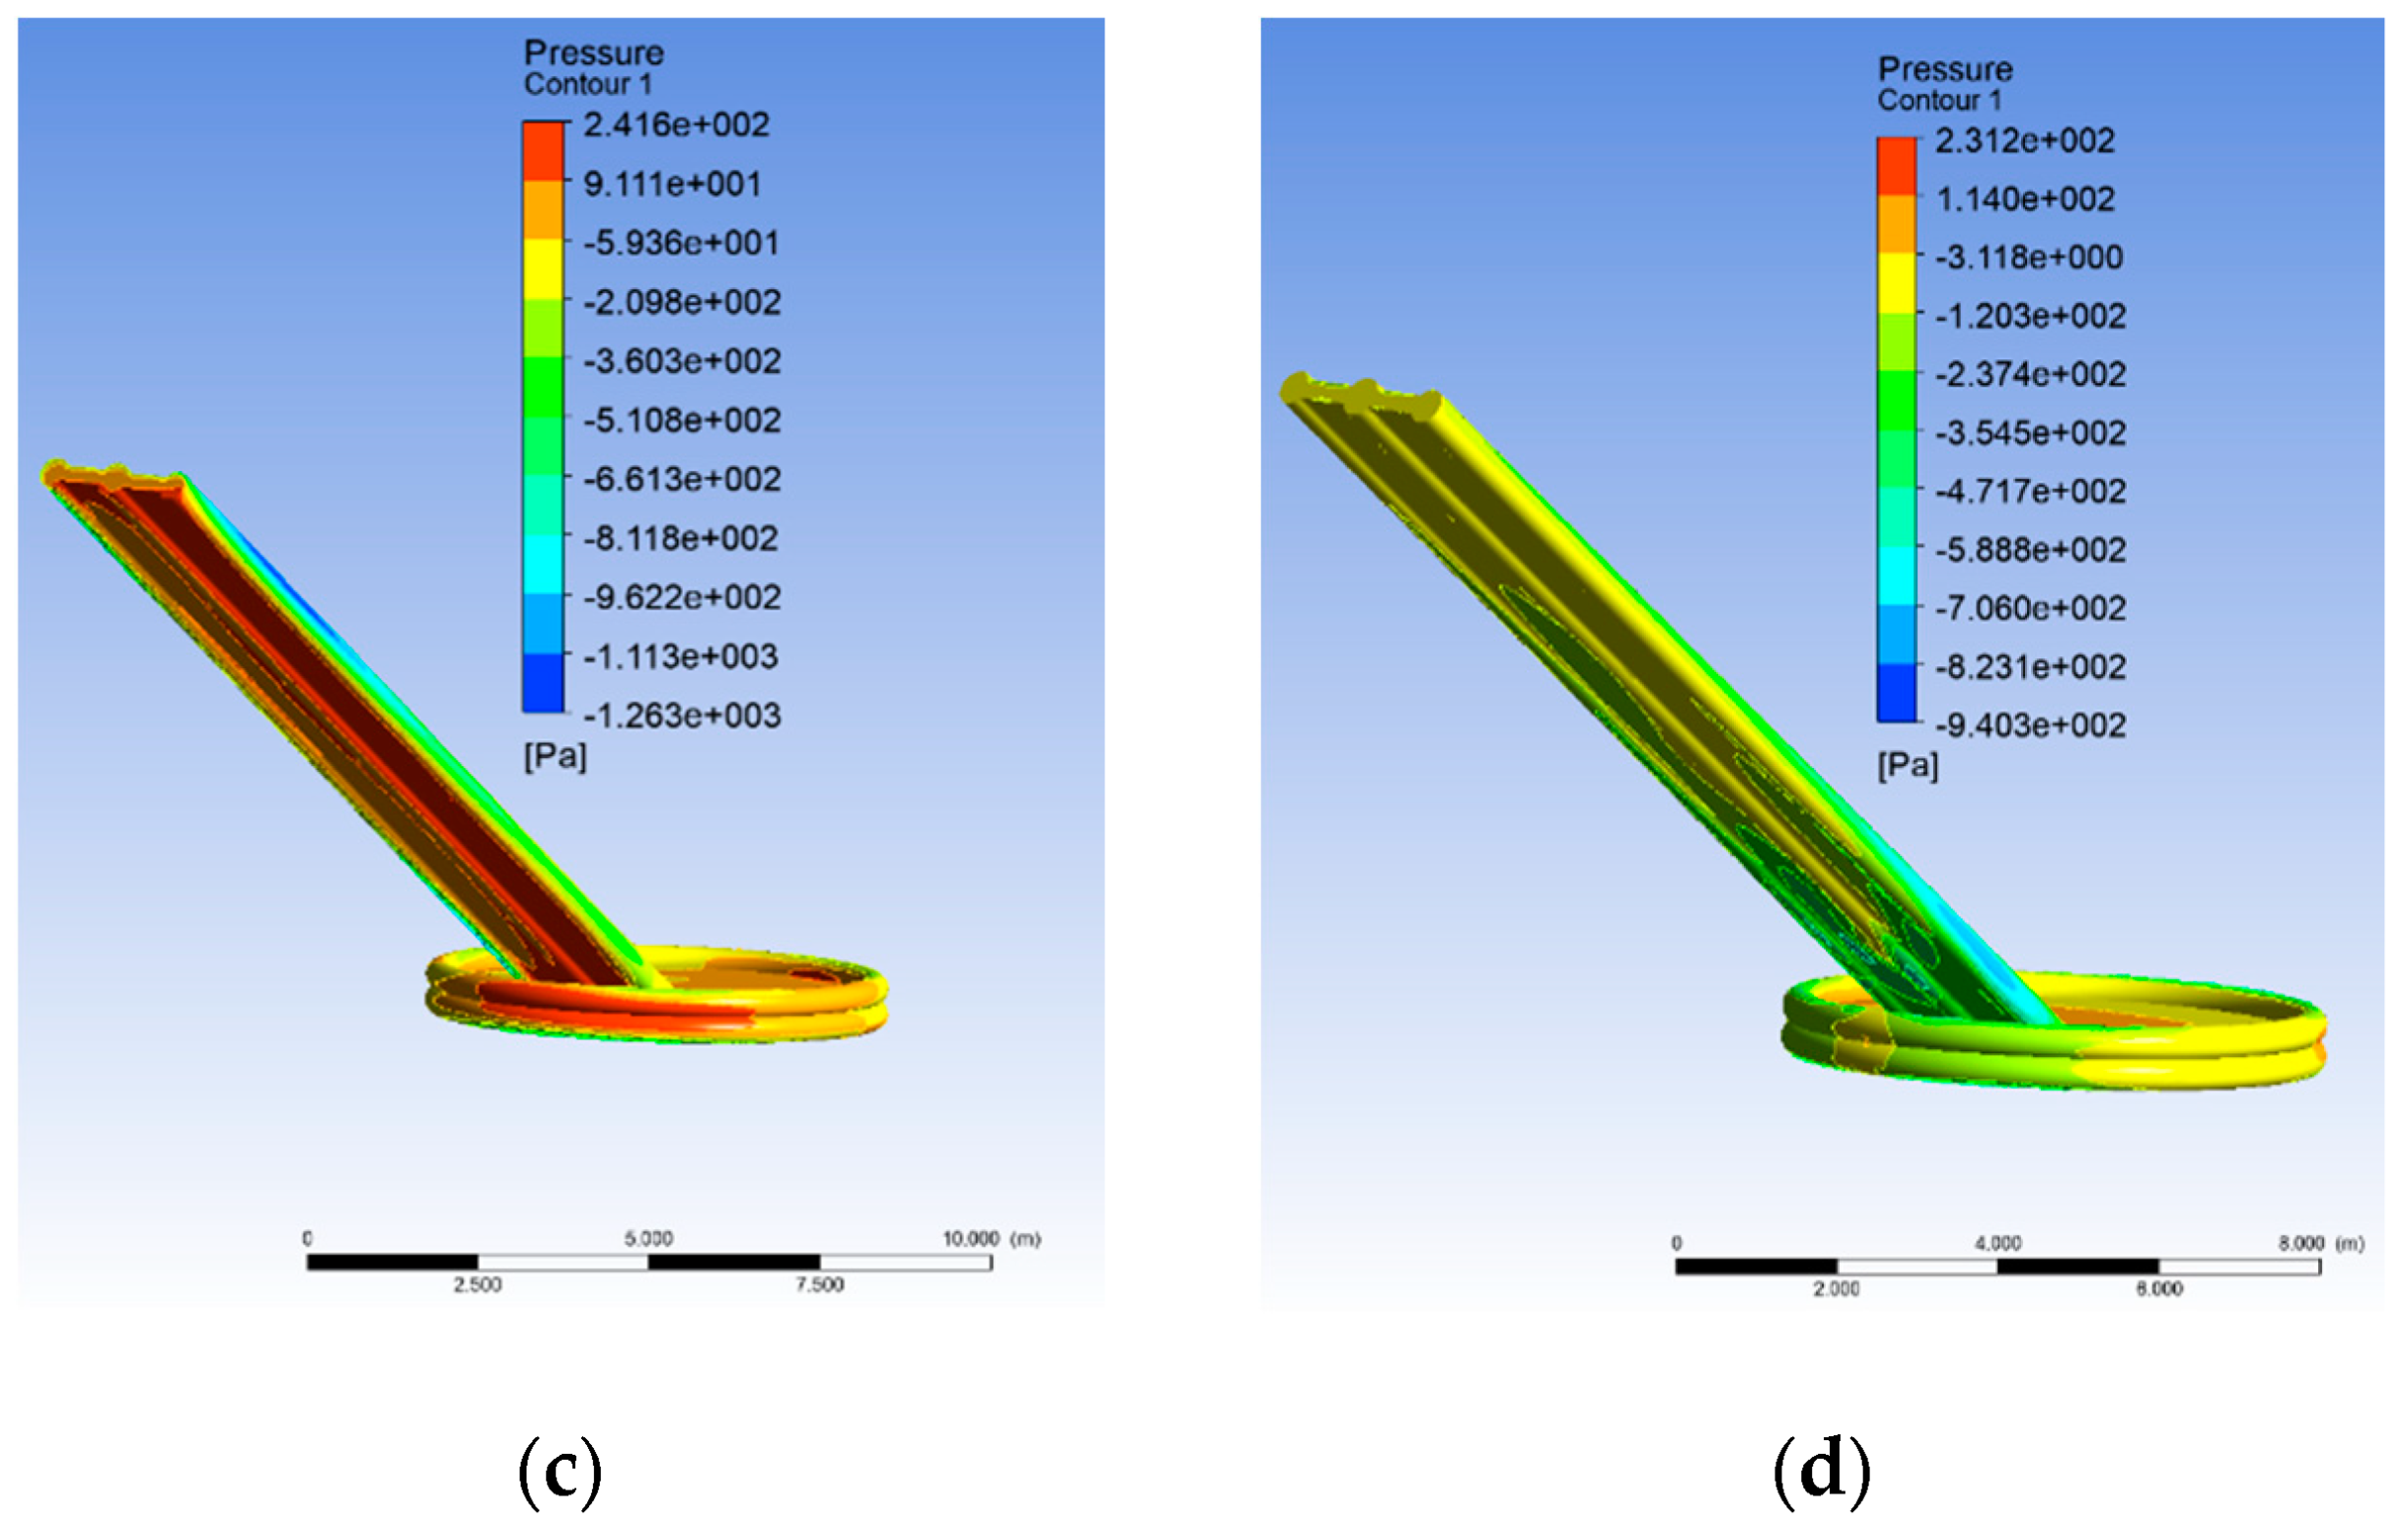
Wind pressure distribution in the wind field is an important factor to measure the stability of the emergency inflatable slide when it is laid out on the sea surface [18]. In the simulation process, if the wind pressure value is positive, then the wind pressure direction is vertical sliding surface inward, while the wind pressure value is negative, then the wind pressure direction is vertical sliding surface outward. In CFX fluid analysis, the distribution of wind pressure will be distinguished according to the numerical value [19]. The boundary of the same color area is called the isoline. The sparse and uniform distribution of the isoline represents the stable change of partial pressure, while the dense distribution of the isoline means the drastic change of wind pressure.
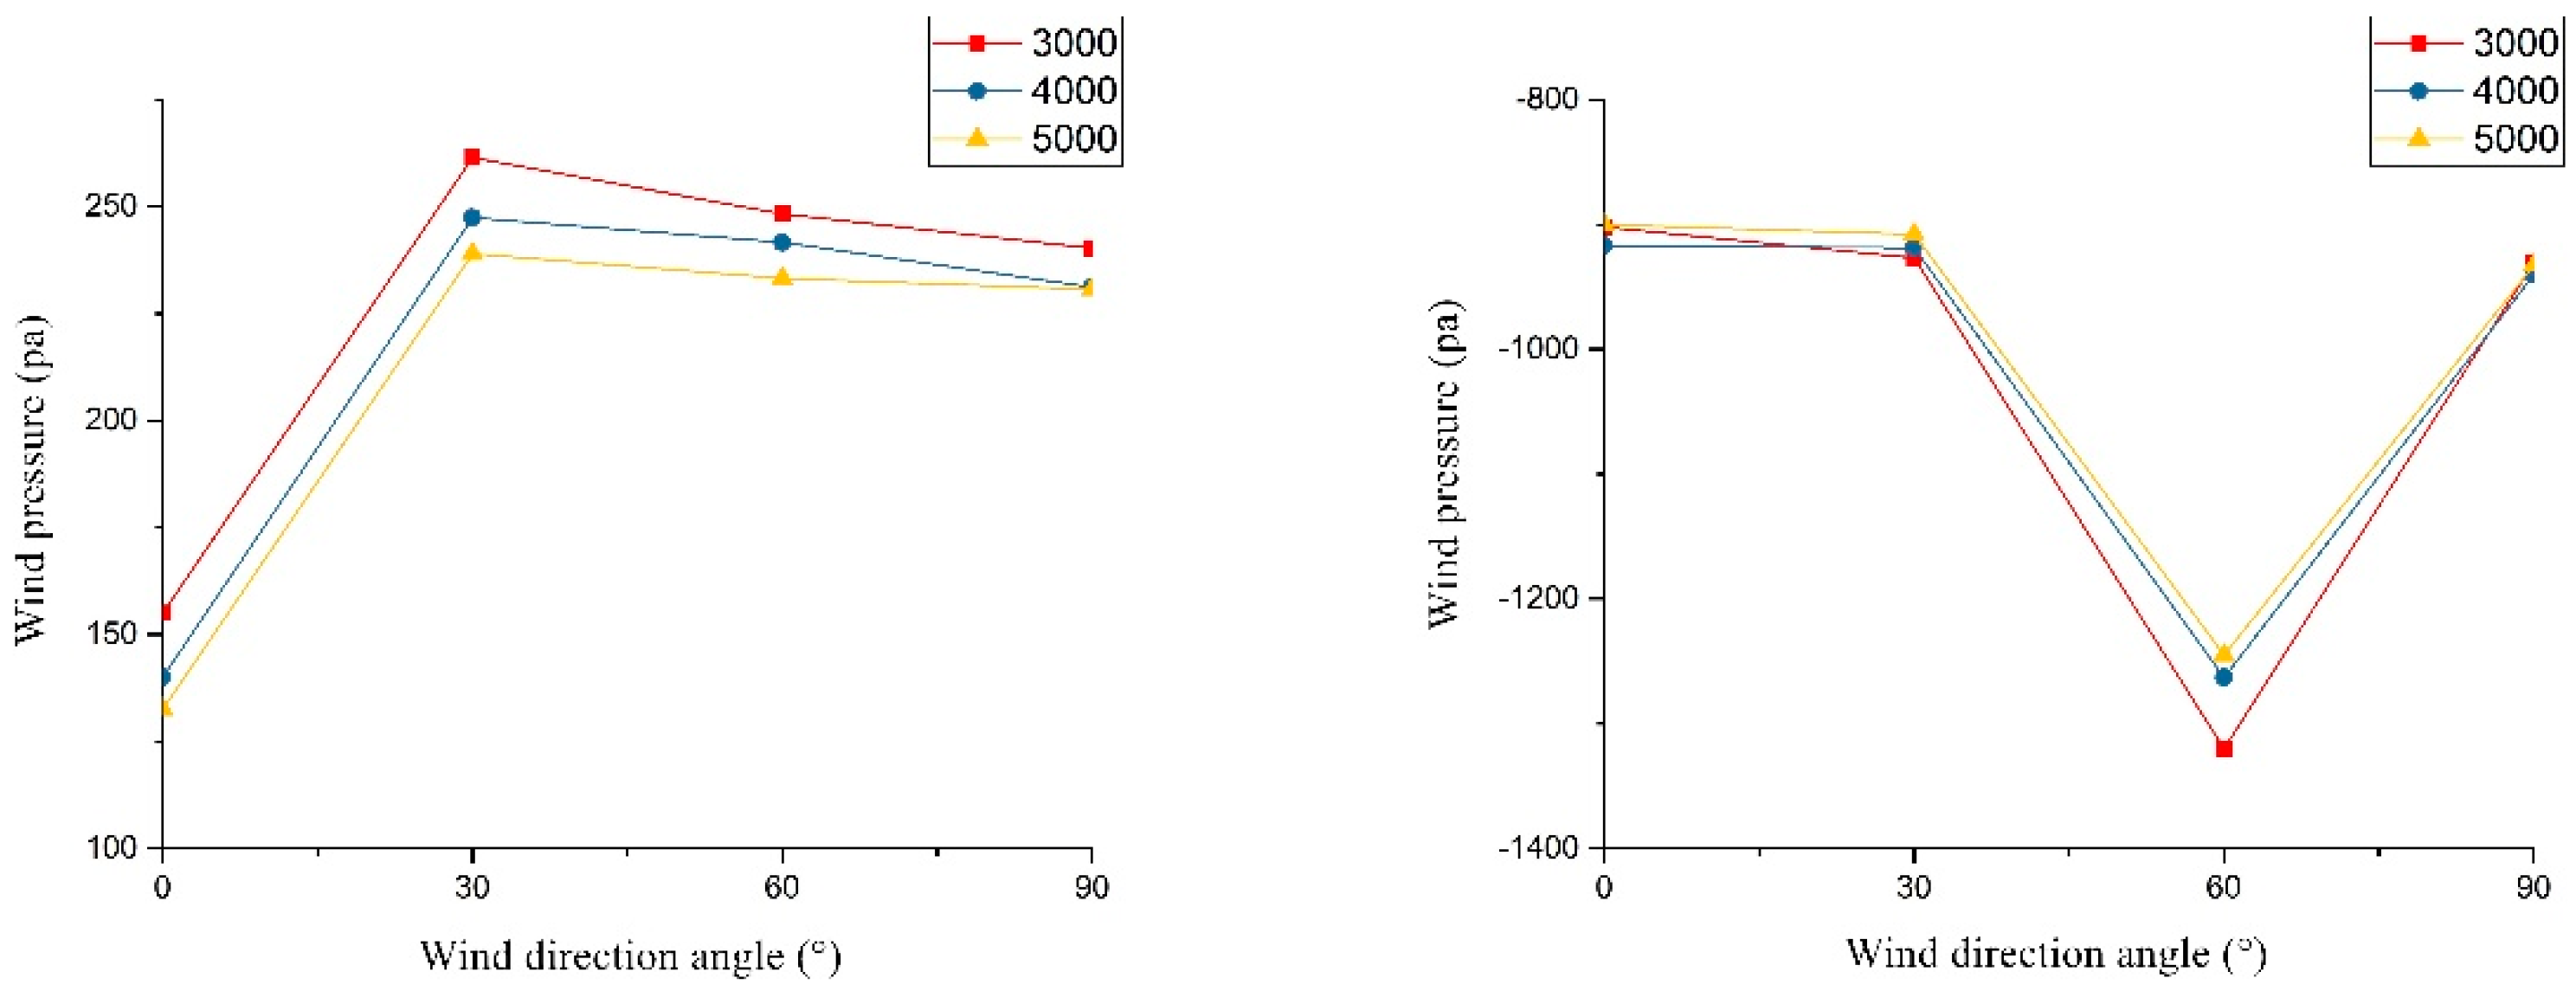
As shown in Figure 10, Figure 11 and Table 2, according to the response analysis of the inflatable evacuation slide under different wind directions, it can be concluded that the maximum displacement deformation and the maximum positive pressure distribution are found in the slide with wind direction angle of 30°, and the maximum negative pressure distribution is found in the slide with wind direction angle of 60°. The distribution of wind pressure under the above two wind directions is asymmetrical and the wind pressure isoline is dense, which proves that the stability of the inflatable slide is poor in this case.

3.2. Wind-Load Response of Emergency Inflatable Slide under Different Wind Speed

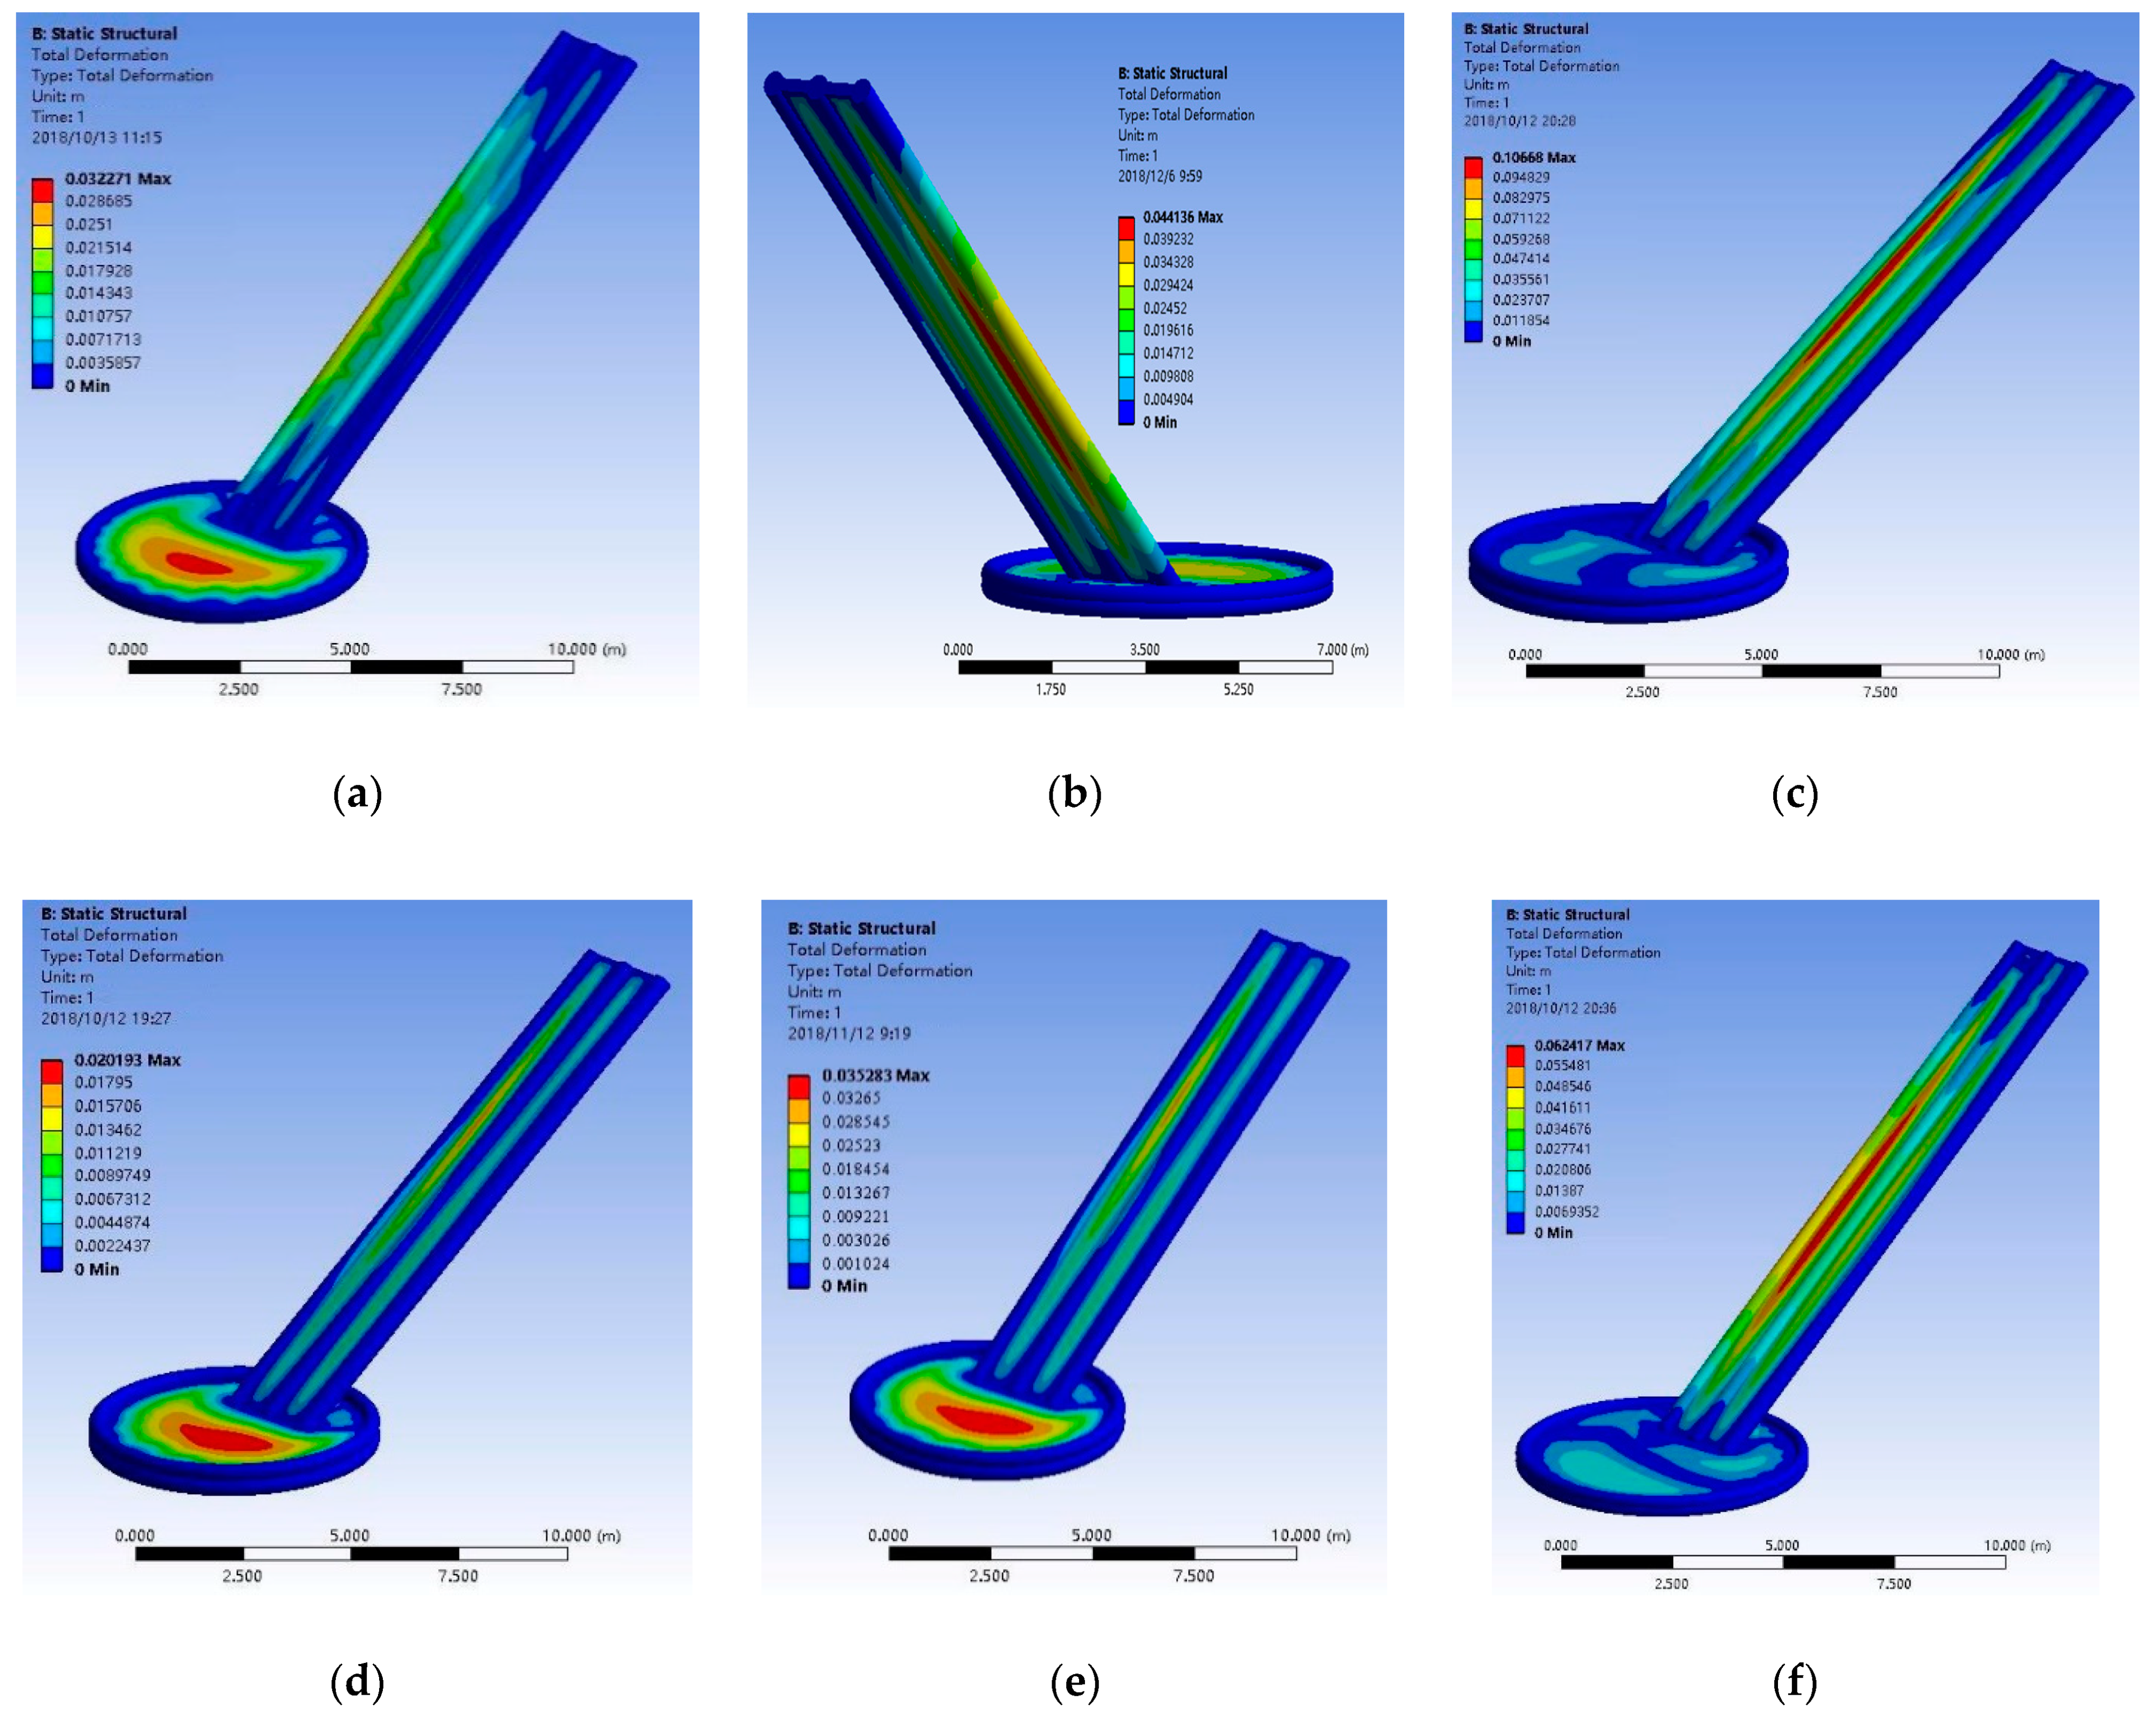
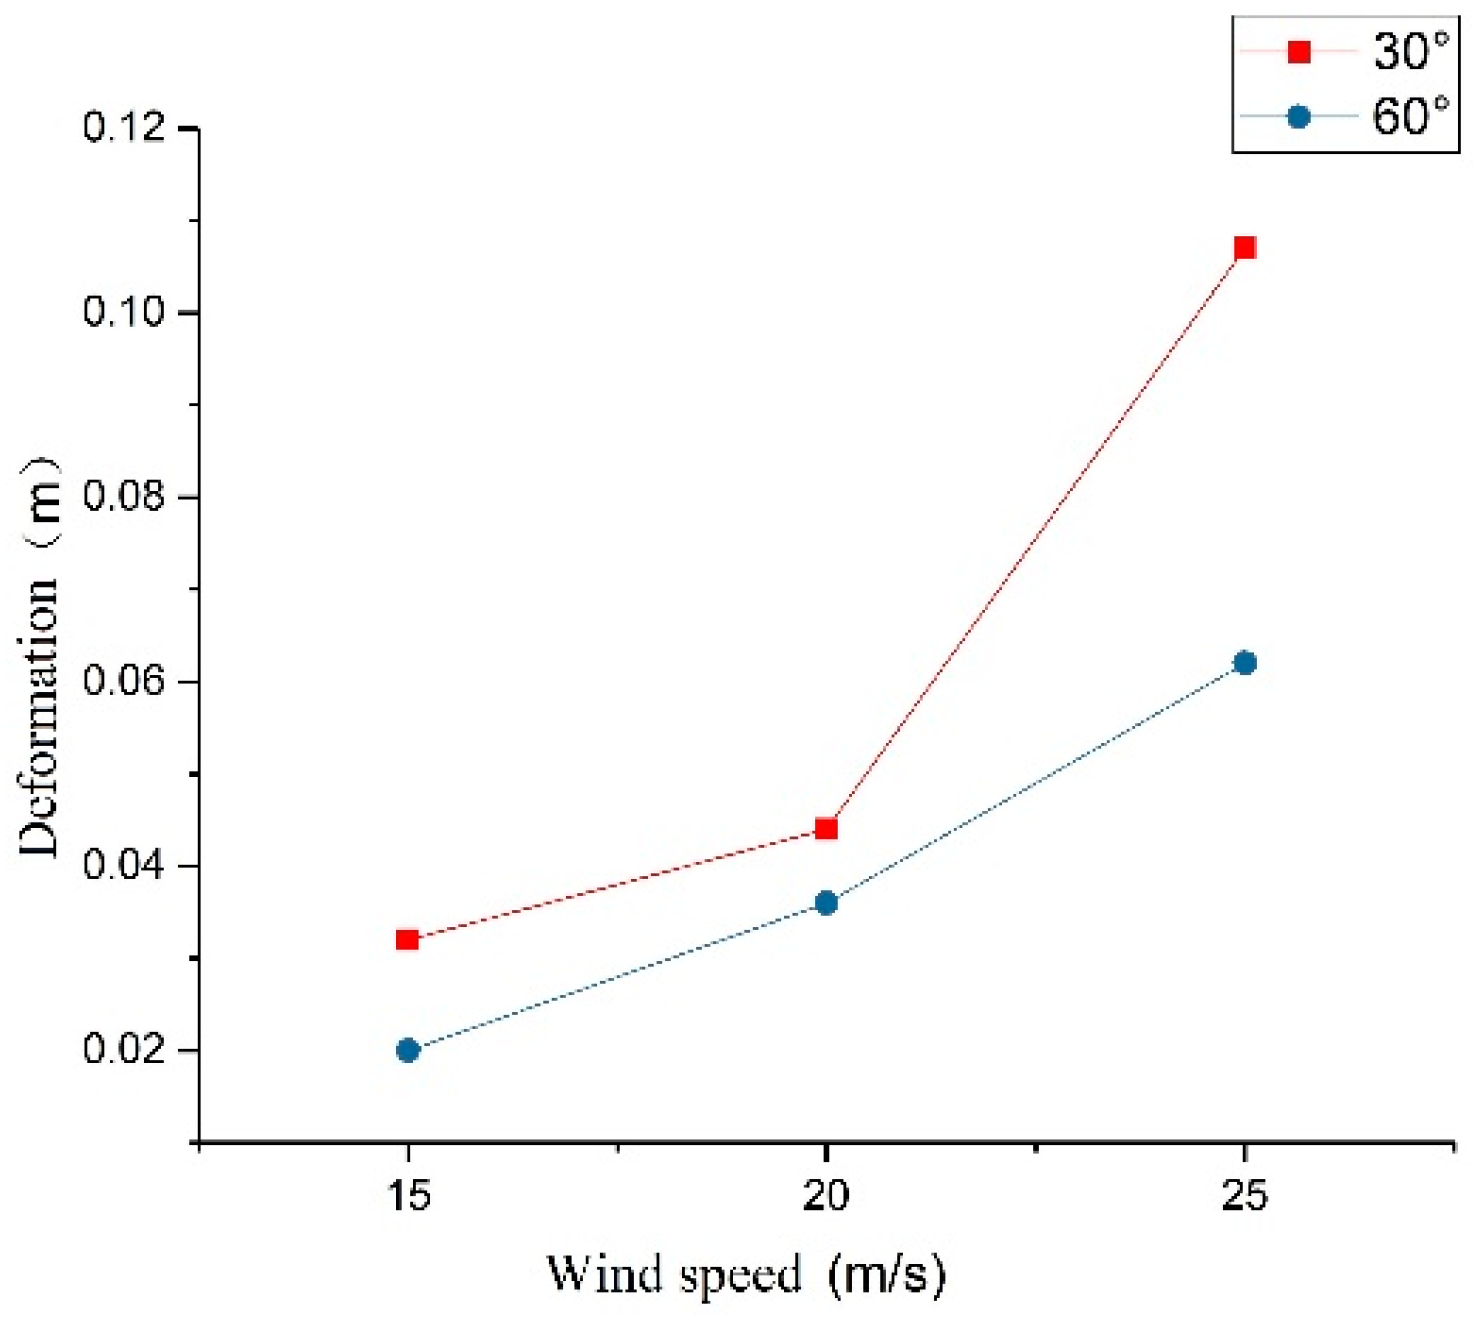
In the design and analysis of sea lifesaving inflatable equipment, the wind speed gradient should be detected, and the simulation wind speed level should be improved appropriately, so as to achieve a sufficient safety factor. The ability to withstand wind speed variations is also a necessary test element for sea surface evacuation equipment [20]. In this section, the displacement and deformation response of the inflatable slide under the wind load of 15 m/s, 20 m/s, 25 m/s, and 30° and 60° wind directions are simulated. The numerical simulation results are shown in Figure 12.
The ability of resisting wind speed variations is tested to find out the most dangerous condition of inflatable slide arrangement, which can be used for the wind-load response analysis of the inflatable slide when air pressure changes.
As shown in Figure 13, according to the results of displacement and deformation of the inflatable slide under different wind speeds, it can be seen that with the increase of wind speed, the displacement and deformation of the inflatable slide under different wind directions increases gradually. The displacement values at a wind direction angle of 30° are higher than those at a wind direction angle of 60° at all wind speed monitoring points. The slope of displacement and deformation growth at a direction angle of 30° is higher than that at a direction angle of 60°. The above shows that the displacement deformation of the inflatable slide under wind load is the largest under the condition of 30° of wind direction angle, and its ability of resisting wind speed change is poor. To sum up, the wind direction angle of 30° is the most disadvantageous condition for emergency evacuation of inflatable slide.

3.3. Wind-Load Response of Emergency Inflatable Slide under Different Inflation Pressure

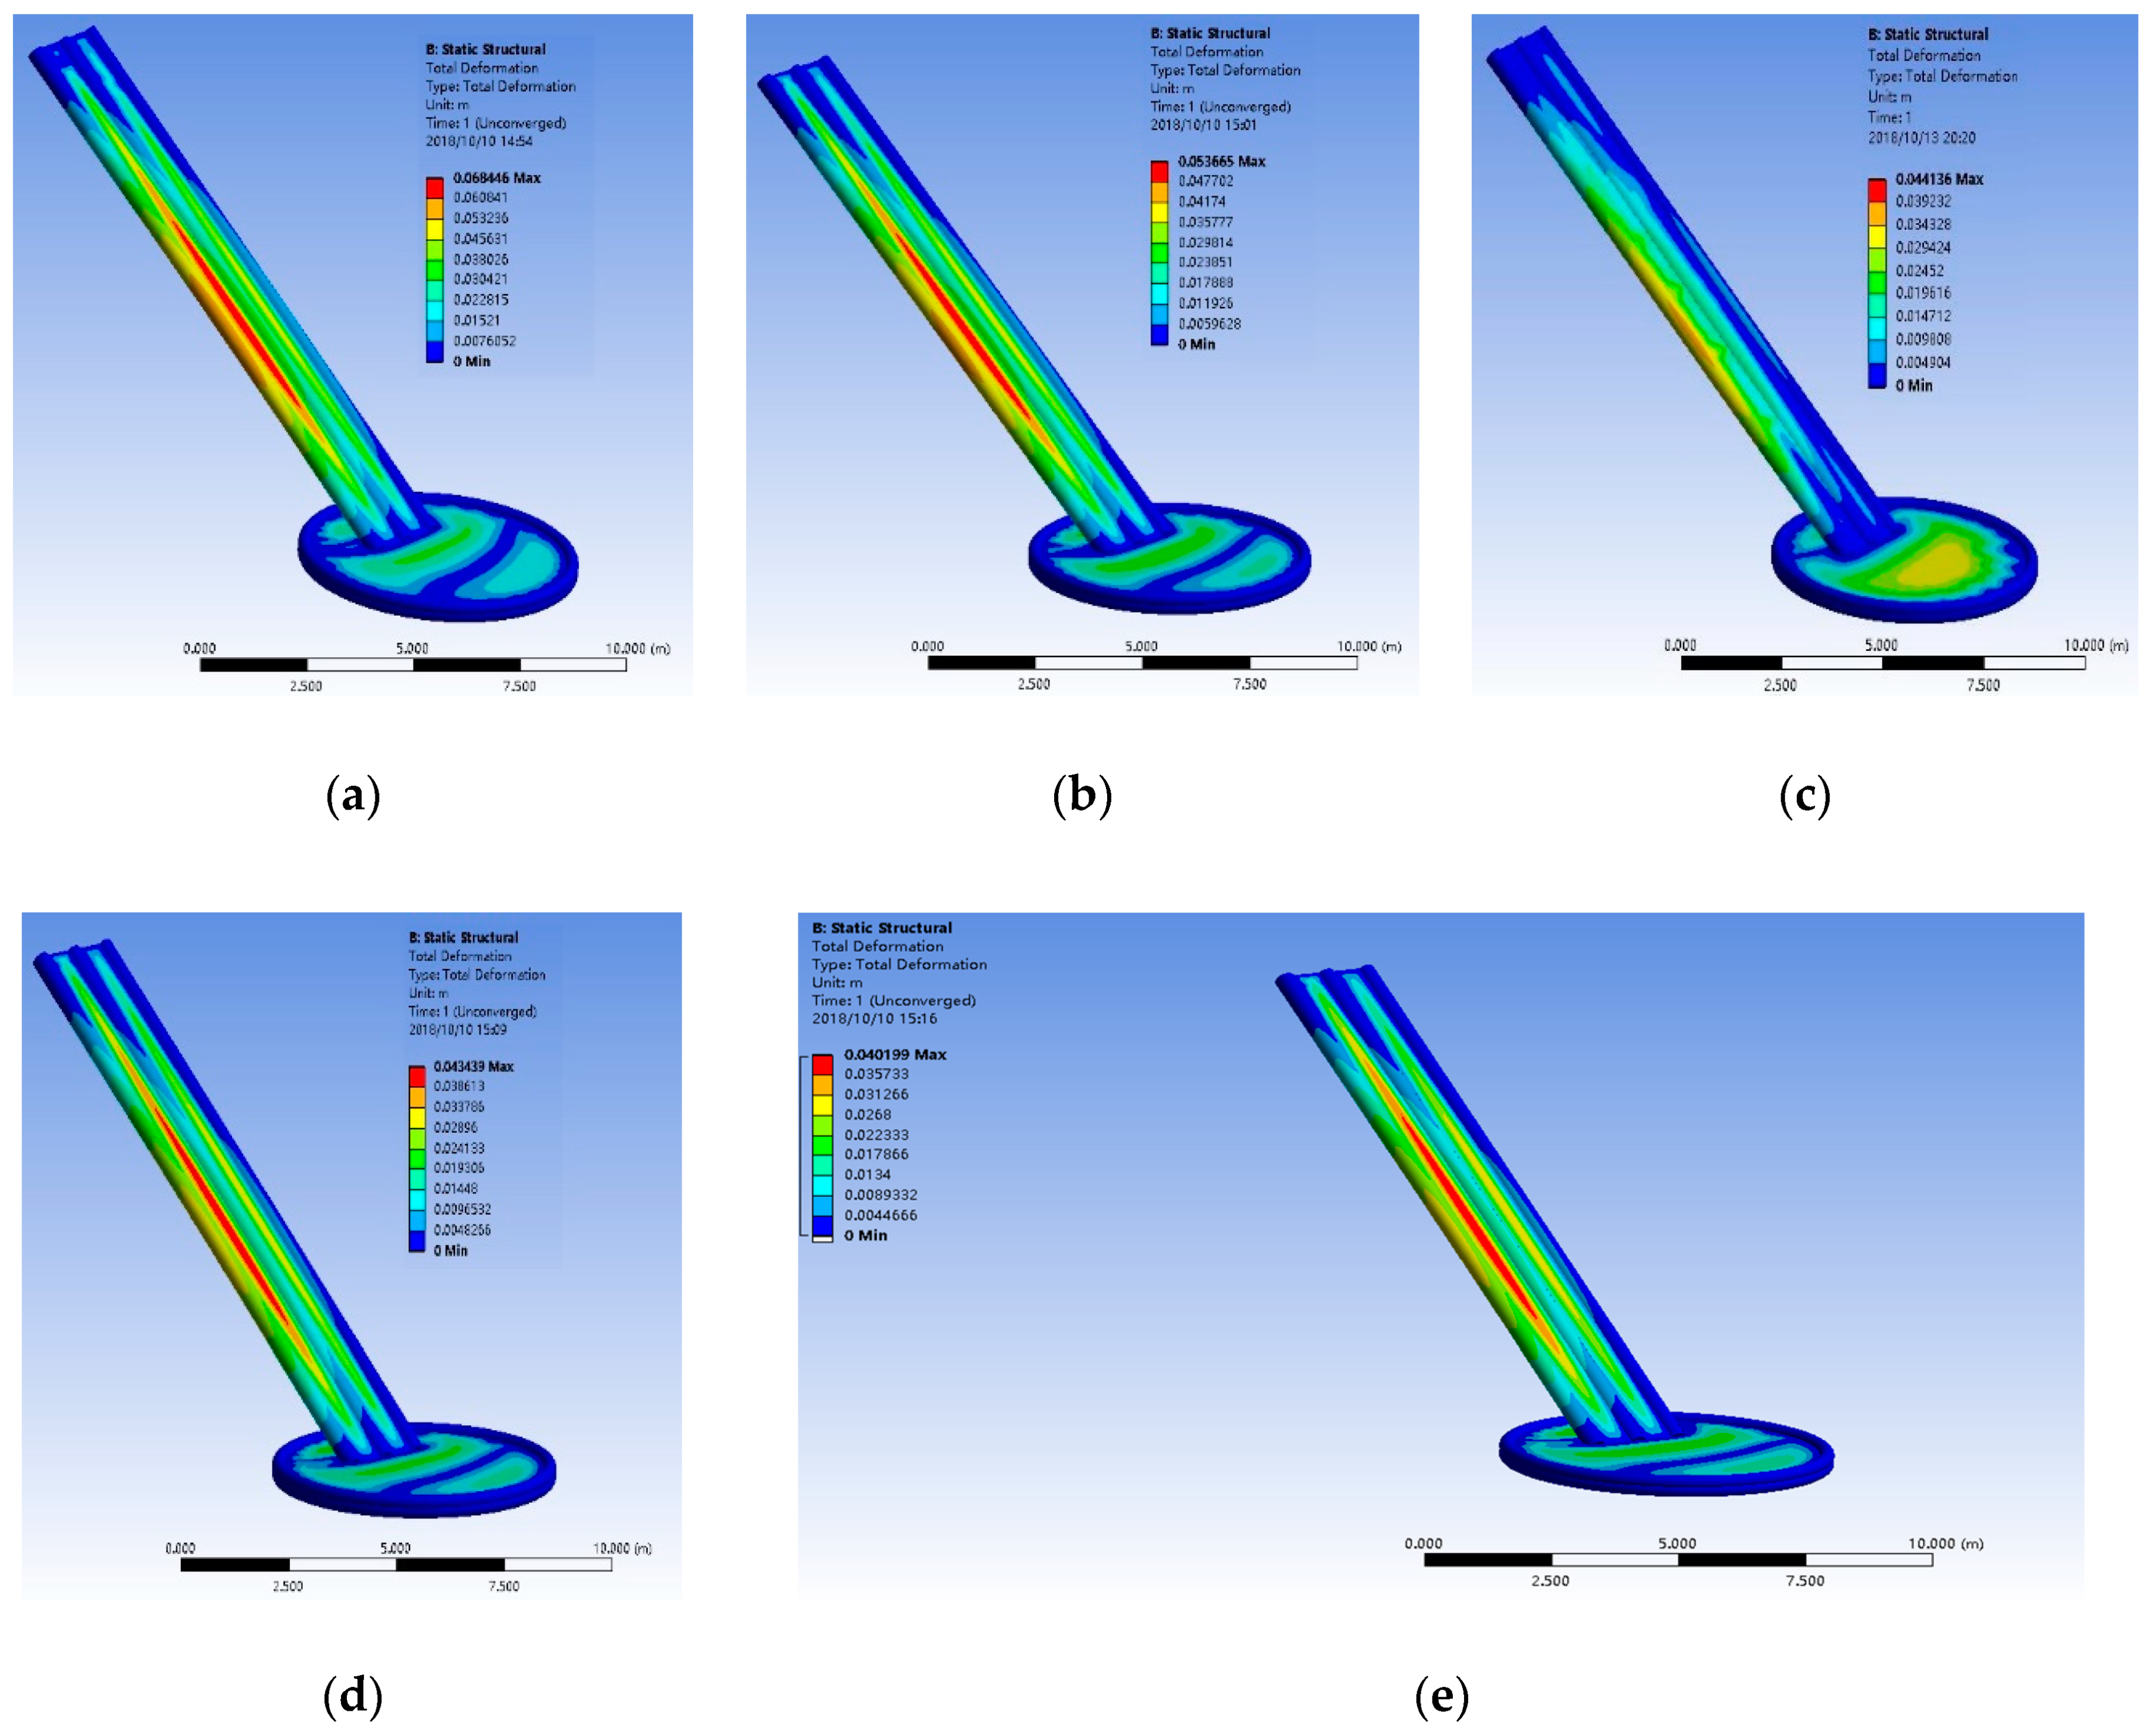
From the content of the previous section, it can be seen that the wind direction angle of 30° is the most disadvantageous condition considering the changes of wind direction and speed. This section will not analyze the other working conditions. It will study the response of the internal pressure of the structure to the wind load by changing the inflatable internal pressure for the representative wind direction angle of 30°.
The inflatable internal pressure range is 3000 Pa, 3500 Pa, 4000 Pa, 4500 Pa, and 5000 Pa. As shown in Figure 14, the simulation results show that with the increase of the internal pressure of the inflatable slide, the displacement deformation decreases, which indicates that the increase of the air pressure obviously improves the anti-wind stiffness of the slide.
It can be seen from Figure 15 that when the inflatable internal pressure is lower than 4000 Pa, the displacement deformation of the inflatable slide decreases obviously with the increase of the internal pressure. When the inflatable internal pressure is higher than 4000 Pa, the displacement deformation of the inflatable slide no longer changes significantly, and the range of change is within 1 cm, which can meet the requirements of use. Under the action of wind load, there exists ideal internal pressure in the slide of the emergency evacuation system. When the internal pressure is lower than the ideal internal pressure, the displacement deformation changes greatly and does not reach enough rigidity. When the ideal internal pressure range is reached, the displacement deformation changes are no longer obvious. Redundant inflatable internal pressure means that the evacuation system needs to carry more gas cylinders, which will occupy more storage space and prolong the time of inflatability and deployment of the facilities, thus reducing the speed of the evacuation system.
Within the range of inflatable internal pressure studied in this section, 4000 Pa is an ideal inflatable internal pressure.

4. Simulation and Analysis of Inflation and Evacuation Efficiency of Emergency Evacuation Inflatable Slide

According to the International Safety Rules for High-Speed Vessels, the design of evacuation facilities should enable ships to evacuate passengers completely within the evacuation time under controlled circumstances [21]. The evacuation time ( T e ) is one third of the structural fire protection time ( S F P ) of the main fire hazard area minus the 7 min required for the initial detection of danger and removal of the hazard [22].
T e = S F P 7 3
In the Equation, S F P is the time of structural fire protection (min). The time of structural fire prevention of high-speed ships studied in this paper is 30 min, and the evacuation time is calculated as 7 min.

4.1. Validation and Simulation of the Inflation Process of Emergency Evacuation Slide

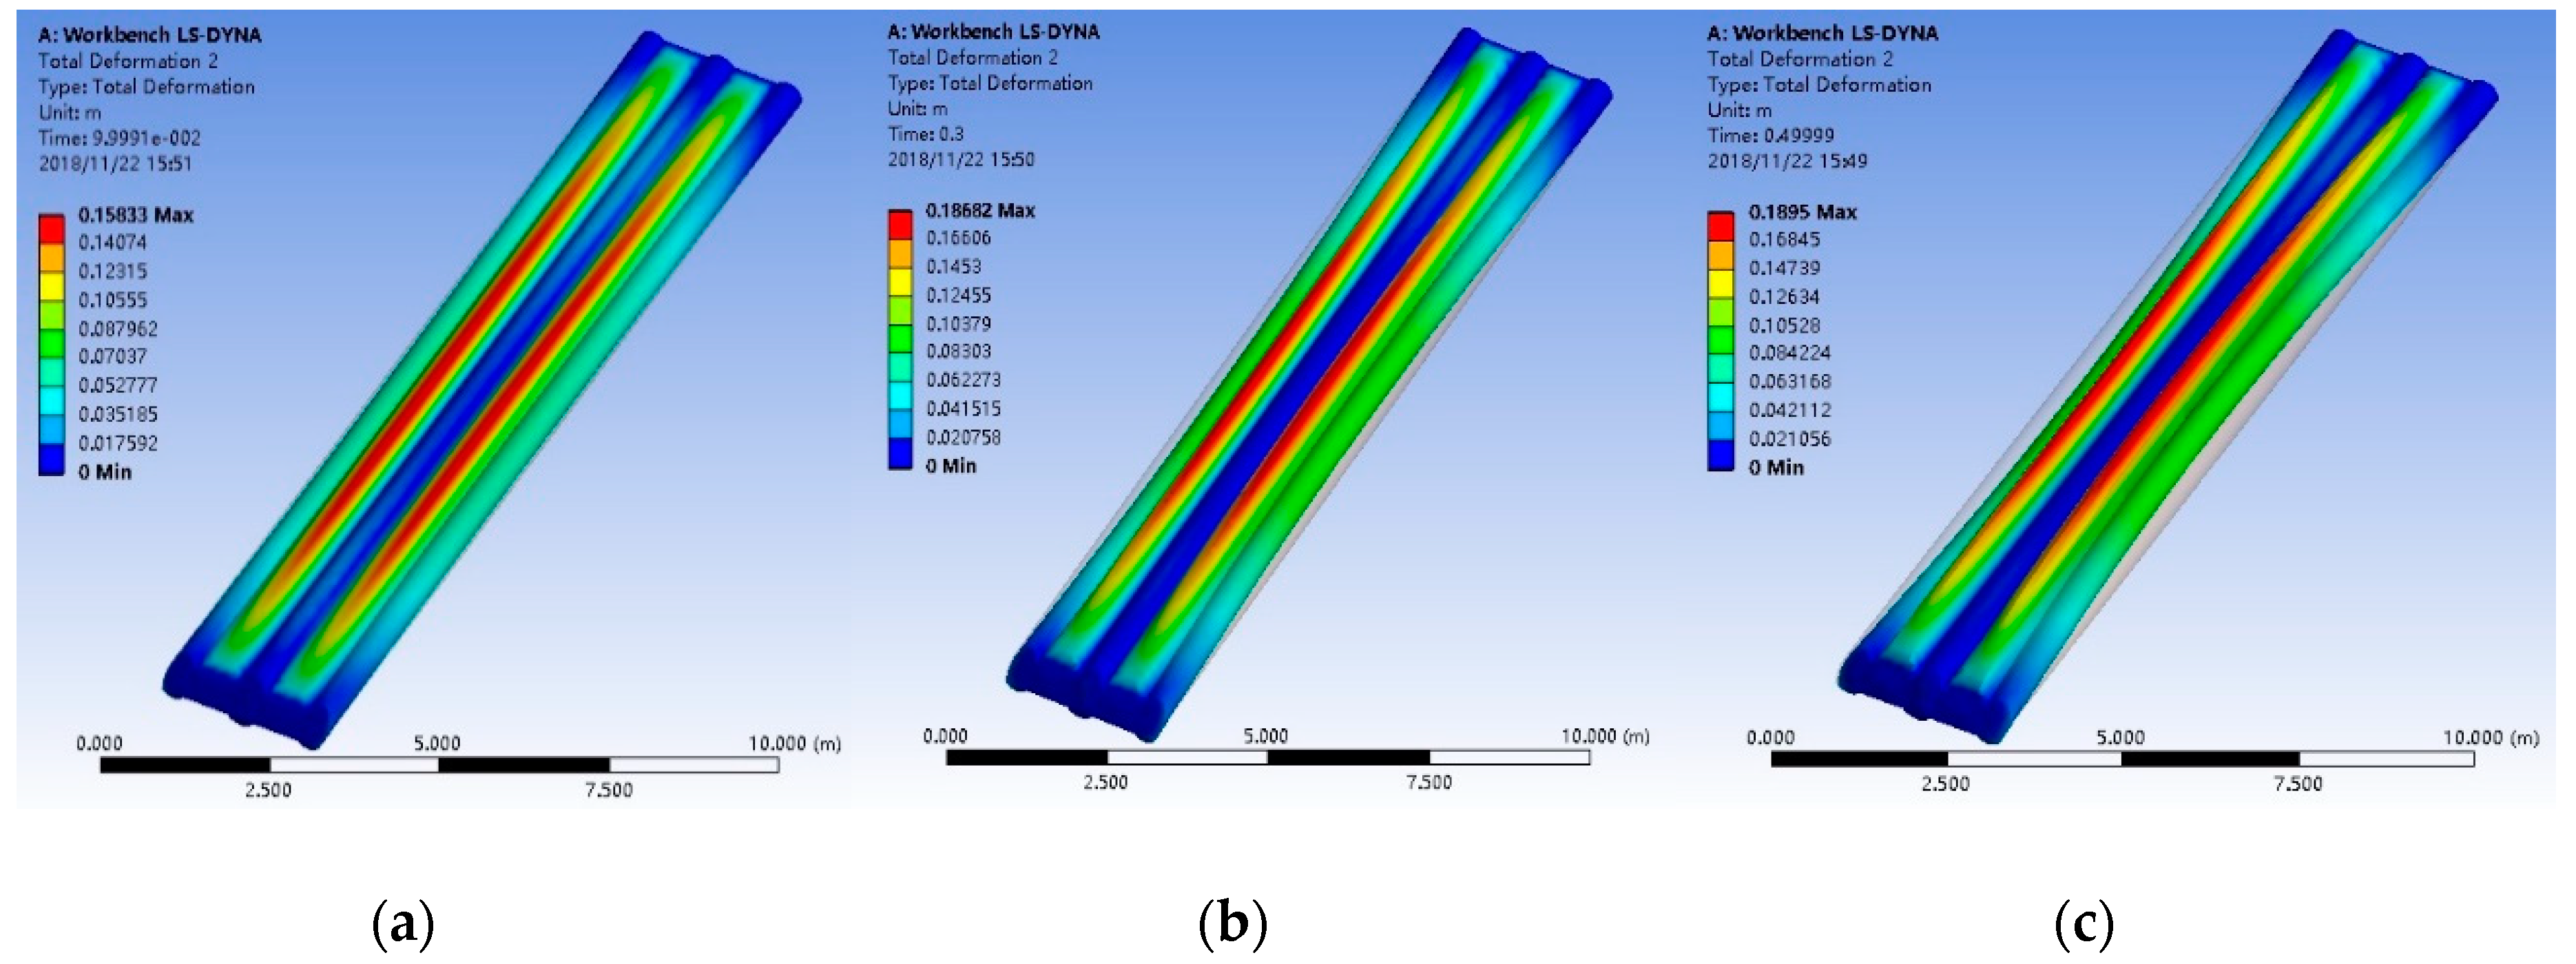
The AIRBAG module in LS-DYNA was used to define the gas in the chamber of the inflatable evacuation slide, so that the gas in the slide can satisfy the ideal gas state equation [23]. According to the response analysis results of the emergency evacuation slide under different inflatable internal pressures, the evacuation efficiency of the inflatable slide is simulated by the inflatable internal pressure values of 3000 Pa, 3500 Pa, 4000 Pa, 4500 Pa, and 5000 Pa. It is expected that through the simulation of the inflatable internal pressure range, the ideal internal pressure value which meets the criterion of the evacuation system sliding efficiency can be found, and the analysis of the stability part of the inflatable slide can be considered comprehensively. Next, we take 4000 Pa inflatable internal pressure as an example to simulate the inflatable process of the slide, extract the slideway part of the inflatable slide, set the inflatable time to 0.5 s, and magnify the inflatable deformation scale by three times.
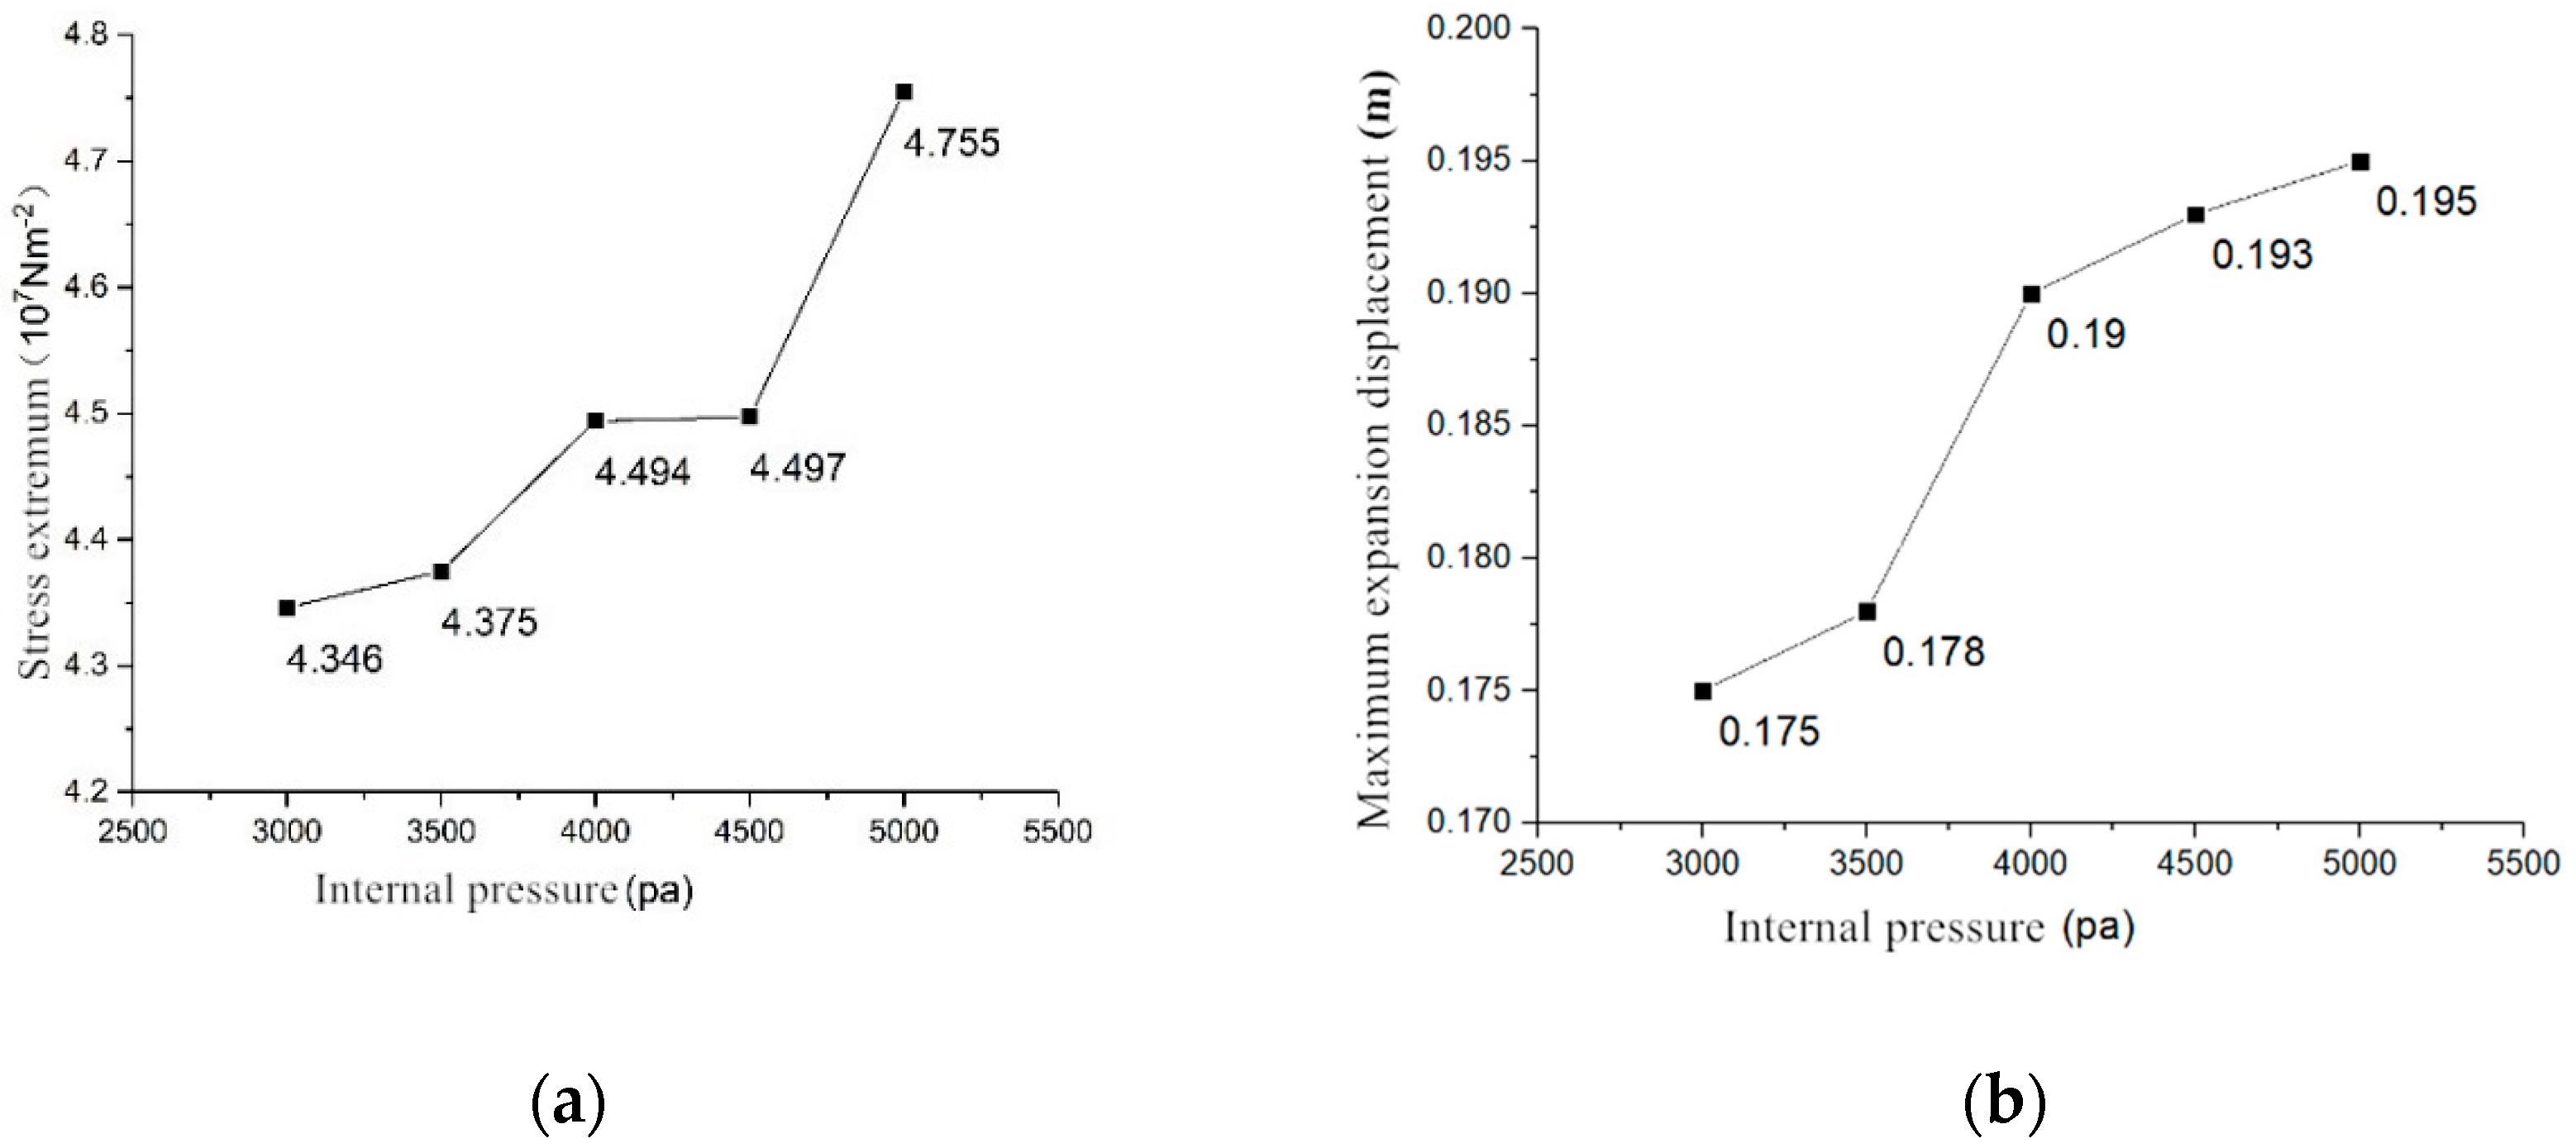
From the 0 s stress-free state, the displacement of the inflatable state at each time point of 0.1 s, 0.2 s, 0.3 s, 0.4 s, and 0.5 s is 0.158 m, 0.179 m, 0.187 m, 0.189 m, and 0.190 m respectively. According to Figure 16, the volume of the slide increases and tends to be stable with the increase of inflation time. The maximum displacement appears on the sliding surface, which proves that the inflation simulation method used in this paper can simulate the pressure process of the slide more realistically. Figure 17 shows the maximum expansion displacement and surface stress curves of the slide under five kinds of inflatable internal pressures.

4.2. Evacuation Process Simulation of Emergency Inflation Slide

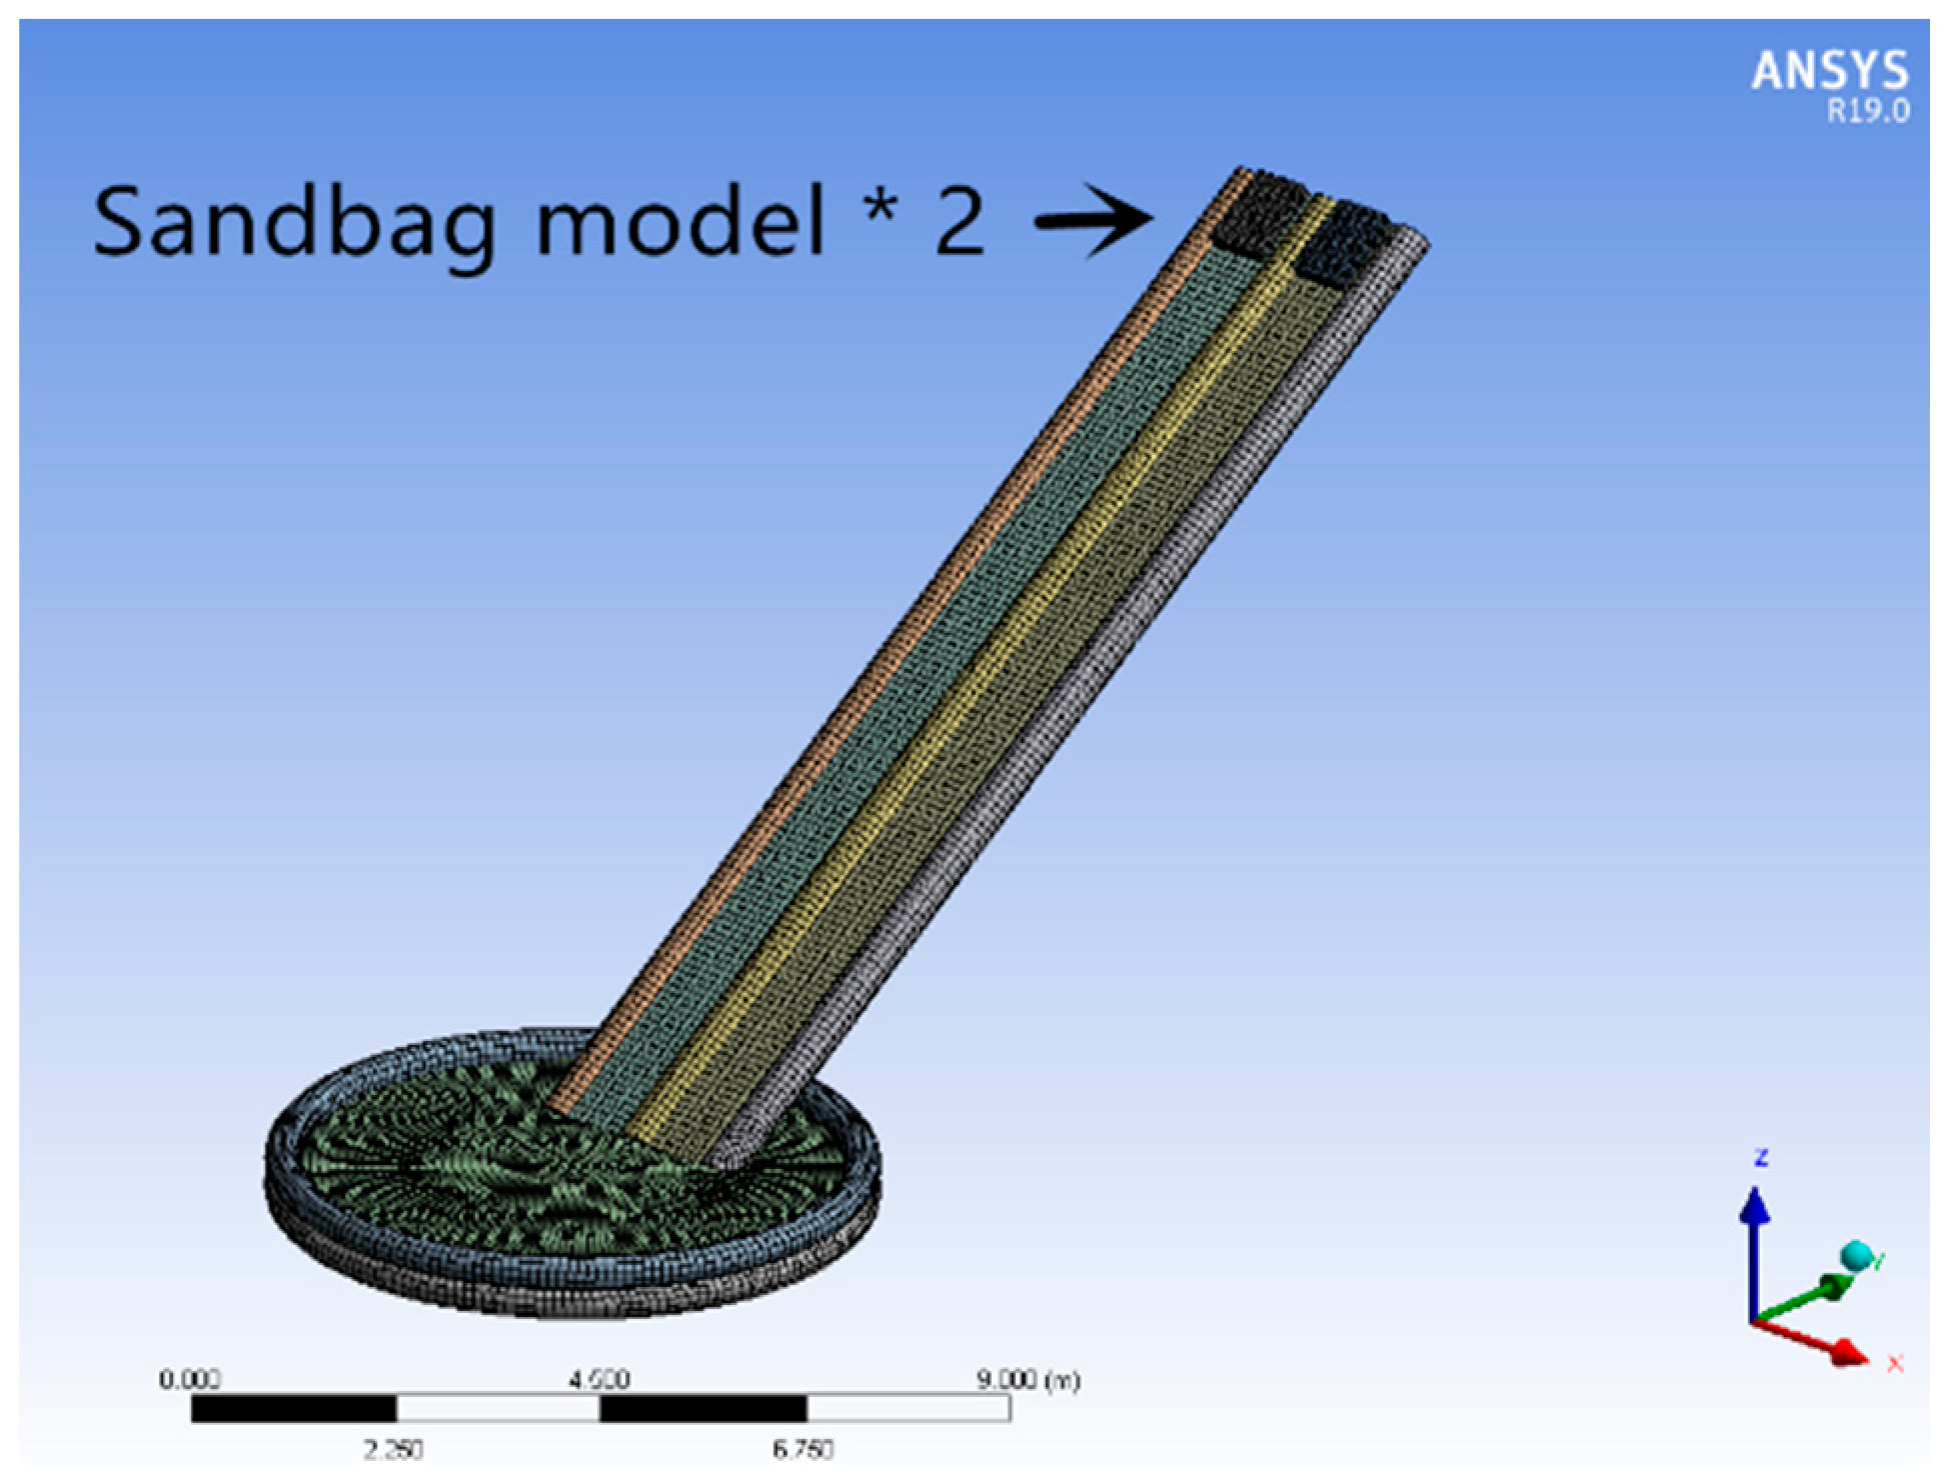
According to the requirements of the technical standards and regulations of the International Lifesaving Equipment Rules for inflatable slides, when 150 kg of heavy objects slides along the slides, the slides do not appear to exceed excessive torsional bending deformation requirements [24]. This simulation test is intended to adopt the operating conditions of two slides for each passenger to slide down. In order to facilitate the simulation environment simulation, the sandbag model is used to replace the actual downward sliding model of the person in distress. The cuboids with length, width, and height of 0.6 m, 0.5 m and 0.3 m are established. In order to make the sliding process as smooth as possible, the sharp corners of the sandbag model are rounded, and the rounded corners of 0.13 m are set. The weight of the sandbag is equal to the simulated passenger′s body weight, set at 77 kg (170 pounds), the friction coefficient of the outermost material of the sandbag is set at 0.3, the mesh size is 0.05 m, the total mesh number is 55,650, and the mesh refinement is 0.01 m at the contact point between the sandbag and the sliding surface, as shown in Figure 18.
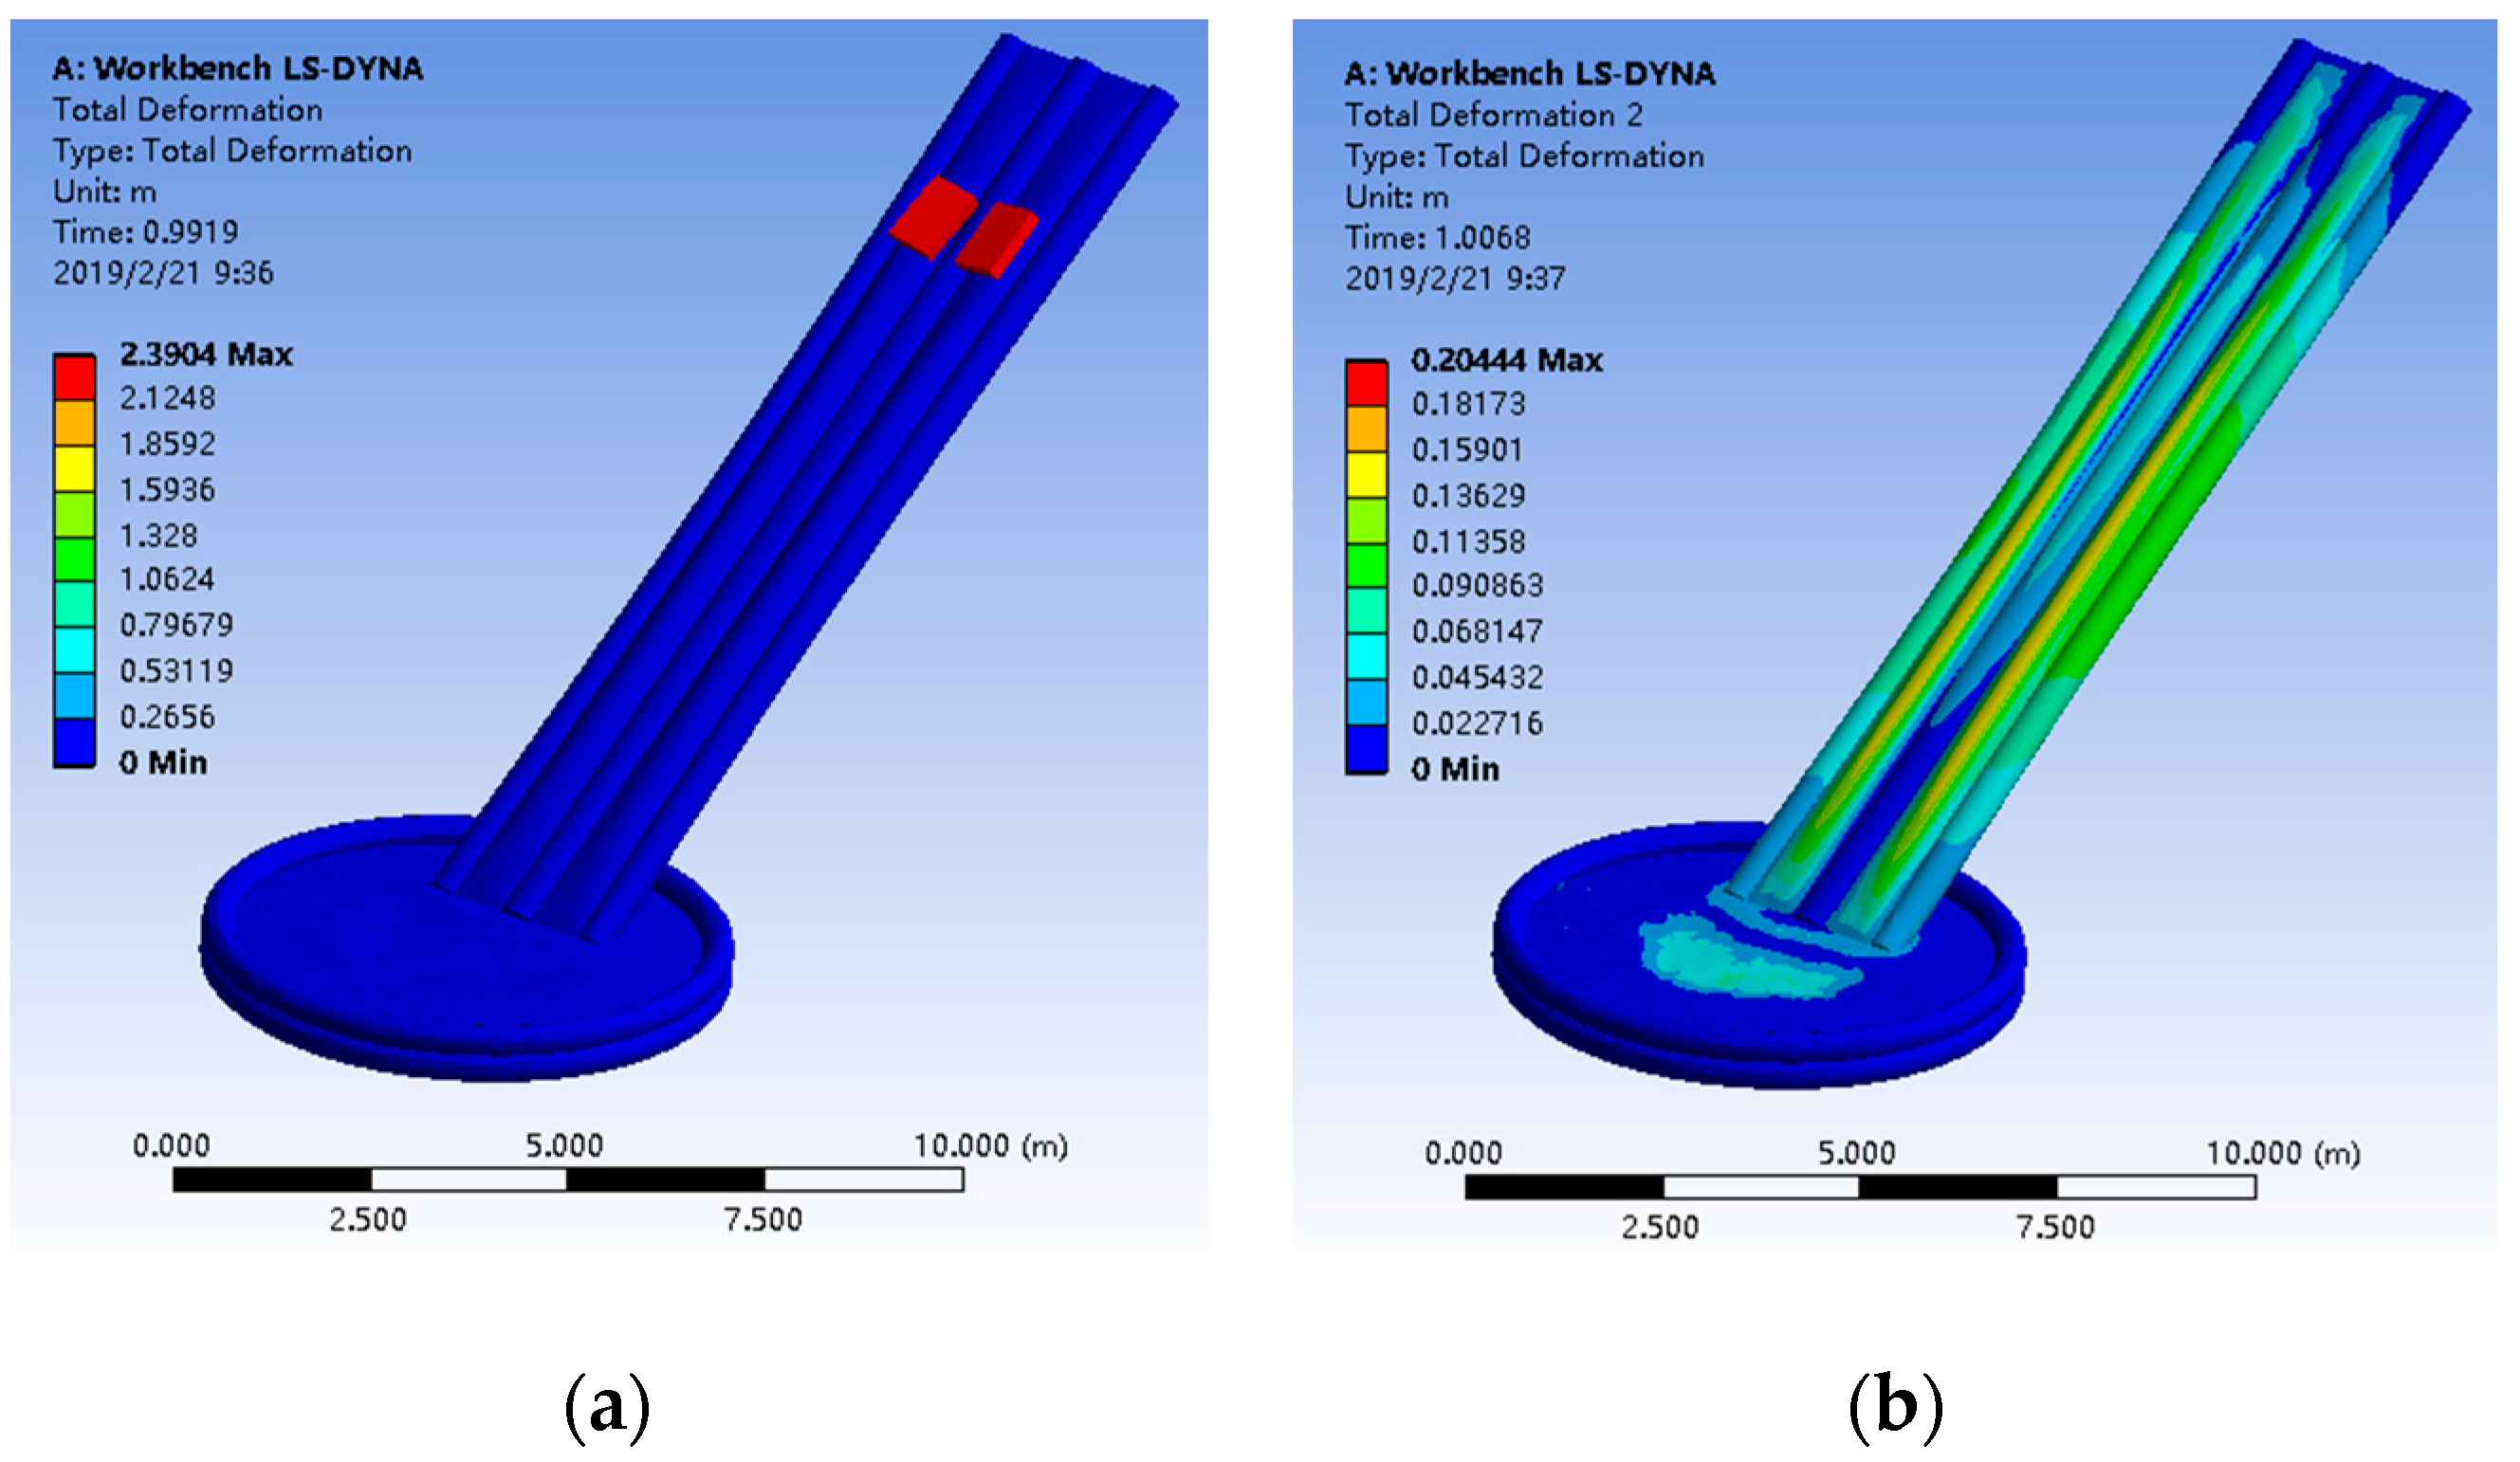
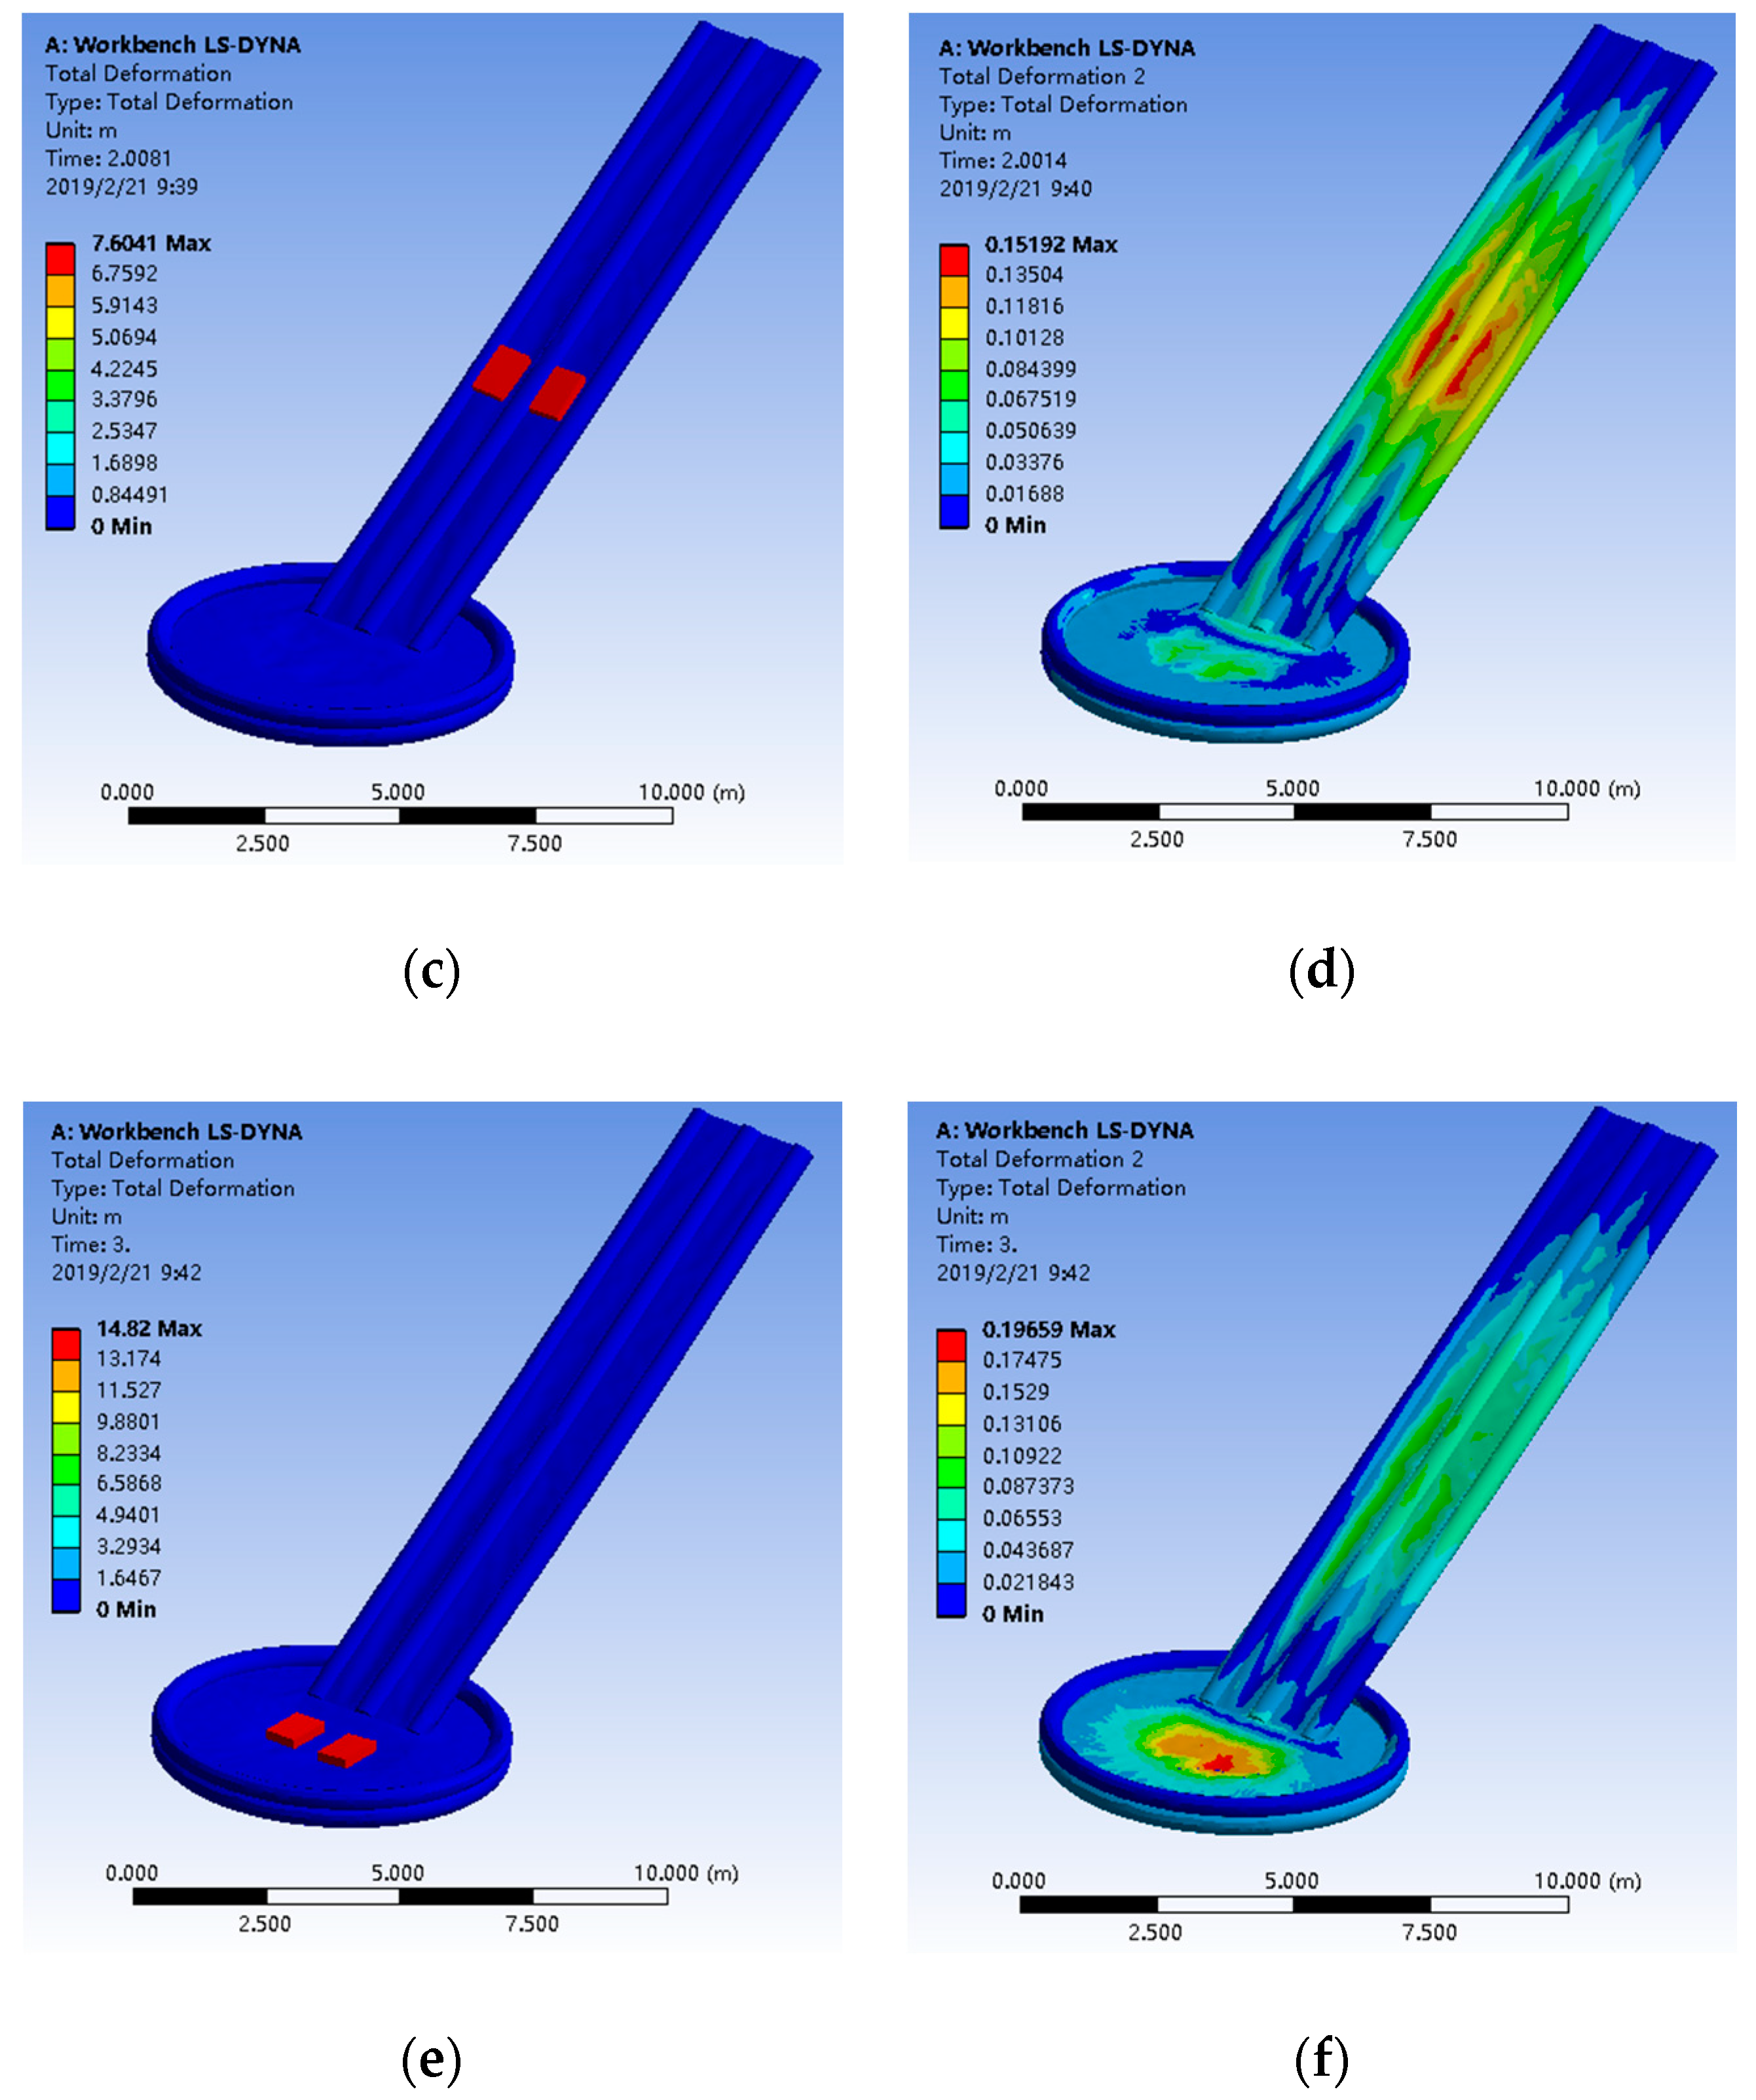
The simulated sliding pressure values are set to 3000 Pa, 3500 Pa, 4000 Pa, 4500 Pa, and 5000 Pa. In this section, the simulation of the sliding process under internal pressure of 4000 Pa will be analyzed, and the simulation results of other internal pressure conditions will be summarized. The sliding state diagram at 1.0 s, 2.0 s, and 3.0 s under the internal pressure of 4000 Pa and the displacement deformation diagram of the slide affected by the sliding of sand bags after inflating are given below.
As shown in Figure 19, the simulation results show that the displacement deformation and evacuation efficiency of the slide are obviously improved when the internal pressure is increased to 4000 Pa in the range of internal pressure. When the pressure is in the range of 4000 Pa to 5000 Pa, the increase of displacement deformation and evacuation speed is slow, which verifies the existence of ideal internal pressure in the process of evacuation simulation. According to the above simulation results of the stability of the inflatable slide under various environmental conditions, the ideal internal pressure and the evacuation efficiency of this section have an ideal intersection. An inflatable internal pressure of 4000 Pa is the ideal inflatable air pressure of the inflatable slide within the scope of the relevant requirements of the marine lifesaving equipment and simulation.

5. Conclusions

In this paper, the wind-load response, inflation pressure, and evacuation efficiency of the inflatable slide of the marine evacuation system under complex marine environments are studied. Based on the fluid–solid coupling CFD–CSD calculation theory, the actual engineering project model is analyzed, and the following main conclusions are obtained:
(1)
Under the action of wind load, the windward and leeward surfaces of the inflatable slide are the main areas where the depression occurs. The overall height of the structure increases under the action of wind field. In addition to the positive pressure on the direct windward surface, the negative pressure distribution occurs in most areas of the structure surface under different working conditions.
(2)
The inflow direction has a great influence on the displacement, deformation, and wind pressure distribution of the inflatable membrane structure. Considering the wind direction and the inflow velocity gradient, in the wind direction range of the test, it is concluded that the wind direction angle of about 30° is the most unfavorable working condition for emergency evacuation slide.
(3)
With the increase of the inflatable internal pressure, the overall stiffness of the structure increases, the displacement deformation of the structure decreases gradually, and the bending displacement caused by personnel sliding on the slide decreases continuously, and the sliding rate increases steadily.
To sum up, 4000 Pa inflatable internal pressure is the ideal pressure which meets the double standards of stability and efficiency of the inflatable slide studied in this paper. The research results have practical value for wind resistance analysis and engineering application of the inflatable sliding evacuation system.
Author Contributions

Conceptualization, F.K.; methodology, H.D. and B.W.; software, Z.J.; validation, H.C. and H.P.; writing—original draft preparation, H.L. and B.W.; writing—review and editing, H.D. and W.S.; funding acquisition, F.K. All authors have read and agreed to the published version of the manuscript.

Funding

This paper is financially supported by the High-Tech Ship Scientific research project in 2018 (Ministry of Industry and Information Technology packing letter [2018] no. 473, and Emergency Evacuation Chute System Sevelopment, Ministry of Industry and Information Technology packing letter [2017] no. 614), the National Natural Science Foundation (Grant No. 51979063 and No. 51679044) and China′s National Key Program Subsidized Projects: (2018YFC0810402).

Conflicts of Interest

The authors declare no conflict of interest. The funders had no role in the design of the study; in the collection, analyses, or interpretation of data; in the writing of the manuscript, or in the decision to publish the results.

References

  1. Hassel, M.; Asbjørnslett, B.E.; Hole, L. Underreporting of maritime accidents to vessel accident databases. Accid. Anal. Prev. 2011, 43, 2053–2063. [Google Scholar] [CrossRef] [PubMed] [Green Version]
  2. Park, K.; Ham, S.; Ha, S. Validation of advanced evacuation analysis on passenger ships using experimental scenario and data of full-scale evacuation. Comput. Ind. 2015, 71, 103–115. [Google Scholar] [CrossRef]
  3. Raman-Nair, W.; Chin, S.N.; Simoes-Re, A. Numerical model of a marine chute evacuation system. Ocean Eng. 2007, 34, 739–746. [Google Scholar] [CrossRef]
  4. Ryzhakov, P.B.; Oñate, E. A finite element model for fluid–structure interaction problems involving closed membranes, internal and external fluids. Comput. Methods Appl. Mech. Eng. 2017, 326, 422–445. [Google Scholar] [CrossRef] [Green Version]
  5. Xiang, Y.; Shen, S.Z.; Zhao, C. Wind tunnel test study on wind pressure distribution coefficient of umbrella roof. J. Harbin Archit. Univ. 1998, 4, 19–23. [Google Scholar]
  6. Glück, M.; Breuer, M.; Durst, F.; Halfmann, A.; Rank, E. Computation of fluid-structure interaction on lightweight structures. J. Wind Eng. Ind. Aerodyn. 2001, 89, 1351–1368. [Google Scholar] [CrossRef]
  7. Glück, M.; Breuer, M.; Durst, F.; Halfmann, A.; Rank, E. Computation of wind-induced vibrations of flexible shells and membranous structures. J. Fluids Struct. 2003, 17, 739–765. [Google Scholar] [CrossRef]
  8. Zhu, W.L.; Yang, Q.S. Numerical investigation on fluid-structure interaction of membrane structure. Chin. J. Comput. Mech. 2010, 27, 422–427. [Google Scholar]
  9. Idelsohn, S.R.; Del Pin, F.; Rossi, R.; Oñate, E. Fluid–structure interaction problems with strong added-mass effect. Int. J. Numer. Methods Eng. 2009, 80, 1261–1294. [Google Scholar] [CrossRef]
  10. Ran, W.J.; Jiang, G.Y.; Wang, F. Study on wind load and wind environment of the air-supported membrane structures using LK k-ε model. Build. Struct. 2018, 48, 1012–1017. [Google Scholar]
  11. Zhang, H.; Shan, J. Stochastic wind field simulation and coupling wind-induced response study of membrane structures. Gongcheng Lixue/Eng. Mech. 2006, 23, 19–24. [Google Scholar]
  12. Wang, B.; Yang, Q.S.; Jin, Y.F. Numerical wind tunnel technique for coupling algorithm of wind and membrane structure interaction. In Proceedings of the 10th International Symposium on Structural Engineering for Young Experts, Shanghai, China, 19–21 October 2008. [Google Scholar]
  13. Wang, L.; Quant, R.; Kolios, A. Fluid structure interaction modelling of horizontal-axis wind turbine blades based on CFD and FEA. J. Wind Eng. Ind. Aerodyn. 2016, 158, 11–25. [Google Scholar] [CrossRef] [Green Version]
  14. Gui, X.L.; Zhou, D.; Li, J.L. Wind field simulation and fluid-structure interaction problems based on CFD method. J. Shanghai Jiaotong Univ. 2012, 46, 158–166. [Google Scholar]
  15. Yang, W.; Zhao, X.; Zhang, J.; Zhang, Z.; Li, Q. Research and preparation of self-cleaning PVDF membrane material. Cailiao Daobao/Mater. Rev. 2016, 30, 67–71. [Google Scholar]
  16. Hong, R.H.; Wang, X.; Zhou, D.; Li, F.F.; Chen, Y. Numerical simulation of wind field and wind-resistant shape optimization of built-on-stilts type disc-shape-like spatial structures. J. Shanghai Jiaotong. 2016, 50, 22–29. [Google Scholar]
  17. Tutt, B.J.; Taylor, A.P.; Berland, J.; Gargano, B. The use of LS-DYNA to assess the performance of airborne systems North America candidate ATPS main parachutes. In Proceedings of the 18th AIAA Aerodynamic Decelerator Systems Technology Conference and Seminar, Munich, Germany, 23–26 May 2005. [Google Scholar]
  18. Sun, X.Y.; Li, T.; Zhang, Q.; Wu, Y. Numerical simulation of wind pressure distribution for typical tensile membrane structures. J. Build. Struct. 2016, 37, 1–12. [Google Scholar]
  19. Roh, H.W.; Kim, H.R. Wind pressure distribution on canopies attached to tall buildings. J. Mech. Sci. Technol. 2011, 25, 1767–1774. [Google Scholar] [CrossRef]
  20. Simões Ré, A.J.; Power, J.; Kennedy, E.; Kuczora, A.; Akinturk, A.; Veitch, B.; Mackinnon, S.N.; Brown, R.; Boone, J. Life raft performance in wind and waves: An experimental evaluation. In Proceedings of the Royal Institution of Naval Architects International Conference—Design and Operation of Passenger Ships, London, UK, 25–26 April 2007; pp. 135–141. [Google Scholar]
  21. Sarvari, P.A.; Cevikcan, E. A simulation-based methodology for evaluating the factors on ship emergency evacuation. Trans. R. Inst. Nav. Archit. Part A: Int. J. Marit. Eng. 2017, 159, 415–434. [Google Scholar]
  22. Pawłowski, M. Survival criteria for passenger roll-on/roll-off vessels and survival time. Mar. Technol. SNAME News 2007, 44, 27–34. [Google Scholar]
  23. Zhang, H.L.; Raman, S.; Gopal, M.; Han, T. Evaluation and comparison of CFD integrated airbag models in LS-DYNA, MADYMO and PAM-CRASH. In Proceedings of the 2004 SAE World Congress, Detroit, MI, USA, 8–11 March 2004. [Google Scholar]
  24. ASTM International. Standard Guide for Location and Instruction Symbols for Evacuation and Lifesaving Equipment; ASTM Headquarters: West Conshohocken, PA, USA, 2018. [Google Scholar]
Figure 1. Storage status diagram of a marine evacuation system. 1-life raft, 2-integrated inflatable slide and sea mounting platform, 3-telescopic guide rail, 4-load-carrying frame, 5-air charging device, 6-pulley set receiving and placing mechanism.
Applsci 10 00021 g001
Figure 2. Deployment status diagram of marine evacuation system. 1-anchorage point, 2-anchor wires, 3-inflatable life rafts, 4-inflatable slide, 5-boarding platform.
Applsci 10 00021 g002
Figure 3. Basic scheme of weak coupling solution method.
Applsci 10 00021 g003
Figure 4. The schematic diagram of boundary conditions setting of sea surface wind field.
Applsci 10 00021 g004
Figure 5. Structure domain numerical model of the inflatable slide. (a) Interface of inflatable slide in flow field; (b) Pressure applied state of inflatable slide.
Applsci 10 00021 g005
Figure 6. (a) Mesh generation of inflatable slide domain; (b) Location display of poor quality parts of inflatable slide mesh.
Applsci 10 00021 g006
Figure 7. The layout of the inflatable slide at different wind directions on the sea surface.
Applsci 10 00021 g007
Figure 8. Displacement response of the inflatable slide under different wind direction angles. (a) The displacement response at wind direction angle of 0°; (b) The displacement response at wind direction angle of 30°; (c) The displacement response at wind direction angle of 60°; (d) The displacement response at wind direction angle of 90°.
Applsci 10 00021 g008aApplsci 10 00021 g008b
Figure 9. Displacement deformation curves of the inflatable slide at different wind directions.
Applsci 10 00021 g009
Figure 10. Air pressure distribution of the inflatable slide under different wind direction angles. (a) Air pressure distribution at wind direction angle of 0°; (b) Air pressure distribution at wind direction angle of 30°; (c) Air pressure distribution at wind direction angle of 60°; (d) Air pressure distribution at wind direction angle of 90°.
Applsci 10 00021 g010aApplsci 10 00021 g010b
Figure 11. Air pressure distribution curves of the inflatable slide at different wind directions.
Applsci 10 00021 g011
Figure 12. Displacement response of inflatable slide under different wind direction angles and different wind speeds. (a) Deformation at 15 m/s wind speed and 30° wind direction; (b) Deformation at 20 m/s wind speed and 30° wind direction; (c) Deformation at 25 m/s wind speed and 30° wind direction; (d) Deformation at 15 m/s wind speed and 60° wind direction; (e) Deformation at 20 m/s wind speed and 60° wind direction; (f) Deformation at 25 m/s wind speed and 60° wind direction.
Applsci 10 00021 g012
Figure 13. Displacement deformation curves of the inflatable slide at different wind directions and different wind speeds.
Applsci 10 00021 g013
Figure 14. Displacement response of the inflatable slide under different inflatable internal pressures. (a) Deformation at inflatable internal pressure of 3000 Pa; (b) Deformation at inflatable internal pressure of 3500 Pa; (c) Deformation at inflatable internal pressure of 4000 Pa; (d) Deformation at inflatable internal pressure of 4500 Pa pressures; (e) Deformation at inflatable internal pressure of 5000 Pa.
Applsci 10 00021 g014
Figure 15. Displacement deformation curves of the inflatable slide under different inflatable internal pressures.
Applsci 10 00021 g015
Figure 16. Displacement response of the inflatable slide during inflation. (a) Deformation at 0.1 s aeration; (b) Deformation at 0.3 s aeration; (c) Deformation at 0.5 s aeration.
Applsci 10 00021 g016
Figure 17. The surface stress and maximum expansion displacement curves of the slide under different inflatable internal pressures. (a) Maximum stress curves under different internal pressures; (b) Maximum displacement curves under different internal pressures.
Applsci 10 00021 g017
Figure 18. Evacuation simulation model of inflatable slide.
Applsci 10 00021 g018
Figure 19. Simulation of the sliding process of the inflatable slide. (a) Evacuation sliding state diagram at 1.0 s; (b) Displacement response of inflatable slide at 1.0 s; (c) Evacuation sliding state diagram at 2.0 s; (d) Displacement response of inflatable slide at 2.0 s; (e) Evacuation sliding state diagram at 3.0 s; (f) Displacement response of inflatable slide at 3.0 s.
Applsci 10 00021 g019aApplsci 10 00021 g019b
Table 1. Displacement extremes of the inflatable slide under different conditional variables.
Wind Direction Angle3000 Pa4000 Pa5000 Pa
0.040 m0.037 m0.032 m
30°0.068 m0.044 m0.040 m
60°0.040 m0.035 m0.032 m
90°0.037 m0.032 m0.030 m
Table 2. Air pressure distribution of the inflatable slide under different conditional variables.
Pressure (Pa)30°60°90°
3000 (positive pressure)155261.5248.3240.3
3000 (negative pressure)−902−927−1320−930.5
4000 (positive pressure)140247.4241.6231.2
4000 (negative pressure)−917−918.7−1263−940.3