1. Introduction
Mineral aggregates make up more than 80% by volume or 90% by mass of the commonly used paving asphalt mixtures and, according to the particle size, mineral aggregates can be divided into filler (<0.075 mm), fine aggregate (FA) (0.075 mm < 2.36 mm) and coarse aggregate (CA) (≥2.36 mm). The aggregate geometry has long been recognized to have a significant influence on the volumetric, mechanical, skid-resistant and other properties of asphalt mixtures. Conceptually, the geometric characteristics of aggregate can be fully described by three independent properties, which are form, angularity, and texture [
1,
2].
Great efforts have been devoted by researchers to evaluate the geometry characteristics of both CA and FA, and investigate their potential connections to various mixture performances such as skid resistance [
3,
4,
5], microstructure characteristic [
6,
7,
8,
9,
10], rutting performance [
11] and others [
12,
13]. Generally, the existing test methods can be classified into two broad categories, namely, the indirect approach and the direct approach. The former refers to those wherein aggregate geometric characteristics are determined by means of measuring the bulk properties of a group of aggregates. Hossain et al. adopted four kinds of indirect tests for CA geometry and compared and evaluated the test results [
14]. Their research indicated that the particle index (Standard Test Method for Index of Aggregate Particle Shape and Texture, ASTM D-3398) and uncompacted void tests provide comparable measures of aggregate particle form, angularity and surface texture. Kandhal et al. evaluated the particle form and texture properties of 18 FAs (eight natural sands and ten manufactured sands) by virtue of the ASTM D3398 test and results showed that the index value can distinguish these two kinds of FA [
15].
On the other hand, the digital image processing (DIP) technique provides an alternative direct method to quantify the aggregate geometric characteristics [
16,
17]. In the direct approach, the geometric characteristics (form, angularity, and texture) of aggregate are measured upon the individual aggregates. Rao et al. proposed a new angularity index (AI) based on the University of Illinois Aggregate Image Analyzer (UIAIA) to characterize the angularity of CA. Their results demonstrated that this AI value is able to distinguish crushed stone from gravel [
18]. Kwan et al. compared the DIP method with the manual method in measuring the CA of cement concrete [
19]. It is concluded that the mean thickness/breadth and length/breadth ratios can be measured directly with the application of the DIP method. Salehi et al. evaluated aggregate geometry using the Aggregate Imaging System (AIMS) and results indicated that the level of anisotropy of an aggregate system is very sensitive to aggregate form, angularity, and textural properties [
20]. Masad et al. proposed several DIP techniques to characterize the microstructure of asphalt mixture [
21,
22,
23,
24]. Moreover, they also investigated the relationship between FA shape properties and the performance of hot-mix asphalt mixture. Prudencio et al. [
25] investigated the particle shape index for fine aggregates based on the concept of volumetric coefficient, which has been recommended by a French standard (AFNOR XP P18-54). The optimal relation among these quantified indexes of FA and the resistance of rutting have also been observed by Johnson et al. [
26] and Thomas et al. [
27].
Even though numerous indicators have been proposed by previous researches in describing the geometric characteristics of aggregate [
10,
28,
29], a comprehensive study on verifying their ability to distinguish different kinds of aggregate and view the correlations among different indicators is still lacking. Moreover, few researches have concerned the effect of FA geometry on the rheological property of asphalt mortar, while asphalt mortar is of great importance as it is a single characteristic-length scale smaller than asphalt mixture and is, therefore, closer in characteristic size of the damage that occurs with a mixture. This research focuses on the geometric characteristics of FA. In this research, 3 indirect indicators and 3 types of 7 direct indicators were adopted to evaluate the geometry of 13 different kinds of FAs. Based on the test results, the statistic method was used to verify the ability of the indicators to distinguish the FA type and analyze the correlations among different indicators. At last, the effect of FA geometry on the rheological properties of asphalt mortar was investigated.
The main objectives of this study are following:
To evaluate the geometric characteristics of FA with both indirect (uncompact void content test, flow time test, and D3398) and direct indicators (form, angularity, and texture) indicators and valid their effectiveness in distinguishing different kinds of FA;
To determine relationships between the geometry of FA (form indicator ratio of equivalent ellipse axis E and angularity indicator surface parameter SP) and the viscoelastic property of asphalt mortar.
2. Materials and Methodology
2.1. Raw Materials and Properties
In this analysis, 13 kinds of FA with varying mineralogical sources and produced from different processing technologies were collected from different producing areas to cover a wide spectrum of origin, rock type and characteristics. The basic technical properties of the selected FAs were tested according to “Test Methods of Aggregate for Highway Engineering (JTG E42-2005)”, and the results are shown in
Table 1. The fineness modulus (
MX) is an index to characterize the size and type of natural sand. The larger the fineness modulus, the coarser the sand.
MX can be obtained by
Among the selected 13 FAs, FA1 is natural sand, FA2 to FA6 are stone chips and the others are machine-made sand. The gradations of the FAs were listed in
Table 2.
2.2. Geometric Characteristic Evaluating Methods
2.2.1. Indirect Methods
The indirect tests are normally inexpensive and easy to conduct, and numerous methods and parameters have been proposed to evaluate the geometric characteristic of FAs. In this research, three commonly used indirect methods were adopted which are uncompact void content test, flow time test and ASTM D3398 test, respectively.
(a) Uncompact void content test
The uncompact void content test estimates the geometric characteristic of FA by measuring the loose uncompacted void content of fine aggregate particles. It provides an indication of the aggregate’s angularity, spherical shape, and surface texture compared to other fine aggregates tested in the same grading. The uncompact void content
can be calculated by:
It has been reported that a higher U can be observed in FA particles with less spherical particles and higher value of cubicle aggregate, and vice versa.
(b) Flow time test
The flow time test is an indirect measurement of FA geometric characteristic by measuring the time required for a defined volume of aggregate passing through a standardized funnel. The test funnel has two standard diameters which are 12 mm and 16 mm. The 12 mm diameter funnel applies to FA with the particle size range of 0.075–2.36 mm while the 16 mm diameter funnel for FA with the particle size range of 0.075–4.75 mm. For the flow time test, a greater value of flow time represents greater friction angle, fewer spherical particles, and coarser angularity.
(c) ASTM D3398 test
In the ASTM D3398 test method, the indicator average particle index
was proposed to evaluate the particle shape and texture characteristics of aggregates for each size fraction. The indicator particle index
was proposed to evaluate the particle shape and texture characteristics of graded aggregates. The average particle index
and particle index
can be obtained by:
in which
The particle index is a quantitative measure of the aggregate form and texture characteristics that may affect the performance of road and paving mixtures and the greater value indicates fewer spherical particles and coarser angularity.
2.2.2. Direct Methods
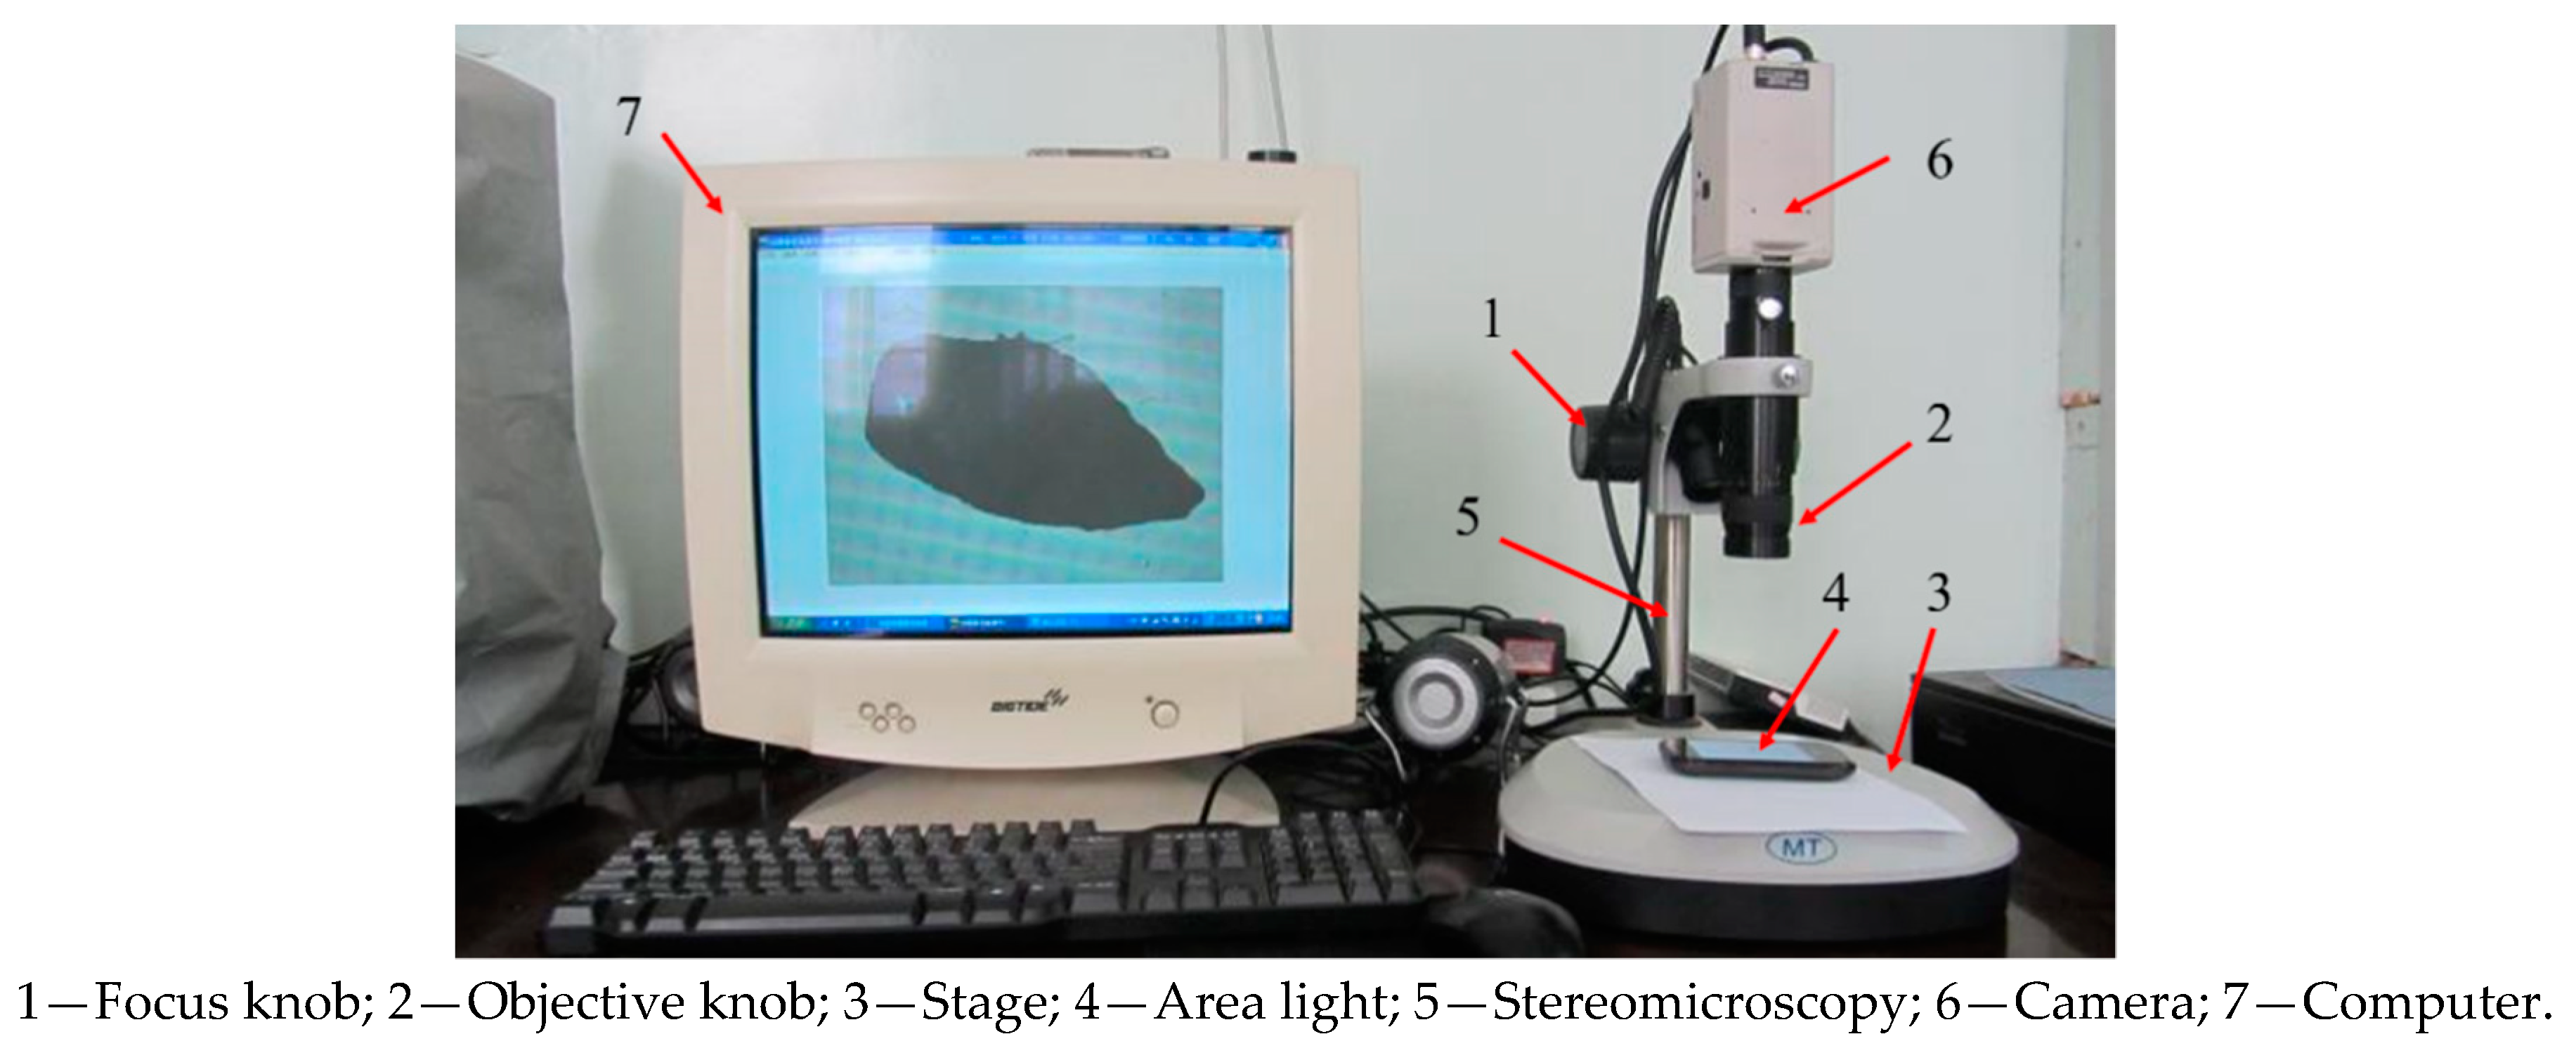
As mentioned above, the indirect tests are based on the measurement of bulk property which is due to the combined effect of form, angularity and texture, and it is fairly difficult to separate the effect of the individual components. By contrast, the DIP-based direct methods can quantify the aggregate geometric characteristics separately and accurately, and thus determine the relative contribution of different geometric characteristics to mixture performance [
17]. In this research, the stereomicroscopy and area light were combined to capture the images of FA. The image capturing device is shown in
Figure 1 and the detailed steps are as following:
Wash the prepared fine aggregates with water and filter out the filler part. Sieve and obtain the required fine aggregates with specific representative size for use. The determination method for the representative size is to be given in the next section;
Adjust the focal length to the required revolution and rotate the focus knob until the aggregates are showed clearly;
Take and save the pictures for further use.
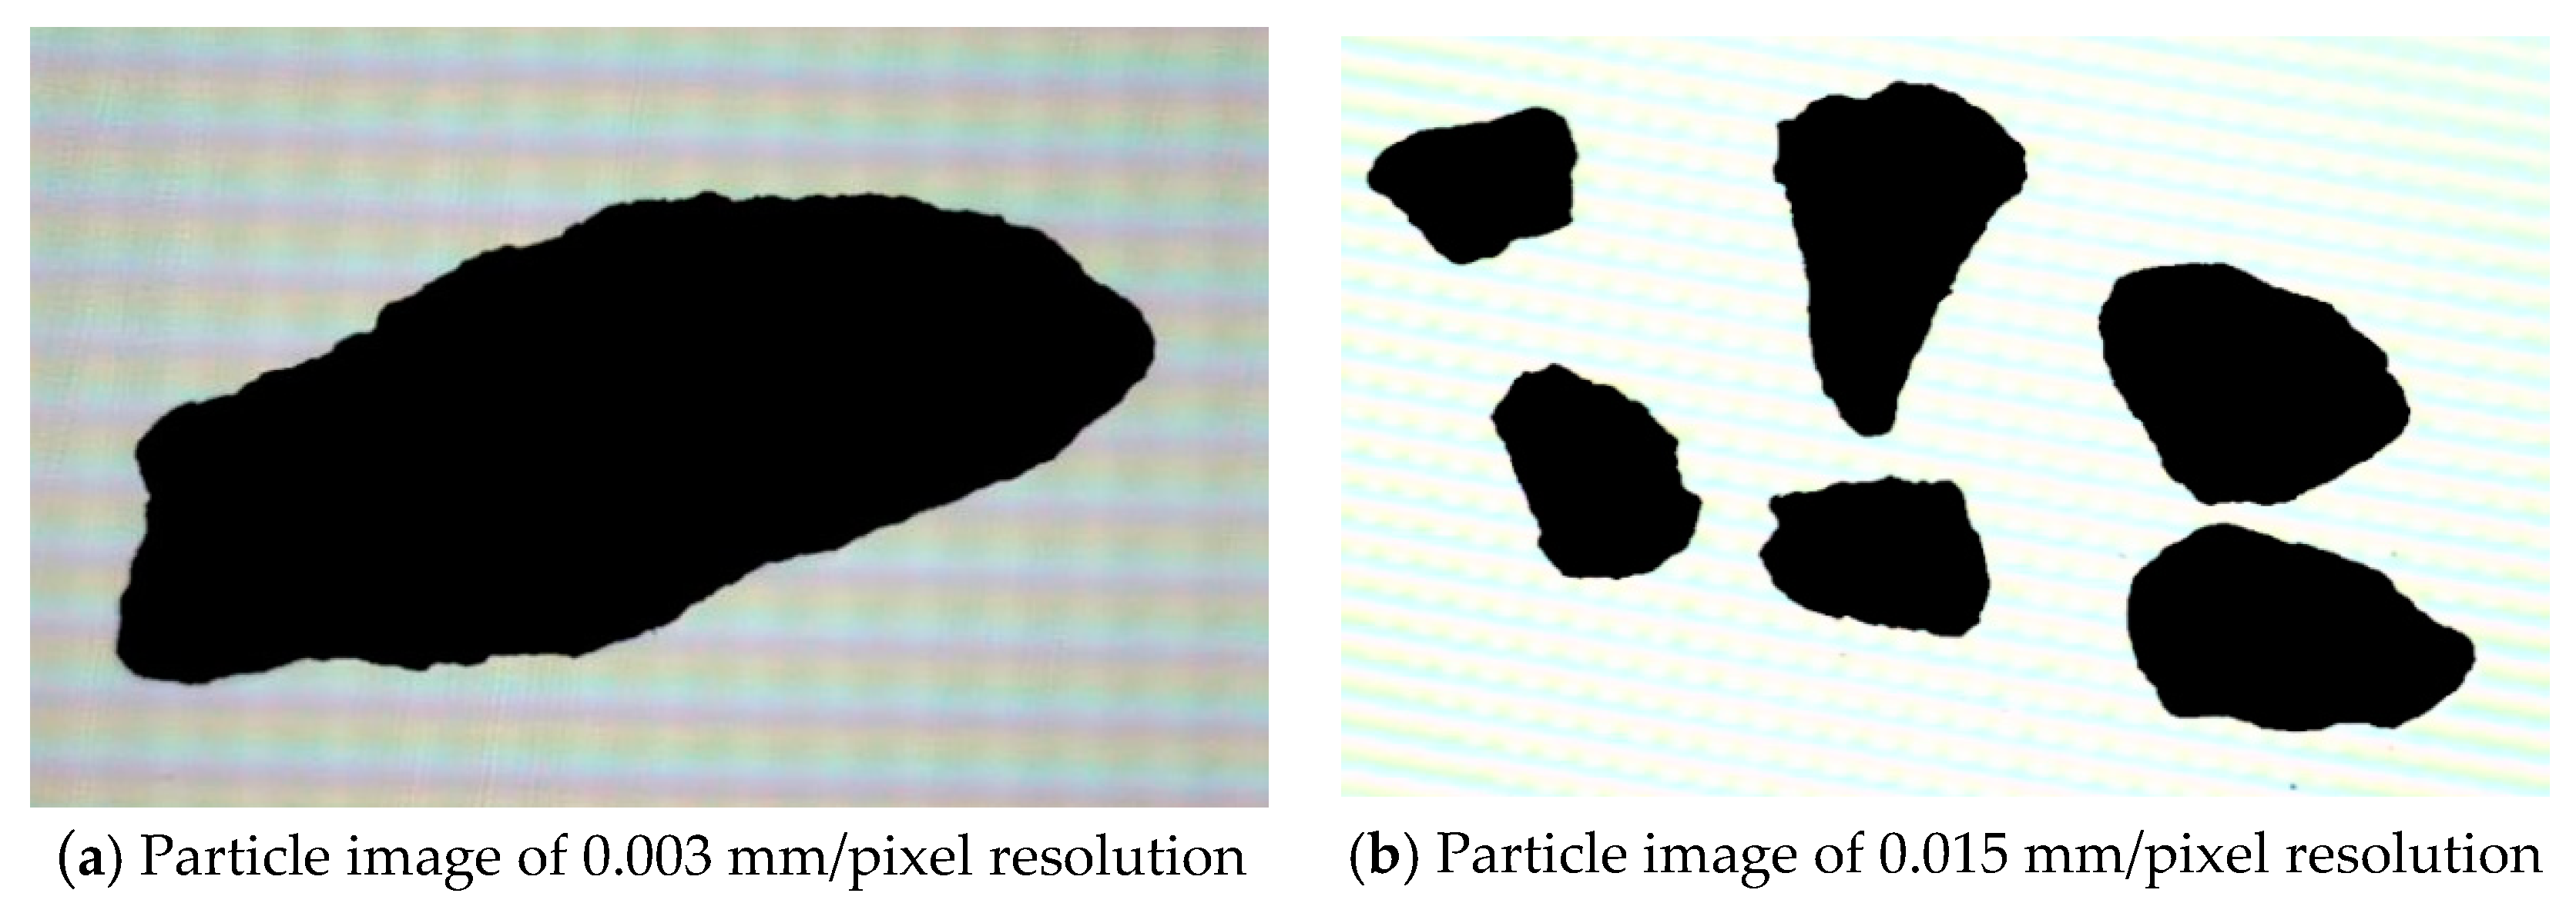
For each kind of FA, 150 aggregate particles were selected for scanning and the 150 high-resolution (0.003 mm/pixel) images were taken for every single aggregate particle, and 25 low-resolution (0.015 mm/pixel) images were taken for every group of 6 aggregate particles as shown in
Figure 2.
A number of parameters have been proposed based on imaging analysis. In this research, 7 indexes were selected to describe the form, angularity and texture characteristics of FA, respectively. The employed index system was detailed in
Table 3. Among these indexes, the surface parameter
was calculated through the erosion–dilation method which was implemented by using MATLAB coding while the others were calculated through Image-Pro Plus (IPP) software. In the Erosion-Dilation method, erosion is a morphologic operation in which pixels are removed from the binary image according to the number of neighboring pixels that have different color and dilation is the reverse of erosion. The area lost after a certain number of erosion and dilation operations is proportional to the percentage of aggregates smaller than a certain size and surface irregularity. For the last five indicators, calculations based on low-resolution images describe the angularity characteristic of the FA, and calculations based on high-resolution images describe the texture characteristic of the FA. The definitions and physical meanings of the indexes are given in what follows.
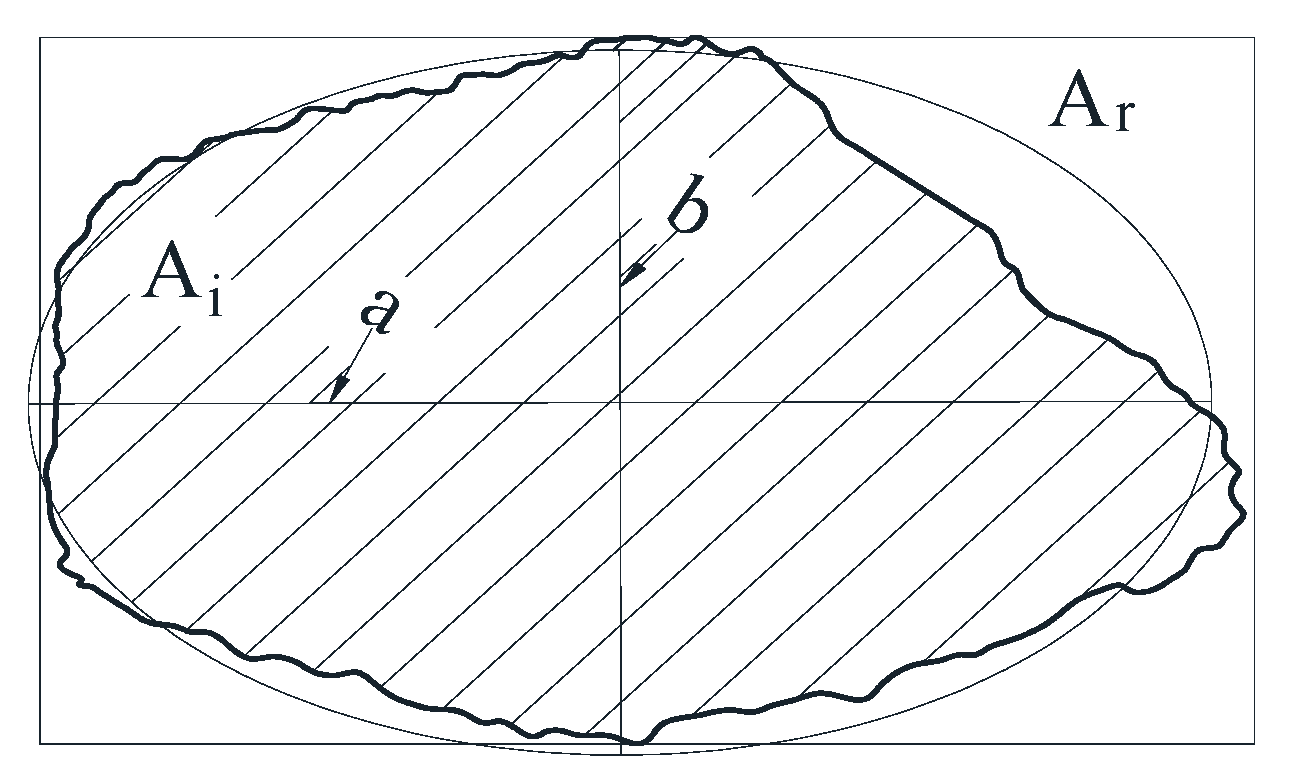
The form indexes ratio of equivalent ellipse axis
and rectangularity
are given by:
These two indicators describe the degree of similarity between the shape of aggregate and circle and rectangle respectively, as shown in
Figure 3.
The surface parameter
, perimeter ratio of equivalent ellipse
, convex ratio
, shape factor
and fractal dimension
were defined respectively as:
2.3. Dynamic Modulus Test and Evaluation of Asphalt Mortar
2.3.1. Dynamic Modulus Test of Asphalt Mortar
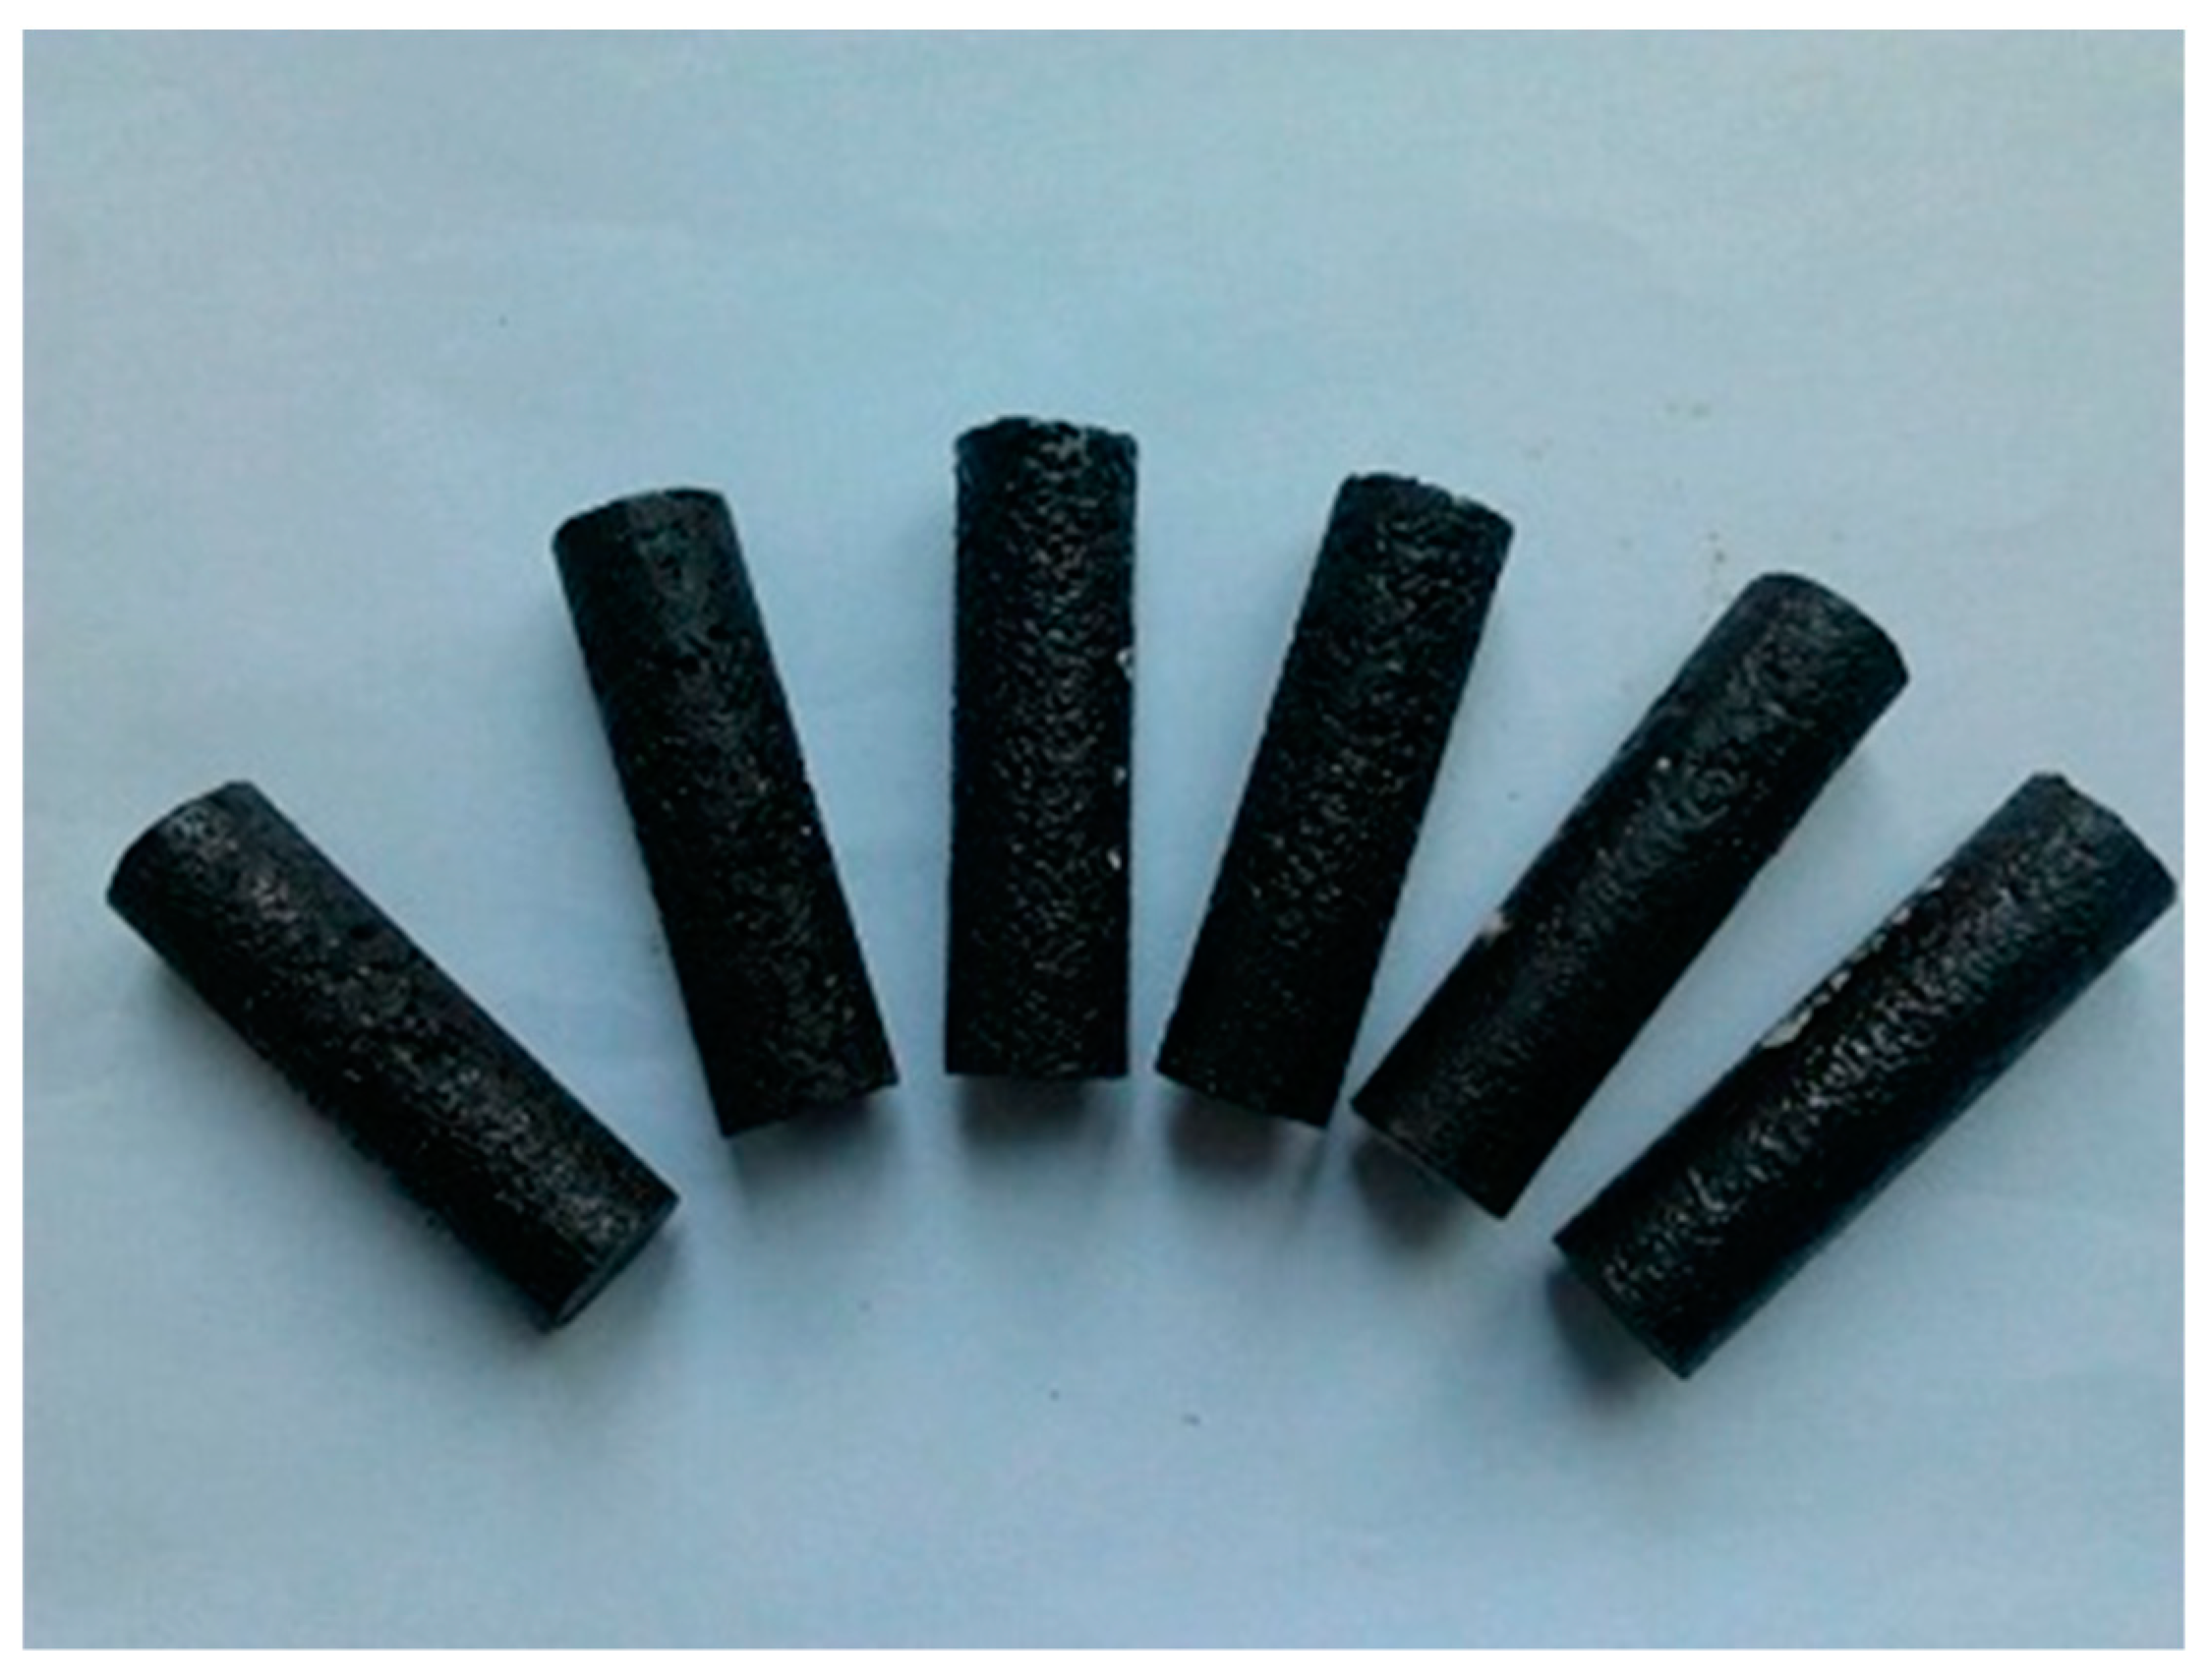
In order to investigate the effect of FA geometry on the viscoelastic property of asphalt mortar, 6 kinds of FA (FA2-3, FA8-10 and FA12) were selected to fabricate asphalt mortar samples and conduct dynamic modulus test. The limestone filler and AH-90 base bitumen (penetration value of 89.8) were used to mix with the fine aggregates according to the gradation shown in
Table 4 at the mixing temperature of 155 °C. Then, the static compaction method was used to prepare the asphalt mortar samples with a size of 12 (Ø) mm × 45 (h) mm, as shown in
Figure 4 [
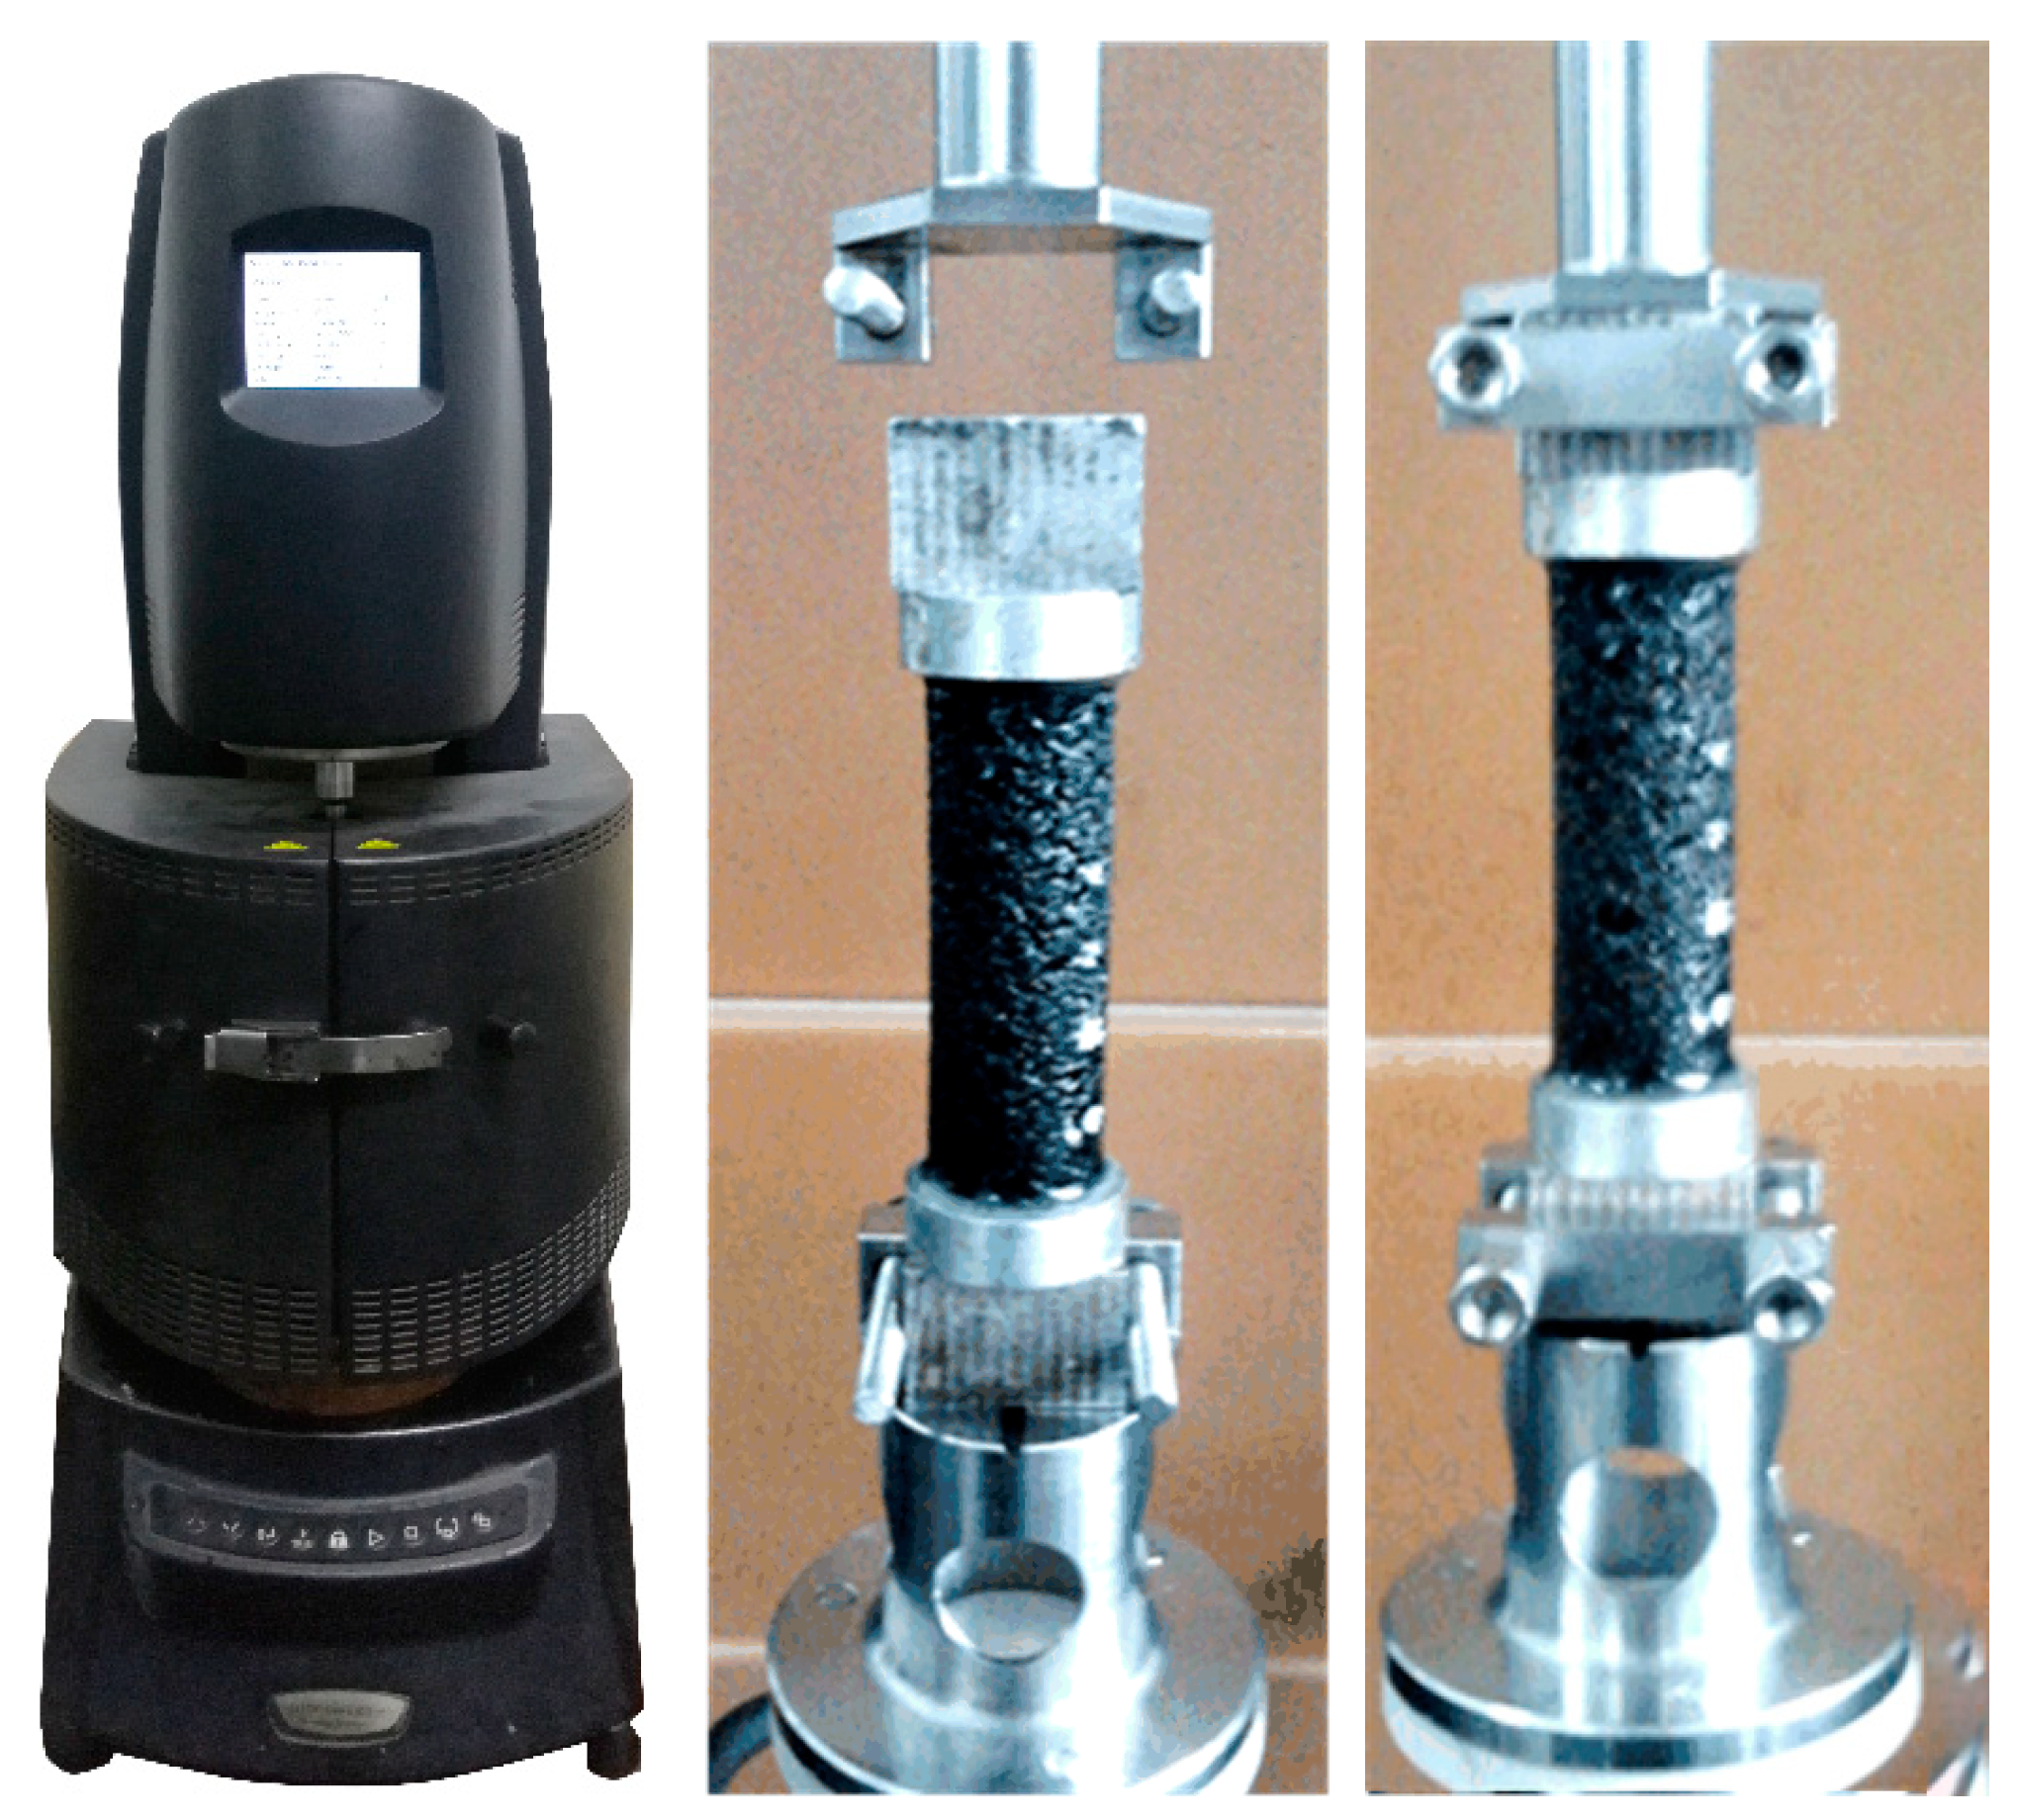
30]. The Discovery Hybrid Rheometer-II (DHR-II) was used to measure the dynamic modulus of asphalt mortar samples under a frequency sweep mode (from 0.1 to 25 Hz) at four different temperatures (30, 40, 50 and 60 °C), as shown in
Figure 5.
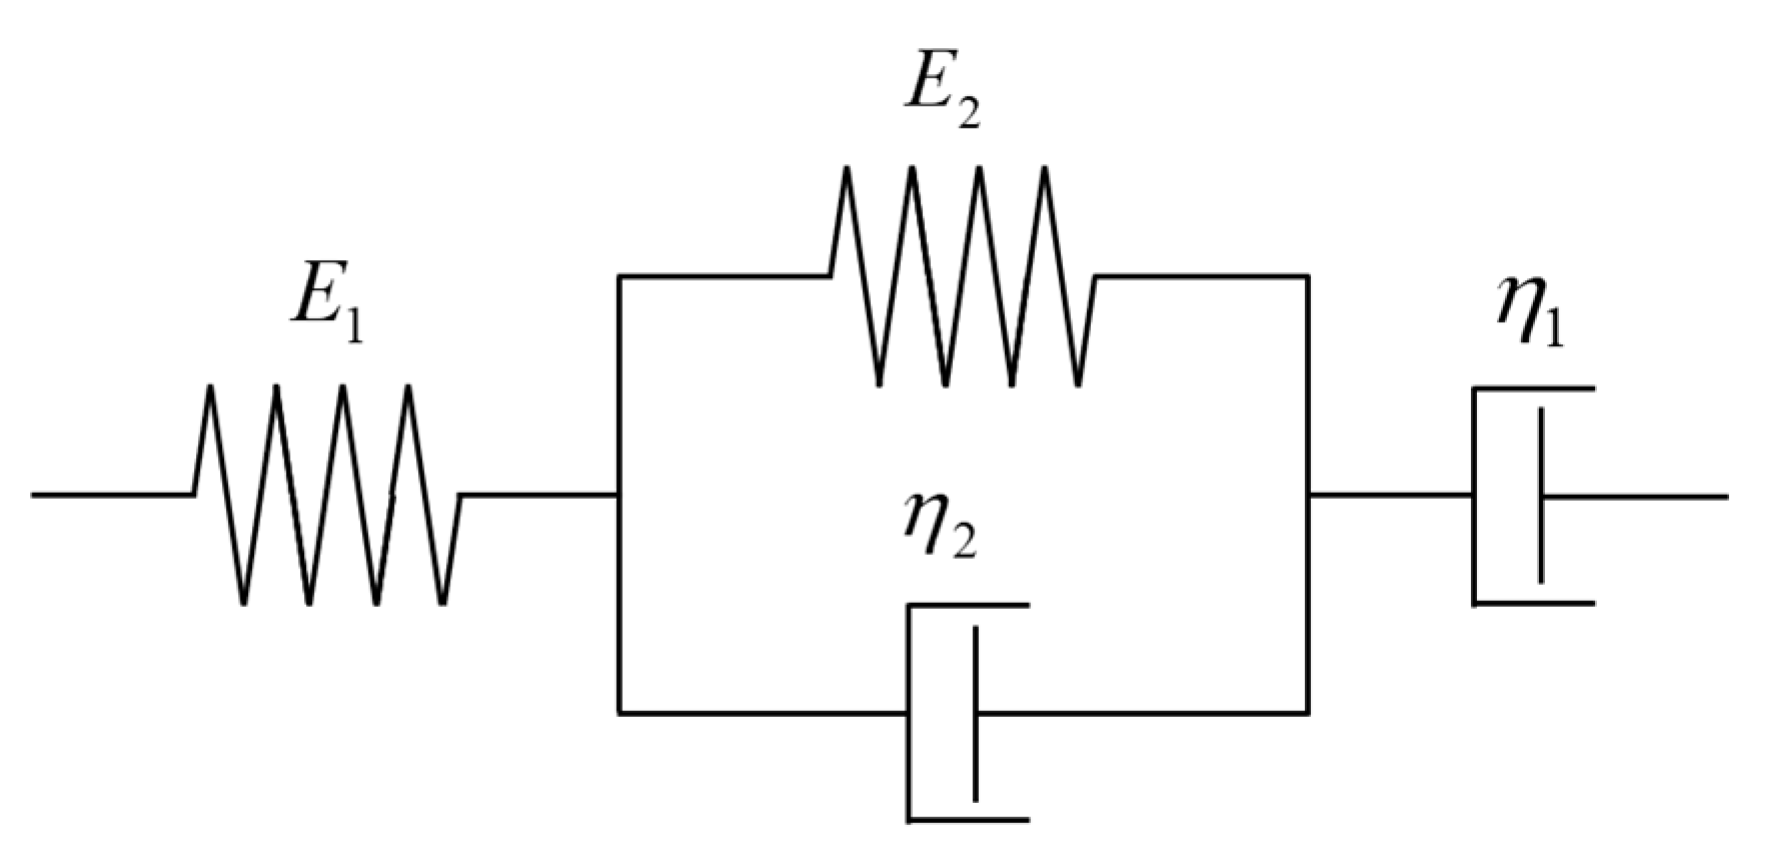
2.3.2. Burgers Model
The Burgers model was selected as the constitutive model to describe the viscoelastic property of asphalt mortar. This model is considered as the combination of the Maxwell and Kelvin models in series, as shown in
Figure 6.
This model is composed of two elastic parts and two viscous parts. The creep compliance function of the Burgers model is expressed as:
where retardation time
is a measure of the time taken for the creep strain to accumulate. Greater
value indicates the material is more viscous. The values of the model parameters can be obtained based on the dynamic modulus test results [
31].
3. Results and Discussion
3.1. Evaluation of Indirect Indexes
In this analysis, 8 of the 13 kinds of FAs (FA1-5 and FA8-10) were selected to conduct the uncompacted void content test, and the test results were shown in
Figure 7. It could be found that the uncompacted void content
of FA1 (natural sand) is significantly smaller than the other two types of FAs (stone chips and machine-made sand). One-way analysis of variance (ANOVA) was used to determine whether there are any statistically significant differences with respect to uncompacted void content
between different FA types and the calculated
value was 0.035. This value is much less than the significance level
which means that index uncompacted void content
cannot effectively distinguish the geometric characteristic difference of different FAs under the significance level of 95%.
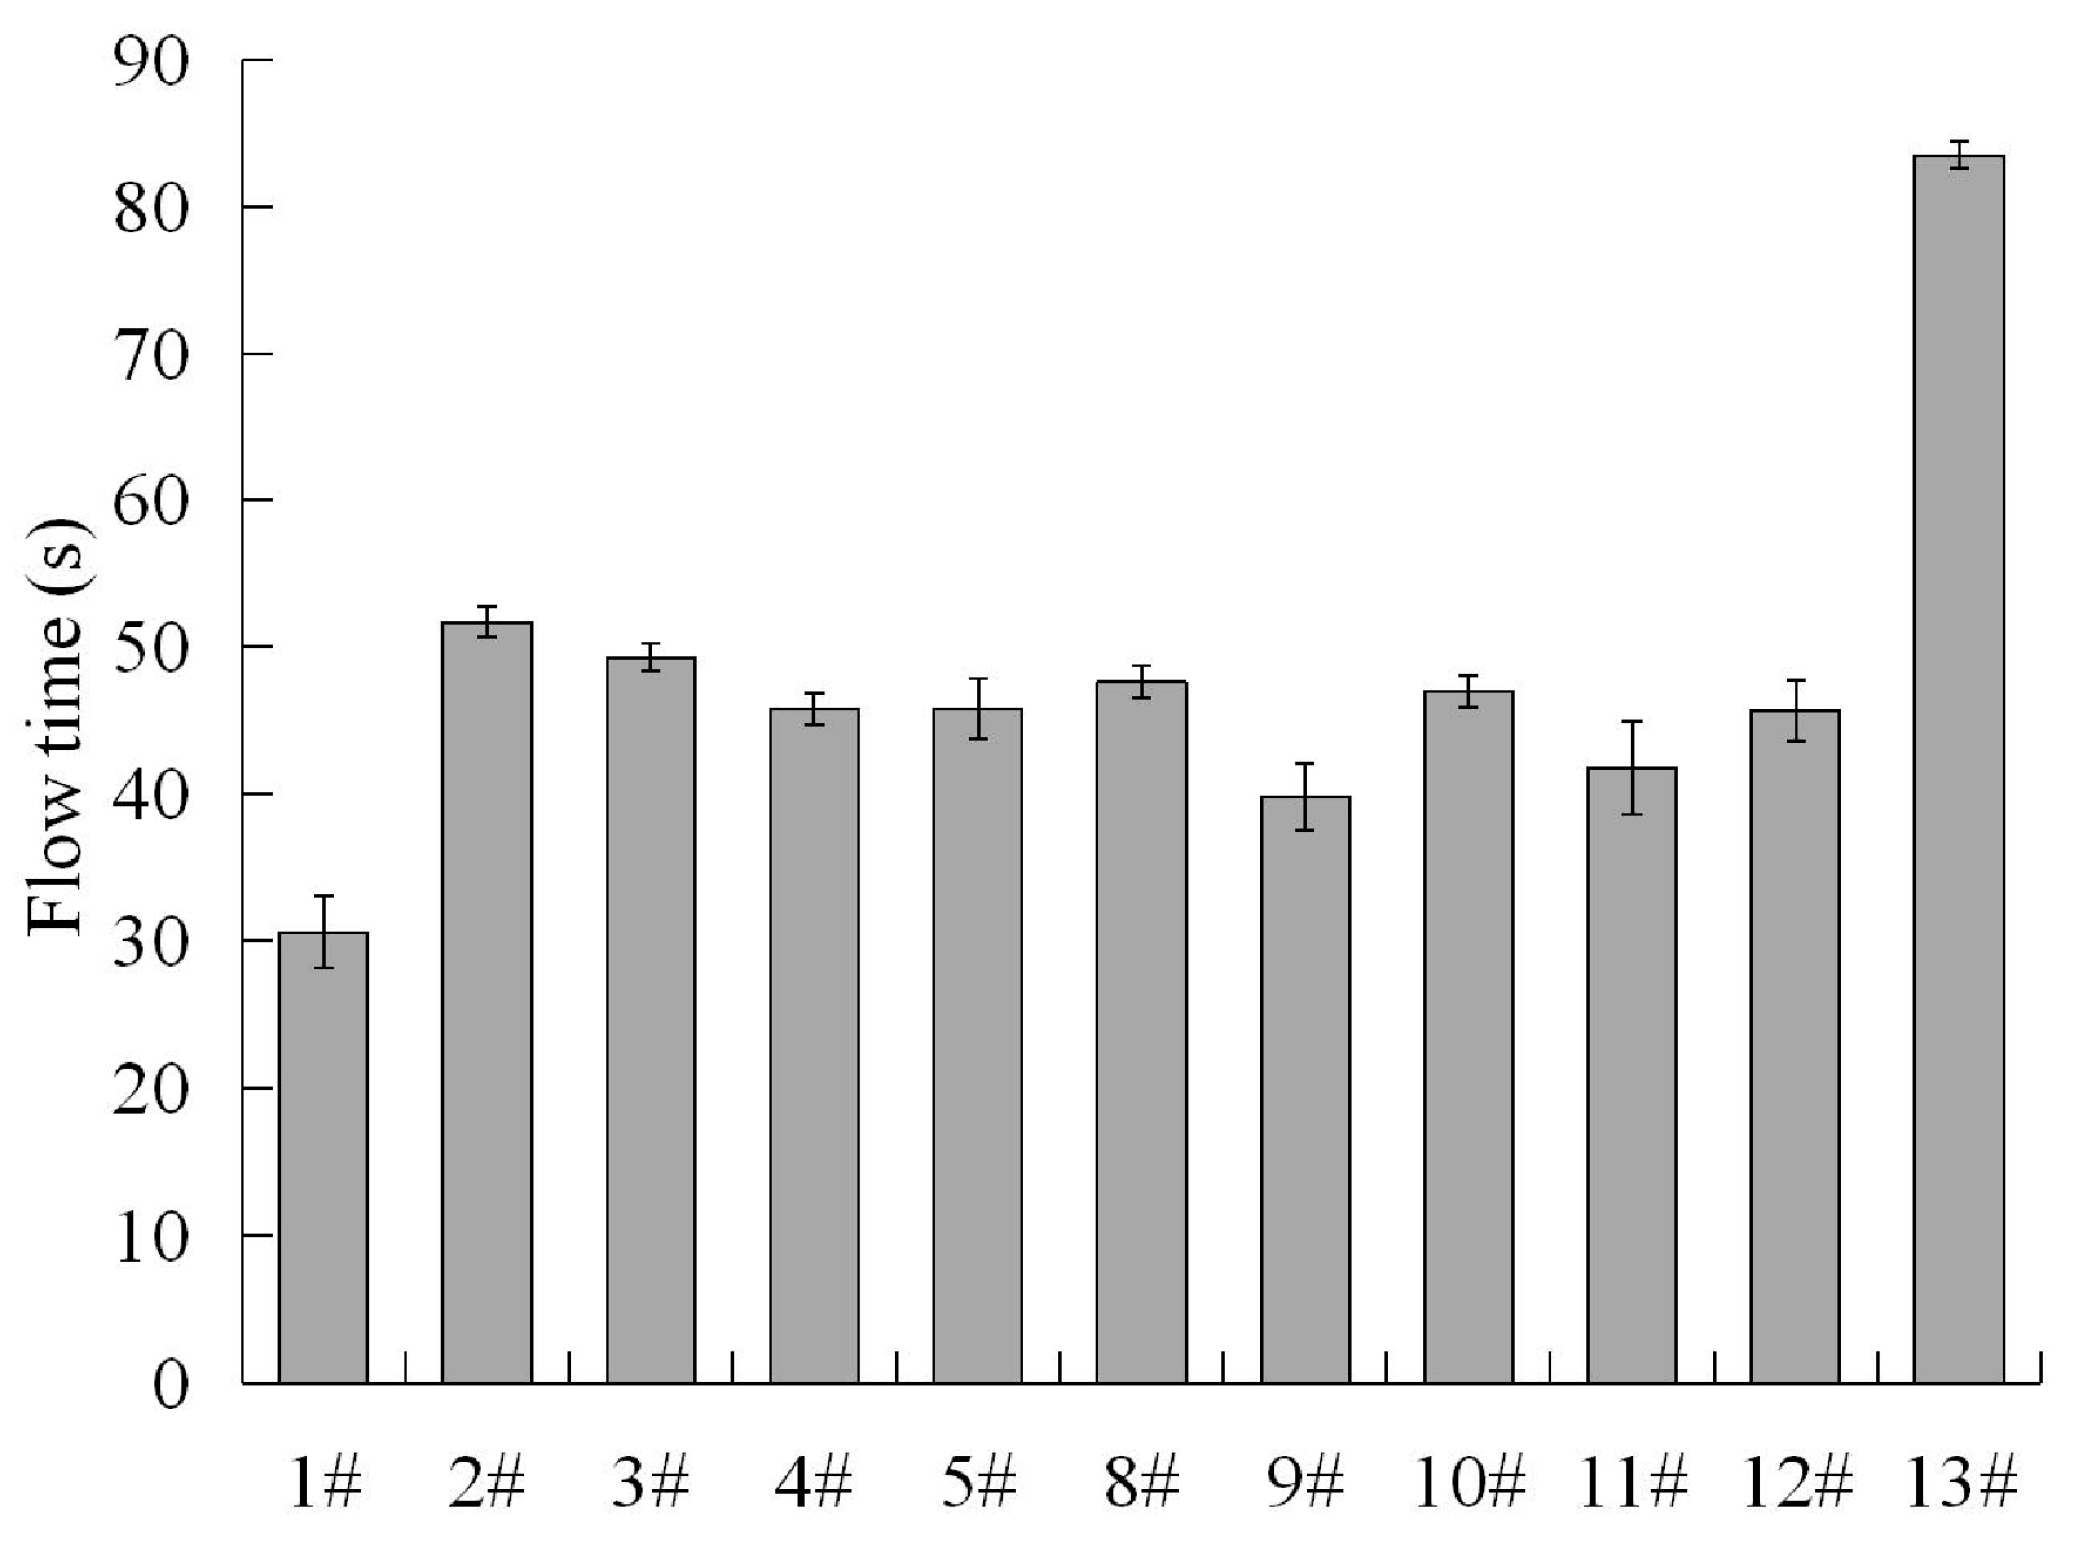
We selected 11 of the 13 kinds of FAs (FA1-5 and FA8-13) to conduct the flow time test, and the test results were shown in
Figure 8. It was found that the measured flow time of natural sand FA1 is significantly smaller than that of the other two types of FAs (stone chips and machine-made sand). The calculated
value from one-way ANOVA analysis was 0.108 and this value was much less than
. Thus, conclusions can be drawn that the index flow time
cannot effectively distinguish the geometric characteristic difference of different FAs under the significance level of 95%.
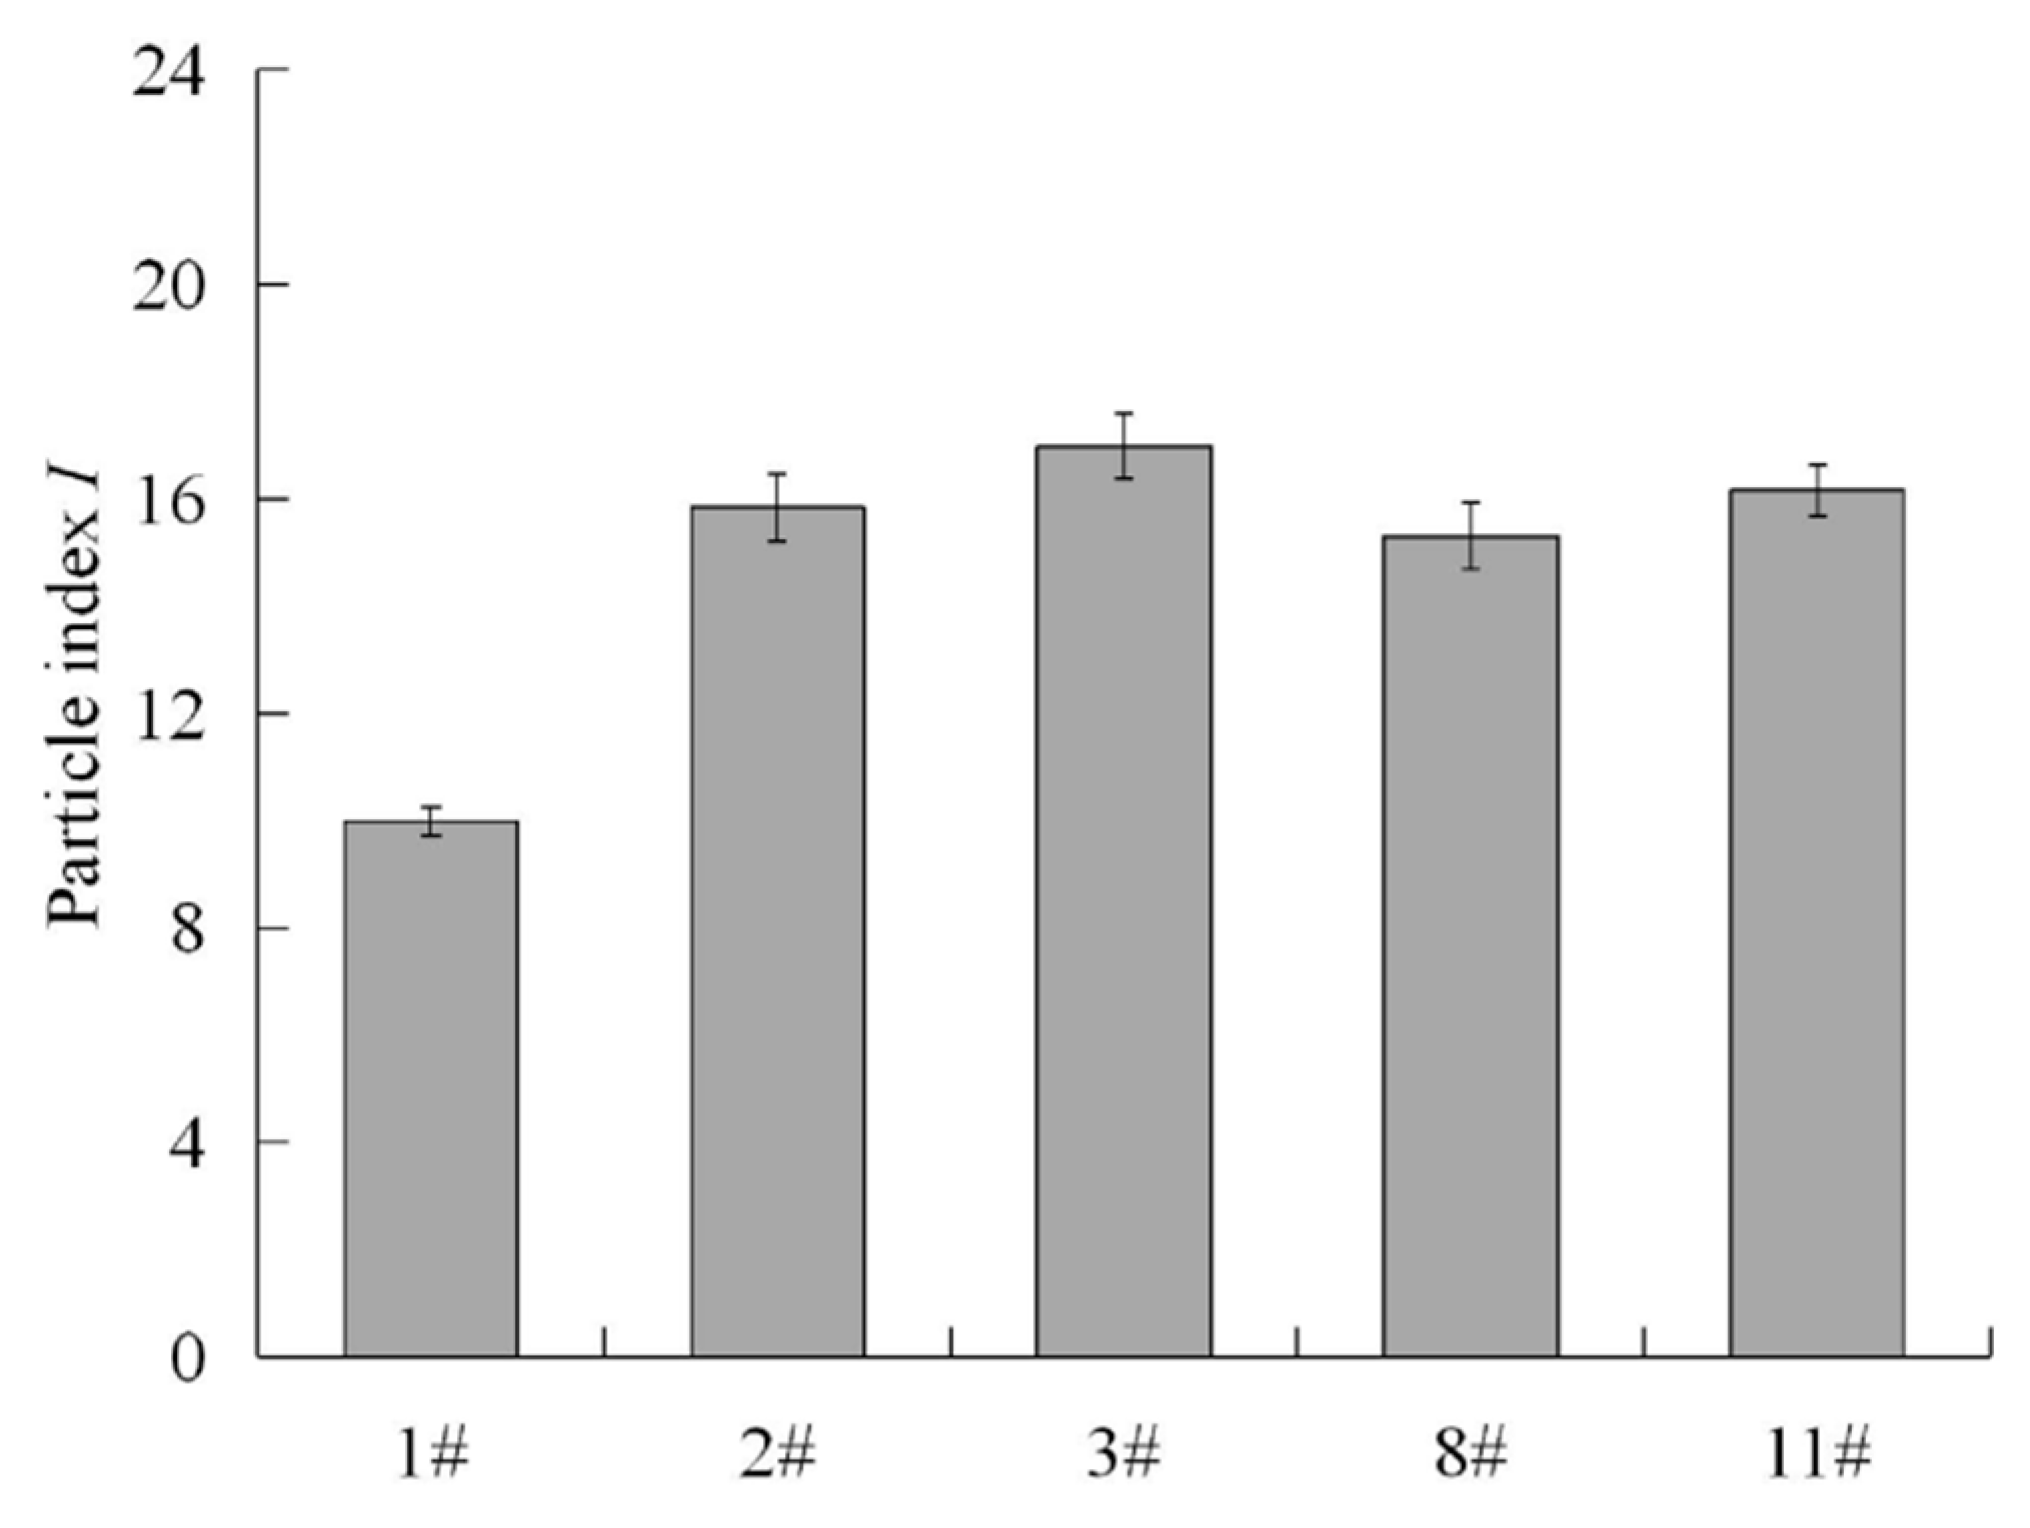
We selected 5 of the 13 kinds of FAs (FA1-3, FA8 and FA11) to conduct the ASTM D3398 test and the tested particle index
are shown in
Figure 9. It also shows that the measured particle index of natural sand FA1 is significantly smaller than that of the other two kinds of FAs. The calculated
value from one-way ANOVA analysis was 0.904 and it was also much less than
. This indicates that the index particle index
can also not effectively distinguish the geometric characteristic difference of different FAs under the significance level of 95%.
3.2. Representative Size for Fine Aggregate (FA) Geometry Characterization
In the indirect methods, measurements of the FA bulk properties were conducted on the graded aggregates. However, the direct methods are based on the direct measurement of the individual aggregates. In this case, it is necessary to find out a representative size for FA to eliminate the effect of particle size and represent the geometric characteristics of graded FA. Theoretically, the aggregates with the determined representative size should have the maximum correlation with the graded FA in terms of the geometric characteristics. Determination of the representative size can be achieved with resort to the gray relation analysis (GRA) method. The underlying mechanism of GRA method is to calculate the relation degree between reference sequence and comparative sequence. The greater the relation degree is, the higher the correlation will be.
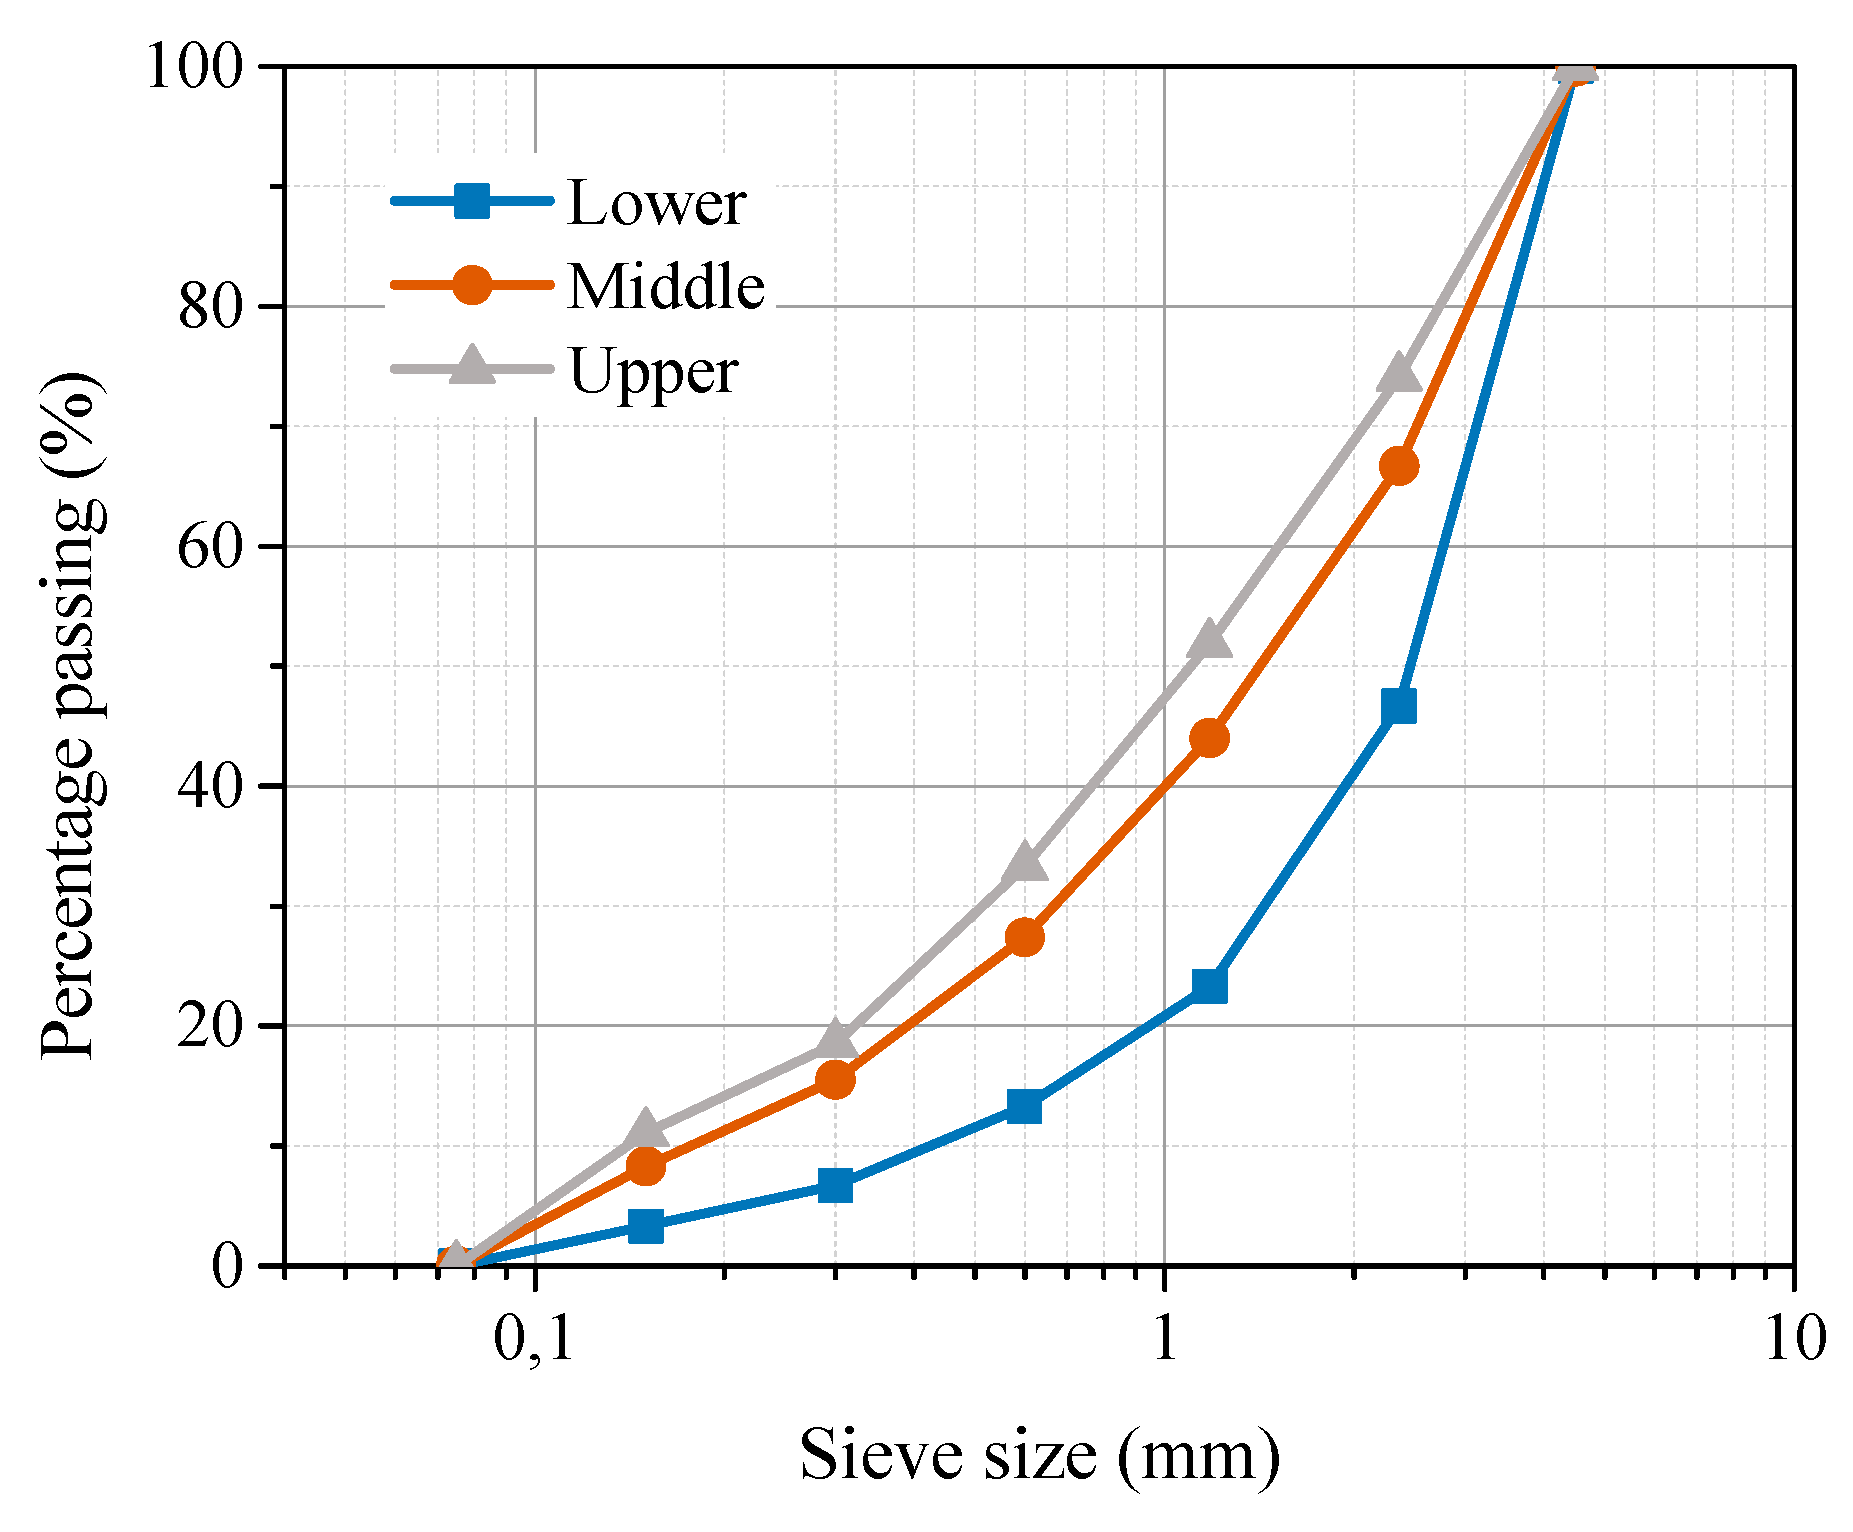
In this research, 3 FAs (FA 2, FA8 and FA10) were selected as the study object to investigate the representative size by means of the GRA method. Firstly, the mono-sized (2.36 mm, 1.18 mm, 0.6 mm, 0.3 mm, 0.15 mm, 0.075 mm) aggregates for each kind of the selected FAs were collected by sieving. For comparison, three kinds of graded aggregate for each kind of the selected FAs were blended according to upper, middle and lower gradations (see
Figure 10) recommended by “Technical Specification for Construction of Highway Asphalt Pavements” (JTG F40-2004).
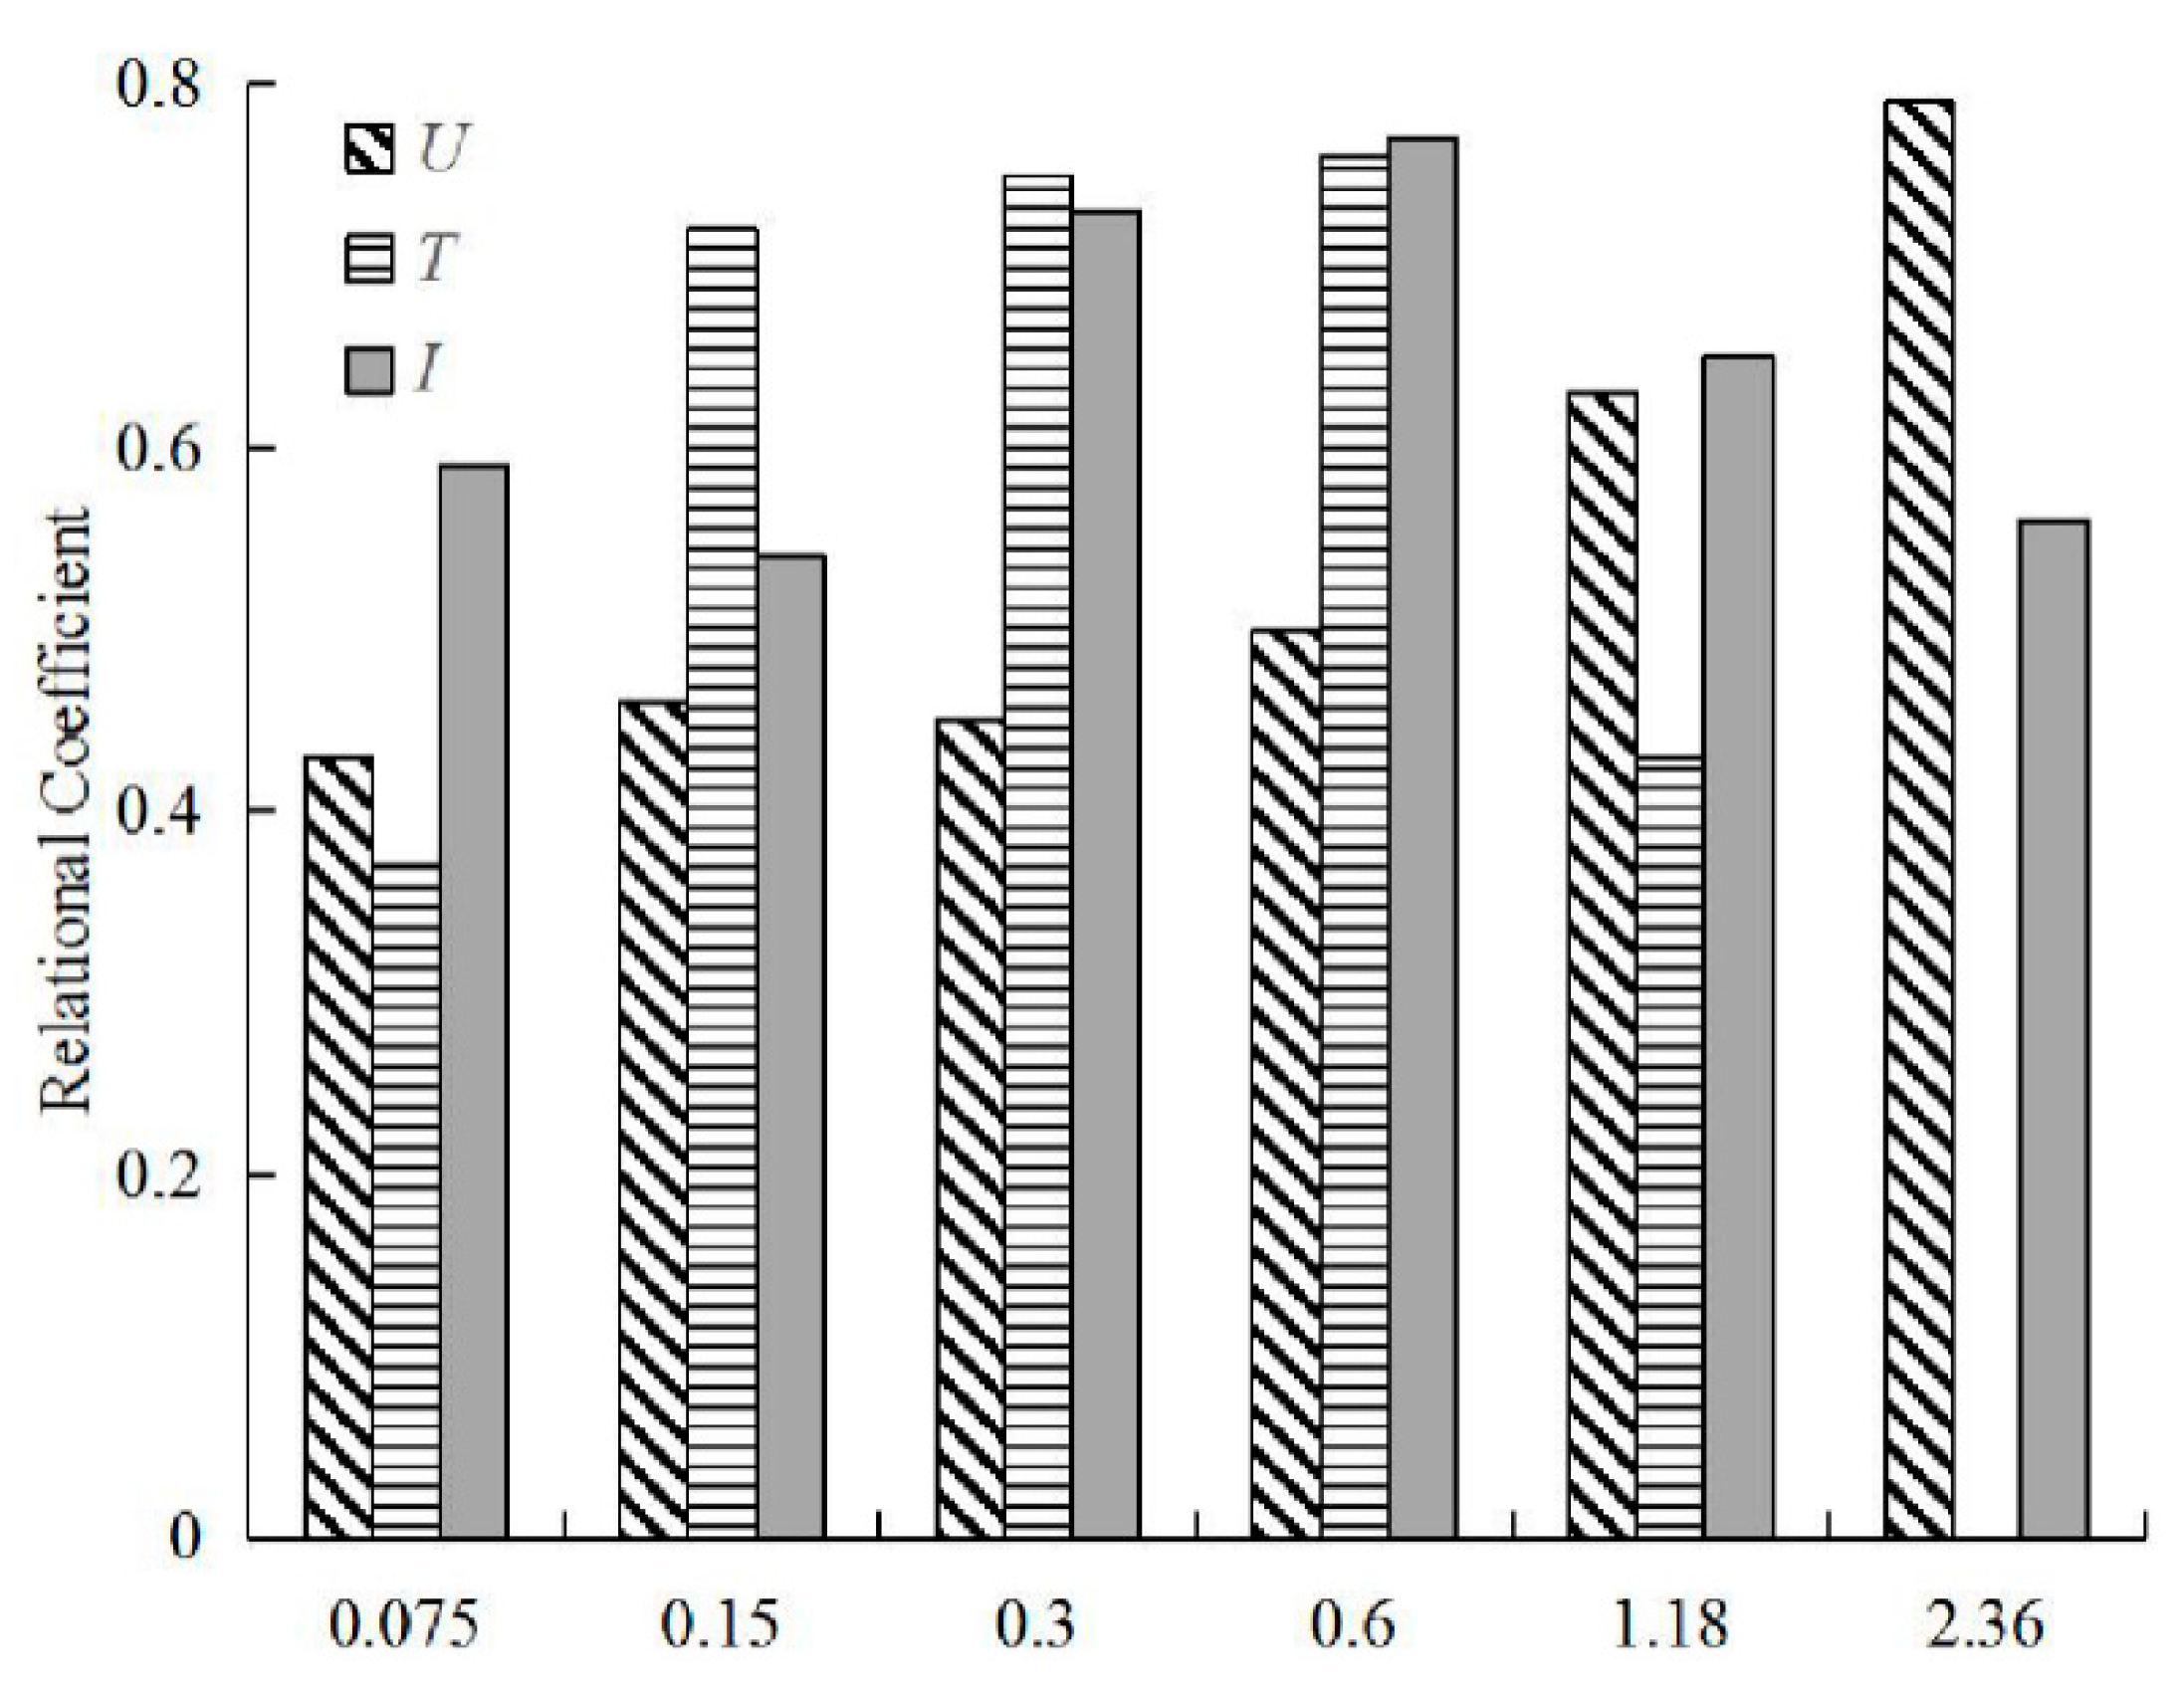
Then, the uncompacted void content test, flow time test and ASTM D3398 test were conducted on both mono-sized and graded aggregates, respectively. On basis of the test results, the GRA method was used to calculate the relation degree between the mono-sized and graded aggregates for all the three tests separately. But for the sake of comparing and analyzing, the calculation results for different tests were combined as shown in
Figure 11.
Figure 11 indicates that in the flow time test and ASTM D3398 test, the particle size of 0.6 mm exhibits the strongest relation with graded aggregate. In the uncompacted void content test, the particle size of 2.36 mm exhibits the strongest relation with graded aggregate, followed by 1.18 mm and 0.6 mm. In general, the 0.6 mm aggregates have the highest characteristic similarity with the graded fine aggregates. Thus, 0.6 mm was determined as the representative size of FA and used in the following FA geometric characterization.
3.3. Evaluation of Direct Indexes
In this part, 9 of the 13 kinds of FAs (FA1, FA3-8 and FA10-11) were selected to conduct the direct index evaluation. As mentioned above, the specified amount of aggregates with the representative size of 0.6 mm were prepared first. Then the digital images of the aggregates were obtained according to the procedures introduced in
Section 2 and the IPP and MATLAB coding were used to extract the form, angularity and texture indexes of the FA, respectively.
3.3.1. Analysis of Form Indexes
The measured form indexes, ratio of equivalent ellipse axis
and rectangularity
, of the selected 9 kinds of FA are shown in
Table 5. It can be seen that compared to stone chips and machine-made sand, the rectangularity
of natural sand (FA1) is closer to
. This means that the natural sand is rounder than stone chips and machine-made sand. However, no significant differences were observed in terms of the ratio of equivalent ellipse axis
among the three kinds of FAs. The one-way ANOVA analysis was also conducted to analyze the effect of FA type on ratio of equivalent ellipse axis
and rectangularity
. The calculated
value for ratio of equivalent ellipse axis
and rectangularity
were shown in
Table 6. It shows that the calculated
value for ratio of equivalent ellipse axis
is greater while that of the rectangularity
is smaller than the significance level
. This means that the shape index ratio of equivalent ellipse axis
can effectively distinguish the geometric characteristic difference of different FAs but rectangularity
fails under the significance level of 95%.
3.3.2. Analysis of Angularity Indexes
The measured angularity indexes, surface parameter
, perimeter ratio of equivalent ellipse
, convex ratio
, shape factor
and fractal dimension
of the selected 9 kinds of FAs based on the low-resolution images are shown in
Table 7. It shows that the natural sand (FA1) always has the smallest value in terms of the five angularity indexes. The one-way ANOVA analysis was further conducted to analyze the effect of FA type on the angularity indexes and results were shown in
Table 8. The results imply that the
value for surface parameter
is greater, but the
value for the other four indexes are smaller than
. This suggests that, among the angularity indexes, only the surface parameter
can effectively distinguish the geometric characteristic difference of different FAs under the significance level of 95%.
3.3.3. Analysis of Texture Indexes
The measured texture indexes, surface parameter
, perimeter ratio of equivalent ellipse
, convex ratio
, shape factor
and fractal dimension
, of the selected 9 kinds of FAs based on the high-resolution images were shown in
Table 9. It is not surprising to observe that the natural sand (FA1) has the smallest value in terms of the five texture indexes.
The one-way ANOVA analysis was also conducted to analyze the effect of FA type on the texture indexes and the results are shown in
Table 10. As can be seen in
Table 10, the calculated
values for all of the five indexes are smaller than
. Therefore, conclusions can be drawn that all the texture indexes fail to distinguish the geometric characteristic difference of different FAs at the significance level of 95%.
To summarize, the geometric characteristics of natural sand are significantly different from stone chips and machine-made sand according to the DIP-based direct evaluations. Among the adopted indexes in this research, only the form index ratio of equivalent ellipse axis and the angularity index surface parameter can effectively distinguish the geometric characteristic difference of different FAs.
3.4. Correlation of Indirect and Direct Indexes
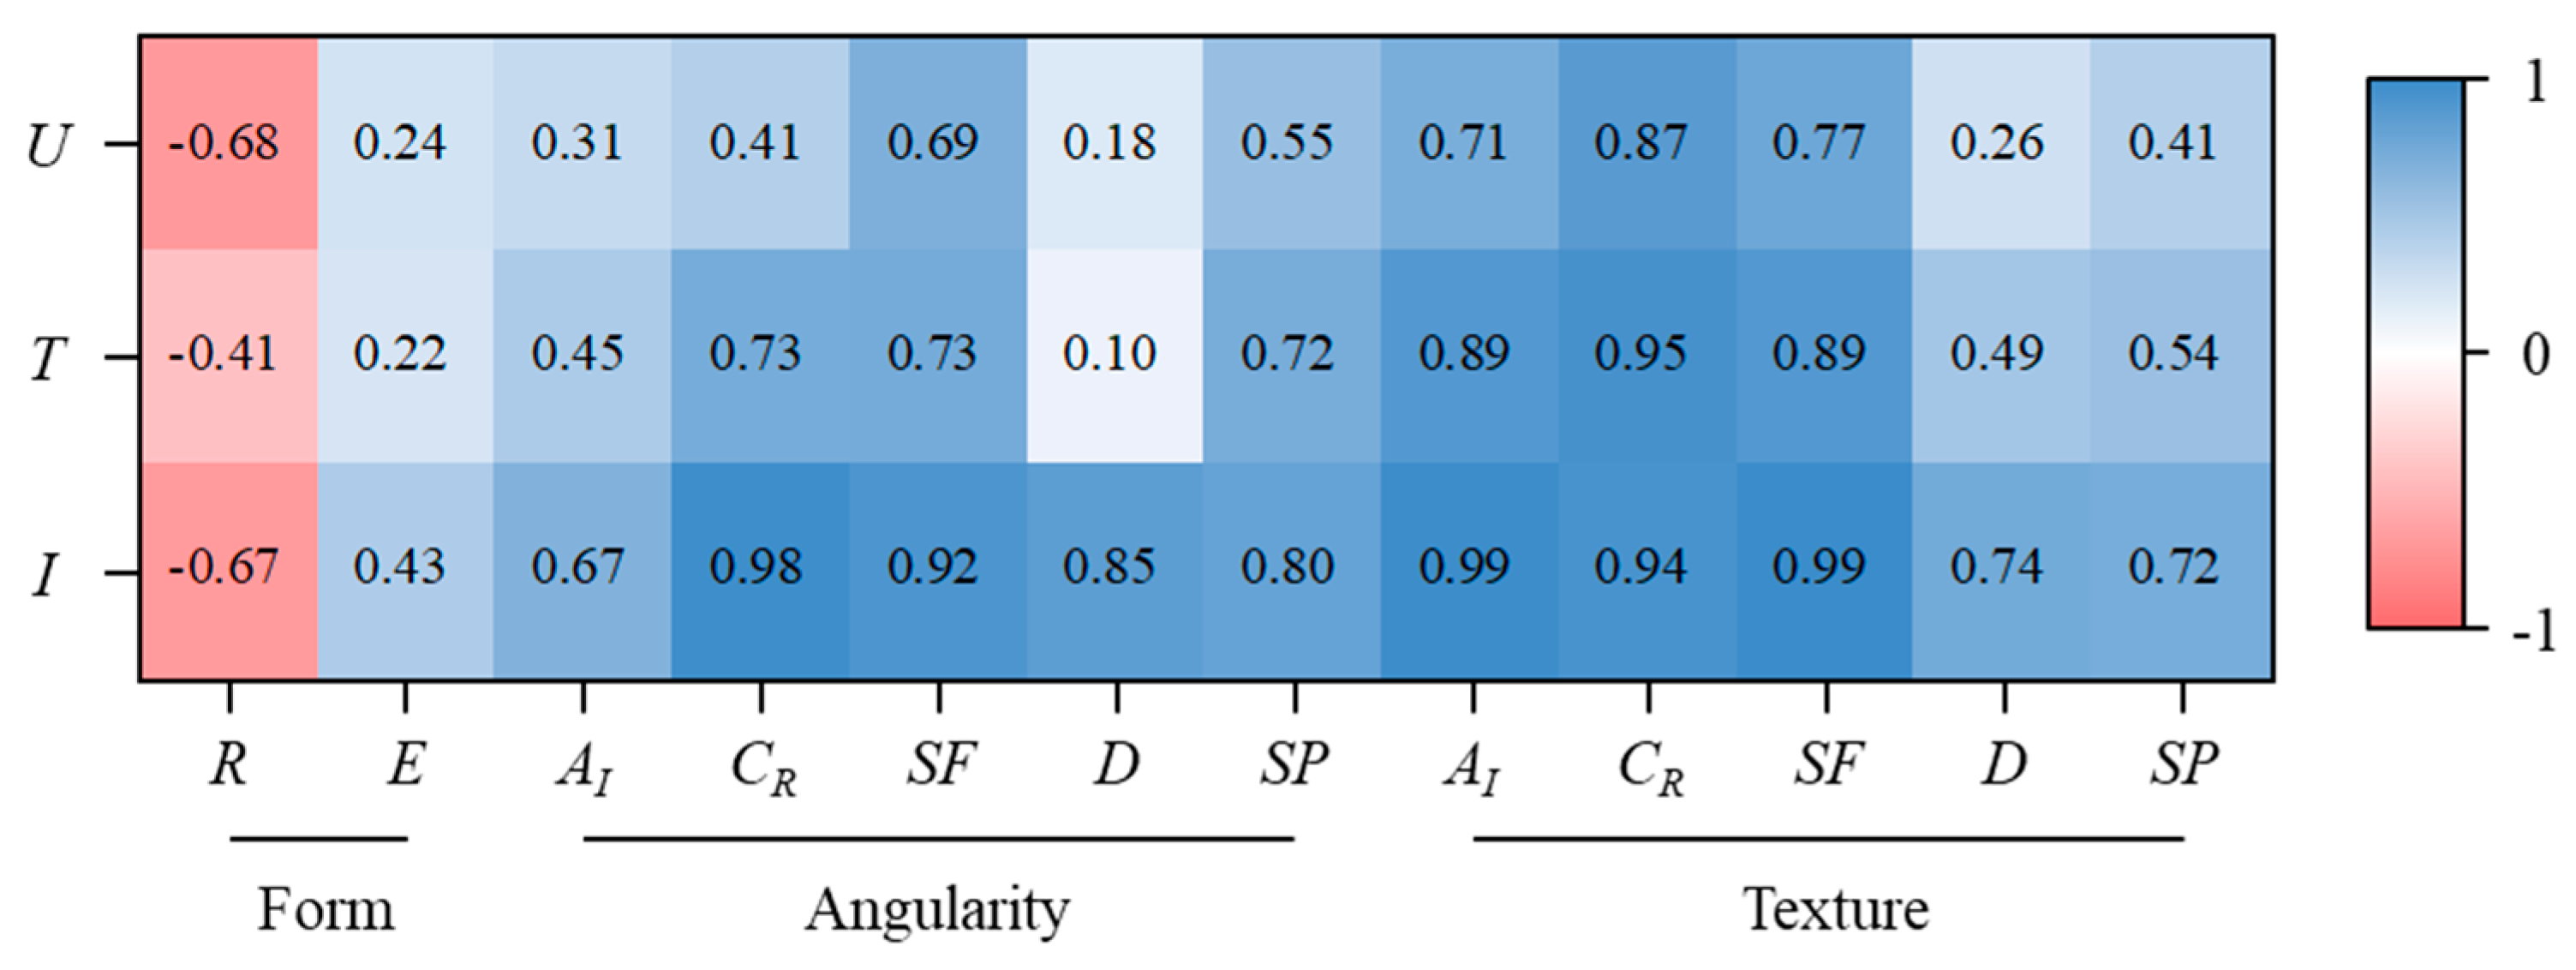
In the above research, we have used both the indirect method and the direct method to analyze the geometric characteristics of FA and evaluated the effectiveness and sensibility of both kinds of methods. The indirect methods focus on the overall behavior of the graded aggregate instead of the individual particles, and the test procedure is easy and time-saving. By contrast, the direct methods are time-consuming, but they provide more precise descriptions of the particle geometry. In order that the potential relevance between the indirect and direct methods was to be exploited, a statistical analysis was conducted in this part and correlations were run between the indirect and direct indexes, as shown in
Figure 12.
Figure 12 indicates that the indirect indexes were negatively associated with the form index
but positively associated with other direct indexes. In terms of the three indirect indexes, a good correlation was found to exist between the particle index
and the direct indexes. This means that the particle index
can better characterize the individual particle morphology. As for the direct indexes, the texture indexes exhibit the highest correlation with the direct indexes, followed by the angularity indexes and form indexes. The texture index convex ratio
displays strong correlation with all the three indirect indexes. It is likely that the texture morphology is the major factor that affects the overall behavior of FA rather than form and angularity.
3.5. Impact of FA Geometry on Viscoelastic Property of Asphalt Mortar
For purpose of investigating the impact of FA geometry on the viscoelastic property of asphalt mortar, the Burgers model parameters were firstly determined on basis of the dynamic modulus test results, as shown in
Table 11.
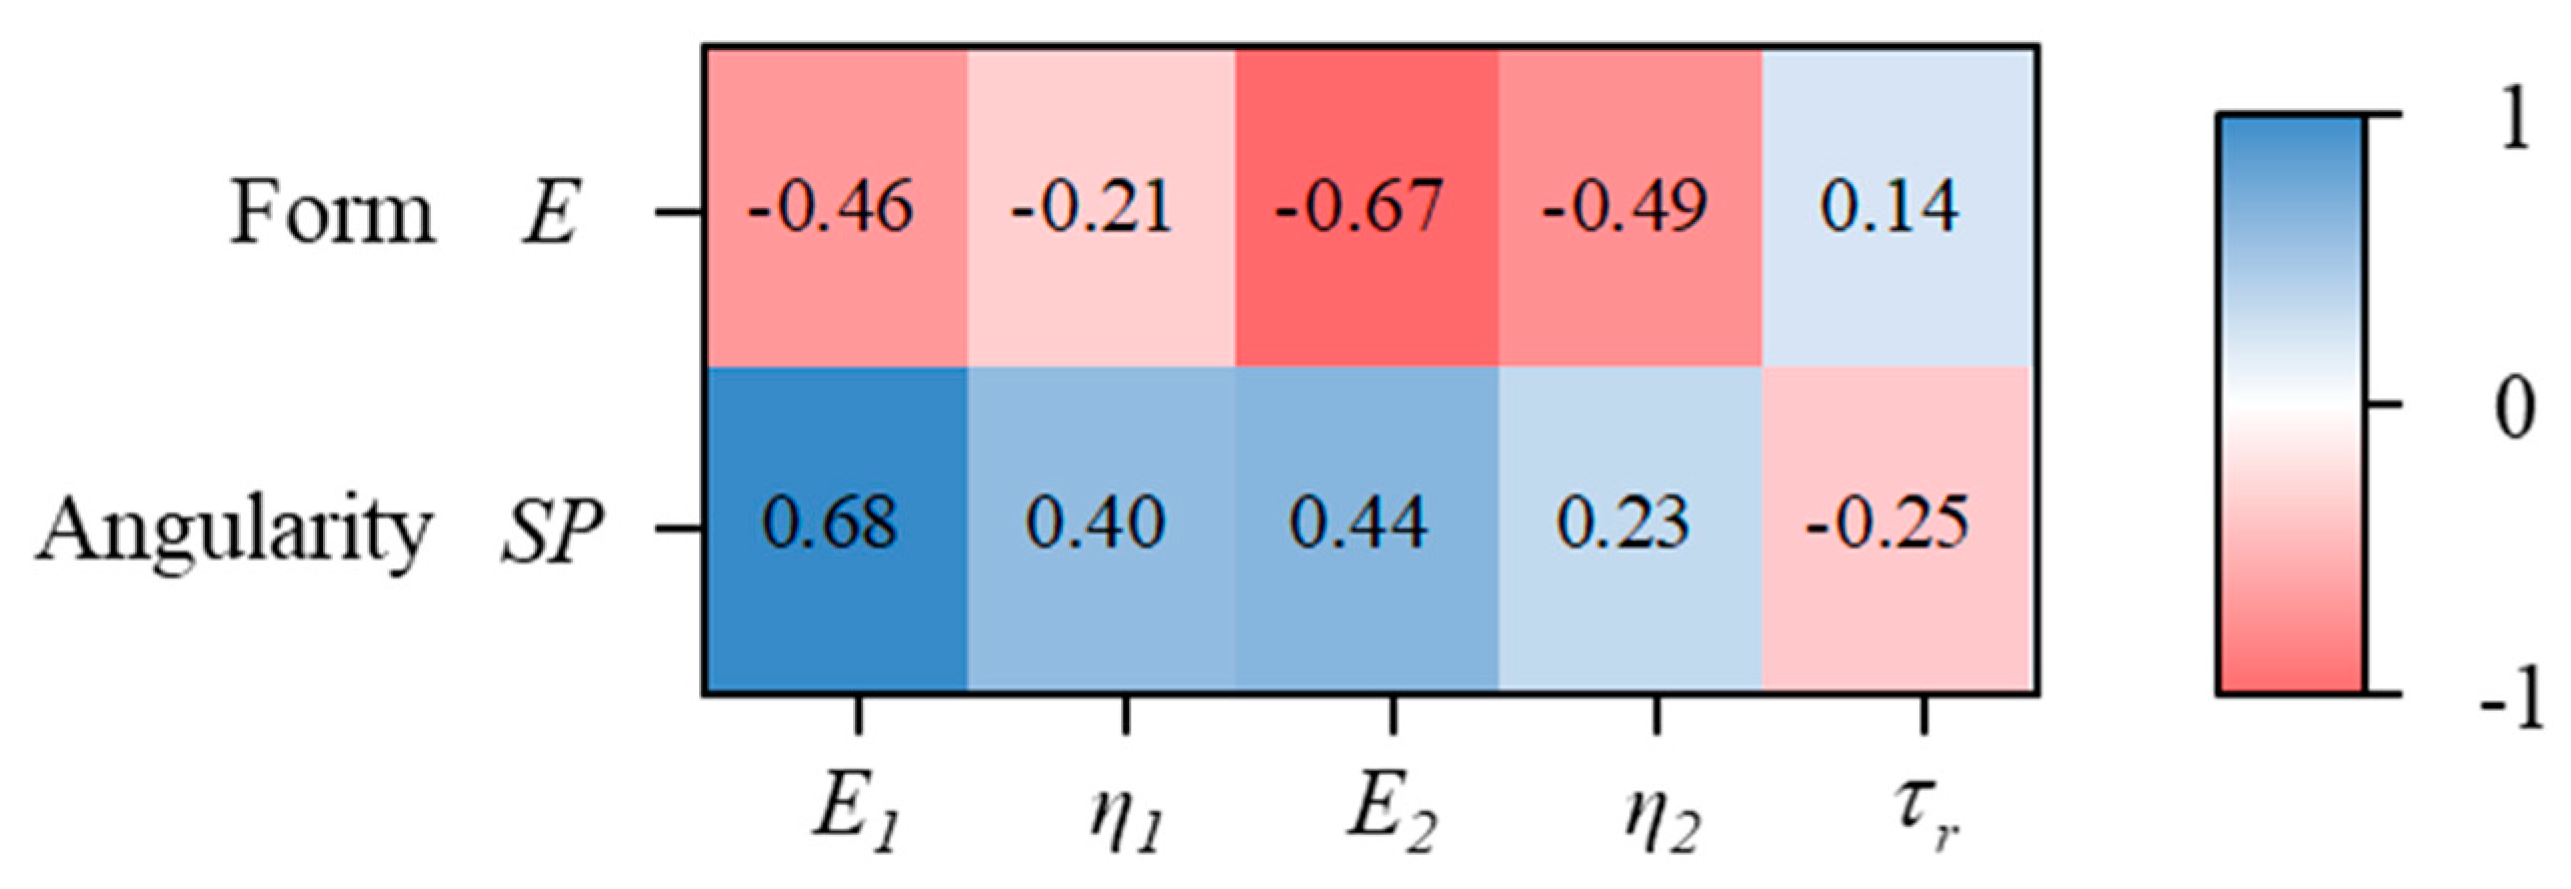
Correlation analysis was performed to calculate the coefficients of correlation between varying geometric indexes and rheological parameters, and the results are shown in
Figure 13. It could be found from
Figure 13 that the parameters of the four elements in the Burgers model are negatively related to the form index
but positively related to the angularity index
. However, the parameter retardation time
exhibits the opposite dependence on form index
and angularity index
. Considering the physical meanings of the form and angularity indexes, it is suggested that the use of less flat-elongated and more angular FAs produces stiffer and less viscous asphalt mortar.
4. Conclusions
In this research, investigations on the geometric characteristics of fine aggregates were carried out and the effects of aggregate geometry on the viscoelastic behavior of asphalt mortar were studied by using the Burgers rheological model. Based on this study, the following summary and conclusions can be made:
By comparing the correlations between the geometrical properties of mono-sized and graded fine aggregate mixtures, 0.6 mm was suggested as the representative size of FA geometrical characteristic investigation.
For the direct indicators, all these methods we chose in this research perform well in characterizing the morphology of FA. Moreover, the one-way ANOVA results indicate that only the form indicator ratio of equivalent ellipse axis E and angularity indicator surface parameter SP at low resolution (0.015 mm/pixel) can effectively distinguish different types of fine aggregates.
The correlation analysis between indirect and direct indicators shows that the ASTM D3398 test can better characterize the individual particle morphology compared to the uncompact void content test and flow time test. As for the direct indexes, the texture indexes exhibit the highest correlation with the direct indexes, followed by the angularity indexes and form indexes.
The variation of the viscoelastic properties of the asphalt mortar, which is caused by fine aggregate shape characteristics and angular characteristics, have been analyzed based on the Burgers model. The parameters of the four elements in the Burgers model are negatively related to the form index E but positively related to the angularity index SP while the parameter retardation time τr exhibits the opposite. The results indicated that regular shape and complex appearance shows a high resistance to deformation in the condition of low temperature or high-frequency load. Meanwhile, the results show that the viscous component of the dynamic response is almost impervious to the lithology and geometrical characteristics. The impact of the geometrical character of FA on skid resistance will be investigated in future research.
Author Contributions
Conceptualization, C.X.; Formal analysis, Z.F.; Investigation, T.T.; Project administration, Y.T. and H.X.; Software, M.O. All authors have read and agreed to the published version of the manuscript.
Acknowledgments
This work was supported by the Key Program for International S&T Cooperation Projects of China (Grant No. 2018YFB1600203), National Natural Science Funds of China (Grant No. 51678207) and Fundamental Research Funds for the Central Universities (Grant No. HIT.BRETⅢ.201511). Thanks to the anonymous reviewers for their comments that have notably helped us improve the manuscript.
Conflicts of Interest
The authors declare no conflict of interest.
Notations
| U | Uncompact void content |
| MX | Fineness modulus |
| A0.15, A0.3, A0.6, A1.18, A2.36, A4.75 | Grader retained percentage |
| γfa | The apparent relative density |
| γb | The bulk volume relative density |
| T | Flow time |
| Ia,I | Average particle index |
| q10,q50 | The voids in aggregate compacted at 10 and 50 drops per layer |
| m10,m50 | The average masses of the aggregate in the mold compacted at 10 and 50 drops per layer |
| S | The bulk-dry specific gravity of the aggregate size fraction |
| V | The volume of the cylindrical mold |
| E | Ratio of equivalent ellipse axis |
| R | Rectangularity |
| SP | Surface parameter |
| AI | Perimeter ratio of equivalent ellipse |
| CR | Convex ratio |
| SF | Shape factor |
| D | Fractal Dimension |
| a | The major axis of the equivalent ellipse |
| b | The minor axis of the equivalent ellipse |
| Ai | The area of aggregate |
| Ar | The area of the minimum enclosing rectangle |
| A1 | The areas of the aggregate images before applying the erosion-dilation operation |
| A2 | The areas of the aggregate images after applying the erosion-dilation operation |
| L1 | The perimeters of the particle cross section |
| L2 | The perimeters of the equivalent ellipse |
| CL | The perimeter of the convex |
| S | The area of the aggregate |
| E1,E2 | Elastic parameters |
| η1,η2 | Viscous parameters |
| τr | Retardation time |
| ASTM | American Society of Testing Materials |
| AFNOR | Association Francaise de Normalisation |
| IPP | Image-Pro Plus |
References
- Chowdhury, A.; Button, J.W. Fine aggregate angularity: Conventional and unconventional approach. ASTM Spec. Tech. Publ. 2001, 16, 144–159. [Google Scholar] [CrossRef]
- Topal, A.; Sengoz, B. Determination of fine aggregate angularity in relation with the resistance to rutting of hot-mix asphalt. Constr. Build. Mater. 2005, 19, 155–163. [Google Scholar] [CrossRef]
- Persson, B. Theory of rubber friction and contact mechanics. J. Chem. Phys. 2001, 115, 3840–3861. [Google Scholar] [CrossRef]
- Georgiou, P.; Loizos, A. A laboratory compaction approach to characterize asphalt pavement surface friction performance. Wear 2014, 311, 114–122. [Google Scholar] [CrossRef]
- Wang, D.; Chen, X.; Xie, X. A study of the laboratory polishing behavior of granite as road surfacing aggregate. Constr. Build. Mater. 2015, 89, 25–35. [Google Scholar] [CrossRef]
- Tan, Y.; Xu, H.; Li, X. Is normal distribution the most appropriate statistical distribution for volumetric properties in asphalt mixture? J. Test. Eval. 2009, 37, 468–478. [Google Scholar]
- Pouranian, M.R.; Haddock, J.E. Determination of voids in the mineral aggregate and aggregate skeleton characteristics of asphalt mixtures using a linear-mixture packing model. Constr. Build. Mater. 2018, 188, 292–304. [Google Scholar] [CrossRef]
- Pouranian, M.R.; Haddock, J.E. A new framework for understanding aggregate structure in asphalt mixtures. Int. J. Pavement Eng. 2019, 1–17. [Google Scholar] [CrossRef]
- Shi, L.; Wang, D.; Xiao, X.; Qin, X. Meso-structural characteristics of asphalt mixture main skeleton based on meso-scale analysis. Constr. Build. Mater. 2020, 232, 117263. [Google Scholar] [CrossRef]
- Xu, H.; Guo, W.; Tan, Y. Internal structure evolution of asphalt mixtures during freeze-thaw cycles. Mater. Des. 2015, 86, 436–446. [Google Scholar] [CrossRef]
- Button, J.; Dario, P.; Lytton, R. Influence of aggregate on rutting in asphalt concrete pavements. Transp. Res. Rec. 1990, 1259, 141–152. [Google Scholar]
- Livneh, M. Influence of aggregate shape on engineering properties of asphaltic paving. Highw. Res. Rec. 1972, 40, 42–56. [Google Scholar]
- Xu, H.; Zhou, J.; Dong, Q. Characterization of moisture vapor diffusion in fine aggregate mixtures using Fickian and non-Fickian models. Mater. Des. 2017, 124, 108–120. [Google Scholar] [CrossRef]
- Hossain, M.; Parker, J.F.; Kandhal, P.S. Tests for evaluating fine aggregate particle shape, angularity, and surface texture. Transp. Res. Rec. 1999, 1673, 64–72. [Google Scholar] [CrossRef]
- Kandhal, P.; Motter, J.B.; Khatri, M.A. Evaluation of particle shape and texture: Manufactured versus natural sands. Transp. Res. Rec. 1991, 1301, 48–56. [Google Scholar]
- Wang, L.; Wang, X.; Mohammad, L. Unified method to quantify aggregate shape angularity and texture using Fourier analysis. J. Mater. Civ. Eng. 2005, 17, 498–504. [Google Scholar] [CrossRef]
- Masad, E.; Button, J. Unified imaging approach for measuring aggregate angularity and texture. Comput. Aided Civ. Infrastruct. 2000, 15, 273–280. [Google Scholar] [CrossRef]
- Rao, C.; Tutumluer, E.; Kim, I.T. Quantification of coarse aggregate angularity based on image analysis. Transp. Res. Rec. 2002, 1787, 117–124. [Google Scholar] [CrossRef]
- Kwan, A.; Mora, C.; Chan, H. Particle shape analysis of coarse aggregate using digital image processing. Cem. Concr. Res. 1999, 29, 1403–1410. [Google Scholar] [CrossRef]
- Salehi, R.; Little, D.N.; Masad, E. Material factors that influence anisotropic behavior of aggregate bases. Transp. Res. Rec. 2008, 2059, 20–30. [Google Scholar] [CrossRef]
- Masad, E.; Muhunthan, B.; Shashidhar, N.; Harman, T. Internal structure characterization of asphalt concrete using image analysis. J. Comput. Civ. Eng. 1999, 13, 88–95. [Google Scholar] [CrossRef]
- Masad, E.; Olcott, D.; White, T. Correlation of fine aggregate imaging shape indices with asphalt mixture performance. Transp. Res. Rec. 2001, 1757, 148–156. [Google Scholar] [CrossRef]
- Al-Rousan, T.; Masad, E.; Tutumluer, E. Evaluation of image analysis techniques for quantifying aggregate shape characteristics. Constr. Build. Mater. 2007, 21, 978–990. [Google Scholar] [CrossRef]
- Masad, E.; Jandhyala, V.K.; Dasgupta, N.; Somadevan, N.; Shashidhar, N. Characterization of air void distribution in asphalt mixes using X-ray computed tomography. J. Mater. Civ. Eng. 2004, 14, 122–129. [Google Scholar] [CrossRef]
- Prudencio, L.R.; Weidmann, D.F.; de Oliveira, A.L.; Damo, G.F. Particle shape analysis of fine aggregate using a simplified digital image processing method. J. Inst. Civ. Eng. 2013, 65, 27–36. [Google Scholar] [CrossRef]
- Johnson, E.; Li, X.J.; Adam, Z. Investigation of superpave fine aggregate angularity criterion for asphalt concrete. Transp. Res. Rec. 2007, 1998, 75–81. [Google Scholar] [CrossRef]
- Thomas, B.; Ali, M.; Matthew, B. Comparing fine aggregate angularity with aggregate and hot-mix asphalt performance tests. Transp. Res. Rec. 2006, 1962, 79–89. [Google Scholar]
- Xu, H.; Chen, F.; Yao, X.; Tan, Y. Micro-scale moisture distribution and hydrologically active pores in partially saturated asphalt mixtures by X-ray computed tomography. Constr. Build. Mater. 2018, 160, 653–667. [Google Scholar] [CrossRef]
- Xu, H.; Xing, C.; Zhang, H. Moisture seepage in asphalt mixture using X-ray imaging technology. Int. J. Heat Mass Transf. 2019, 131, 375–384. [Google Scholar] [CrossRef]
- Gong, X. Mechanical Behavior within Multiscales and United Models of Asphalt Pavement Materials. Ph.D. Thesis, Harbin Institute of Technology, Harbin, China, 2017. [Google Scholar]
- Liu, Y.; Dai, Q.; You, Z. Viscoelastic model for discrete element simulation of asphalt mixtures. J. Eng. Mech. 2009, 135, 324–333. [Google Scholar] [CrossRef]
Figure 1.
The image-capturing device.
Figure 1.
The image-capturing device.
Figure 2.
The obtained digital images of FA with different resolutions.
Figure 2.
The obtained digital images of FA with different resolutions.
Figure 3.
Schematic of the equivalent ellipse.
Figure 3.
Schematic of the equivalent ellipse.
Figure 4.
Fabricated asphalt mortar samples for dynamic modulus test.
Figure 4.
Fabricated asphalt mortar samples for dynamic modulus test.
Figure 5.
Testing devices for cylindrical asphalt mortar.
Figure 5.
Testing devices for cylindrical asphalt mortar.
Figure 6.
Schematic diagram of the Burgers model.
Figure 6.
Schematic diagram of the Burgers model.
Figure 7.
Uncompacted void content of different FAs.
Figure 7.
Uncompacted void content of different FAs.
Figure 8.
Flow time of different FAs.
Figure 8.
Flow time of different FAs.
Figure 9.
Particle index of different FAs.
Figure 9.
Particle index of different FAs.
Figure 10.
The recommended aggregate gradations.
Figure 10.
The recommended aggregate gradations.
Figure 11.
Comparison of the gray relation degree of different mono-size.
Figure 11.
Comparison of the gray relation degree of different mono-size.
Figure 12.
Coefficients of correlation between indirect and direct indexes.
Figure 12.
Coefficients of correlation between indirect and direct indexes.
Figure 13.
Coefficients of correlation between geometrical indexes and Burgers model parameters.
Figure 13.
Coefficients of correlation between geometrical indexes and Burgers model parameters.
Table 1.
Basic technical properties of the 13 fine aggregates (FAs).
Table 1.
Basic technical properties of the 13 fine aggregates (FAs).
| No. | Type | Origin | Fineness Modulus | Apparent Relative Density | Lithology |
|---|
| 1 | Natural sand | Heilongjiang | 2.9 | 2.618 | Siliceous |
| 2 | Stone chips | Jilin | 2.6 | 2.740 | Limestone |
| 3 | Stone chips | Jilin | 2.4 | 2.747 | Limestone |
| 4 | Stone chips | Shandong | 2.7 | 2.861 | Limestone |
| 5 | Stone chips | Heilongjiang | 2.9 | 2.708 | Andesite |
| 6 | Stone chips | Gansu | 3.4 | 2.730 | - |
| 7 | Machine-made sand | Gansu | 3.0 | 2.642 | Granite |
| 8 | Machine-made sand | Jilin | 3.2 | 2.742 | Limestone |
| 9 | Machine-made sand | Jilin | 2.8 | 2.755 | Limestone |
| 10 | Machine-made sand | Shandong | 3.0 | 2.844 | Basalt |
| 11 | Machine-made sand | Heilongjiang | 2.5 | 2.778 | Basalt |
| 12 | Machine-made sand | Heilongjiang | 3.2 | 2.826 | Basalt |
| 13 | Machine-made sand | Heilongjiang | 4.2 | 2.822 | Basalt |
Table 2.
Granular composition of the 13 FAs.
Table 2.
Granular composition of the 13 FAs.
| | Particle Size/mm | 4.75 | 2.36 | 1.18 | 0.6 | 0.3 | 0.15 | 0.075 |
|---|
| No. | |
|---|
| 1 | 100.0 | 89.5 | 72.9 | 42.6 | 9.4 | 2.3 | 0.6 |
| 2 | 100.0 | 87.9 | 62.5 | 44.4 | 31.4 | 19.3 | 14.1 |
| 3 | 100.0 | 91.6 | 66.0 | 47.1 | 33.7 | 24.5 | 20.6 |
| 4 | 100.0 | 93.0 | 65.3 | 38.9 | 20.5 | 13.4 | 10.6 |
| 5 | 100.0 | 88.6 | 59.2 | 34.2 | 17.7 | 9.4 | 3.5 |
| 6 | 100.0 | 61.4 | 43.4 | 27.7 | 16.2 | 11.0 | 1.1 |
| 7 | 100.0 | 76.6 | 57.6 | 36.5 | 17.7 | 8.8 | 1.2 |
| 8 | 100.0 | 100.0 | 59.3 | 13.4 | 3.7 | 2.7 | 1.9 |
| 9 | 100.0 | 92.5 | 61.8 | 36.4 | 19.9 | 9.4 | 6.0 |
| 10 | 100.0 | 79.9 | 53.0 | 38.0 | 19.9 | 11.4 | 5.6 |
| 11 | 100.0 | 94.9 | 71.7 | 44.5 | 26.6 | 14.0 | 6.7 |
| 12 | 100.0 | 88.2 | 50.7 | 23.0 | 12.2 | 3.6 | 1.6 |
| 13 | 100.0 | 58.5 | 15.6 | 3.3 | 1.6 | 1.3 | 1.3 |
Table 3.
Indexes of fine aggregate geometric characteristic.
Table 3.
Indexes of fine aggregate geometric characteristic.
| Geometric Characteristic | Index | Methods |
|---|
| Form index | | IPP |
| IPP |
| Angularity index 1 | | MATLAB |
| IPP |
| IPP |
| IPP |
| IPP |
| Texture index 2 | | MATLAB |
| IPP |
| IPP |
| IPP |
| IPP |
Table 4.
Selected gradation for asphalt mortar sample fabrication.
Table 4.
Selected gradation for asphalt mortar sample fabrication.
| Size of Sieve/mm | 2.36 | 1.18 | 0.6 | 0.3 | 0.15 | 0.075 | <0.075 |
|---|
| Granular composition/% | - | 28.3 | 20.3 | 14.9 | 9.5 | 10.8 | 16.2 |
| Ratio of filler/asphalt | 1.45 |
Table 5.
Form indexes of different FAs.
Table 5.
Form indexes of different FAs.
| Index | 1 | 3 | 4 | 5 | 6 | 7 | 8 | 10 | 11 |
|---|
| E | 1.249 | 1.318 | 1.327 | 1.341 | 1.242 | 1.270 | 1.221 | 1.214 | 1.264 |
| R | 0.713 | 0.695 | 0.685 | 0.665 | 0.678 | 0.673 | 0.677 | 0.691 | 0.655 |
Table 6.
One-way analysis of variance (ANOVA) results of form indexes.
Table 6.
One-way analysis of variance (ANOVA) results of form indexes.
| | | |
|---|
| 8.18 | 1.51 |
| 5.59 |
Table 7.
Angularity indexes of different FAs.
Table 7.
Angularity indexes of different FAs.
| Index | 1 | 3 | 4 | 5 | 6 | 7 | 8 | 10 | 11 |
|---|
| 0.559 | 0.738 | 0.739 | 0.826 | 0.827 | 0.827 | 0.876 | 0.947 | 0.846 |
| 1.060 | 1.077 | 1.099 | 1.093 | 1.091 | 1.097 | 1.063 | 1.097 | 1.091 |
| 1.015 | 1.023 | 1.024 | 1.024 | 1.029 | 1.030 | 1.020 | 1.029 | 1.023 |
| 1.162 | 1.284 | 1.291 | 1.276 | 1.266 | 1.251 | 1.217 | 1.271 | 1.232 |
| 1.032 | 1.036 | 1.029 | 1.031 | 1.035 | 1.037 | 1.036 | 1.032 | 1.039 |
Table 8.
One-way ANOVA results of angularity indexes.
Table 8.
One-way ANOVA results of angularity indexes.
| | | | | | |
|---|
| 5.98 | 0.002 | 0.57 | 3.01 | 2.71 |
| 5.59 |
Table 9.
Texture indexes of different FAs.
Table 9.
Texture indexes of different FAs.
| Index | 1 | 3 | 4 | 5 | 6 | 7 | 8 | 10 | 11 |
|---|
| 0.123 | 0.163 | 0.257 | 0.244 | 0.305 | 0.245 | 0.196 | 0.298 | 0.230 |
| 1.052 | 1.097 | 1.106 | 1.098 | 1.106 | 1.113 | 1.087 | 1.107 | 1.085 |
| 1.012 | 1.026 | 1.028 | 1.023 | 1.028 | 1.029 | 1.026 | 1.027 | 1.022 |
| 1.150 | 1.288 | 1.318 | 1.318 | 1.269 | 1.304 | 1.253 | 1.285 | 1.253 |
| 1.016 | 1.019 | 1.022 | 1.021 | 1.023 | 1.025 | 1.017 | 1.024 | 1.021 |
Table 10.
One-way ANOVA results of texture indexes.
Table 10.
One-way ANOVA results of texture indexes.
| | | | | | |
|---|
| 0.21 | 0.18 | 0.25 | 1.02 | 0.44 |
| 5.59 |
Table 11.
Burgers model parameters of asphalt mortar.
Table 11.
Burgers model parameters of asphalt mortar.
| No. | | | | | |
|---|
| 2 | 5422 | 99,025 | 4771 | 88 | 0.018 |
| 3 | 6301 | 144,820 | 5174 | 89 | 0.017 |
| 8 | 6340 | 40,691 | 7846 | 152 | 0.019 |
| 9 | 7081 | 294,796 | 6060 | 92 | 0.015 |
| 10 | 6941 | 49,875 | 4956 | 104 | 0.021 |
| 12 | 6340 | 22,472 | 1167 | 23 | 0.020 |
© 2019 by the authors. Licensee MDPI, Basel, Switzerland. This article is an open access article distributed under the terms and conditions of the Creative Commons Attribution (CC BY) license (http://creativecommons.org/licenses/by/4.0/).


