2.1. Pseudo-Period Analysis of Satellite Telemetry Data
Satellite telemetry data provide the operational state information for each system on the satellite and are received by the ground TT&C station in the time sequence. The typical telemetry data
can be described as:
where
is the time point of the telemetry data acquisition,
is the ideal telemetry value, and
is the noise. The composition of the noise can be expressed as:
where
is the random noise widely distributed in the data,
is the noise in the numerical trend pattern,
is the outlier that only occurs at few time points, and the absolute value of
is significantly greater than 0 and significantly deviates from the data.
The satellite runs in its own orbital cycle, so the telemetry data transmitted by the satellite mostly follows the cyclic law of approximate periodic change, which is defined as the pseudo-period [
16]. Due to the non-stationarity of the pseudo-periodic change, the change law cannot be accurately determined and has no rigorous and unified mathematical definition. To date, there have been few pseudo-period-based studies of telemetry data. According to the characteristics of the telemetry data, the pseudo-period of the satellite telemetry data
is defined as:
where
is the ideal period of the telemetry data,
is the time deviation of the different pseudo-period whose value fluctuates in a certain range,
and
. If
, then
, namely, the period is an ideal period. For simplicity, a single ideal period is defined as a standard pseudo-periodic sequence
.
Figure 1 shows the measured data of the bus current of the solar panels of a satellite. These data exhibit a typical law of approximate periodic variation. According to the turning point of the data shape, 13 approximate periods can be determined, as shown in
Figure 1.
2.2. Symbolization Method of Satellite Telemetry Data
Since satellite telemetry data usually have a high sampling frequency, pseudo-periodic analysis of the raw telemetry data incurs a heavy computational cost. To improve the efficiency of pseudo-periodic extraction, the raw telemetry data should be compressed. Symbolic processing is a compression method based on the data shape features. This method has a high compression rate and fast compression speed and can reduce the noise and outliers’ interference in the data.
Symbolic aggregate approximation (SAX) [
21] is a data symbolization processing method based on piecewise aggregate approximation (PAA). The principle of SAX is as follows: the data are divided into segments of equal lengths, and then the mean value of each segment data is converted into the corresponding discrete characters. Regardless of the specific characteristics of the data, SAX exhibits strong robustness and a high compression rate. However, SAX uses equal length symbolization partition, and therefore, its shortcomings are similar to those of the fixed segmentation method. Furthermore, the use of mean approximation data can lead to the loss of the local shape information of the data, making SAX vulnerable to the interference of trend noise.
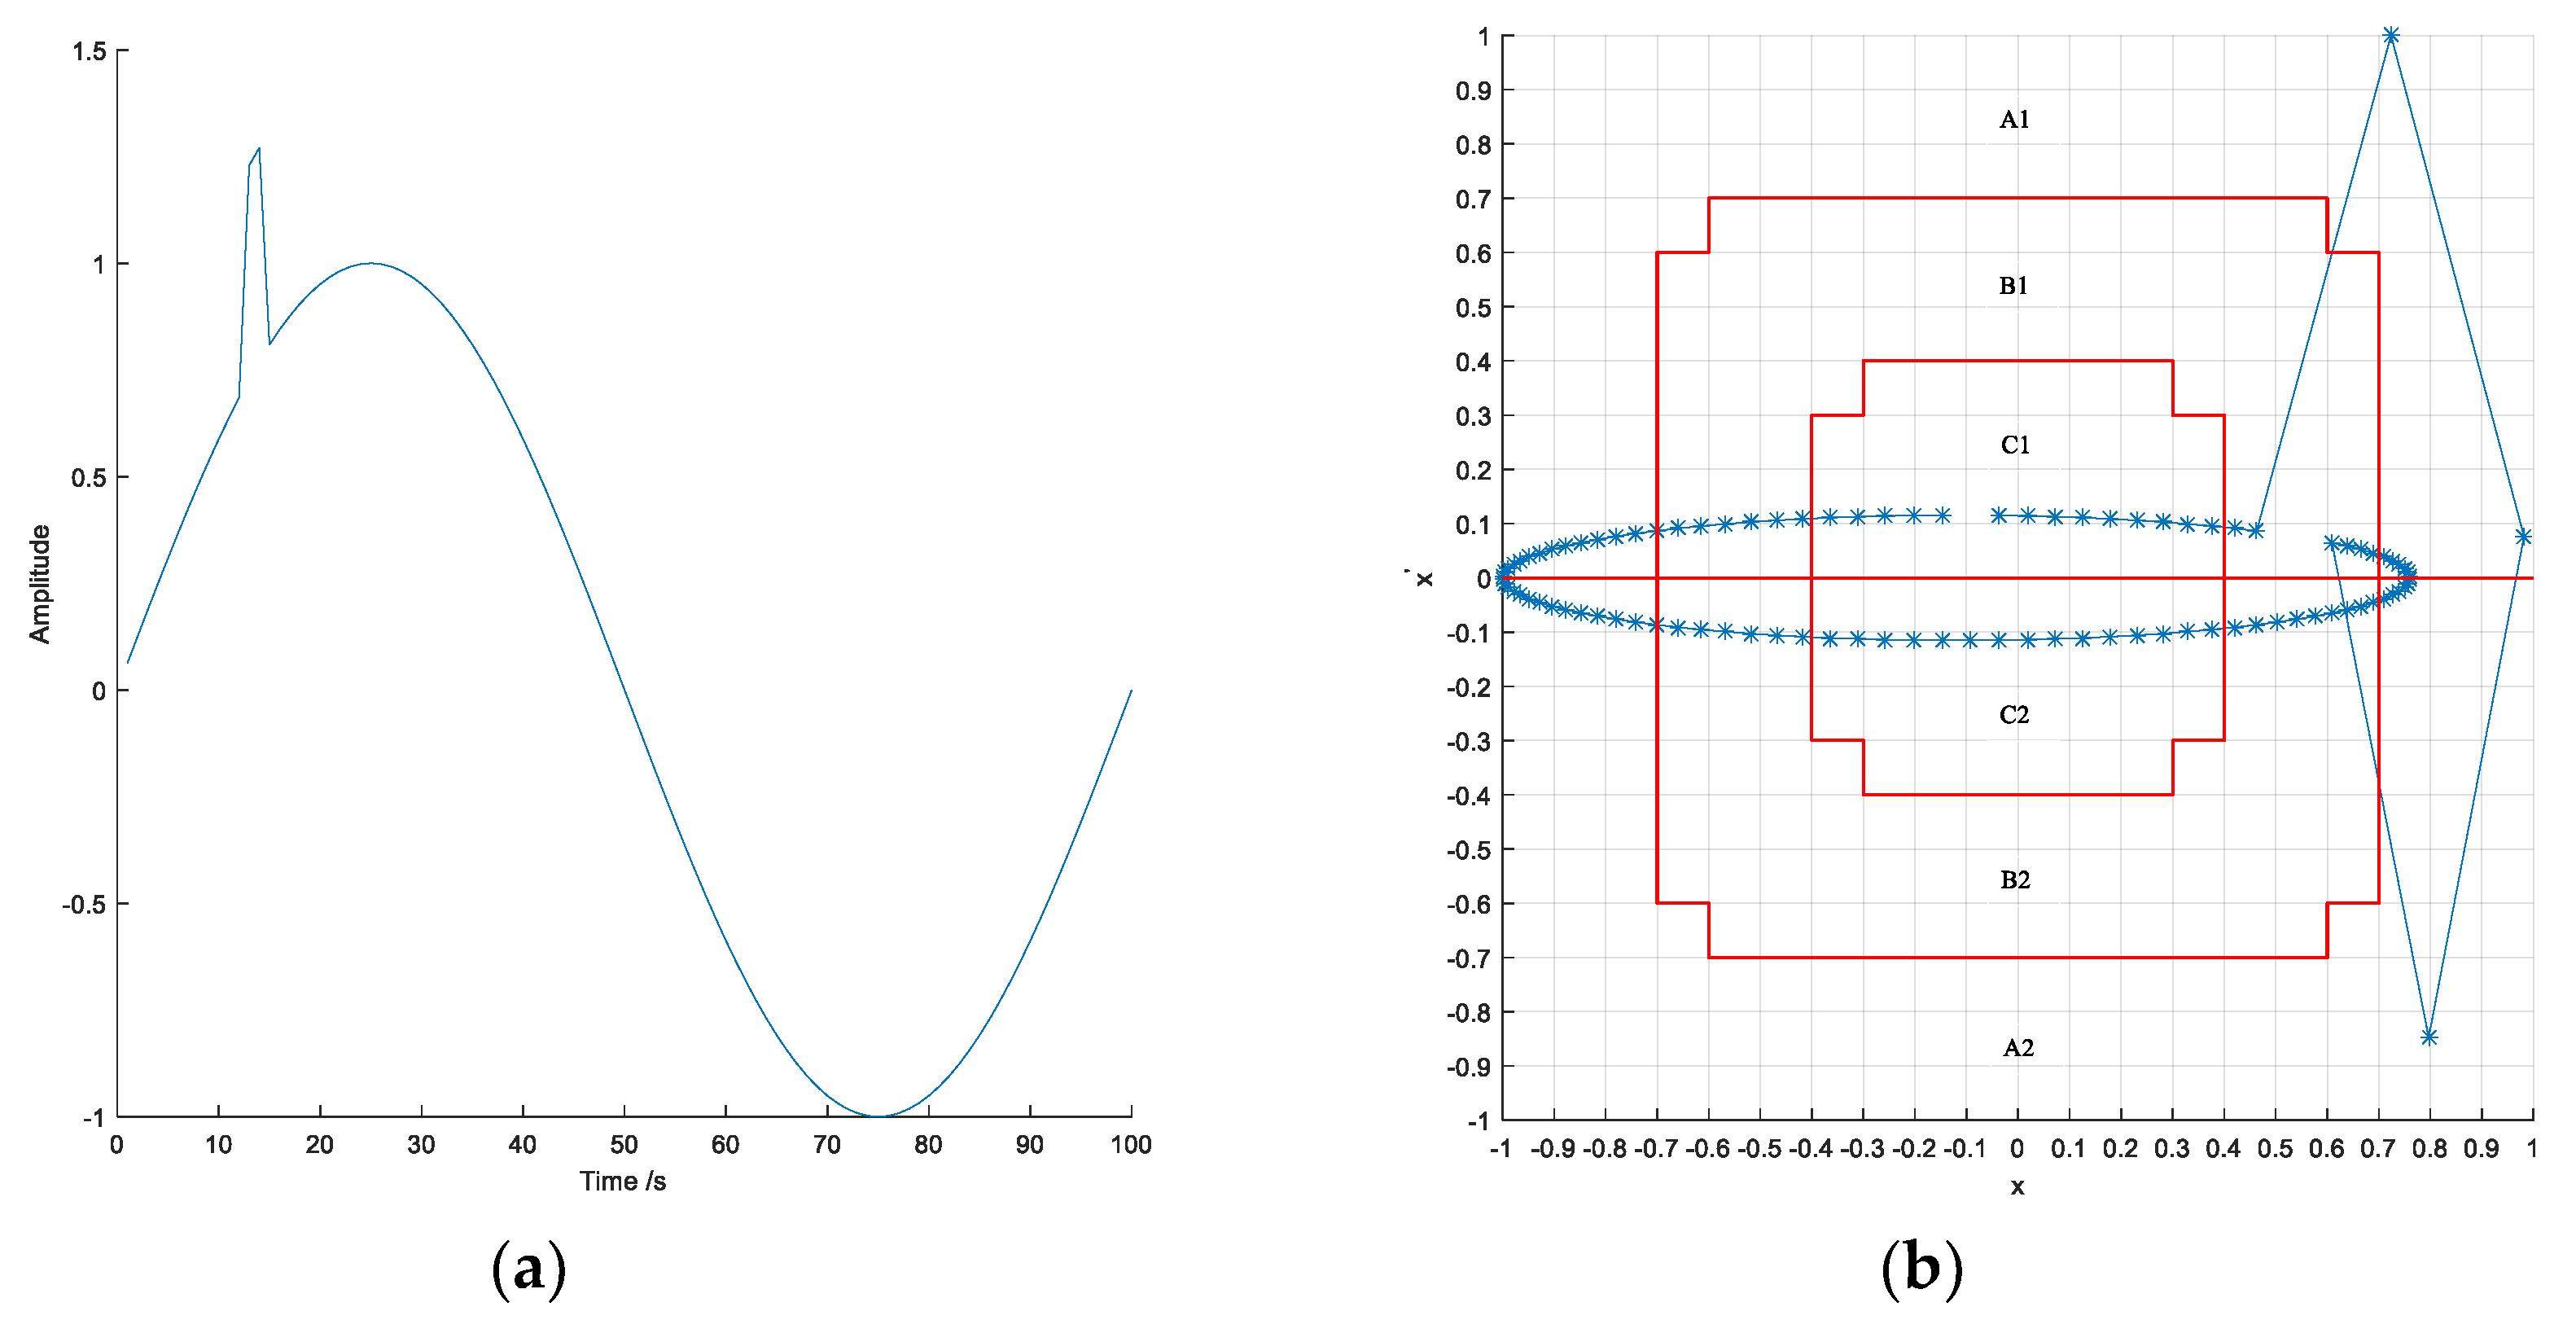
The data in
Figure 1 are symbolized by SAX. The symbol set is chosen as
{a, b, c, d}. By referring to the period of the data, the fixed segment length of data is set to be 50. The number of segments is inversely proportional to the compression; namely, the data compression ratio is 20:1, and the data symbolization sequence is
{dbdbdbcbcbbbcabcabca}. The data in
Figure 1 show a trend change after 500 s. The data symbolization sequence is divided into Sequence 1
{dbdbdbcbcb} and Sequence 2
{bbcabcabca} at 500 s. A comparison of the two sequences shows that the character sequence of Sequence 1 is more obvious, while there are only local, regular changes in Sequence 2. This result occurs because SAX retains the trend-type noise of the raw data, which interferes with the pseudo-periodic extraction of the data.
In light of the above limitations, this paper proposed a symbolization method based on the tilt angle in terms of the data temporal shape. The method had three main components: data filtering, shape salient points extraction, and data symbolization.
Since the raw telemetry data are quite noisy, which affects the accuracy of data shape extraction, first, the raw data should be filtered. First-order digital attenuated memory filter is a kind of a time-domain filter. Compared with the classical frequency filter, this approach could rapidly filter noise with different frequencies and has a better robustness with respect to different types of data. The first-order digital attenuated memory filter is described as follows:
where
is the raw data,
is the filtered data, and
,
is the memory length of the filter, and
. The value of
is inversely proportional to the memory time. If
is too large, the ideal filtering result cannot be obtained. If the value is too small, a phase delay of the filtering result will occur. The confirmation of
G value always depends on the experience. Therefore,
was set to be
in this paper. A first-order digital attenuated memory filter was used to filter the data in
Figure 1, and the filtering results are shown in
Figure 2.
The salient points of the data include the starting and ending points, turning points, and local extremum points. The essence of salient point extraction is to achieve data compression. Fu [
22] proposed the method of extraction of the important points based on the data shape. Yan [
23] improved the method of extracting the important points and proposed an extraction method based on the key points (KP) with an improved compression rate. However, the key points with a time interval that is too short may lead to a redundant number of salient points. Based on the KP method, this paper proposed a method to extract salient points of data shape (SP). By judging the interval between adjacent key points, which are extracted by the KP method, salient points can be filtered to obtain the final extracted salient points. The judgment function is given by:
where
is the final extracted salient point,
is the first extracted salient point,
is the time-length judgment threshold, and
is the time interval from
to
.
is a function that obtains the local extremum points between
and
.
The pseudo code of the salient points extraction algorithm for the data shape is given below:
| Input: Data sequence , Threshold of the turning point , time-length judgment threshold |
| Output: Salient point sequence |
| ;//Data filtering |
| ;//Put the starting point of the data sequence into the salient point sequence |
| for do |
| ;//Extract key points |
| |
| ;//Extract turning points |
| |
|
| ;//Put the endpoint of the data sequence into the salient point sequence |
| ;//The first extracted salient points |
|
| ;//Extract the time intervals of the salient points |
| ; |
| ;//Data extraction in the time intervals |
| |
| ;//Retain the local maximum points as the final salient points |
| |
| ;//Retain the local minimum points as the final salient points |
| |
| |
| |
|
The algorithm of the salient points extraction for the data shape has two parameters: threshold of a turning point and time-length judgment threshold. When processing different numerical characteristics of telemetry data, the SP algorithm parameters need to be adjusted. The threshold of the turning point setting method is described in [
23]. The time-length judgment threshold is set empirically, while its value in the real process of using can be determined by means of quantile method [
24]. After the time differences of each group of adjacent salient points in the data sequence
are calculated, the
corresponding to the first quartile would be the reference value.
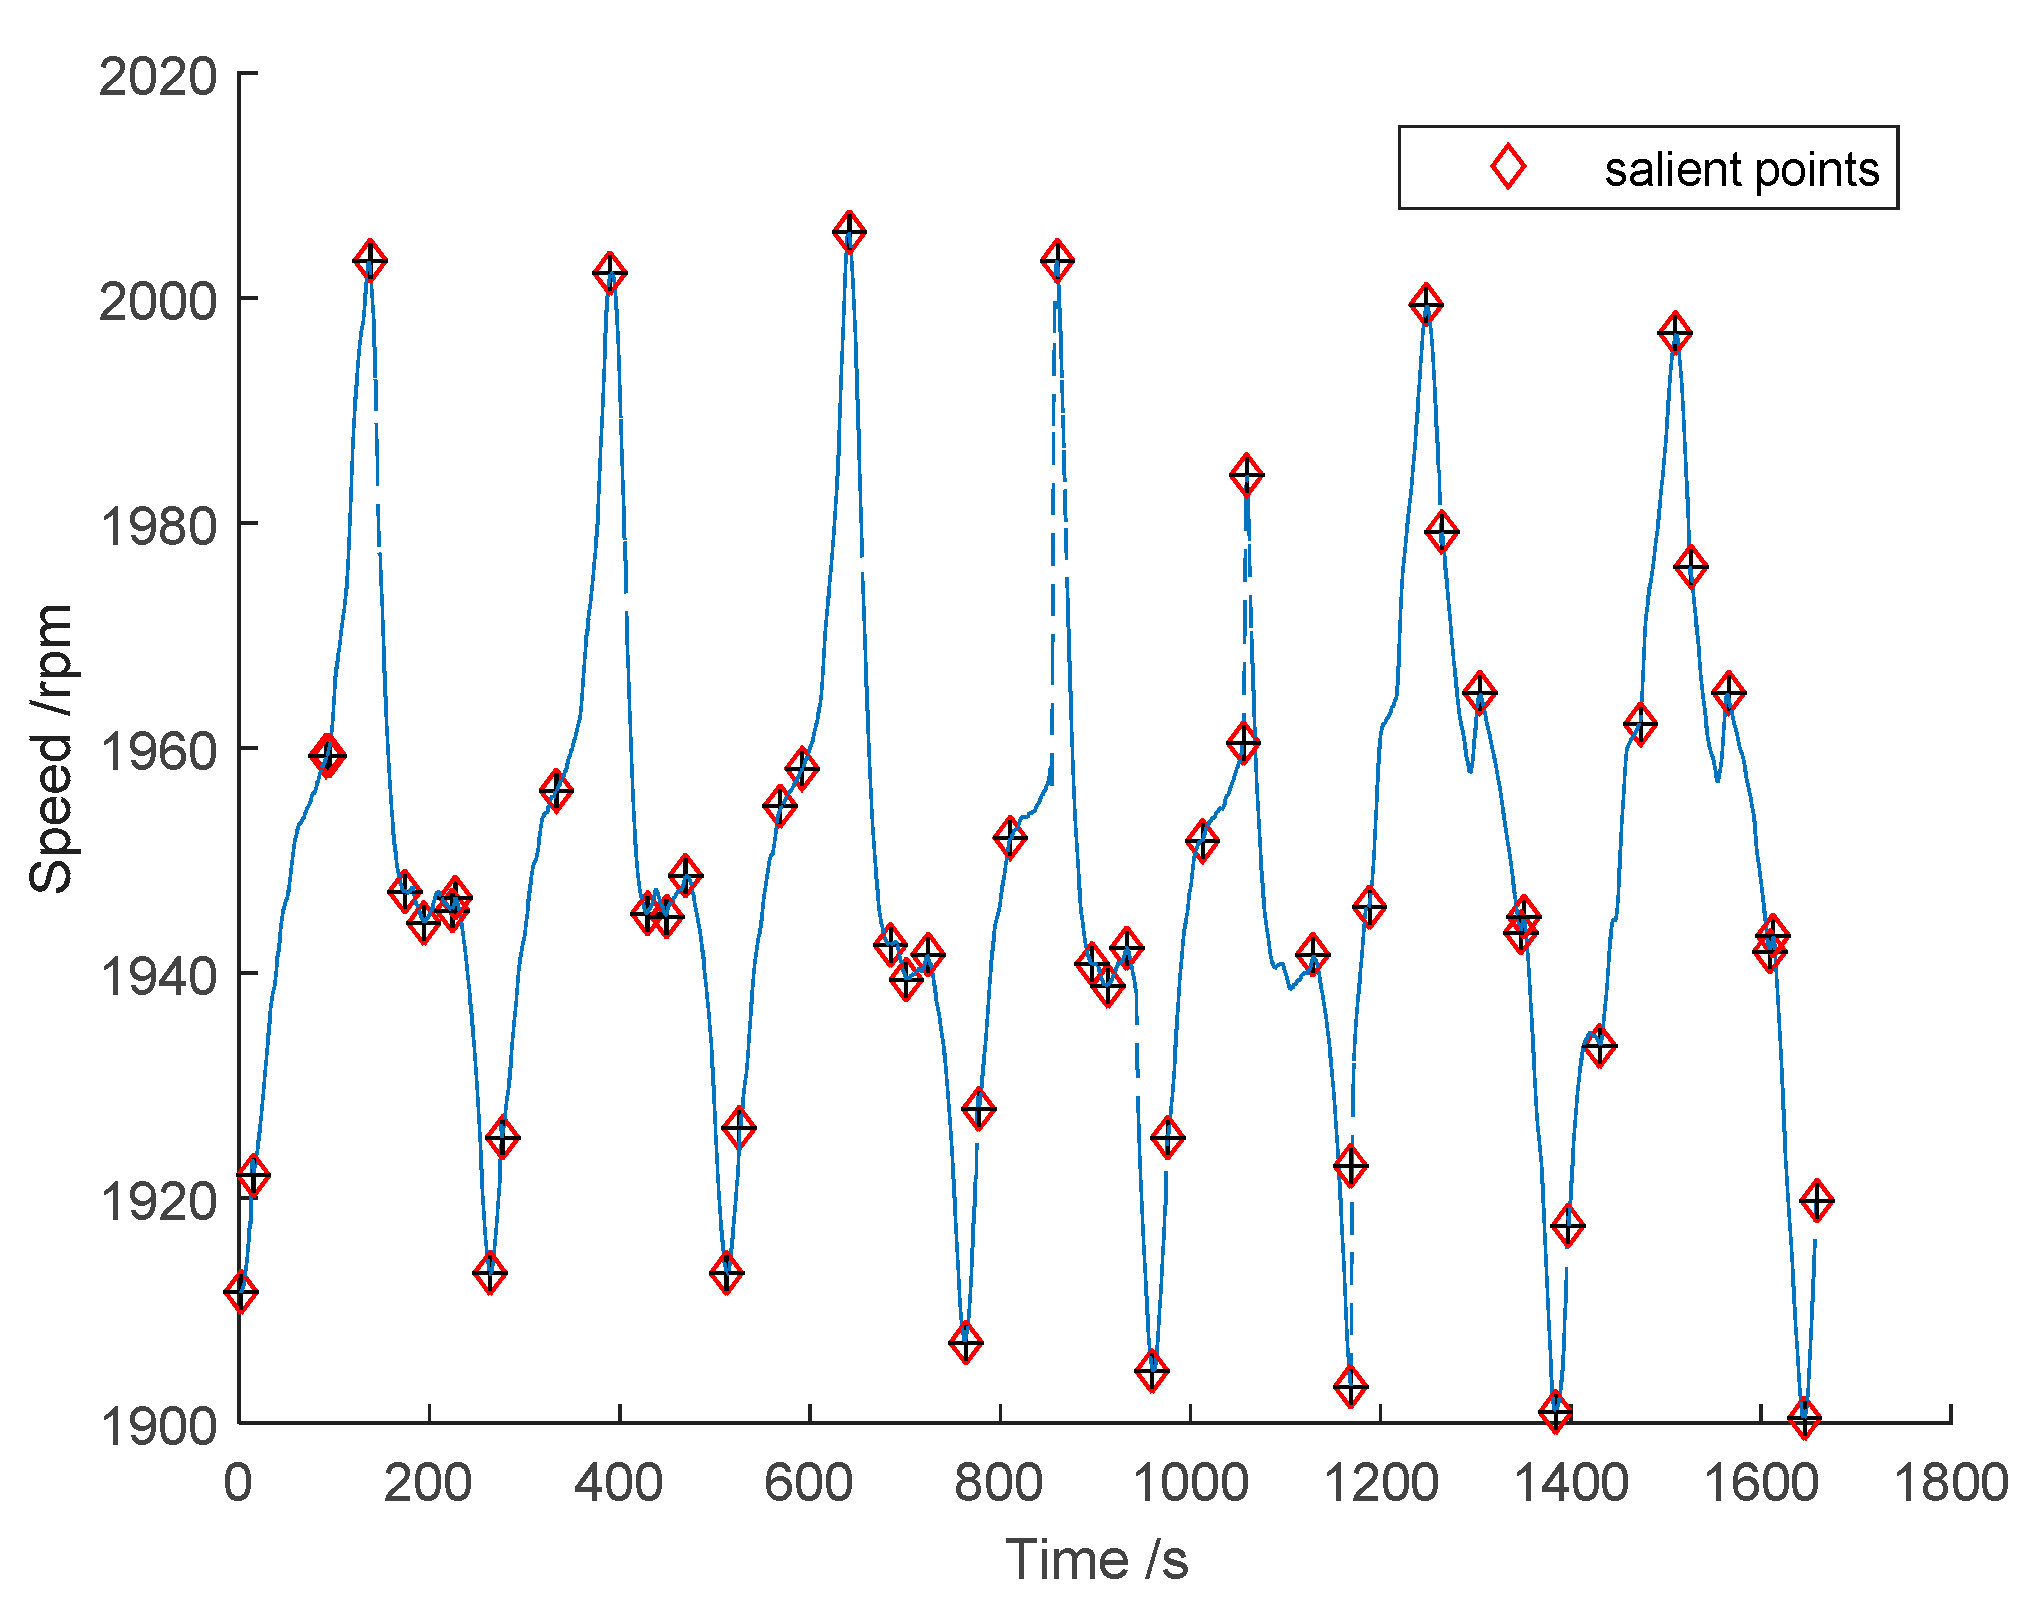
Feature points were extracted by SP and KP from the filtered data of
Figure 2, and the results are shown in
Figure 3.
As shown in
Figure 3, both methods could extract the data shape. The KP method could extract 335 data feature points with the compression rate of 2.98, and the SP method could extract 107 data feature points with the compression rate of 9.34. Therefore, the SP method had a higher compression rate. Line segments were used to connect the extracted salient points in time order, and then, the compressed shape of the data could be obtained.
The slope of the compressed data was used as the feature of the data shape, and the data were symbolized. For the simplicity of the symbolization, the slope values between the adjacent salient points were converted to the tilt angle values.
where
is the slope between the adjacent salient points. Based on the tilt angle, the number of intervals was determined, and a query table for the symbol conversion of the tilt angle in the range of
was established. There was no overlap of the intervals in the table, and the corresponding symbols of each interval were usually expressed by letters
{a, b, …, z}; for example, if there were two intervals, the symbols set was
{a, b}, and the rest could be expressed in the same manner.
In the symbolization of an angular data sequence, first, the cardinality of the symbol sets must be determined. If the symbol set is too large, the symbol sequence of the data will be too complex, whereas information will be lost if the symbol set is insufficient. The efficiency of data symbolization is directly related to the adoption of an appropriate symbol set in the process of data sequence symbolization. When the size of the symbol set is reasonably set, the ideal data compression effect can be achieved. To obtain a reasonable semiotic set, the sequence of the angle-value data is analyzed by the clustering method, and the number of symbol sets is determined by the number of clusters and each of the clusters corresponding to a symbol.
Currently, there are many different clustering methods, all of which have their suitable application background, and the methods differ from one another in computational efficiency and complexity. Based on the requirements for the rapid telemetry data anomaly detection and identification, clustering by the fast search and finding the density peaks (CFDP) method was adopted in this paper [
25]. This method could quickly find the density peak point of any shape data set and take it as the clustering center to achieve an efficient distribution of the logarithm data points and eliminate outliers. Thus, the CFDP method is suitable for the clustering analysis of large-scale data. The method only needs to set the truncation distance, and an empirical method for parameter setting is given in [
25].
The data symbolization was performed as follows: (1) the intervals of the tilt angles were searched, and (2) tilt angles into characters corresponding to the intervals were converted. Since the tilt angle could be divided into the basic form of upward, downward, and horizontal, the interval had a basic direction. Upon a directional change in the intervals, the sign should remain the same. Thus, data symbolization
could be introduced to correct the interval range. Typical symbols of the tilt angles are listed in
Table 1.
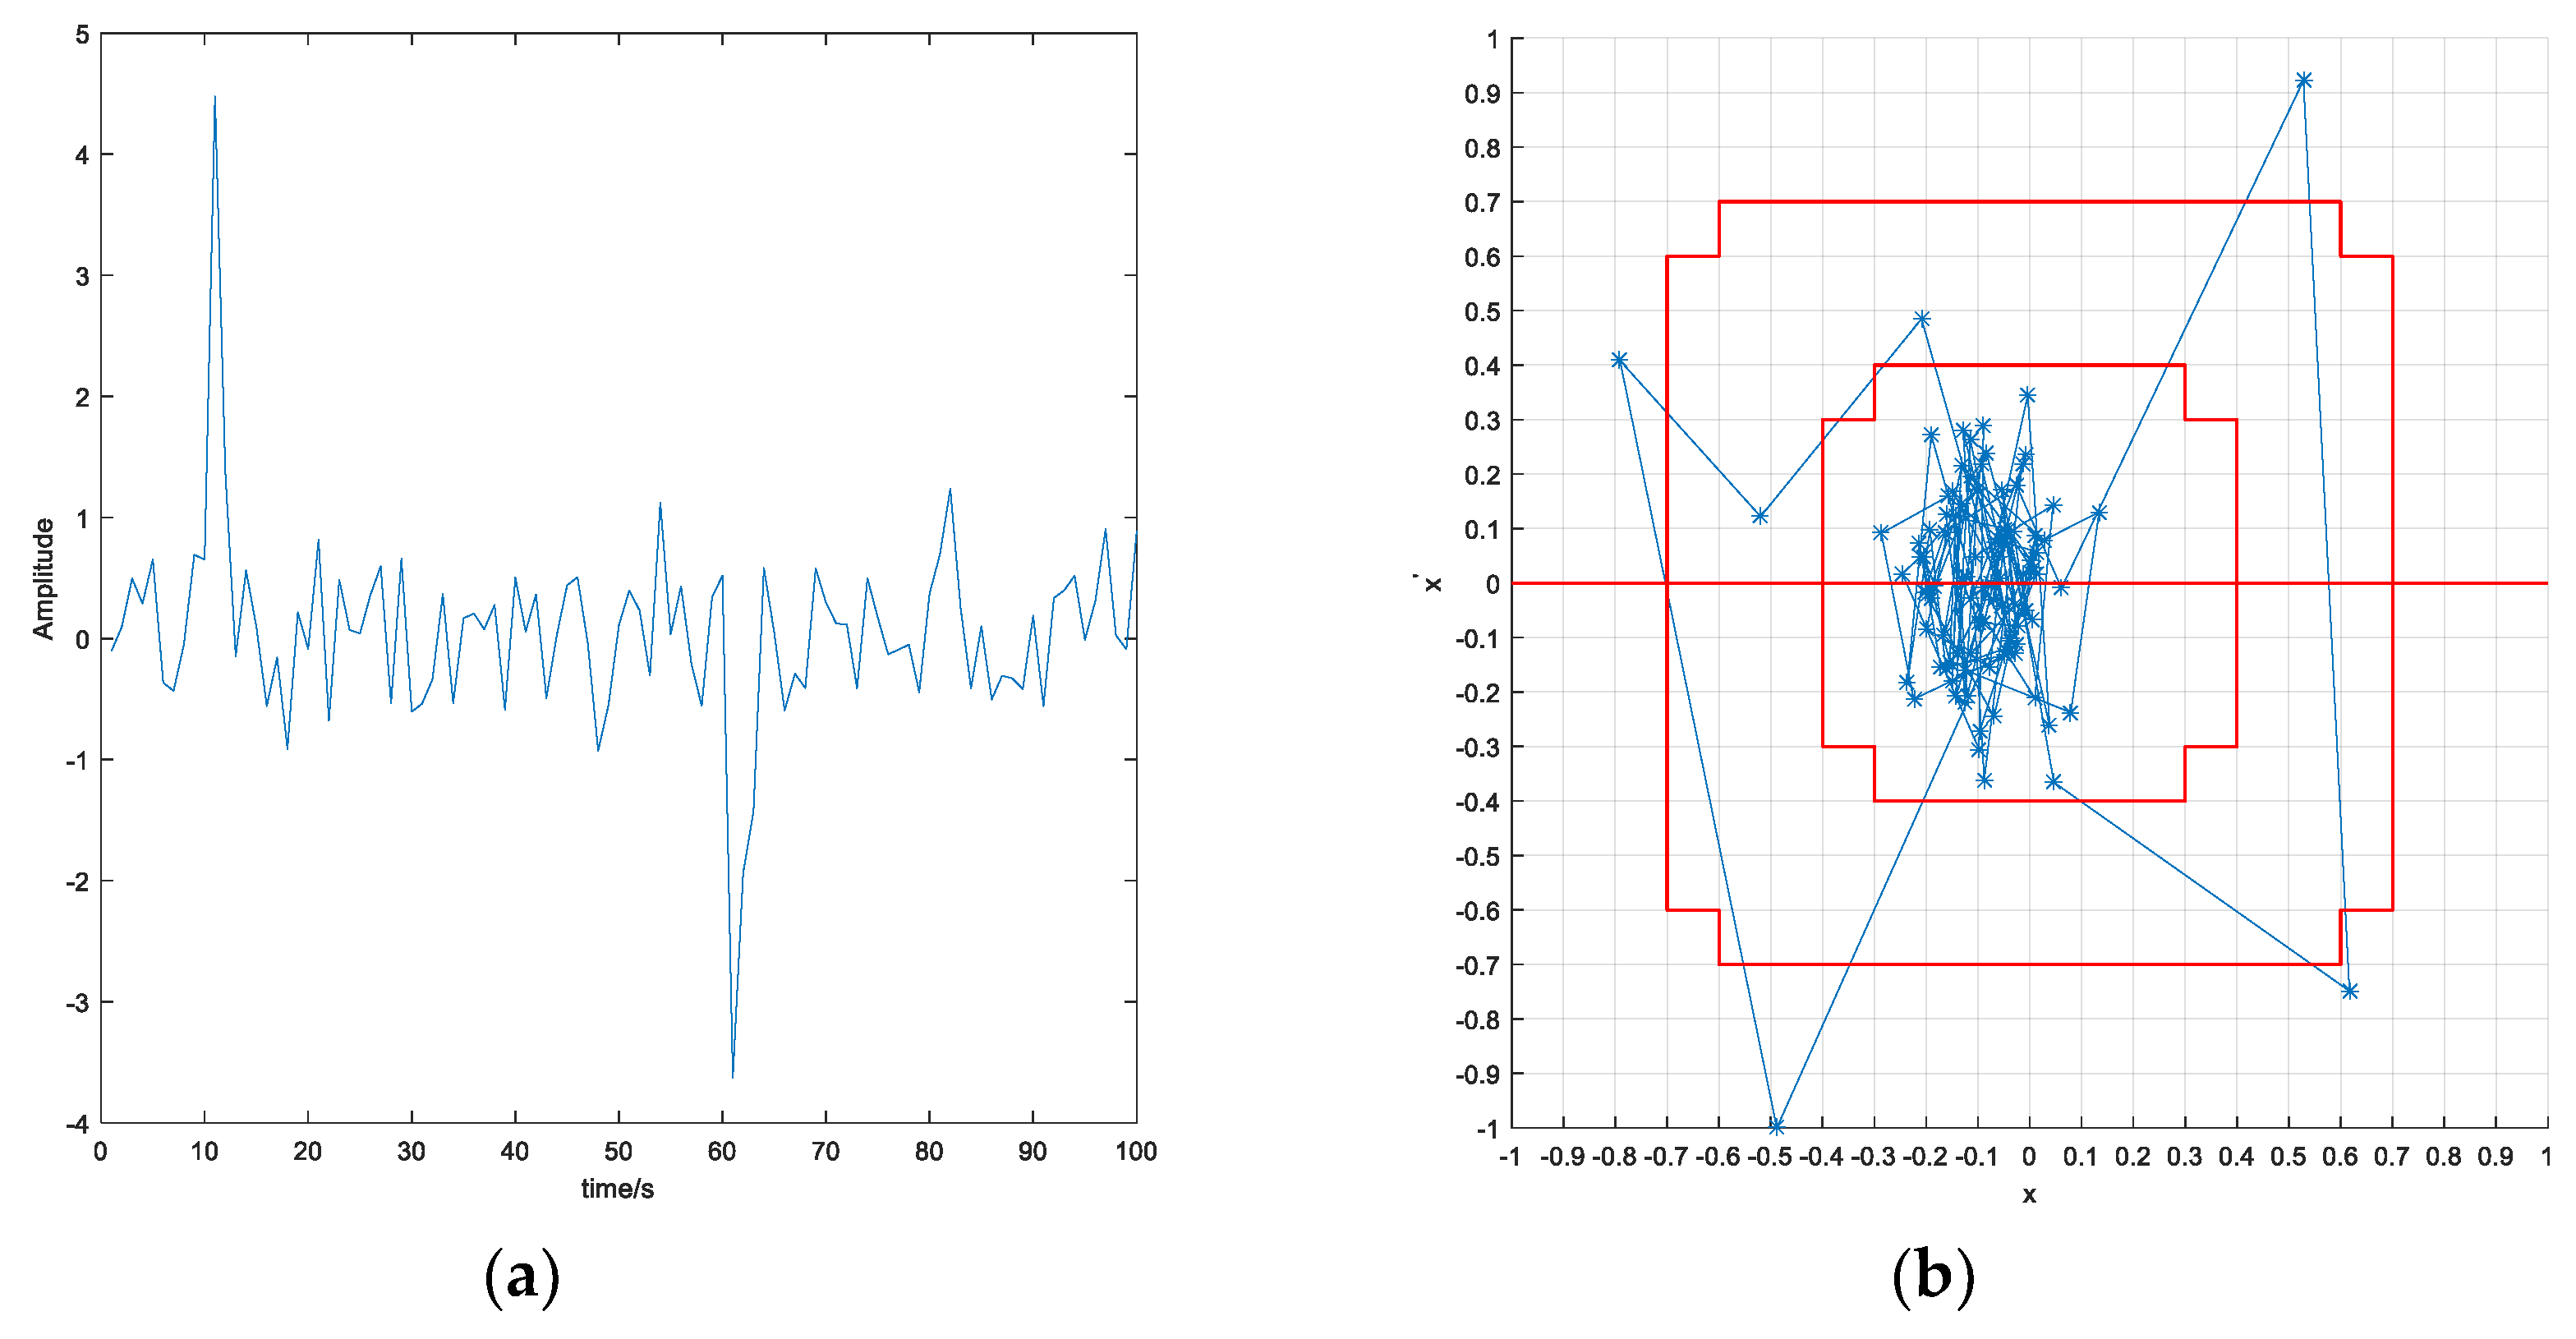
The data in
Figure 1 are symbolized using the SAX method and the method proposed in this paper. Five intervals were selected, and the corresponding character set was
{a, b, c, d, e}. For comparison, the salient points were extracted by the KP method. The symbolization results obtained by the two methods are shown in
Figure 4 and
Figure 5.
Comparing the two sets of symbolization results, it was observed that the data symbols obtained using the proposed method had a more significant regularity, and the effect of the trend noise had been effectively eliminated. Therefore, the data symbolization method in this paper was more suitable for extracting the pseudo-periodic law.
2.3. Pseudo-Period Extraction of Telemetry Data Based on Symbolization Method
Through the symbolization of the data tilt angle, the satellite telemetry data were converted into a character sequence . In the extraction of the pseudo-period of the measured data, the standard pseudo-period sequence was introduced and transformed into the character sequence . Then, was analyzed to determine the key characters. The keywords in the character sequence of the standard pseudo-periodic were defined as follows:
Definition 1. A character with the least number of occurrences in the standard pseudo-periodic character sequence. If there are minimal characters with equal numbers of occurrences, the earlier characters will be used as the keywordsin chronological order.
Taking as the index, was used to divide into subsequences , and then the string similarity between and of each subsequence was calculated. The rationality of the pseudo-periodic segmentation points was determined by setting a similarity threshold. Thus, the pseudo-period extraction of the measured data was realized; namely, the data pseudo-period extraction problem was converted into the string similarity calculation problem.
Due to the non-stationarity of
, it was difficult to align the characters of
and
in each subsequence on the timeline. Therefore, dynamic time warping (DTW) [
26] was introduced to measure the similarity. Allowing several-for-one and several-for-several mappings between symbolic sequences, DTW could solve the problem of the time axis distortion in the calculation of similar distances between symbol sequences of different lengths. Therefore, the DTW distance could be used for both raw data and the dimension-reduction data. The principle of the DTW procedure is given as follows:
Assuming that two symbol sequences were
and
, cumulative distances
were constructed as:
where
is the base distance between two points, and the Euclidean distance was used in this paper. When calculating the DTW distance of
and
, the distance matrix
C between the points of two sequences must be established.
After establishing the matrix, the distance between and was transformed into the bending path from (1,1) to (m,n) in matrix C. If the bending path was , the element was , and the path length satisfied . The path was constrained as follows:
- (1)
started in matrix C (1,1), and finally ended in matrix C (m,n);
- (2)
The path curve was continuous and monotonic.
The DTW distance calculation between
and
was essentially the task of finding a bending path with the smallest distance in the distance matrix
C.
In the extraction of the pseudo-periods of the satellite telemetry data, the DTW distance was used to calculate the distance between each subsequence
and the standard pseudo-period sequence
. By setting the DTW distance detection threshold, the rationality of the preliminary partition point of the pseudo-period was determined. If the distance was less than the set threshold, the right boundary of the data corresponding to the subsequence was used as the pseudo-periodic partition point. If the distance was greater than the set threshold, the correction was performed within
characters of the subsequence, and the DTW distance of
and each modified character sequence were calculated separately. If the distance was less than the correction threshold, the right boundary of the data corresponding to the minimum correction character was taken as the partition point. If the distance was still greater than the correction threshold, the segment was retained as the anomaly partition point, and the right boundary of the data corresponding to the minimum correction character was still taken as the partition point. The locations of the pseudo-periodic partition points were extracted as follows:
where
is the location of the pseudo-period partition point in normal data,
is the location of the pseudo-period partition point in the anomaly data,
is the DTW distance of the subsequence
and
, and
is the character offset correction range.
is set at the DTW detection threshold, and
is the amplification coefficient of the DTW detection threshold after the character offset correction; usually
.
Pseudo-periodic partition was performed for the characterizing result of the data in
Figure 1. Given the sequence of the standard pseudo-periodic
{eeeedcdd}, the pseudo-periodicity was divided into:
The corresponding pseudo-period extraction points were: [64 135 222 299 385 464 506 579 663 743 821 901 983].
According to the results of the pseudo-period extraction, DTW could effectively extract the pseudo-period of the data. Sequence segmentation using the keywords of the standard pseudo-periodic character sequence could avoid the high complexity of the DTW distance calculation.


