1. Introduction
Project success is among the most researched topics in project management literature. Although there is a vast amount of studies which provide an in-depth investigation of project success, there is no consensus on different aspects of it (
Davis 2016). There are different approaches in investigating project success including statistical analysis of success where success is studied objectively, i.e.,
Toor and Ogunlana (
2008) and
Tabish and Jha (
2011). Another approach is to investigate project success subjectively. Not all the stakeholder groups perceive the project’s success in the same way (
Davis 2014;
Turner and Zolin 2012).
Koops et al. (
2017) note that different project managers working in public projects have different perceptions of how project success can be measured (i.e., success criteria). In this regard, they distinguished three perspectives: the holistic and cooperative leader; the socially engaged, ambiguous manager; and the executor of top-down imposed assignment. This research takes another step toward understanding how different perspectives of various ways to achieve project success—in other words, project success factors—can be framed. Therefore, this study aims to answer the following research question:
2. Literature Review
The questions of how project success can be measured (success criteria) and how success can be achieved (success factors) are widely elaborated in the literature. However, these two notions are still used interchangeably (
Davis 2017). This section presents the results of a literature review into success criteria and success factors and closes a gap regarding the inclusion of contextual factors. To investigate this gap, a success factor framework is developed in the next section.
Cooke-Davies (
2002), in his study, identified 12 real success factors in projects at three different levels: project management success, success of an individual project, and consistent project success.
Westerveld (
2003) in his Project Excellence Model asserted that success factors (organizational areas) should be tailored to the goals of the project and external factors including project manager and his team, project characteristics, parent organization, and external environment. In addition, his model reveals the relationship between success factors and criteria.
Another remarkable article on success factors is the study of
Fortune and White (
2006), where 63 publications were reviewed resulting in 27 critical success factors (CSFs). They showed that little agreement on these factors existed among scientists. Among these 63 publications, the 6 most cited factors are: support from senior management, having clear and realistic project goals, efficient project plan, good communication and feedback, client involvement, and skilled and sufficient project team. This model does not explicitly incorporate success criteria, which makes it unclear what the relation is between these success factors and project success criteria.
Toor and Ogunlana (
2008) categorized the critical success factors for large construction projects based on the perception of project professionals into four main groups: comprehension, competence, commitment, and communication.
Cserháti and Szabó (
2014) defined success criteria and factors of organizational event projects. The study revealed that success factors can be classified into five groups, namely, project management processes, project resources, project team, organizational culture, and communication and co-operation. They also analyzed the relationship between these factors and success criteria.
All these studies attempt to classify the success factors either by extending the work of previous researchers or by developing a new framework which is specific to their own research (
Costantino et al. 2015). However, most of these studies focus on identifying success factors in one specific sector, and the role of the sector as a project contextual variable is overlooked. There is a knowledge gap in the project management literature regarding what success factors are most influential in a specific sectoral context.
Since there is a large (scientific) literature available on the factors contributing to project success, in this study we conducted an extensive literature review on this concept. Next, it is explained how the framework to be used for the Q-sorting was developed.
3. Framework Development
SCOPUS was used as a database in order to investigate the concept of project success in a broad sense. The selection of the Scopus database was based on the fact that Scopus is one of the most comprehensive literature databases, covering a wider journal range compared to other databases such as Web of Science (
Falagas et al. 2008;
Ma et al. 2019;
Pelz 2019). The authors explored the literature through screening the title, abstract, or keywords of the papers having the following terms: (“success factors” OR “critical success factors” OR “success determinants” OR “success criteria”) AND (“project” OR “project management”). For success criteria, earlier research results were applied; however, the search results for the query on success factors did (partially) include literature on success criteria.
The focus was particularly on relatively new literature in the field of project success published from 2000 onwards in order to find new developments in the area (the research was performed in August 2016). These “recent” articles often referred back to older articles, which were included in the study as well if considered relevant. In this search, only journal articles were included because of their generally accepted scientific value (due to a stringent peer-review procedure). The following 10 journals were selected to ensure a broad range of various fields of managerial issues in project organizing, including project management and construction management: Journal Of Management in Engineering, International Journal Of Managing Projects In Business (IJMPB), Engineering Construction And Architectural Management, International Journal of Project Organization And Management, Built Environment Project And Asset Management, Journal Of Construction Engineering And Management, Construction Management And Economics, Project Management Journal (PMJ), and European Management Journal.
Initially, the database returned more than 223 hits. Next, the table of contents, keywords, and abstract of each of the articles were carefully reviewed. The filtering was applied, and those articles having the most relevance to success factors in the context of project management were selected. For authors who wrote several related articles, the most influential article was chosen. This filtration resulted in 78 articles. The selected articles were not limited to a specific industry nor to the methodology used in the study in order to have a comprehensive view of the concept of project success factors. Finally, inductive content analysis of the selected articles was performed to identify and code the success factors.
In order to classify these factors, a qualitative content analysis was applied as a tool for qualitative data analysis and categorization. The literature review yielded 153 distinctive sub-success factors.
Since the literature review ignored the most recent developments, the framework was refined using expert judgment including academic and industry experts (three from each sector). Based on this expert judgement, a category “modern project management” consisting of three factors was added to this framework, incorporating opportunity management, integral approach, and adaptive project management. Moreover, the factor project manager early involvement and continuity (derived from the literature review) was removed, and two additional factors were incorporated: active involvement of users and active involvement of external stakeholders. Eventually, a final framework of 33 success factors clustered into 9 categories was developed, using the Project Excellent Model of
Westerveld (
2003) (
Table 1). The color and pattern used in the third column refer to the color and pattern per category of success factor in the figures presented in
Section 4 (results from the Q-study).
4. Q-Methodology
In this section, the research set up for conducting the Q-sorting is elaborated. The Q-methodology was applied to learn the respondents’ viewpoints regarding the factors leading to the success of their projects. The Q-methodology was first applied by
Burt and Stephenson (
1939) as a methodology for factorizing the correlations between persons (
Watts and Stenner 2012).
Ellis et al. (
2007) argue that the Q-methodology is based on both strict empirical evidence and subjectivity in respondents’ viewpoints, which implies that the Q-methodology combines positivist and post-positivist approaches. The Q-methodology is defined as “a technique used for defining and describing shared positions on issues through a combination of quantitative factor analysis and qualitative interpretation” (
Price et al. 2017). However, it is still considered a qualitative approach (
Forrester et al. 2015).
The Q-methodology has already been applied in research on various aspects of project management (
Cuppen et al. 2016;
Sohi et al. 2019;
Suprapto et al. 2015) and on implementing sustainability in different contexts, including urban planning (
Lu et al. 2018;
Silvius et al. 2017). The Q-methodology appears to have potential in the context of project success factors, since the purpose of this study was to identify different subjective perspectives of the importance of the various success factors.
4.1. Q-Set Design
Watts and Stenner (
2012) highlights the importance of Q-set items or statements in enabling the respondents to answer the research question. The result of the literature review on success factors was used in order to ensure that the Q-statements were sufficiently comprehensive. In this study, the assumed influence of the project sector on the perspective of the practitioners was particularly explored. In other words, it was presumed that the sectoral background, as a contextual factor, can influence the sorting of the success factors. Maybe a set of success factors is more important in one specific sector, which also affects the perspective of the respondents in that specific sector.
4.2. Respondents
The interviewees were chosen from 13 different Dutch companies specializing in three major sectors, namely, real estate, infrastructure, and urban design. Sixteen respondents were selected from real estate, 9 from urban planning, and 9 from infrastructure, resulting in 34 respondents. Given this diversity, the perspectives of the practitioners in each of these sectors could be compared. The participants were dominantly the project manager or project director (27 out of 34). The majority of them (27 out of 34) can be considered as (very) experienced practitioners with more than 10 years of experience. In the analysis, the respondents were labelled R_Nxx, where xx indicates the respondent’s identification code.
4.3. Q-Sorting
Face-to-face Q-sort sessions were conducted, where respondents were asked to refer to a reference project that was considered successful. Next, they were provided with a list of statements (33 success factors), presented in small cards and a score sheet. The respondents were asked to sort the cards (success factors) according to their relative importance in terms of contributing to the success of the reference project using the score sheet (see
Figure 1). The respondents had to comply with a pre-defined semi-normal distribution of the cards (
Ellingsen et al. 2010;
Van Exel and De Graaf 2005), prioritizing the success factors. The scale used in the score sheet ranged from −3 (least contributing to project success), via 0 (neutral), to +3 (most contributing to project success). Moreover, in order to help to interpret the factors, the respondents were asked to explain their reason for placing the success factors on the extreme ends (±3 and ±2). In addition to ranking the statements, the respondents were asked to rate their recent project in terms of predefined success criteria.
5. Results from the Q-Study
Before proceeding with analyzing the data and extracting different perspectives among the respondents, all the data on how the respondents placed the success factors were compared. Looking at the overall ranking of the success factors, the respondents positioned three of them as the most contributing to project success: competent project manager, collaboration between project parties, and competent/multidisciplinary project team.
5.1. Perspective Extraction
The PQ Method 2.35 (
Schmolck 2014), a free analysis tool, was used for conducting factor analysis. With this program package, one to eight factors (groupings or perspectives) can be derived. Researchers have to decide on the number of meaningful factors to include in the analysis, based on two parameters (
Brown 1980;
Suprapto et al. 2015). First, the cumulative explained variance of factors should be more than 50% of the study variance. Second, there are at least two significant Q-sorts loading on the factor. A Q-sort x loads significantly at the 0.05 level (
p-value) on a factor y if its factor loading is ±0.34 or more (calculated from 1.96/√N, where N = 33 is the number statements) and its highest square factor loading explains more than half of the common variance. Based on the result of the analysis, four to eight factors were rotated separately. Four and five factor solutions explained 54% and 60% of the study variance, respectively.
There is no single correct number of factors, and it is up to the researcher to select the best factor solution based on four criteria (
Webler et al. 2009): simplicity, clarity, stability, and distinctiveness. “Simplicity” implies that selecting the fewer number of factors makes it easier to understand the viewpoints on each specific factor. “Clarity” means that each respondent should load only on one factor. In reality, some respondents might either load on multiple factors (confounders) or not load on any factor (non-loaders). Confounders have hybrid views, and their views cannot be totally explained by only one factor. Hence, to meet the “clarity” criteria, the number of confounders and non-loaders should be minimized. In this dataset, there were no non-loaders. In the four-factor solution, eight confounders were found, and in the five-factor solution, there were nine confounders. Following the suggestion of
Webler et al. (
2009) for minimizing the number of confounders, the four-factor solution was preferred.
If a certain group of respondents is clustered together when investigating a different number of factors, this means that they do think similarly with regard to the statements. In a best factor solution, “stability” of these clusters should be maintained. Finally, the “distinctiveness” criterion calls for having low correlation between the factors.
The perspectives are labelled on the basis of the shared position of success factors as well as the explanations provided by the practitioners with that specific perspective.
Table A1 (in
Appendix A) presents the Z-scores and the corresponding positions (Q-score values) per perspective. The grey cells show the distinguishing success factors for each perspective which can be compared with the views of other respondents with other perspectives. These distinguishing success factors indicate differences with the significance thresholds of 0.05 and 0.01
p-value levels. For completeness, the factor loadings for the four-factor solution are given in
Table A2, showing which respondent loaded on which factor, including confounders. These four perspectives are discussed next.
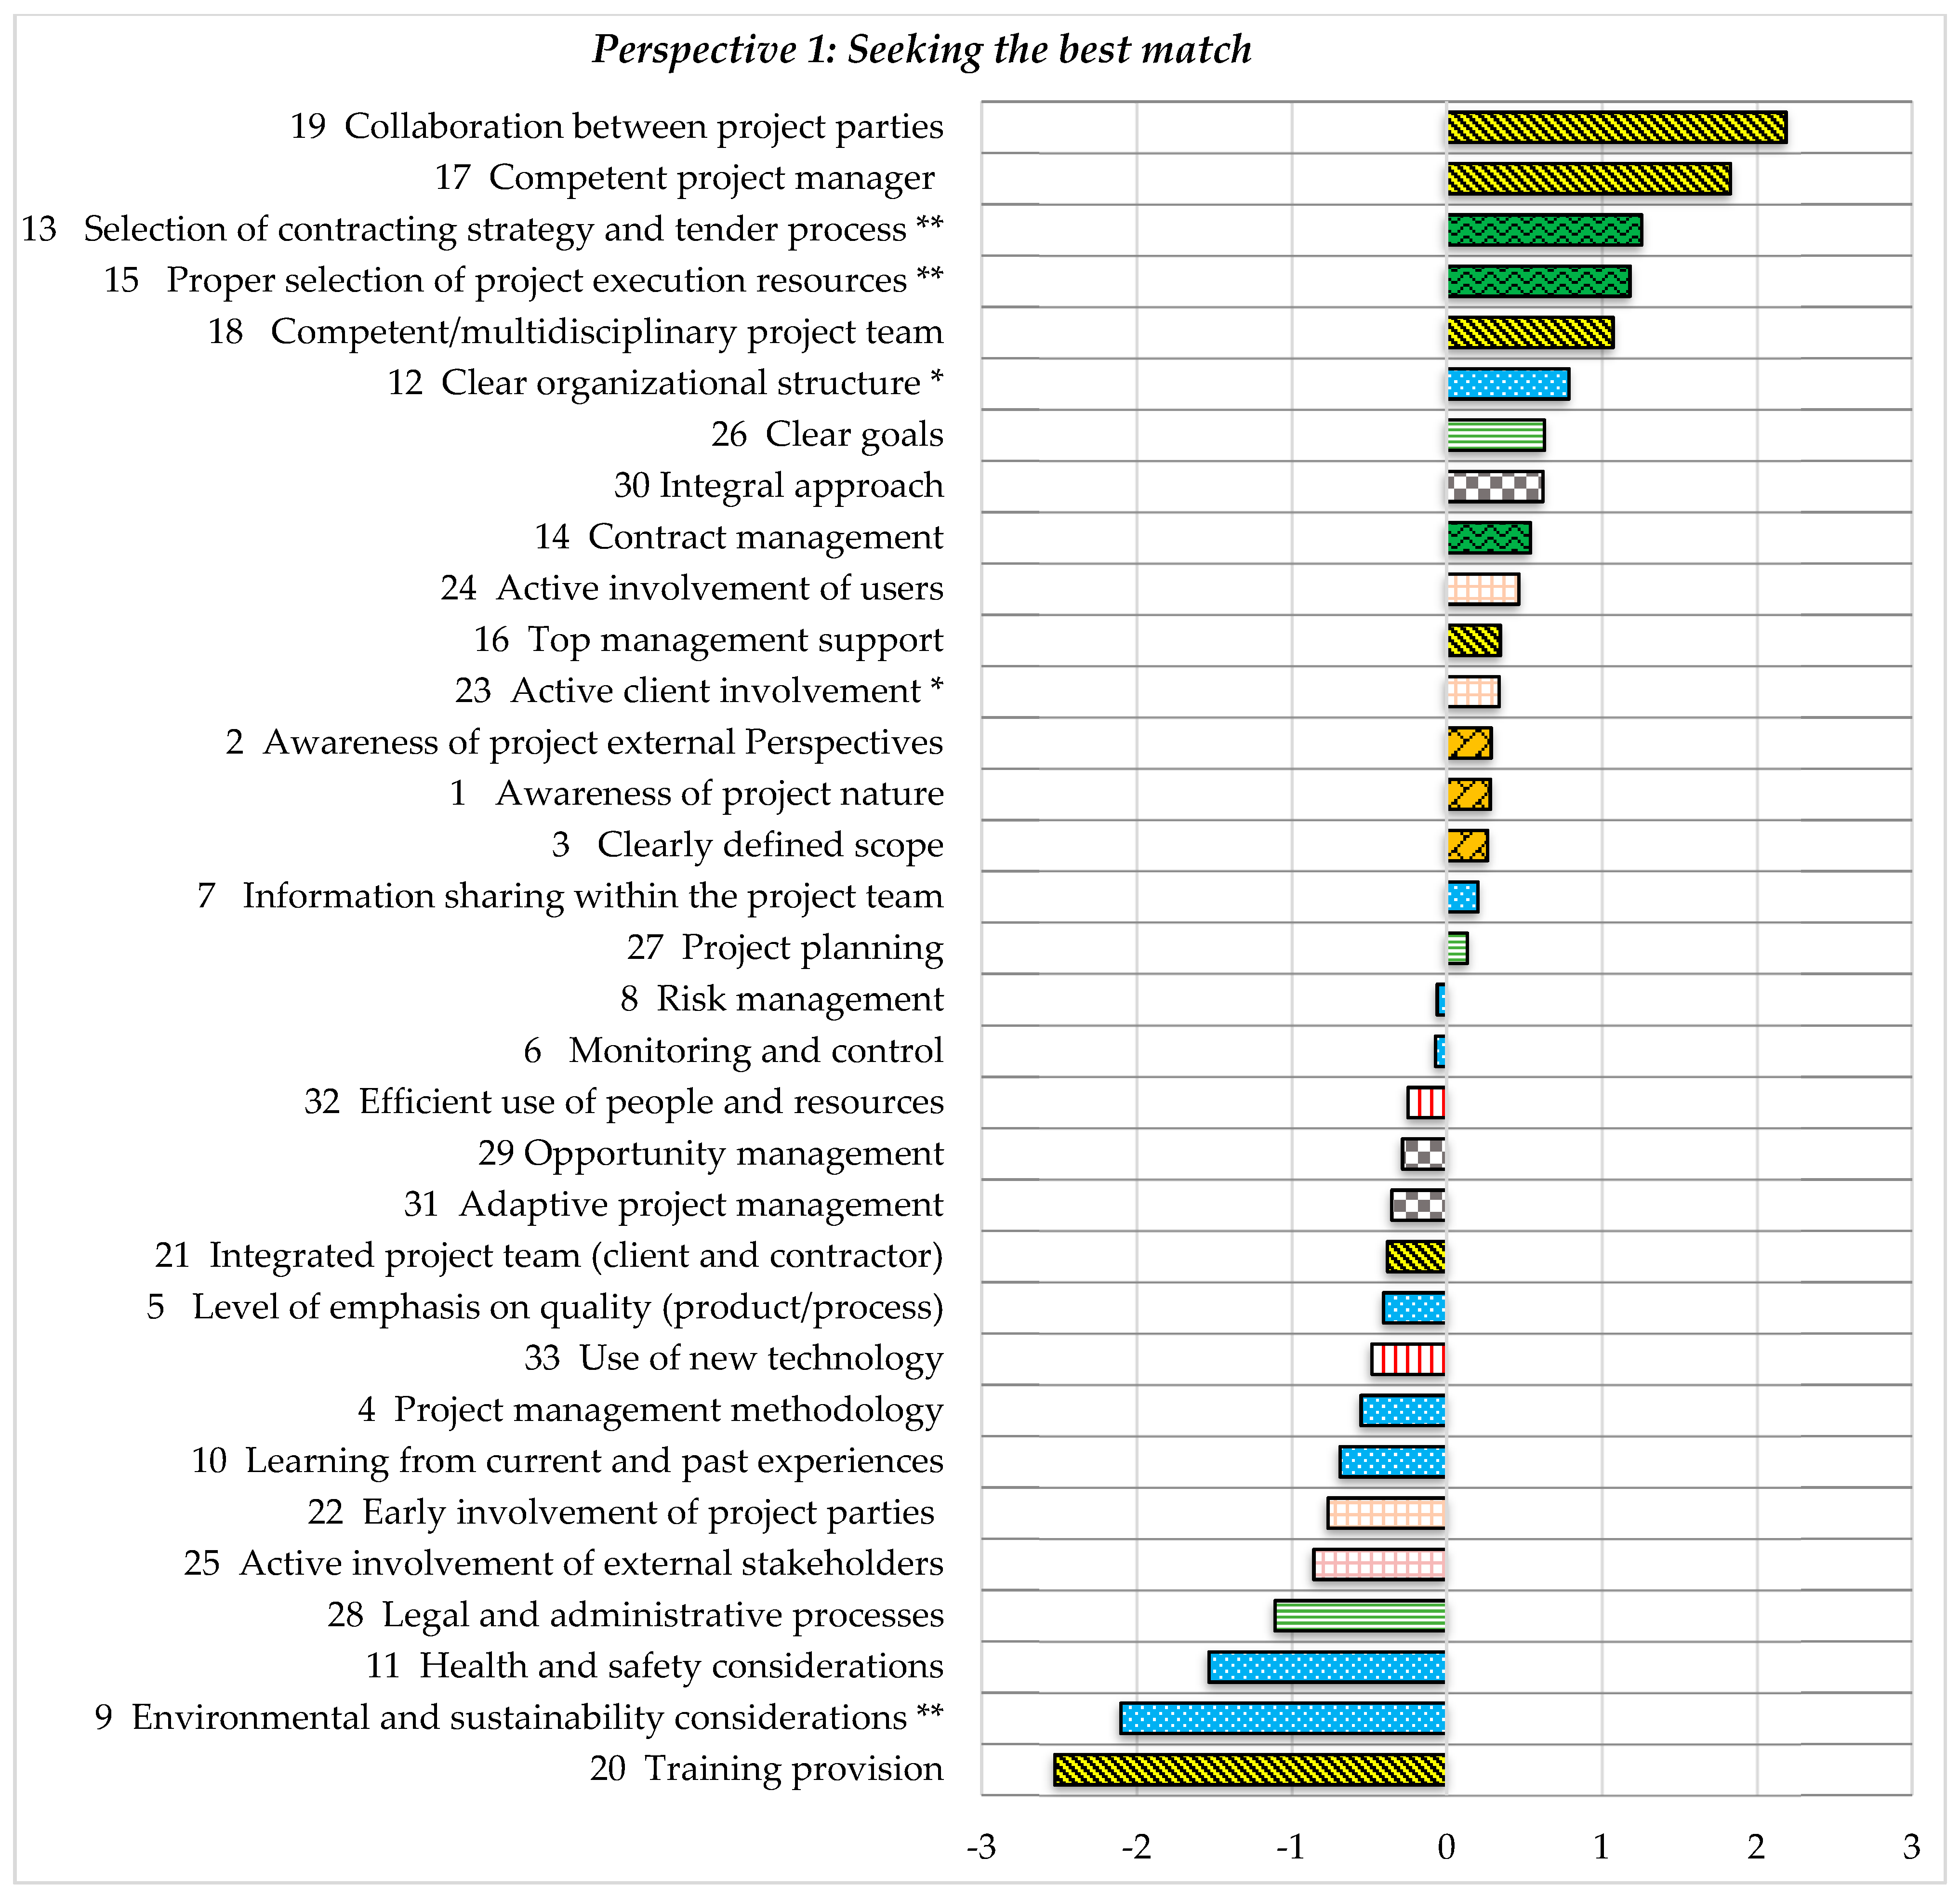
5.1.1. Perspective 1 (Seeking the Best Match)
Nine respondents loaded on perspective 1 (P1), which is called “seeking the best match”. Perspective 1 reflects the viewpoint that procurement is the most important factor leading to success of projects. The ranking of the success factors, including five distinguishing factors, for P1 is depicted in
Figure 2. The respondents emphasized the importance of
selecting the contracting strategy and tender process (13: Pos. +2) and
proper selection of project execution resources (15: Pos. +2). As expressed by R_N16: “The content is basically not provided by the project manager but by the execution parties (advisors). They should have the knowledge and they should have the intention to collaborate effectively with each other”.
Furthermore, the importance that practitioners with this perspective gave to clear organizational structure (12: Pos. +1) is higher than for other perspectives. The importance of this factor is reflected by R_N19: “without a clear structure, people do not know where they are responsible for and they can hide or do not feel responsible”. The factor environmental and sustainability considerations is ranked lower in this perspective compared to P2 and P4. As expressed by R_N02, “Although the project was delivered sustainable and energy-efficient, this does not play a role in project success”.
5.1.2. Perspective 2 (Being Adaptive and Open)
Perspective 2 gathered the biggest group of respondents (13). The focal theme of perspective 2 (see
Figure 3) is the importance its respondents give to
information sharing within the project team (7: Pos. +3) and
adaptive project management (31: Pos. +2) as the enablers of project success. The following argument from R_N31 shows the importance of information sharing: “Collaboration can only be possible when the parties have the required information”. The reflection that collaboration can be enhanced by information sharing can also be inferred from the importance the respondents with this perspective placed on
collaboration between project parties (19: Pos. +1). Another explanation from R_N14 showing that adaptability was a crucial success factor in a reference project is: “The complexity of the current processes and projects calls to be flexible and adaptable. As a result of changes at the organization level and the proper change of the goals in this project, flexibility is required”.
5.1.3. Perspective 3 (Keeping the Team Focused)
In perspective 3 (eight respondents), it is evident that team effort is important: a focused project team is suggested to lead to better project performance (see
Figure 4). In contrast to, particularly, perspective 1, this perspective scored low on the contract-related success factors
(15: Pos. −2; 13: Pos. −2). Active involvement of client (23: Pos. +3) and
integrated project team (21: Pos. +2) are the most important success factors. Regarding the importance of the active involvement of the client, as mentioned by R_N28: “The client stands at a large distance, therefore he has no feeling of the project complexity and urgency of the solutions”. R_N03 reflected on the factor
integrated project team as follows: “It was important that everybody was directly affiliated with the procedures and the outcomes in order to quickly act”. Another explanation was given by R_N22: “There were collaboration and joint agreements on how developments should take place and what should be done”. In addition to this emphasis on the team, they believe that rigorous
monitoring and control (6: Pos. +1) of the activities are needed in order to deliver a successful project.
5.1.4. Perspective 4 (Preparing for Opportunities)
Perspective 4 is the perspective with the smallest group of loaders, having only four respondents. This perspective is characterized by placing emphasis on opportunity management (29: Pos. +3). A practitioner shared his experience with regard to looking for potential opportunities: “Support from the stakeholders was very important in the project. They were very diverse and constantly looking for optimization in that framework” (R_N27). Interestingly, the respondents also focused on monitoring and control activities (6: Pos. +2), which is considered as more “traditional” project management.
This, however, seems contradictory with the first distinguishing statement of
opportunity management. Although the factor
monitoring and
control scores high, the importance of
planning as such scores very low
(27: Pos. −3).
Figure 5 presents the distinguishing statements for perspective 4, comparing them with the views of other respondents with other perspectives. The respondents in perspective 4, in contrast to the respondents in all other perspectives, gave a considerable importance to
environmental and sustainability considerations (9: Pos. +2): “The value of development, in terms of both monetary and intrinsic value, gave importance to the project and provided support and connection” (R_N17).
The delineation of the perspectives does not show that practitioners from the same sector might perceive the relative importance of success factors in the same way (see
Table A3 for the profile of the respondents). Next to the project description and sector, some background information from the respondents was collected. This included educational background, years of working experience, role in the project. To further explore the significant project characteristics that might be shared across the perspectives, the respondents were asked to evaluate the performance of their projects. The project performance was measured in terms of 11 criteria or indicators. These criteria were based on the study of
Yan et al. (
2018), which identified five dimensions of project success criteria based on a literature review: iron triangle, commercial success, stakeholders’ satisfaction, organizational benefits, and system view. Iron triangle criteria are the most commonly used measures, which assess the project in terms of meeting time, budget, and quality constraints (
Ellis et al. 2007;
Field 2009). Assessing the project success merely on the basis of the iron triangle is inadequate (
Turner and Zolin 2012); therefore, the commercial profitability of the project should also be taken into consideration (
Shenhar et al. 2001). The dimension of stakeholder satisfaction measures the extent to which stakeholders are satisfied with the project (
Davis 2016). The organizational benefits dimension addresses the impact which the project may have on the organization (
Shenhar et al. 2001). The system approach finds a balance across the dimensions by considering each dimension in relationship to other success dimensions (
Yan et al. 2018).
Hence, in our study, we adopted 11 success criteria grouped into three categories of stakeholder satisfaction, iron triangle, and beyond iron triangle (see
Table A4). The category of stakeholder satisfaction considers the satisfaction of various stakeholders including end user, client, team, contractor, and external stakeholders. The beyond iron triangle category measures the project success in terms of the criteria of safety, long-term impact, and flawless utilization.
The respondents were asked to rate these criteria based on a five-point scale (1 = Not successful to 5 = Very successful). The Kruskal–Wallis test was used to see which perspectives were significantly different from each other with regard to success criteria and working experience of the respondents with that specific perspective. The reason for choosing a non-parametric method was that these tests work on the principle of ranking the data (
Field 2009), not requiring normally distributed data. If the p-value is less than or equal to the significance level (alpha level, typically 0.05), it can be concluded that the distribution of the independent variables (here, project characteristics, background of the respondents, and performance indicators) are not the same across different samples (here, the four perspectives that we identified). The Kruskal–Wallis tests cannot indicate which set of perspectives are different from each other. As a result, Dunn–Bonferroni tests were performed, for the significant results, to compare pairs of perspectives with each other.
Table 2 shows the significant outcomes from the pairwise comparison based on the Kruskal–Wallis test.
The resulting
p-values that were statistically significant were adjusted according to the Bonferroni correction which considers the influence of multiple testing (
IBM 2016). Because of the availability of only a small sample size for each perspective, the pairwise comparison for the Kruskal–Wallis test could be considered statistically significant only for one set (P2 - P4). However, the Bonferroni correction was considered rather conservative for this analysis. As a result, the characteristics were examined qualitatively by looking more in depth at all the four pairwise comparisons.
The end user satisfaction criterion was considered the lowest for P2. None of the respondents with this perspective ranked the project as very successful in terms of end user satisfaction. For P4, however, three (out of four) respondents ranked this criterion as very successful. Regarding working experience, young professionals seemed more attracted by P2 (see
Table A3).
6. Perspectives Compared
In this section, the z-scores and the corresponding position of the distinguishing success factors amongst the perspectives are compared.
Figure 6 plots the relative importance of the success factors per perspective and compares what category of success factors is overrepresented or underrepresented in which perspective. At first glance, “contracting” is stressed by P1. When looking at P2, it ranks one factor from “modern project management”, i.e.,
adaptive project management (31) and one factor from “project management process”, i.e.,
information sharing within the project team (7), much higher than other perspectives. It appears that, from the viewpoint of P3, “contracting” is relatively less important compared to other perspectives. This perspective also puts emphasis on factors within “leadership and team”, “stakeholder engagement”, and “policy and strategy”. Finally, the last remark is that P4 focuses on the two categories of “project management process” and one factor from “modern project management”. The categories of “leadership and team” and “policy and strategy” scored relatively low for P4 compared to other perspectives. Across all four perspectives, the category of “resources” scored almost equally. Therefore, this category was further removed from the comparison of the perspectives on the position of their distinguishing success factors explained in this section.
Looking more precisely at the overall data and success factors, some observations were made. The success factor environmental and sustainability considerations (9) is the only success factor which is distinguishing for all the identified perspectives, but its relative importance is different across perspectives. P4 ranked this factor much higher than other perspectives, which is evident in the explanation of R_N17: “Due to these considerations on the value development, project becomes important, and this provides support and connection”. On the contrary, P1 and P3 ranked this factor as one of the least success enablers, and R_N10 expressed that “Sustainability was neglected due to the tight budget”.
Risk management (8) scored equal, around 0, except for P2 which ranked this factor higher than other perspectives (+1). For P3, the project success can be achieved by having an integrated project team (21). Regarding the importance of this success factor, P2 had relatively the same view. R_N18 asserted that “Due to an integrated project team, the tension between the organizations was automatically eliminated by the chosen approach”. P1 perceived the integrated project team as the lowest contributing success factor compared to other perspectives.
The success factor proper selection of project execution resources (13) scored the highest for P1, and this factor got the lowest rank from P3. This difference in views can be explained by the statement from R_N19: “The execution team should do the work. Even if steering is good, without proper party, success cannot be obtained”. However, according to P3, collaboration within the real integrated team is more important because “the shared interest were exploited” (R_N13).
The influence of contract management (14) in achieving project success was perceived as the least important factor by P2. This is reflected in the statement of R_N33: “There was a high trust in the execution parties”. This indicates the focus on relational governance rather than on formal contracts. P1 and P3 placed this factor higher than other perspectives. Since the focus of the latter perspective is on team-related activities, one might expect that formal contract management as such might also rank low for P3. In the view of P3, relational governance cannot be substituted by formal contractual governance, although an integrated project team is important.
Active client involvement (23) is another factor on which P2 and P4 agreed that it does not contribute to project success. On the other hand, P3 disagrees with P2 and P4 and underlined the role of the client.
As can be seen from the
Table A1, the perspectives scored three factors more or less equally in this study (from −1 to +1):
top management support, having
clear goals, and
efficient use of people and resources. These statements do not contribute to the different viewpoints of the perspectives regarding success factors.
7. Discussion
This article provides an approach to understanding how practitioners value different success factors.
Price et al. (
2017) express that the application of the Q-methodology is twofold. First, different positions of the statements can be explored. Second, insights can be gained about how particular statements are perceived in relation to other statements. Even the top-ranked success factor
collaboration between project parties is ranked differently by different perspectives.
The research findings provide important practical managerial insights into the field of project management. The proposed approach can be applied by the practitioners in a project team to understand what factors are regarded as important for a successful project outcome. These factors show what aspects practitioners tend to focus on. The practitioners can even use the Q-methodology as a toolbox (
Cuppen et al. 2016) in different stages of the project to identify different perspectives within their own project team. Recognizing these perspectives might help the practitioners to understand the differences and similarities on key contributors to project success within the team. This will help them to better align to the value drivers of the project. In addition, as it was explained in
Section 5, three top-ranked success factors across the perspectives were:
competent project manager,
collaboration between project parties, and
competent/multidisciplinary project team. This results into an important managerial implication: the existence of these factors is crucial for achieving project success, irrespective of the perspectives taken. Therefore, practitioners should focus on these soft factors in their projects.
The main aim of this research was not only to explore different viewpoints on the relative importance of success factors, but also to explore sectoral differences which could not be proven on the basis of the current dataset. The research was exploratory by nature and has some limitations which suggest some directions for further research. The empirical data gathered, both success factors and success criteria, relied on the perception of the respondents (subjective data). Further research could be a survey study, collecting objective data regarding the success factors and success criteria of a project.
In this research, the respondents were asked about the overall project (life cycle) and not specifically about what success factors are most contributing in a specific project phase. The stage of the project might affect the perspectives of success factors. Hence, it will be interesting to see how the perspectives might develop over time.
This study only focused on three sectors, i.e., real estate, urban development, and infrastructure. It would be beneficial to replicate the results of this study by extending the suggested approach to projects in other sectors. It is also suggested to examine the practitioners’ views on success factors in different project contexts by considering other contextual factors rather than sector, such as project governance.
8. Conclusions
An intensive literature review of academic papers, published from 2000 onwards, was performed to obtain a holistic view of project success factors. This formed the basis for conducting the Q-sorting. The Q-methodology was applied to reveal the diversity of the practitioners’ perspectives of the most contributing success factors in three different sectors, namely, urban development, real estate, and infrastructure. From the analysis of 34 Q-sorts, 4 distinctive perspectives of the relative importance of the 33 success factors were revealed: “seeking the best match”, “being adaptive and open”, “keeping the team focused”, and “preparing for opportunities”. For the first perspective, the factors relating to procurement were emphasized. The practitioners with the second perspective valued the information sharing and being adaptive. Perspective three noted that having a focused project team is more important than other factors. In the view of perspective four, identifying opportunities contributes most to project success. Overall, the findings suggest that the perspectives of success factors place more emphasis on soft factors, especially on the competences of the people who actually perform the project and on the interactions between them. Still, the traditional view of managing projects by closely monitoring them exists. However, in order to improve project performance, the practitioners dominantly tend to pay more attention to the soft aspects.
The Q-methodology not only takes into account different views of exploratory variables but also statistically provides a position of the statements (
Price et al. 2017). From this study, there is no evidence that the practitioners in one specific sector might share a common perspective of how to achieve good project performance. However, this might be due to the fact that there are other contextual factors, rather than sector, which might influence the importance of the factors.
Further research should investigate how exactly these success factors are applied in real-life projects. As a result, more factual data from projects should be captured. This further empirical research would enable us to operationalize the success factors in terms of the applied activities and the principles of project management. This would allow us to identify patterns of actions contributing to success that are common across projects as well as to discover the context-specific success factors. Additional empirical data would also enable us to explore what contextual factors can influence the applicability of success factors in different projects.


