Study of the Importance of National Identity in the Development of Corporate Social Responsibility Practices: A Multivariate Vision


Abstract
1. Introduction
2. Theoretical Background
3. Materials and Methods
3.1. Population and Sample
3.2. Variables
3.3. Statistical Multivariate Methods
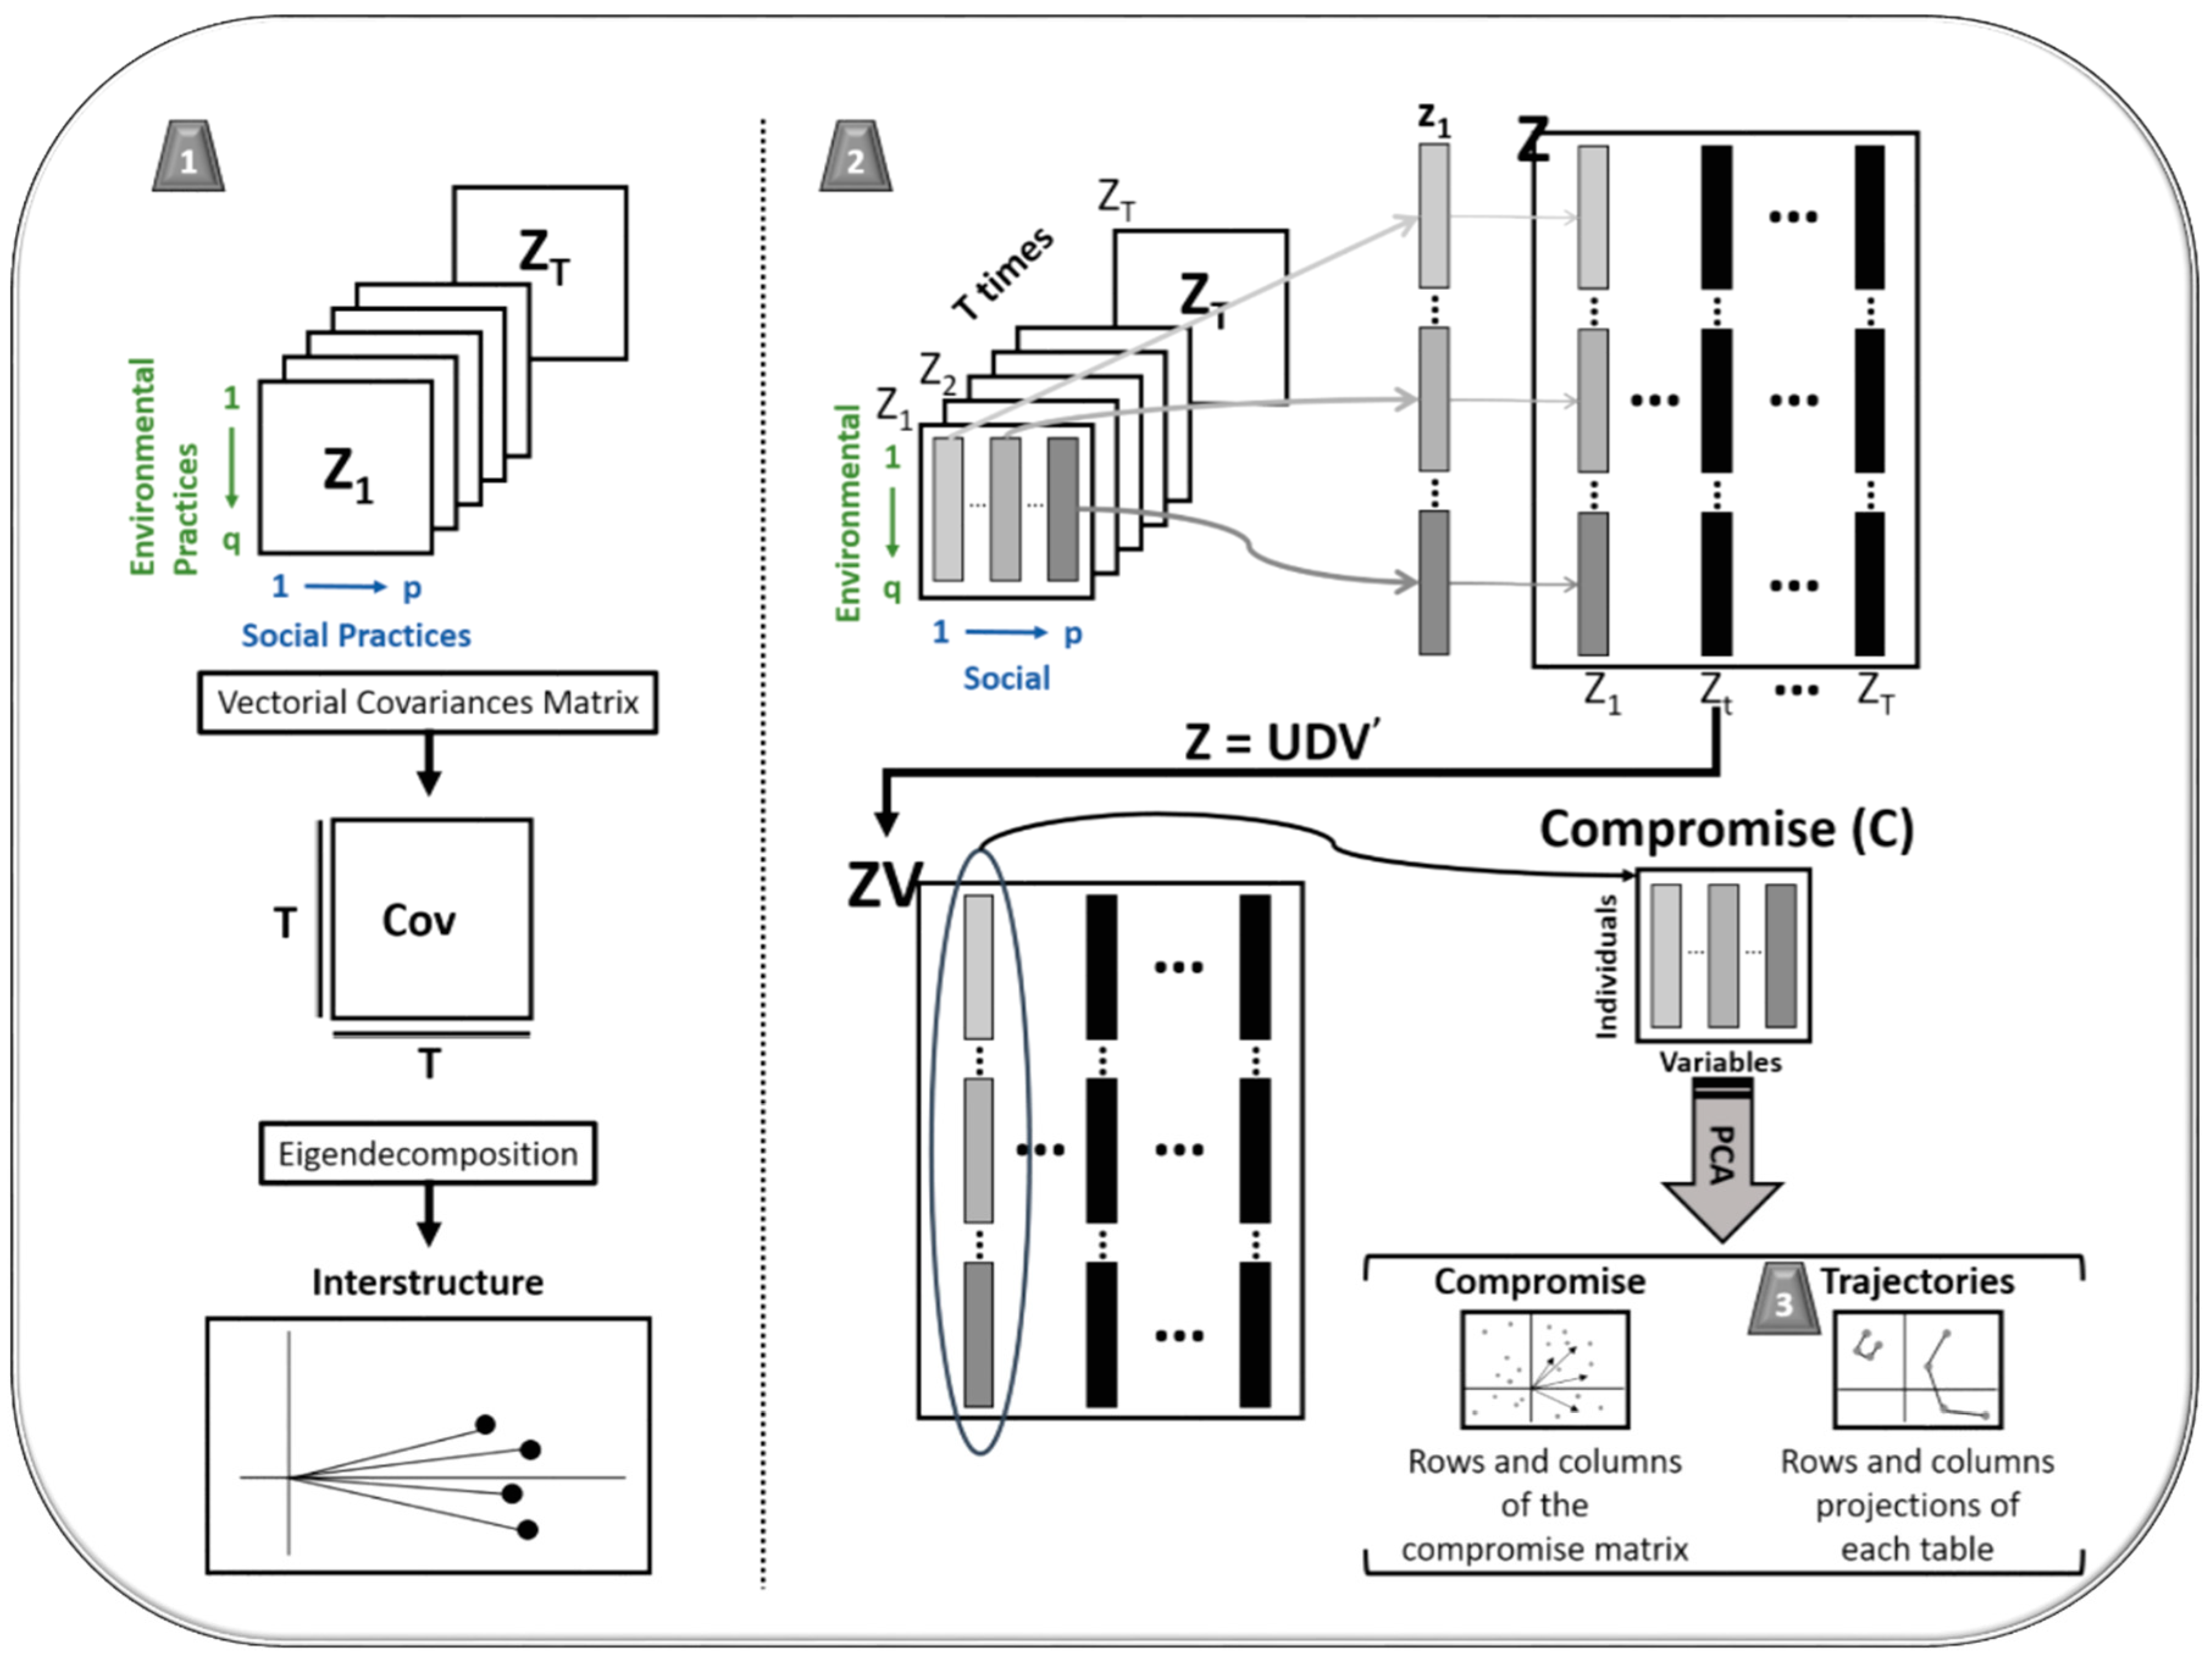
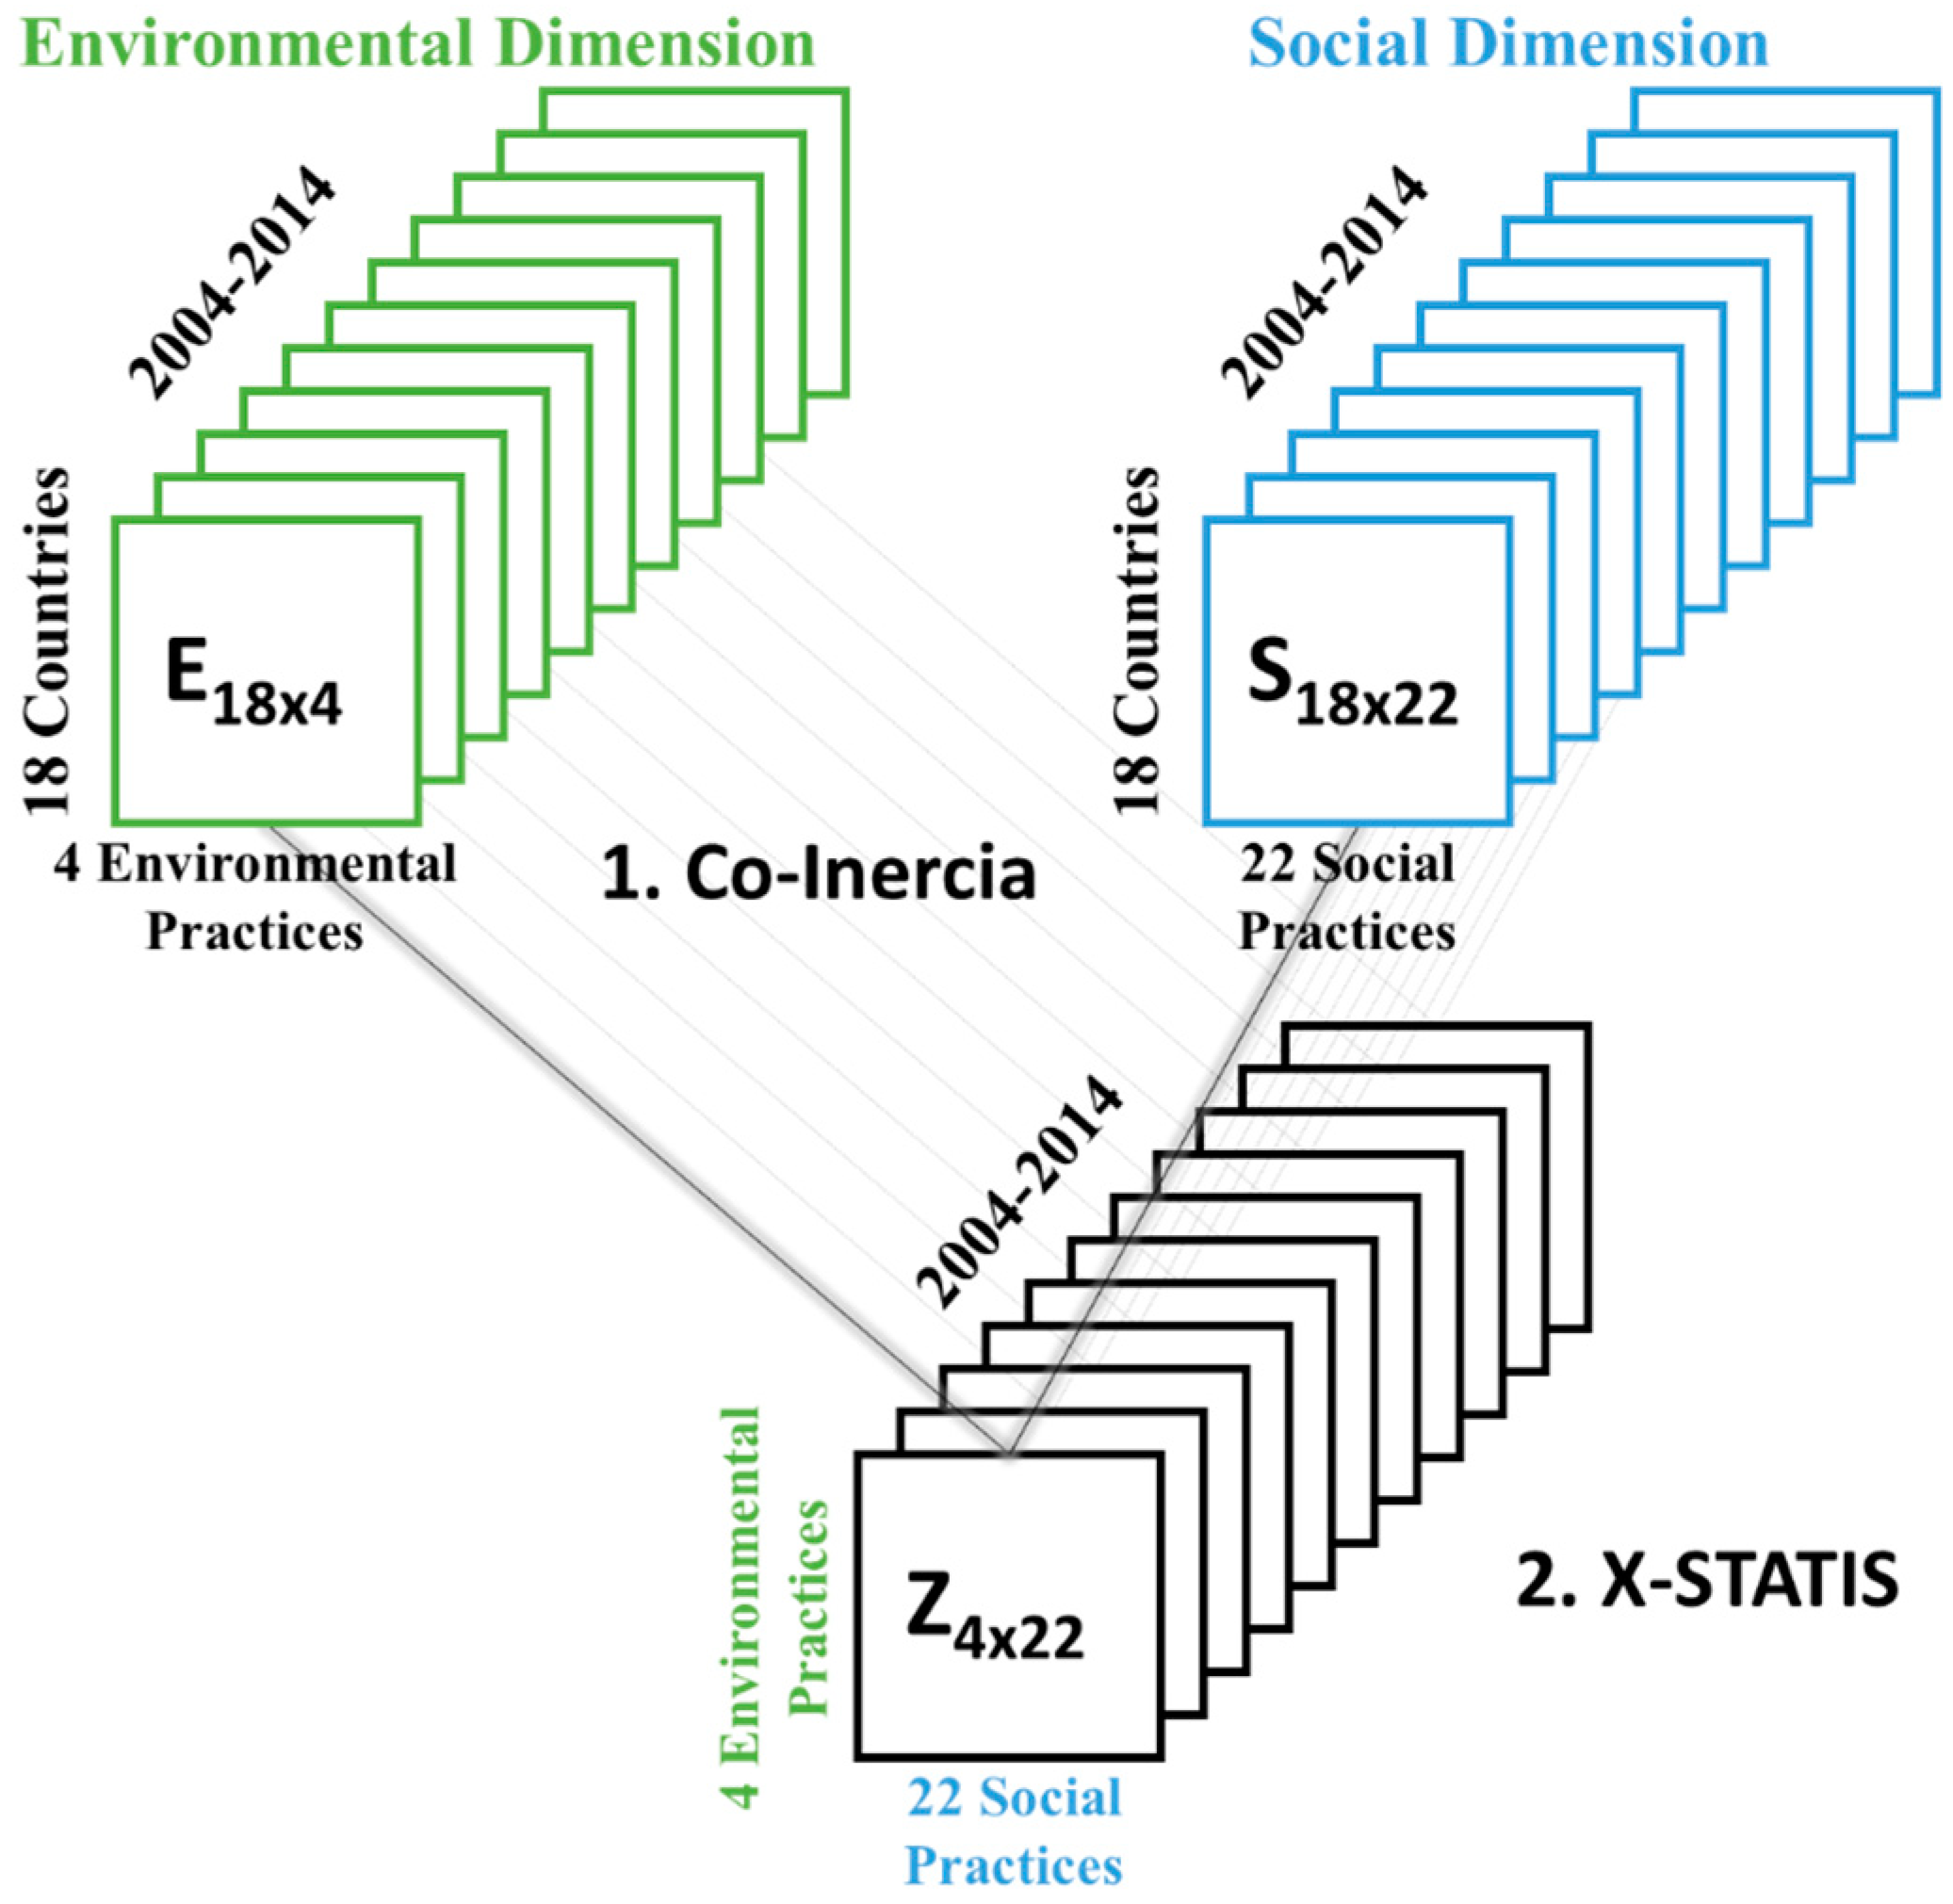
3.3.1. X-STATICO Analysis
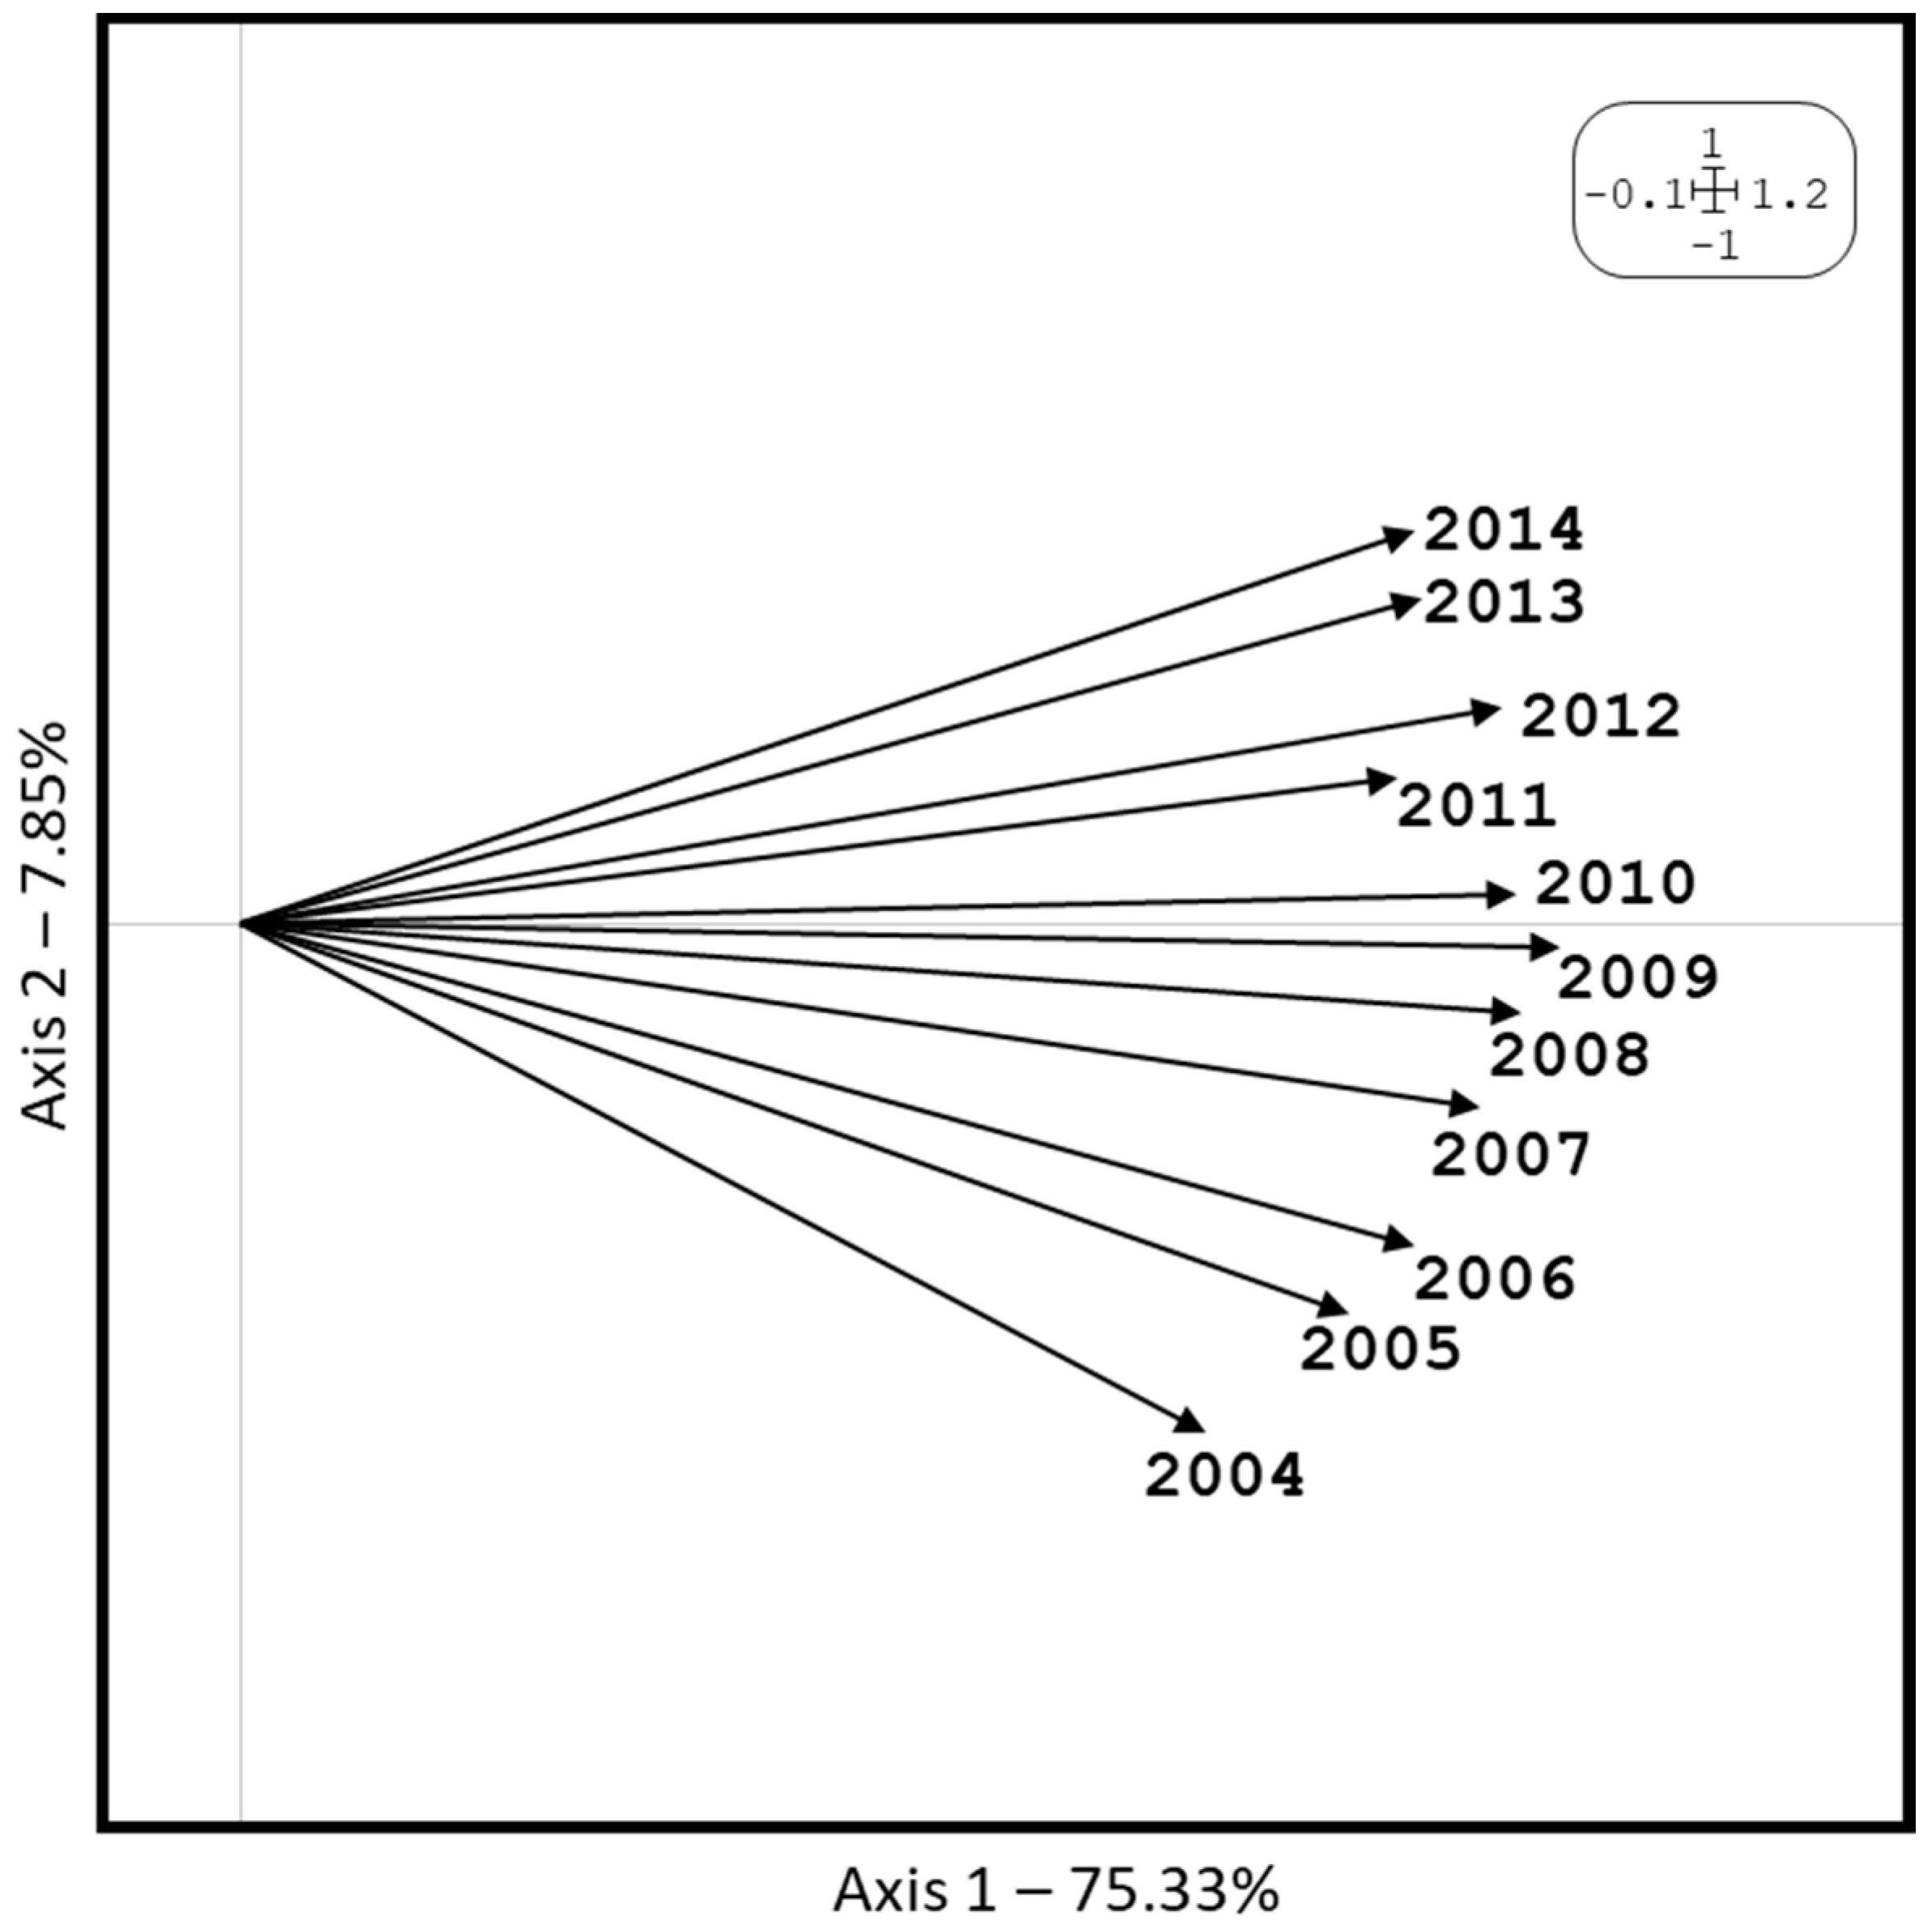
- The interstructure study: in the first stage, it is about studying the relationship between the different data tables, that is, a general comparison of the data tables’ structure. For this, a matrix of vector covariances between tables is constructed, so that the element in row and column is , where is the t-table of the sequence, and , are the metrics for the rows and columns, respectively. Applying a decomposition in singular values to this matrix, we can reduce the dimensionality and represent this information in an Euclidean subspace of low dimension, in which each data table (years) is represented as a point. The distance between points is associated with similarity; that is, two close points correspond to two years of similar characteristics, and, if we join these points to coordinates origin, we can visualise an estimate of said similarity in terms of the angles between vectors, associating acute angles with strong similarities.
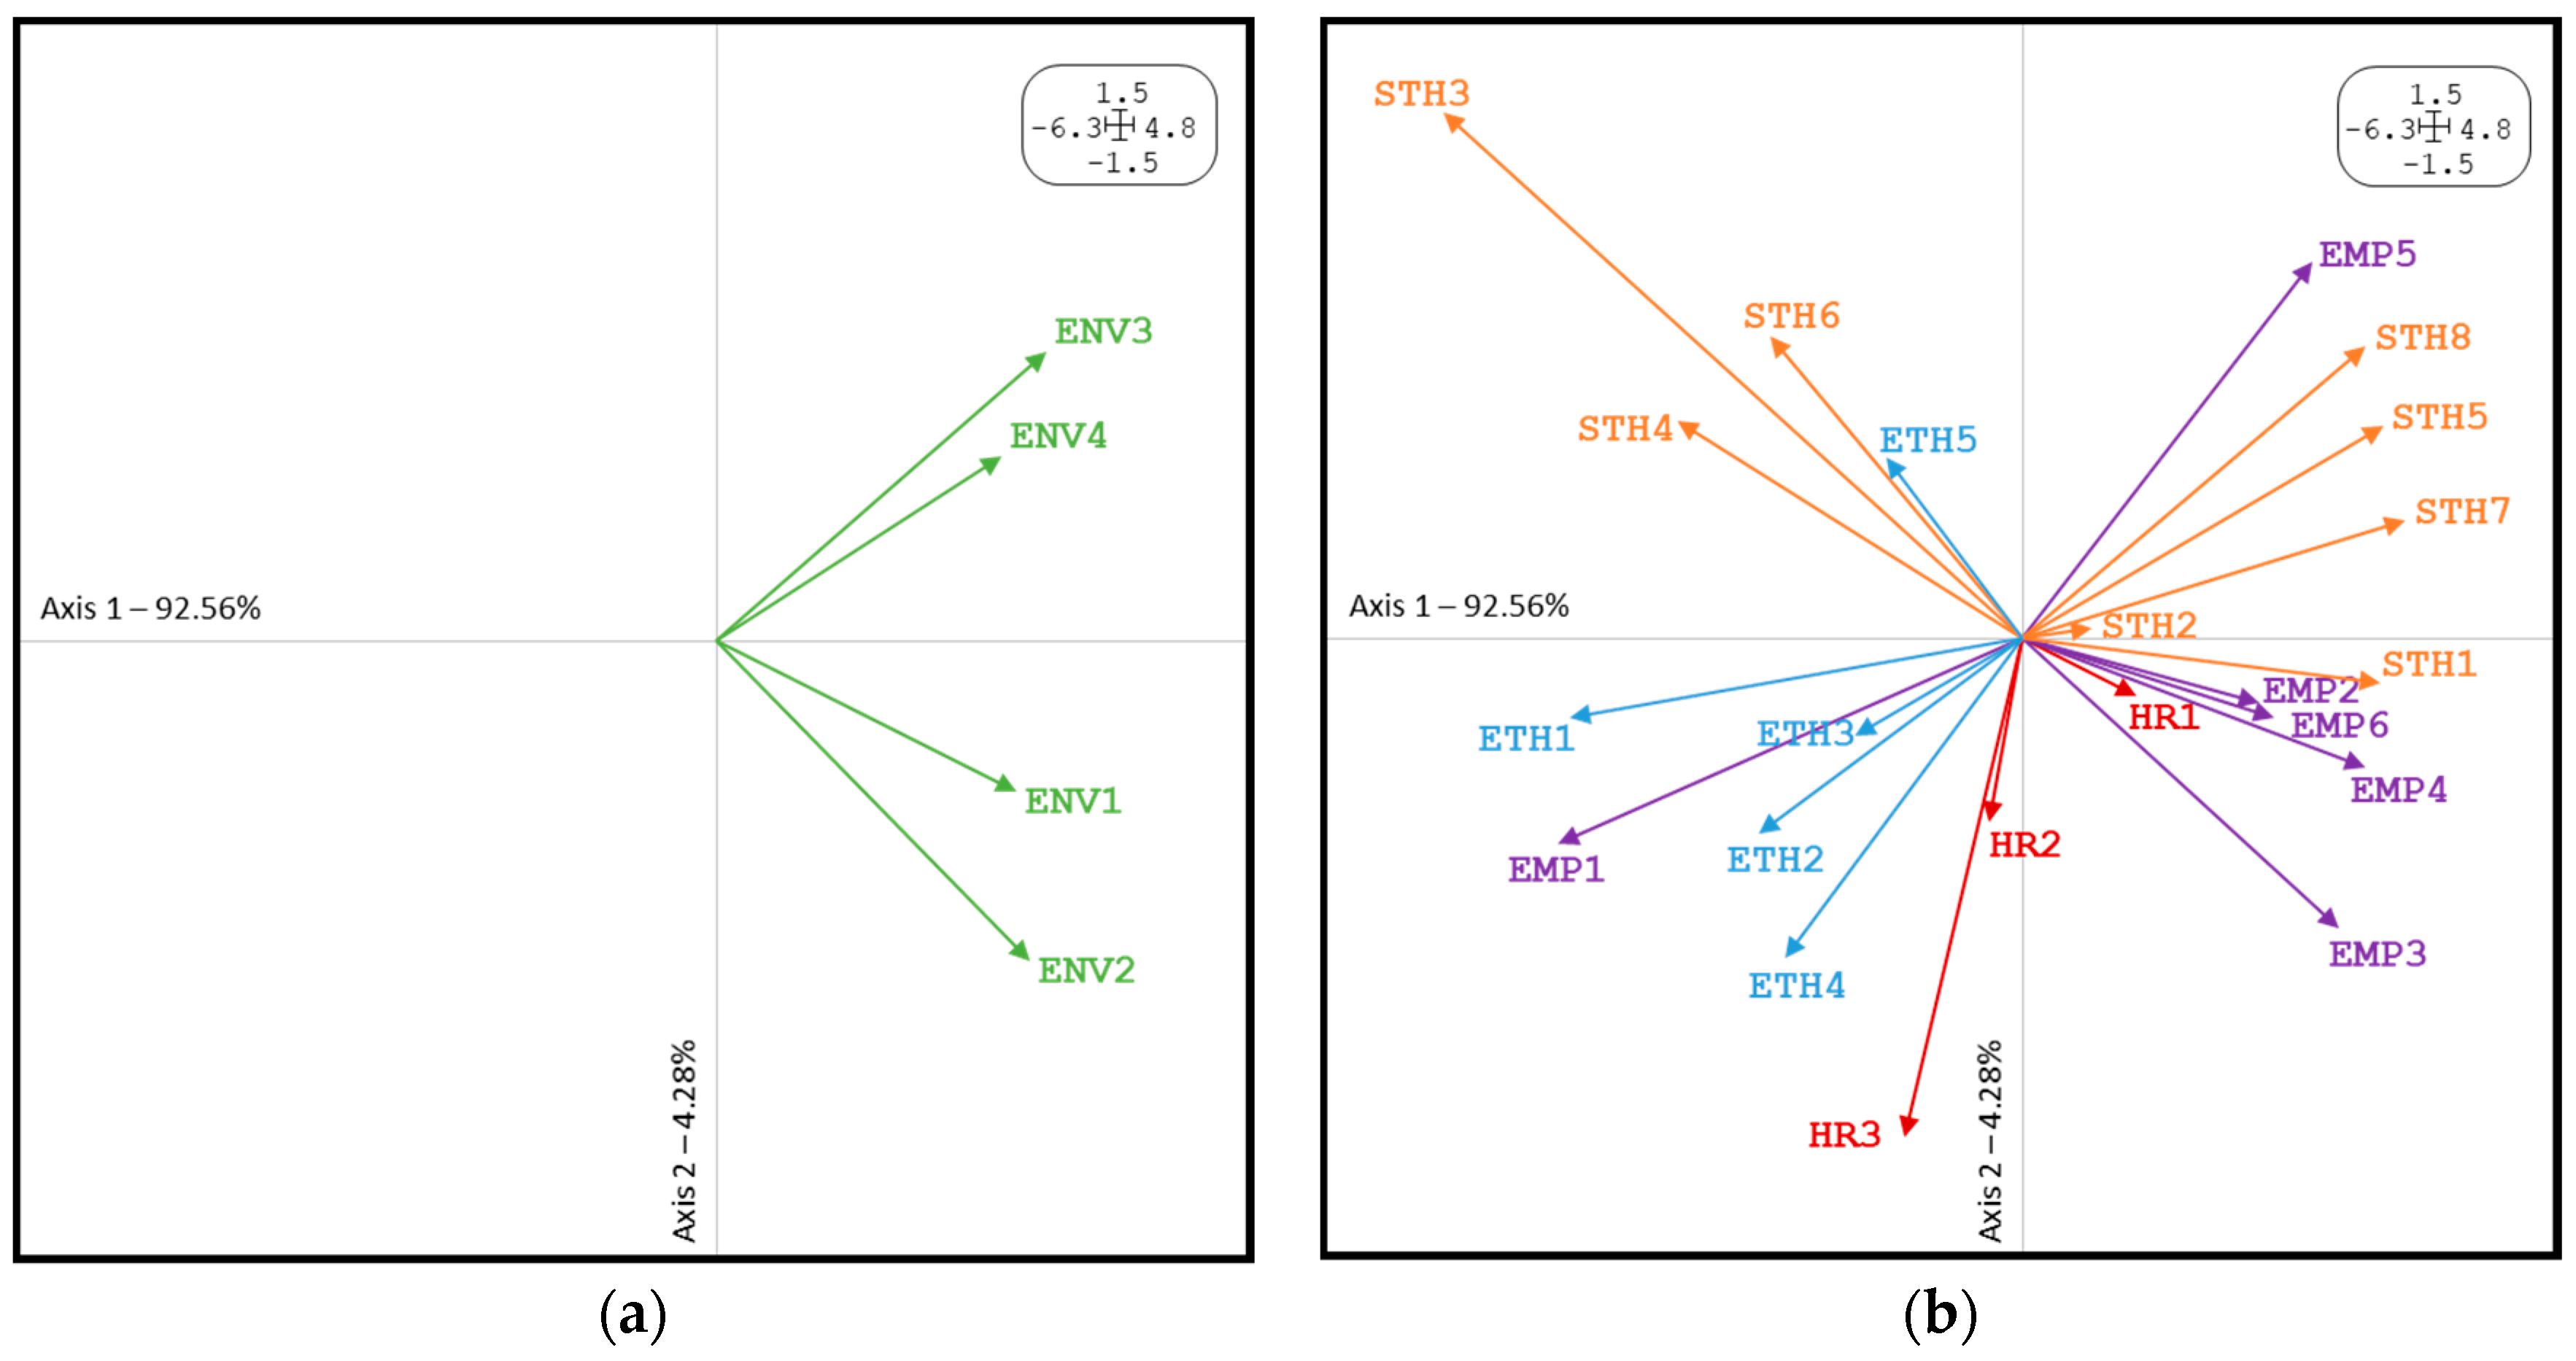
- The compromise analysis: the second stage consists in the compromise analysis, where, through the vectorisation of the matrices, that is, a linear transformation that converts each matrix into a column vector, concatenating the constituent columns of each matrix one on top of the other; so, if we have matrices, we have a new matrix of columns and rows, with being the number of individuals (our environmental practices) and being the number of variables (social practices) that, as we said, should be the same for each matrix. We call this matrix . From a decomposition in singular values of the matrix , we get a new matrix known as the matrix, from which we extract the first column that contains the factorial loads of the first eigenvector—which carries most of the information—and provides us with the information that all the matrices have in common, and, unfolding this vector, we obtain the compromise matrix (C). This matrix synthesises the information of each one of the individuals in the variables for the times or occasions, ‘filtering the noise’ and representing the statistically significant information: the stable structure of the data. If we apply a principal component analysis to this matrix, we can trace and interpret its structure, where environmental practices (rows of the compromise matrix) and social practices (columns of the compromise matrix) are represented, which refer to the information during the times. With this information, we can interpret the relationships between the variables of two types (environmental and social) based on how all of the countries behave in them through the compromise analysis.
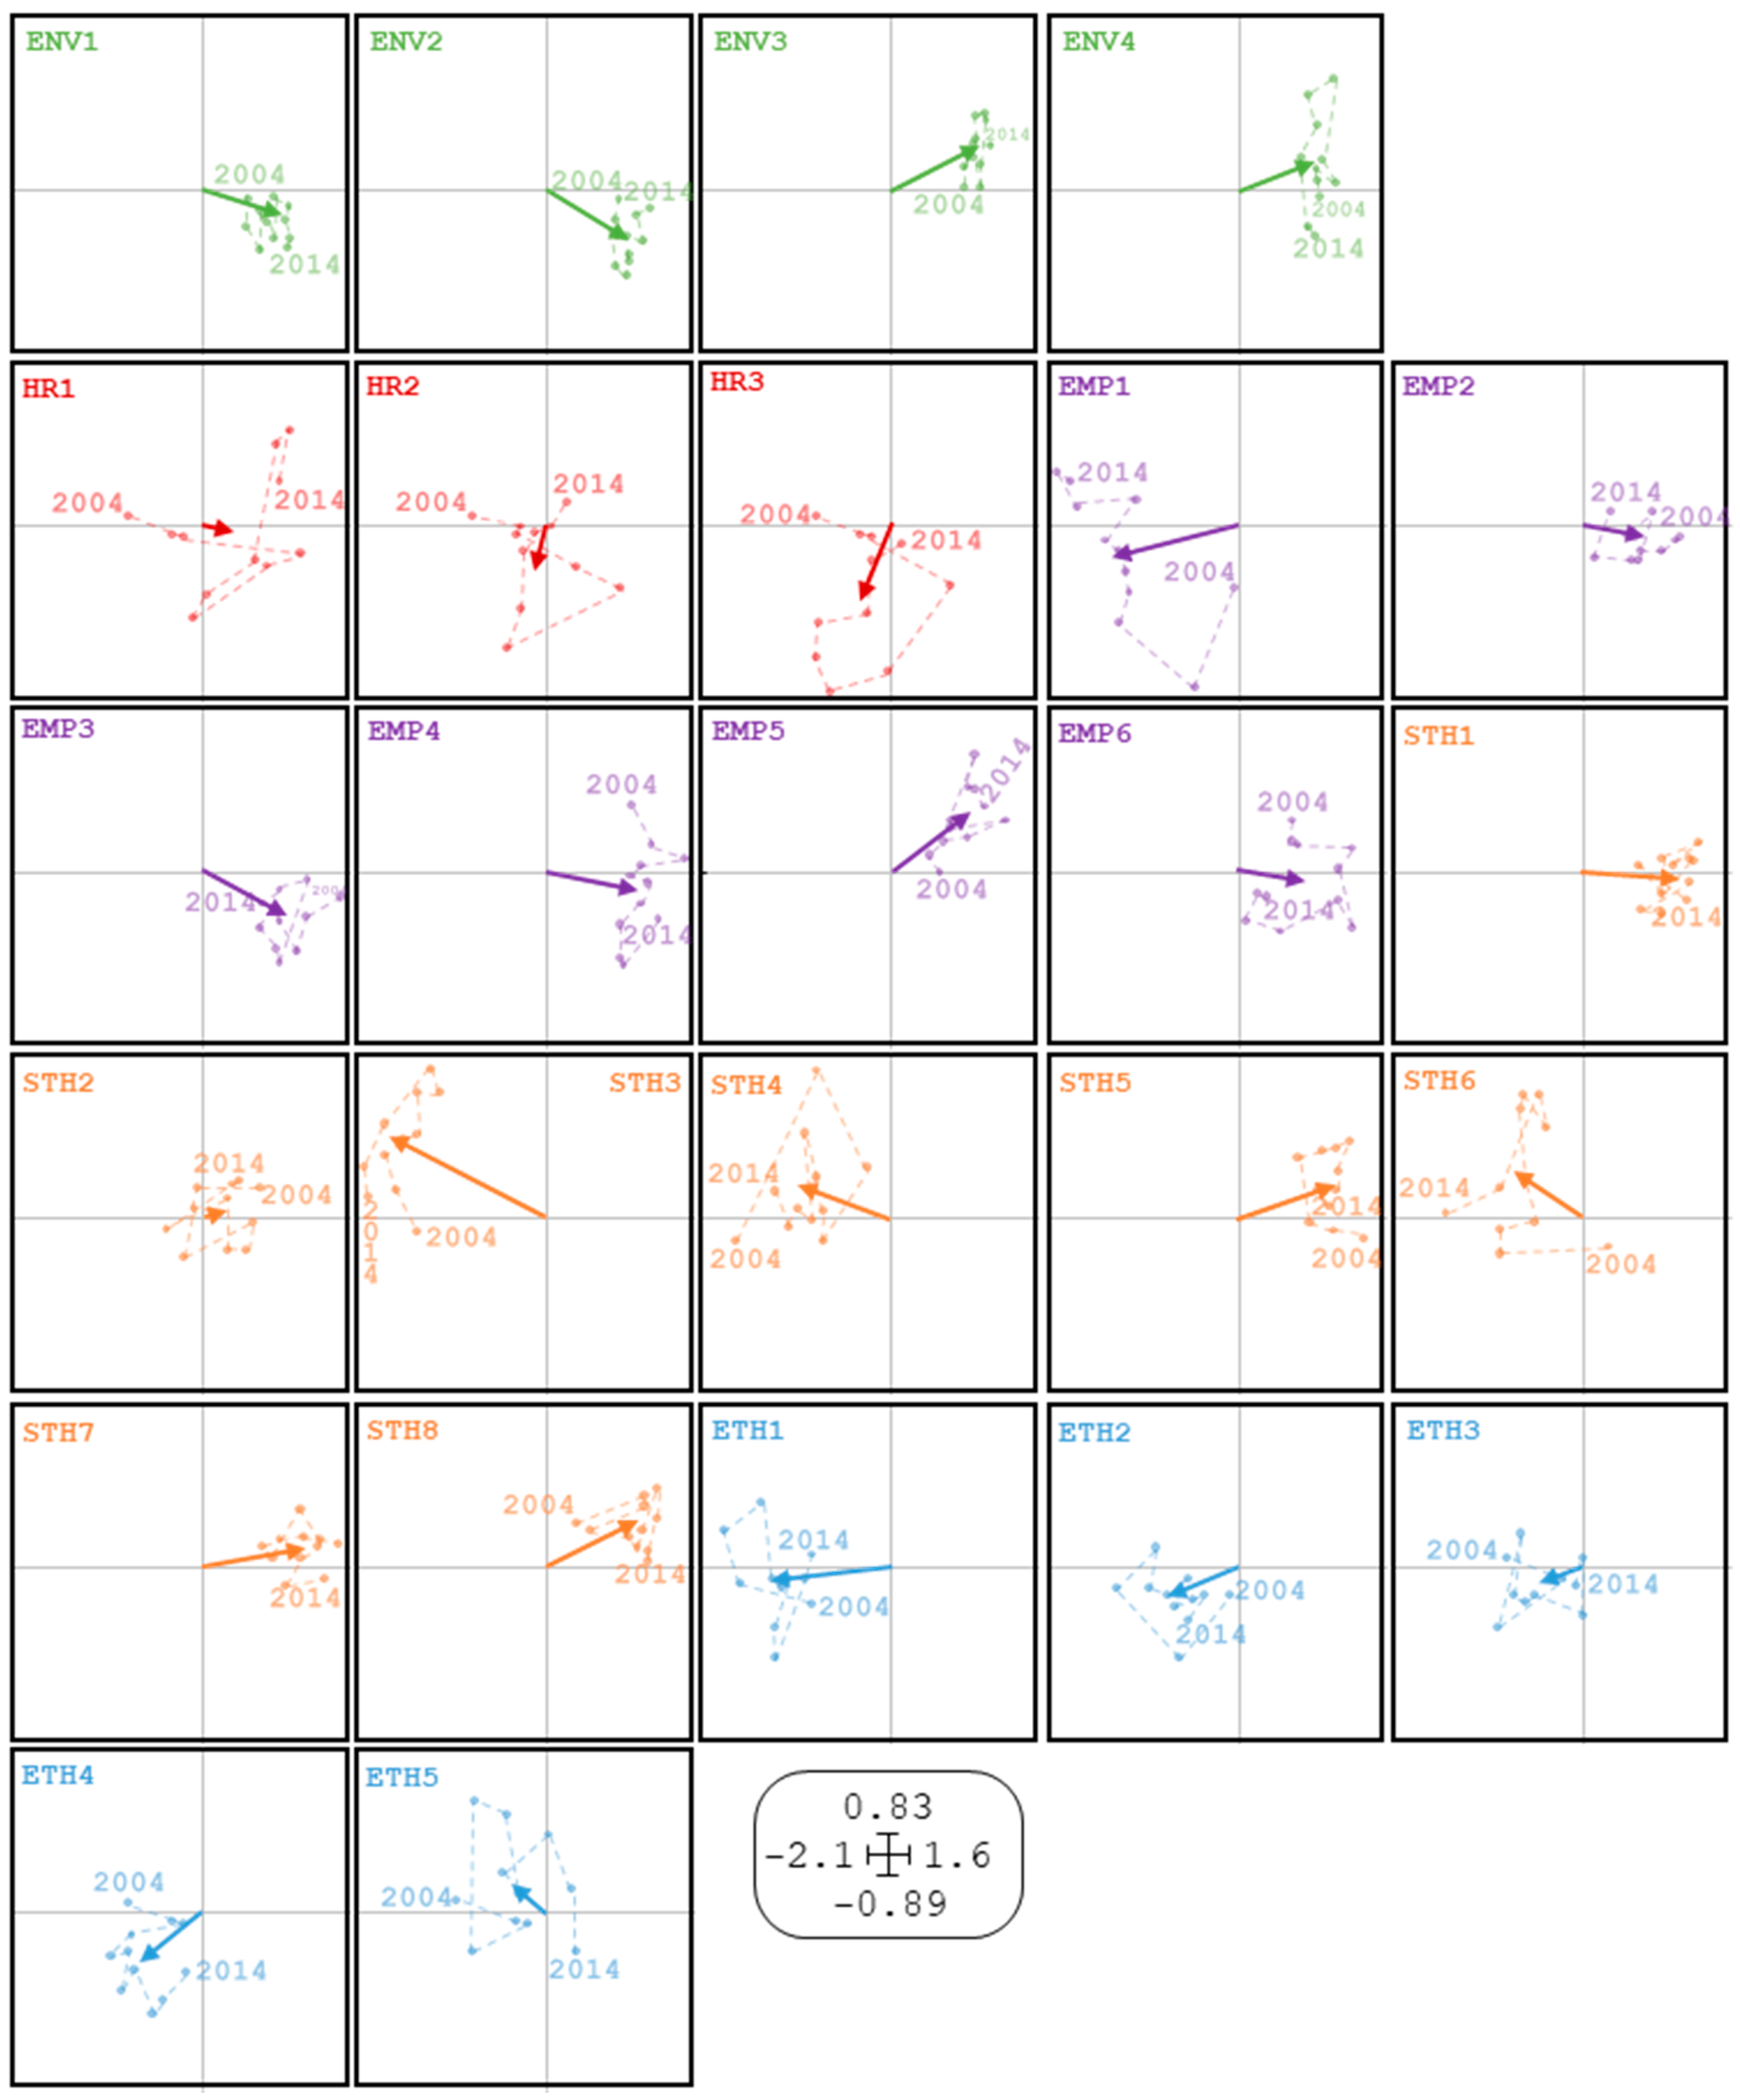
- The intrastructure study: in the third stage, we study the intrastructure (also known as trajectories). The compromise matrix obtained in the previous stage allows representing the commitment positions of each of the elements (environmental and social practices) that make up the different tables. These positions correspond to the average positions of the same. This gives us a compromise space for the projection of the elements of each of the starting matrices, that is, the projection of the environmental practices (rows) and social practices (columns) of each year (each table) in the compromise subspace. Let be the first eigenvectors of the compromise matrix. The coordinates of the rows of the table are the rows of , and the columns are the rows of , where are the first eigenvectors of . The trajectories provide information on the evolution of each of the elements (environmental and social practices), and show how each table differs from the stable structure. With all this information, we can determine the relevance of worldwide CSR practices, showing which practices are commonly the most demanded and developed by all companies, and find those social practices that are generally implemented within the company with a development that is similar or close to environmental practices.
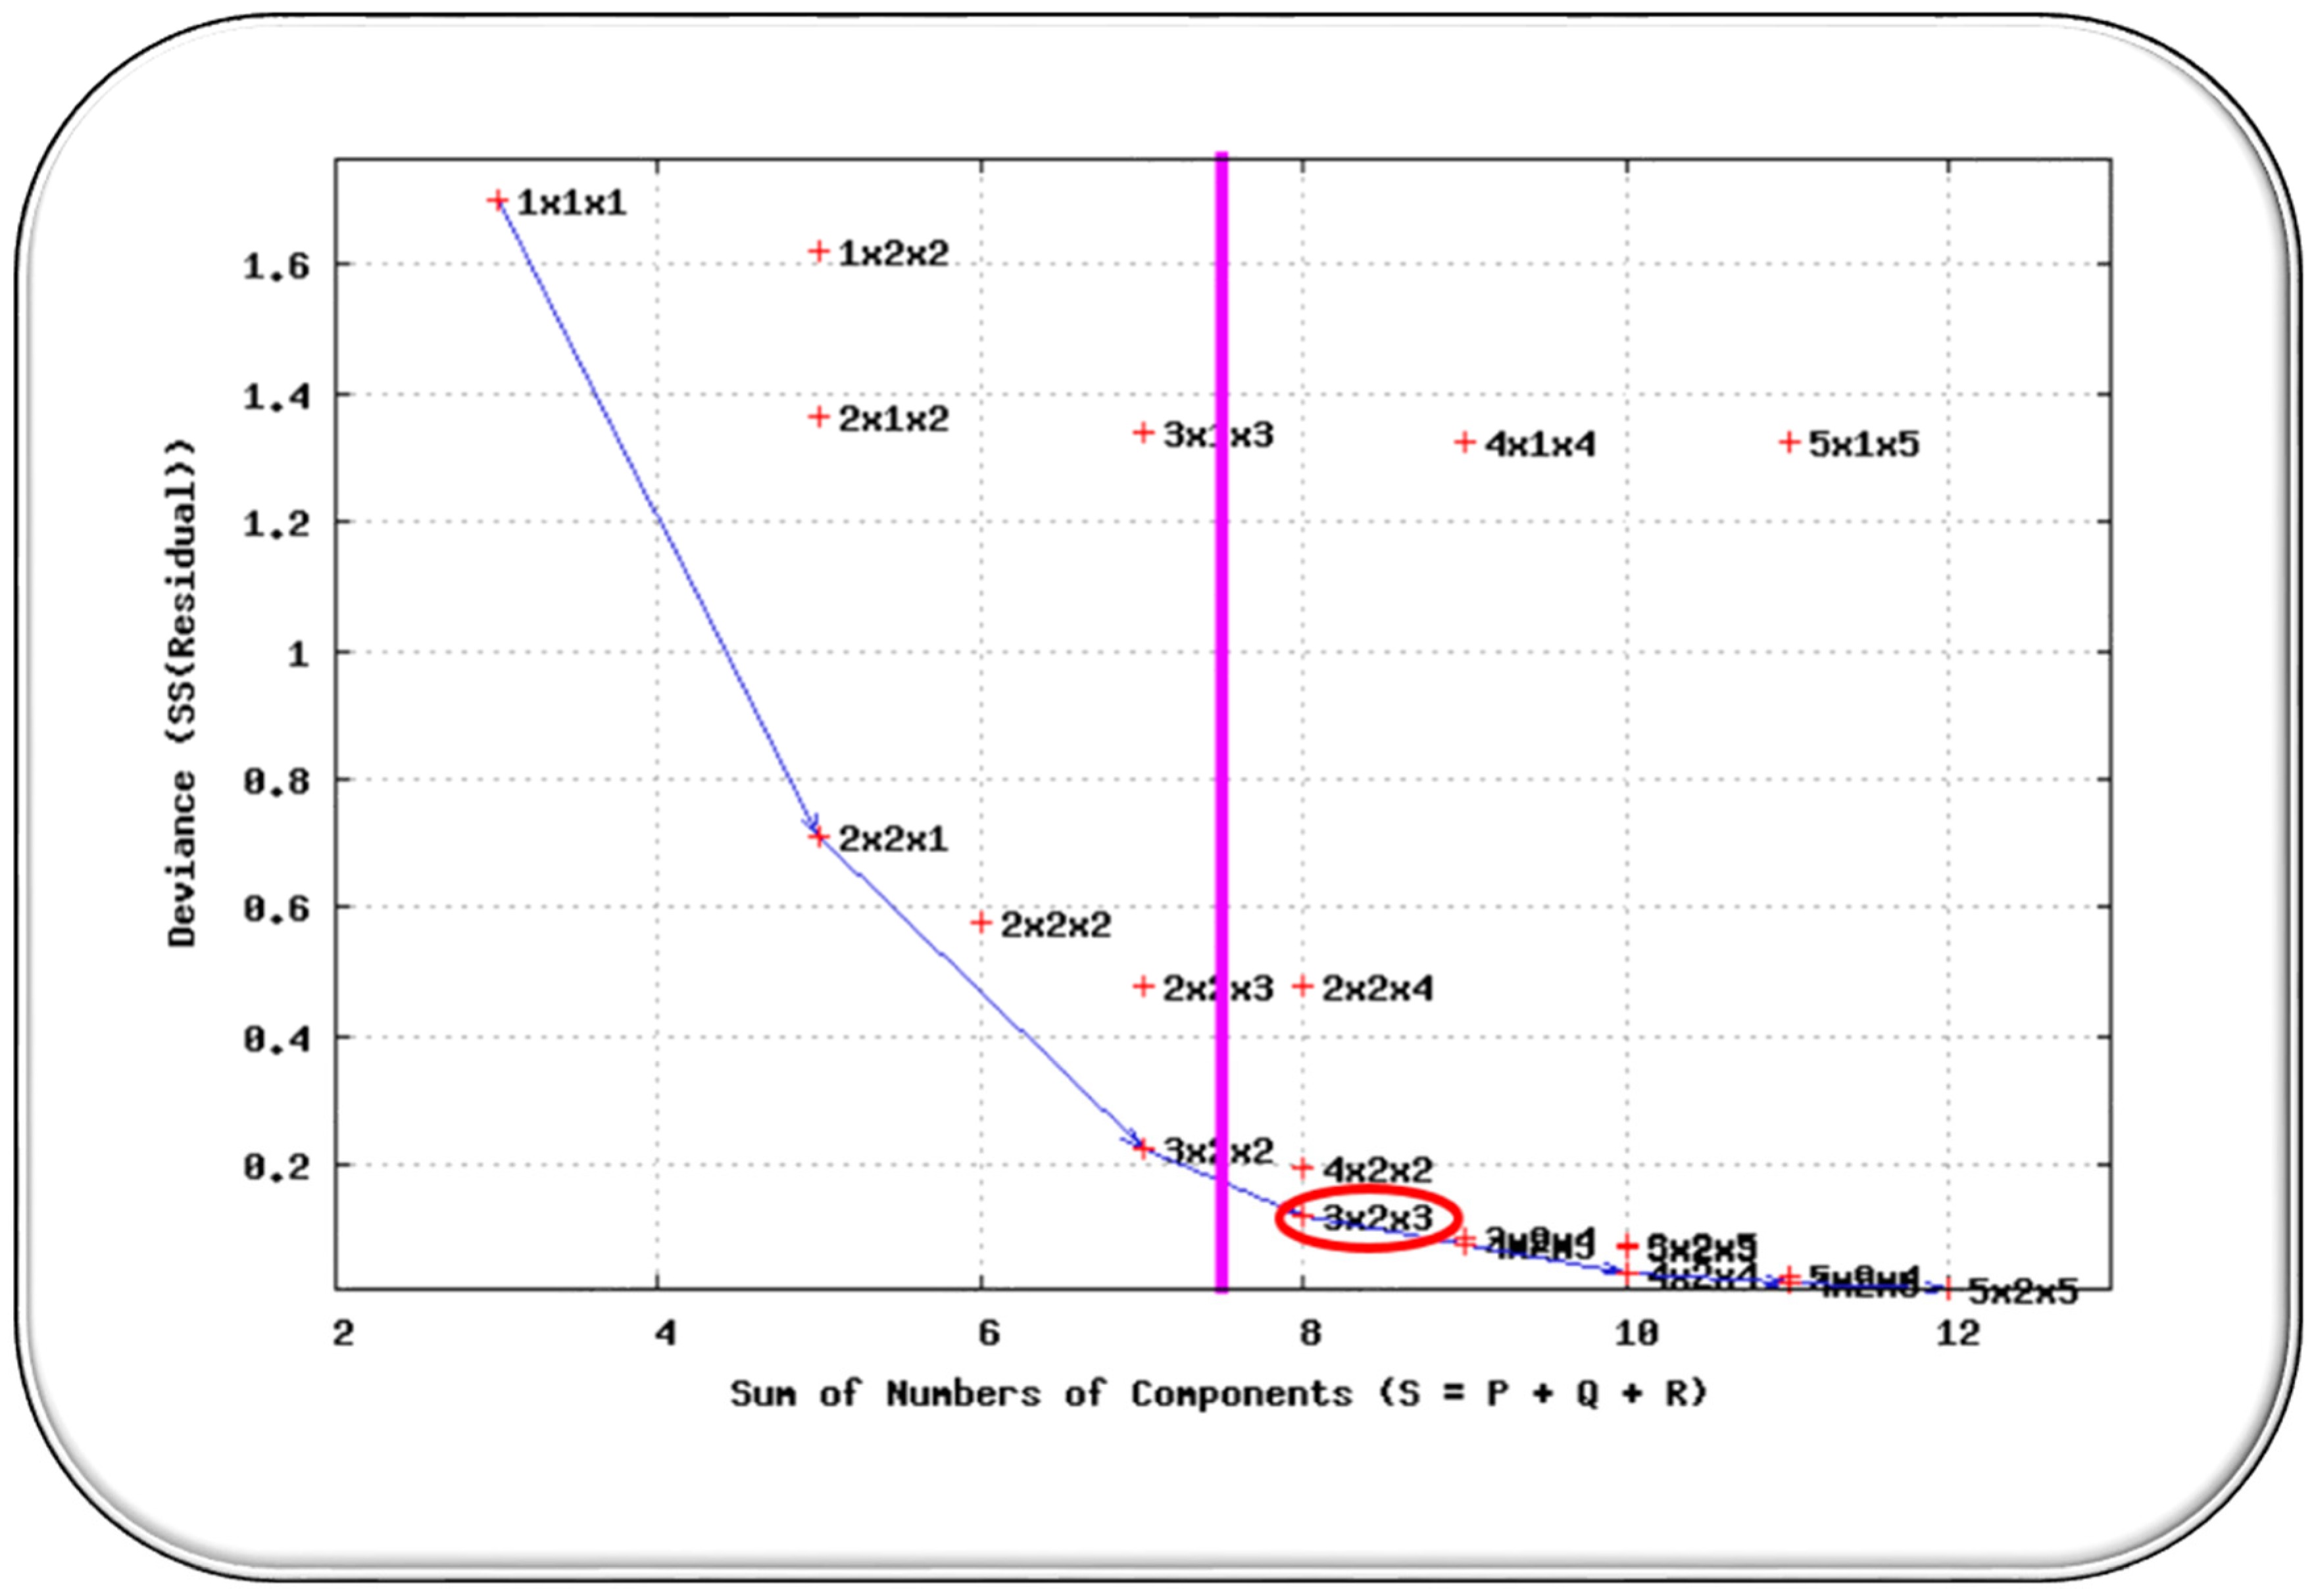
3.3.2. Tucker3 Analysis
- A, B, and C correspond to each of the modes with , , and dimensions, respectively, to describe the subject to analyse.
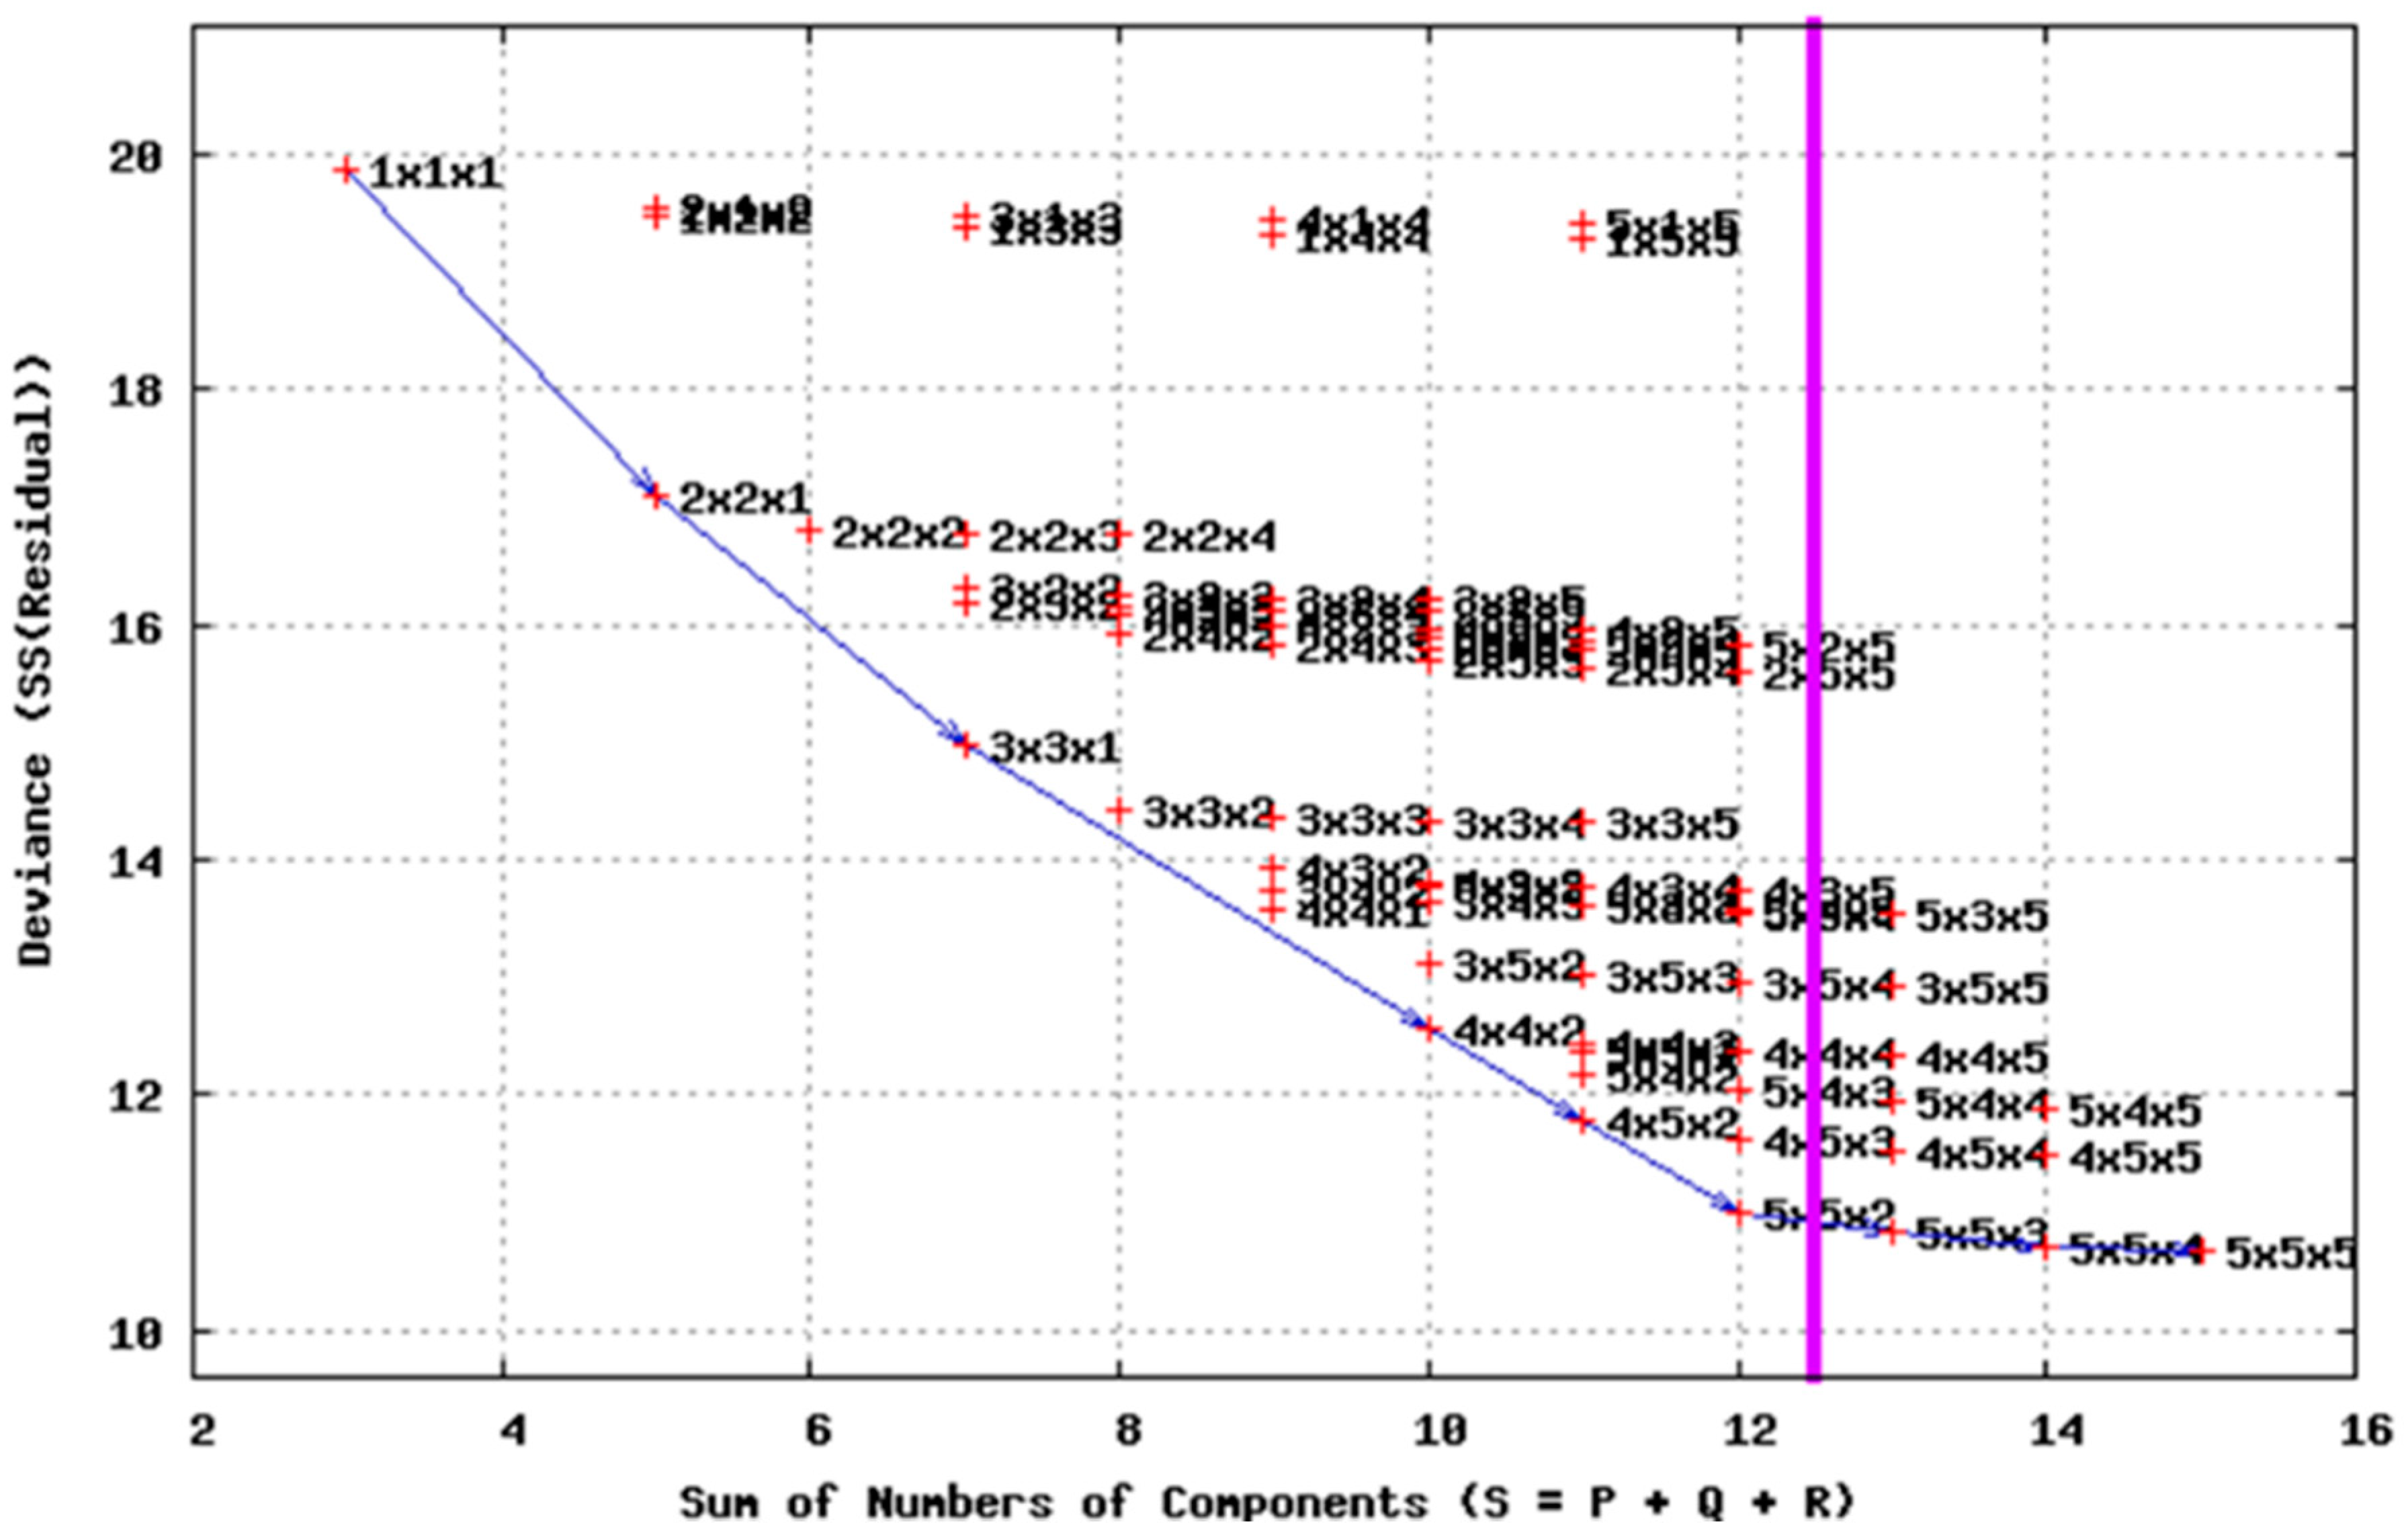
- P, Q, and R refer to the number of components retained for each of the modes A, B, and C, respectively, with , , and .
- corresponds to the residual matrix associated with the description of .
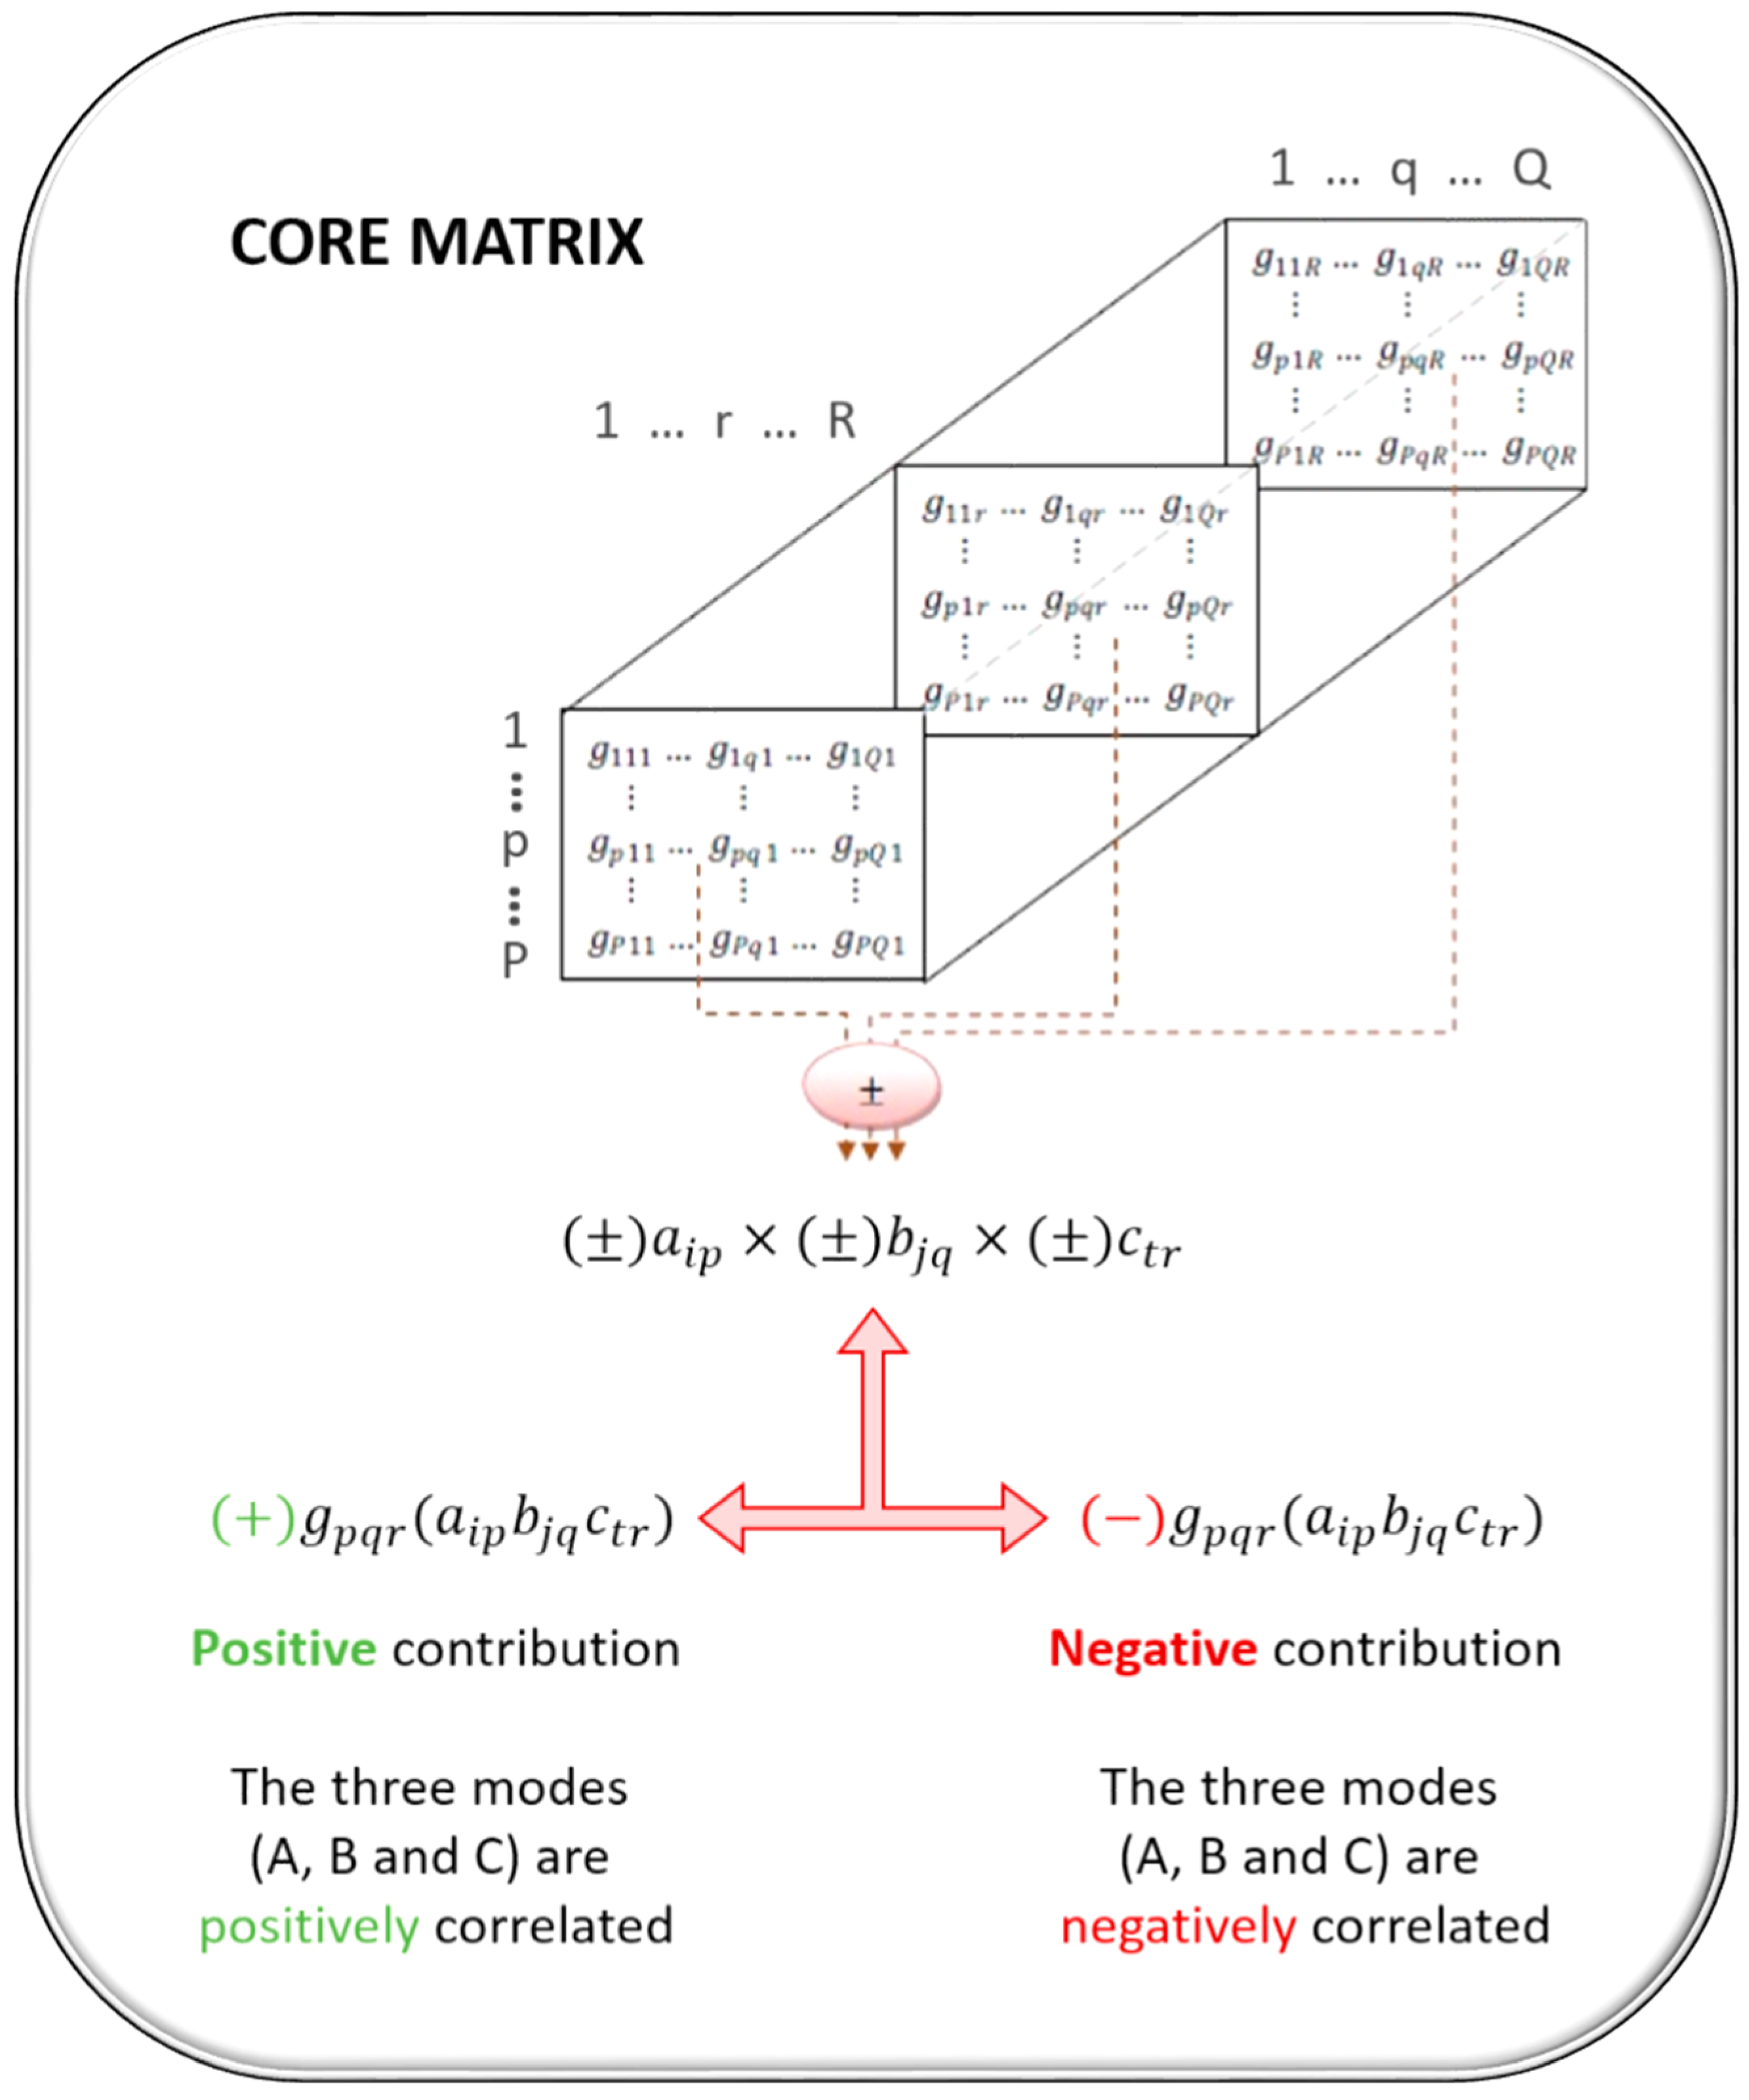
- represents the central matrix known as the core matrix of . dimensions, . This matrix represents the value by which the product of a single component is weighted, so that the value and sign of each element of this matrix provides information about the entity of the interaction between the components of the different modes. In addition, it contains the amount of variability explained by the combination of said components (P, Q, and R).
- are the elements of the charge matrices respectively, and denote the number of components in the modes .
- is an element of the residual three-way matrix , which denotes an error term associated with the description of .
- elements weigh the products among the components of the subjects (first mode, A), the components of the variables (second mode, B), and the components of the different conditions (third mode, C) and explain the interaction between the factors of each of the modes. Those elements are stored in the core matrix , of dimensions (). This matrix can be considered as a generalisation of the diagonal matrix of the eigenvalues obtained from the decomposition into the singular values of a two-way matrix (note that said singular value decomposition forms the basis of the generalisation of the methods for multiple-way arrays). In addition, the core matrix G is derived from the matrices of the three modes as follows:
- ➢
- Sign of the elements that appear in the core matrix→ (+/−) core
- ➢
- Sign of the elements in the studied component of the first mode A→ (+/−) P
- ➢
- Sign of the elements in the studied component of the second mode B→ (+/−) Q
- ➢
- Sign of the elements in the studied component of the third mode C→(+/−) R
4. Results
4.1. Characterisation of the Relevance of CSR Practices Worldwide
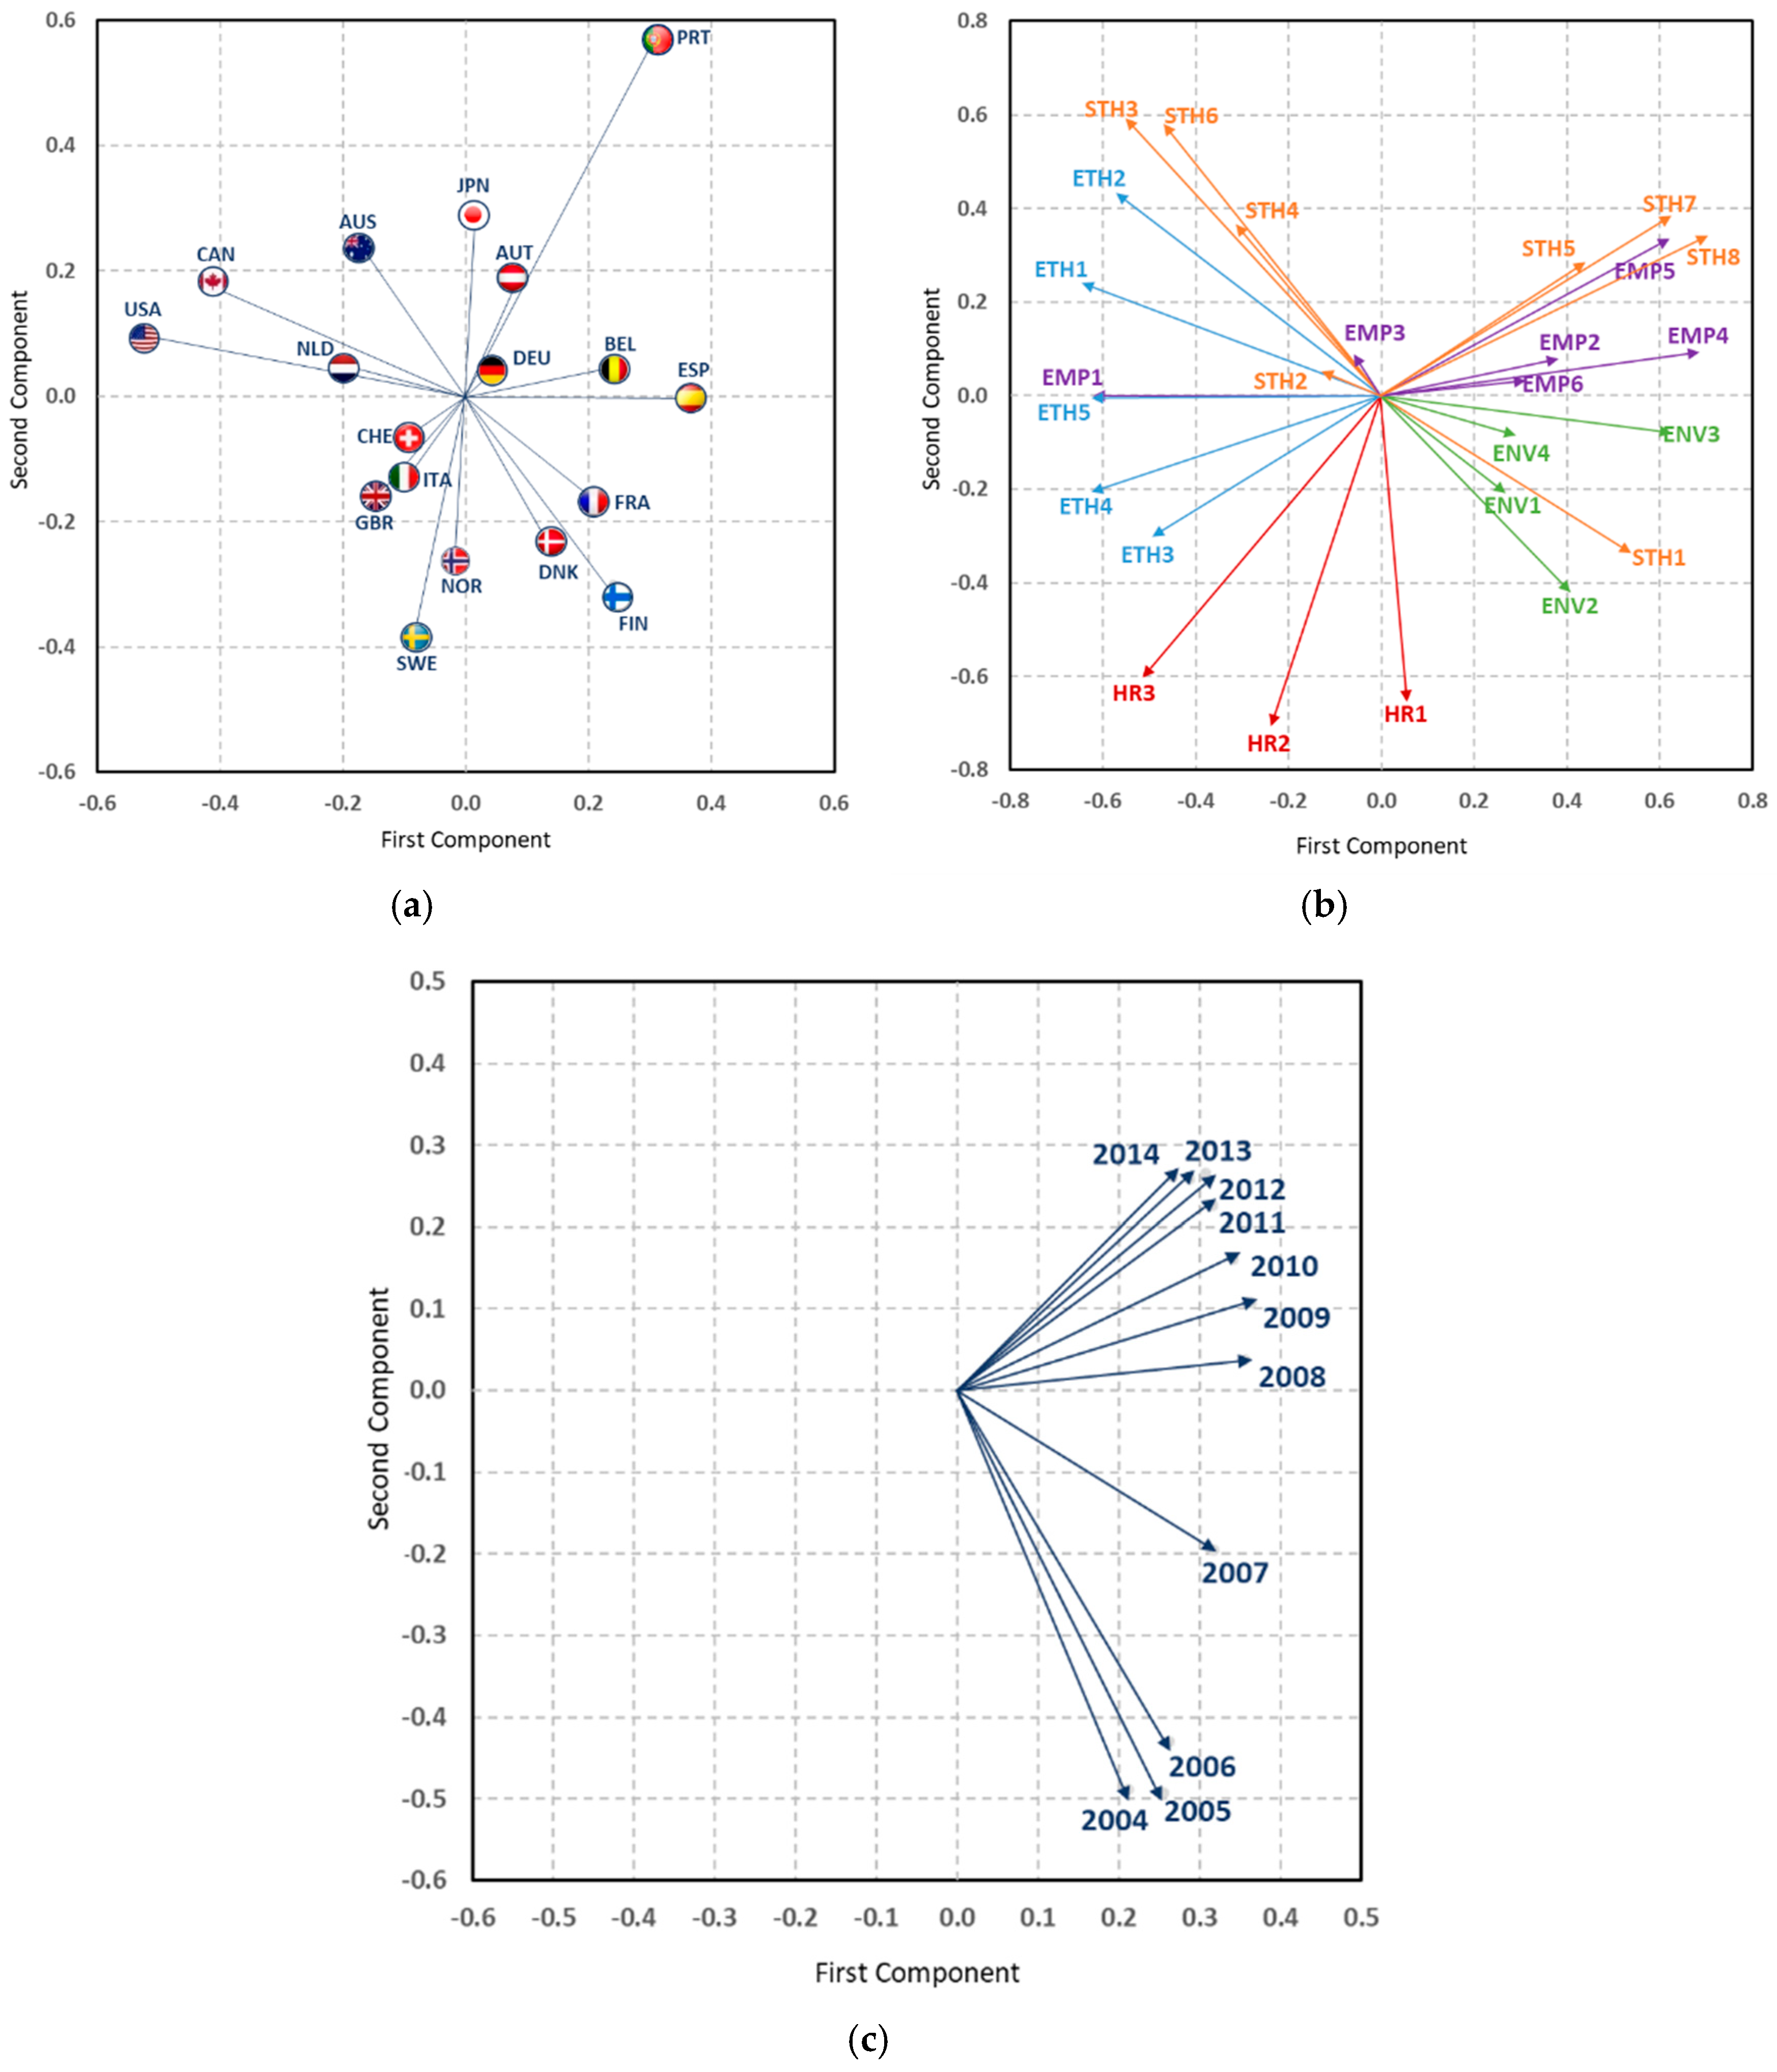
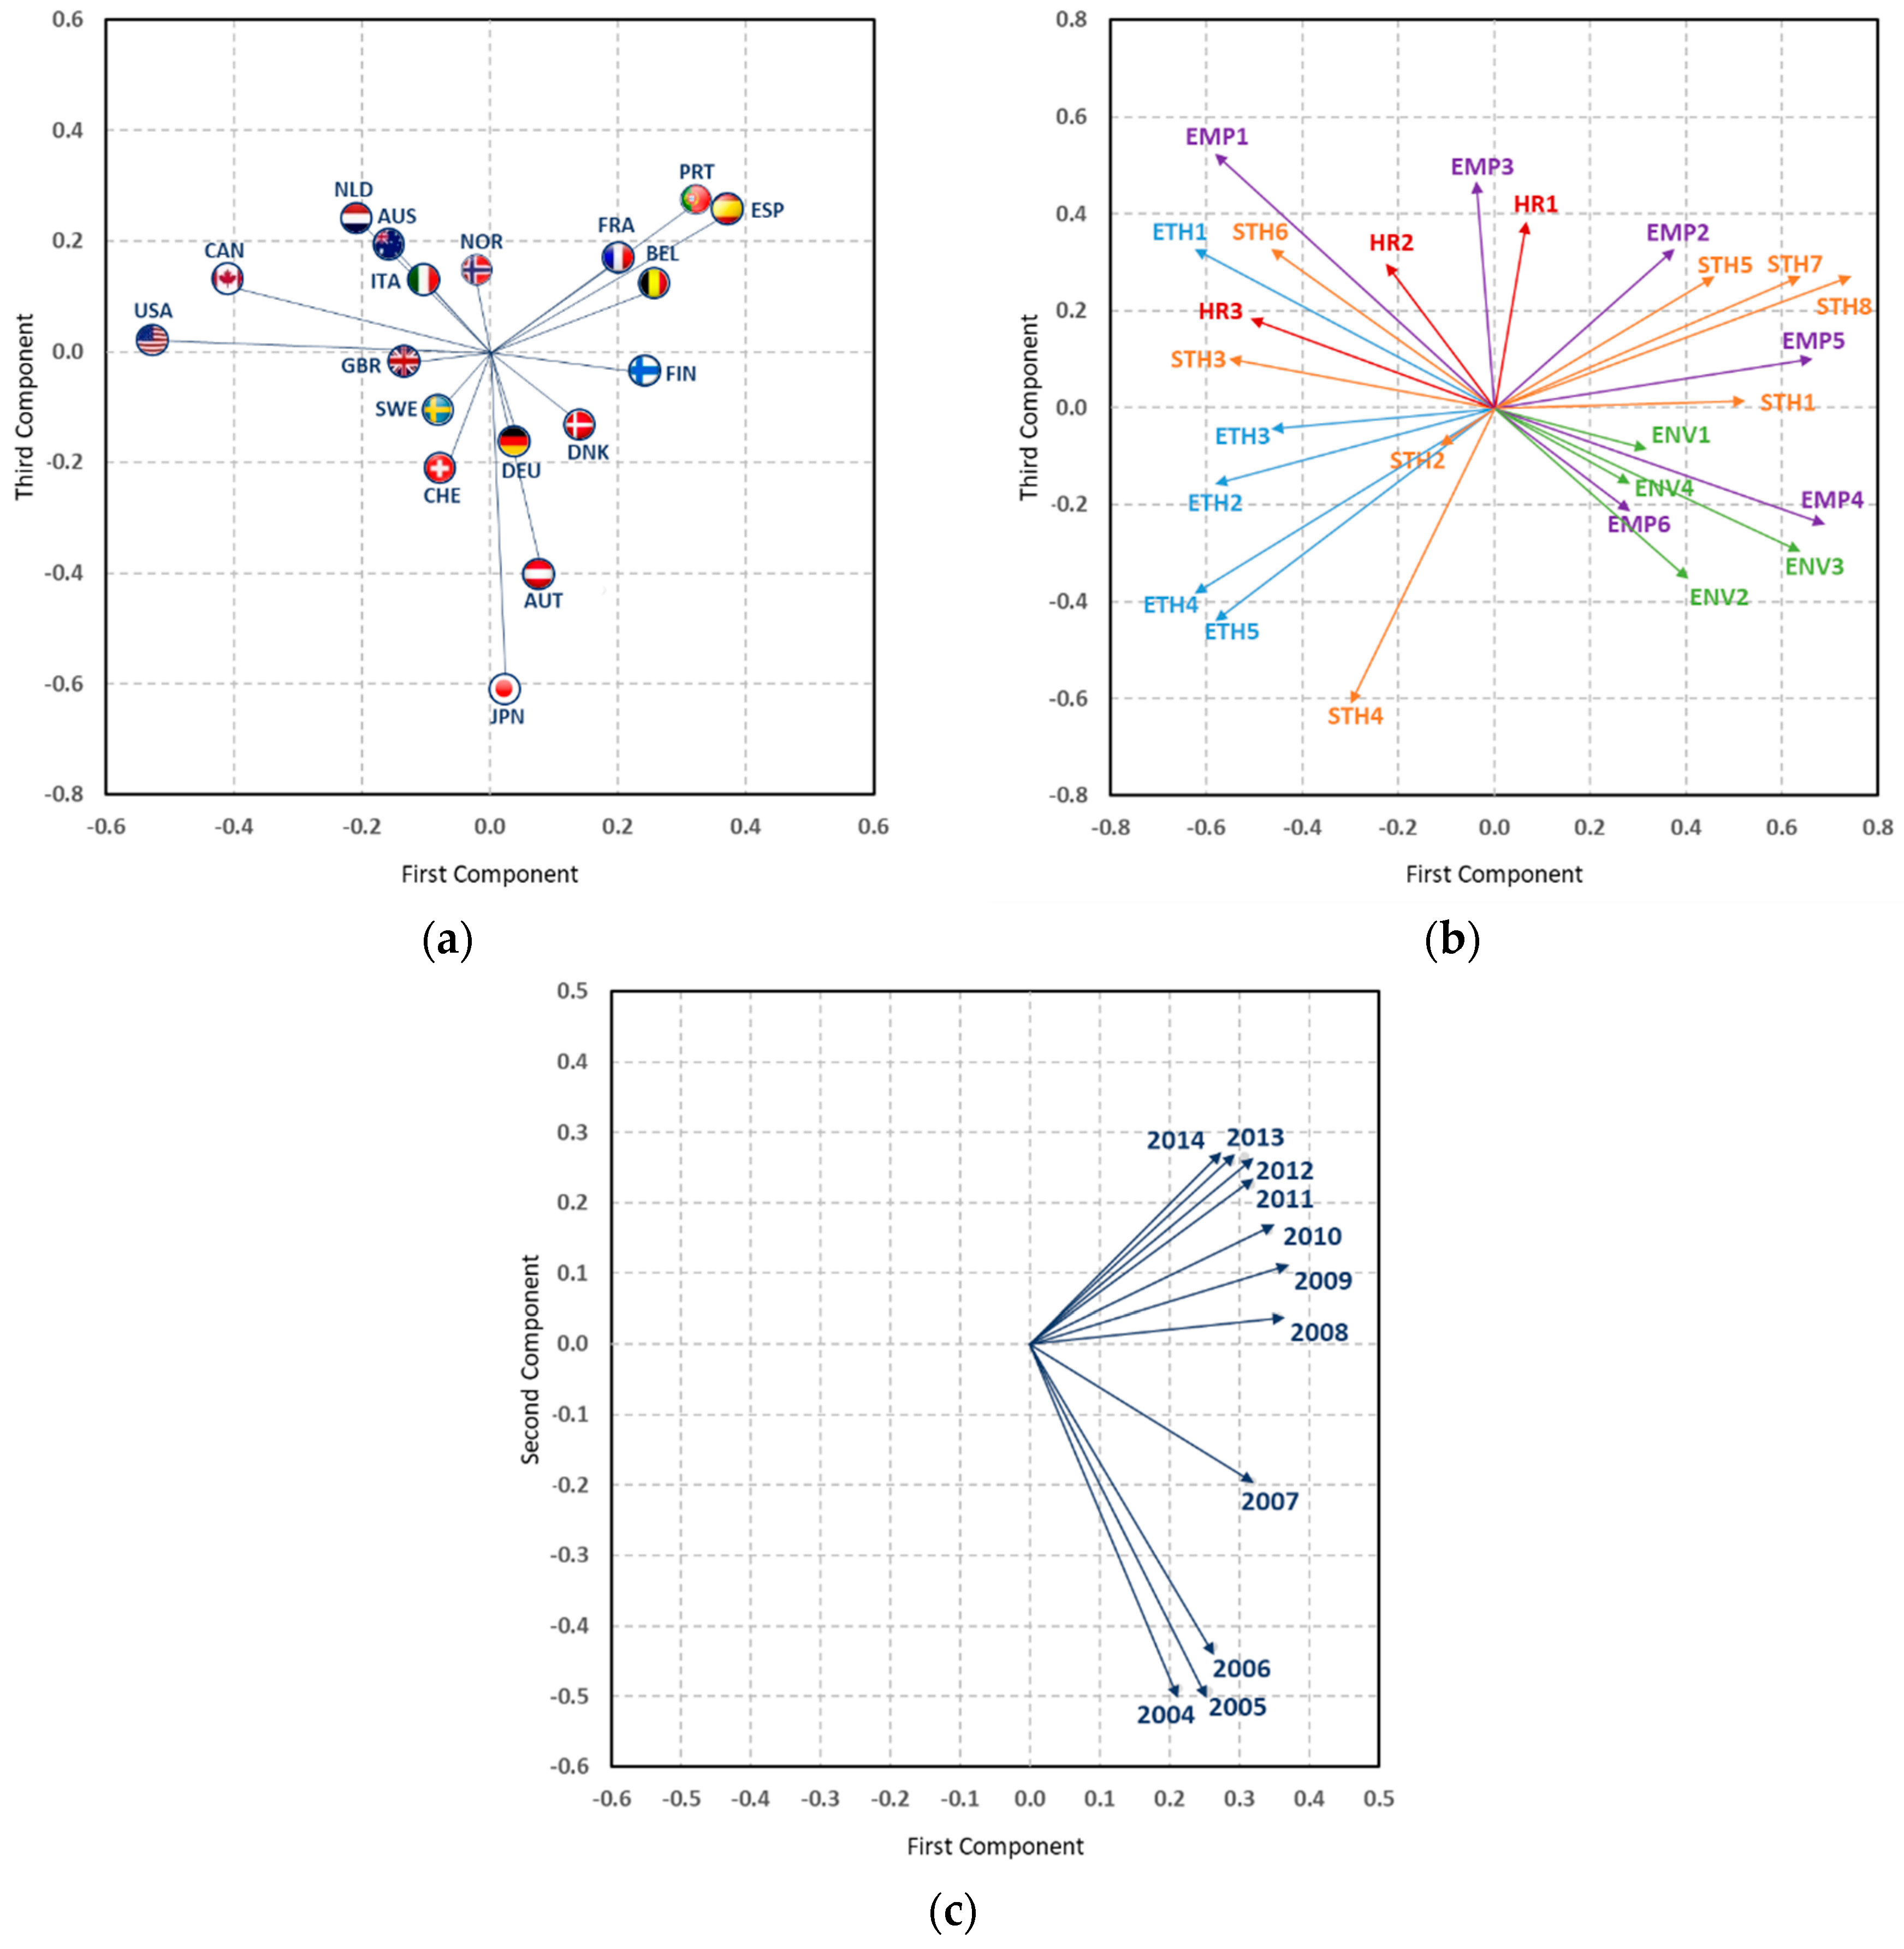
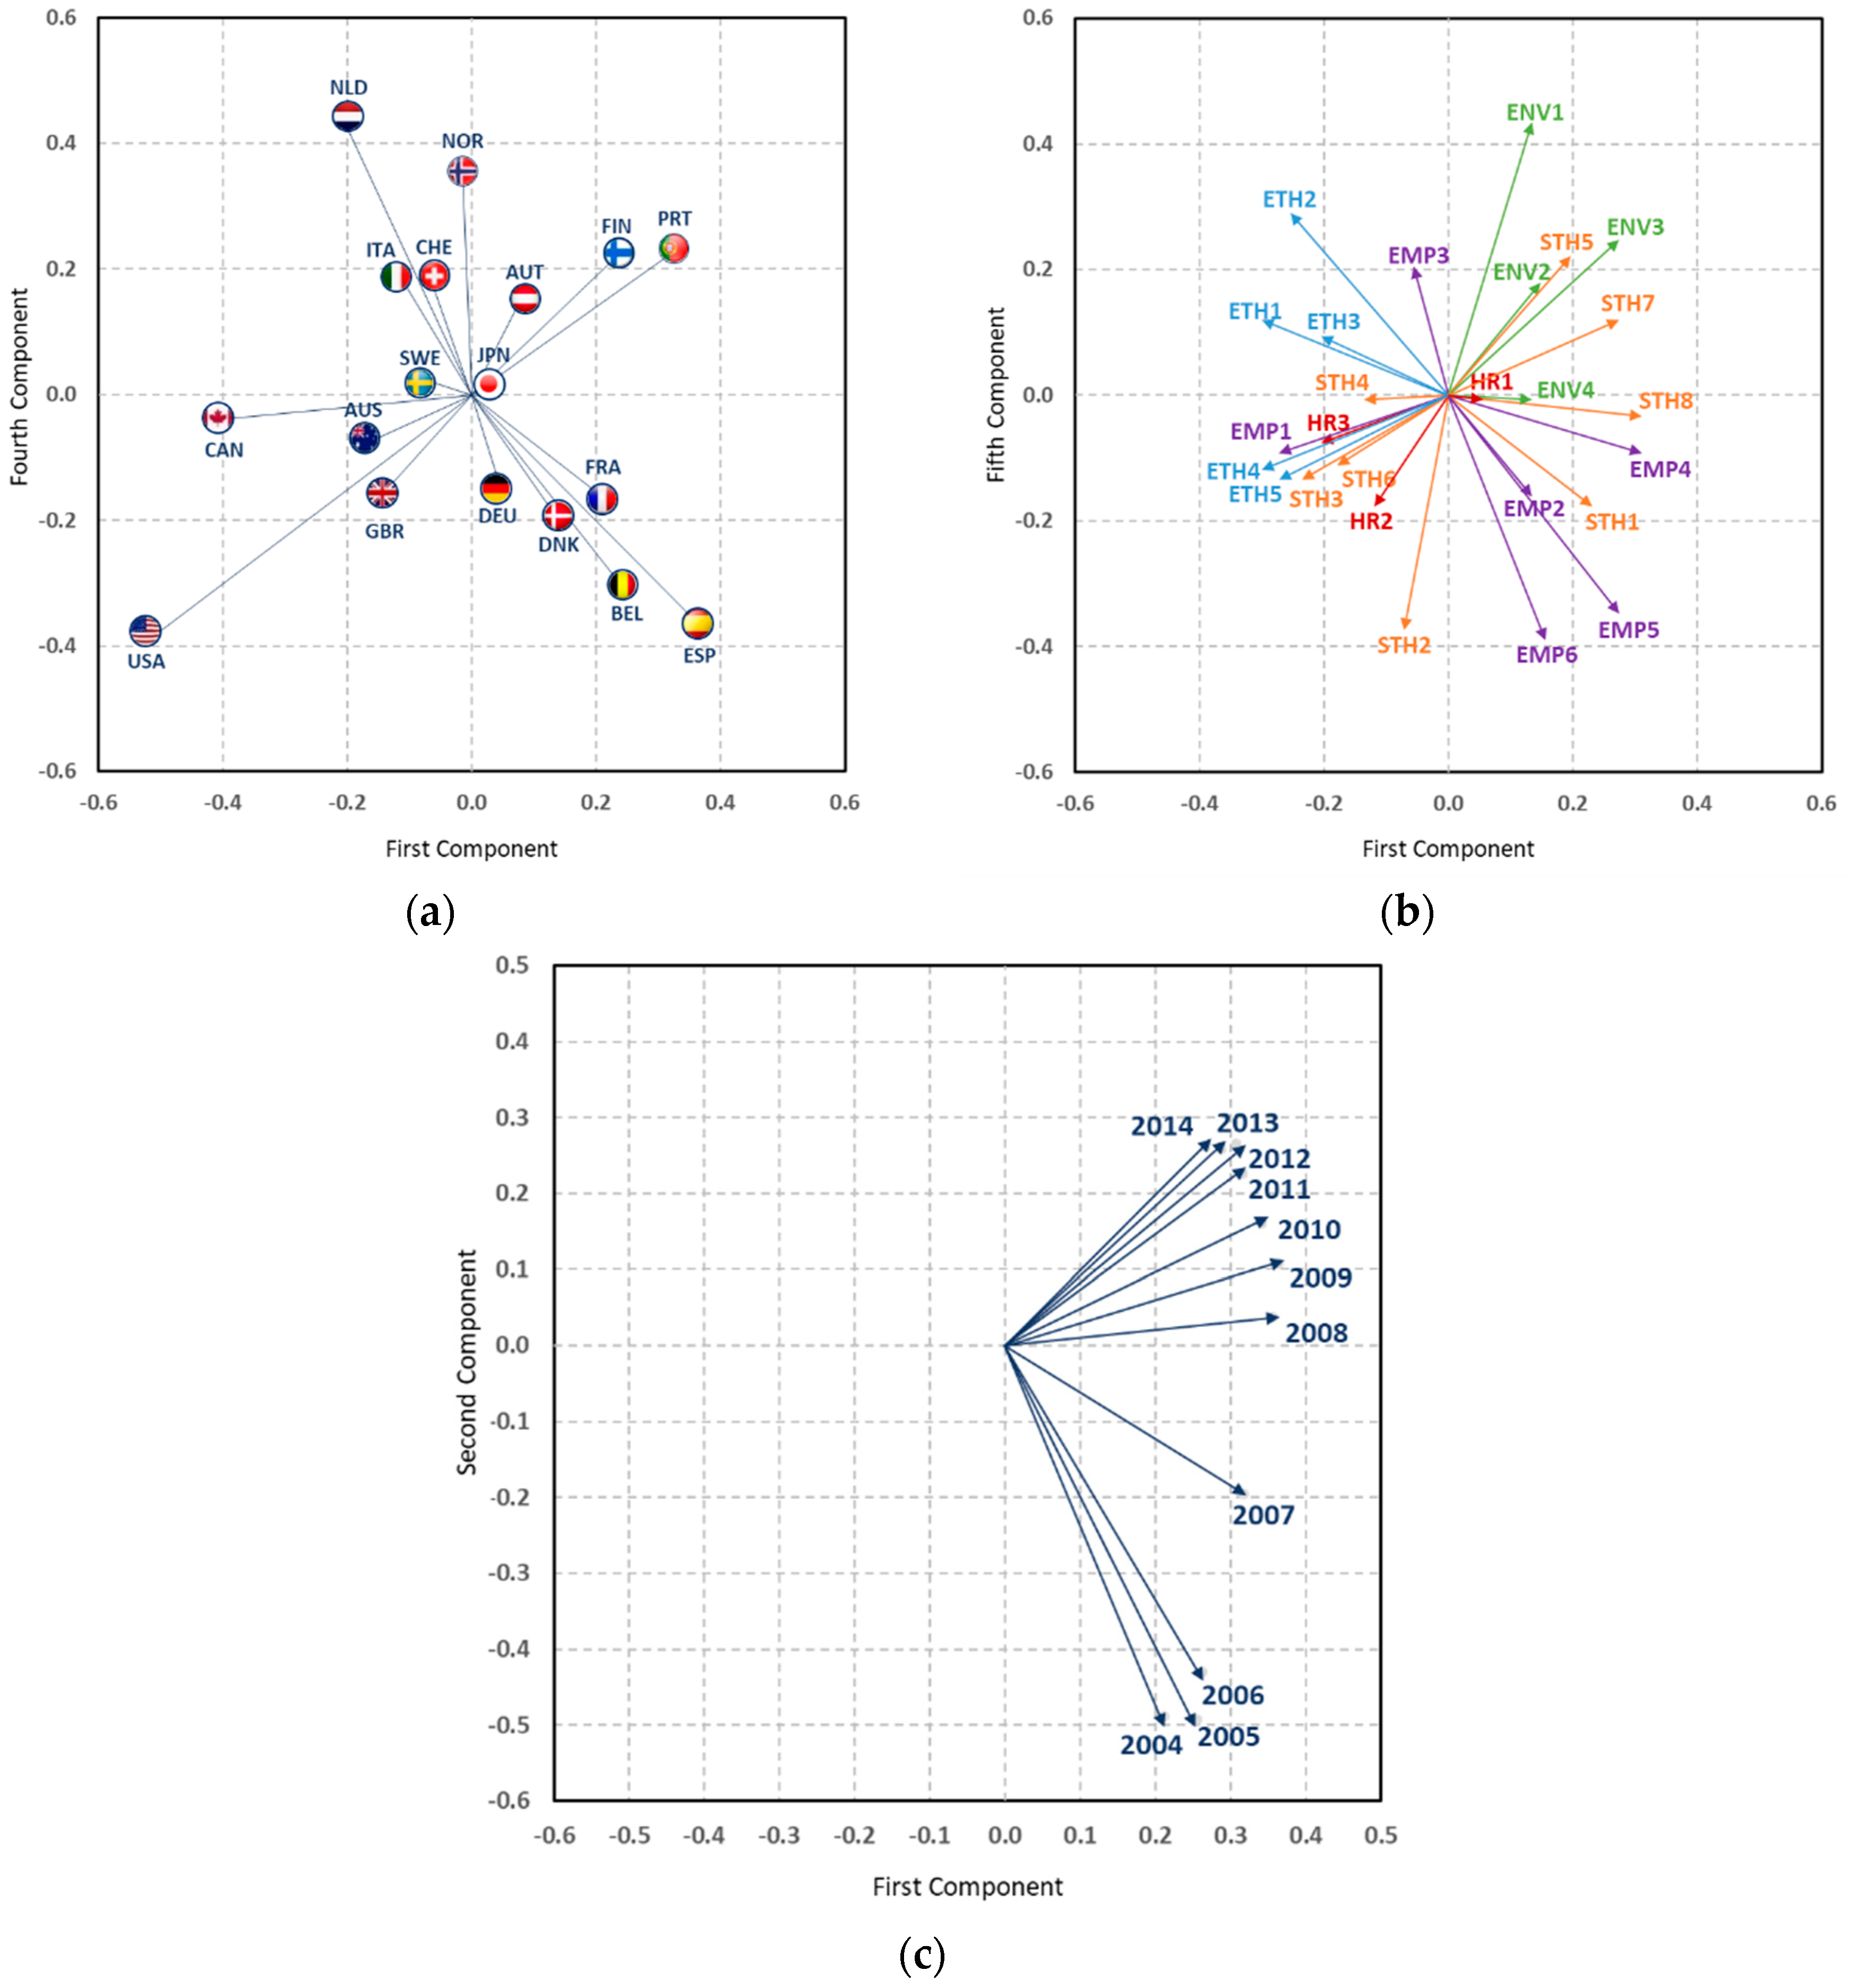
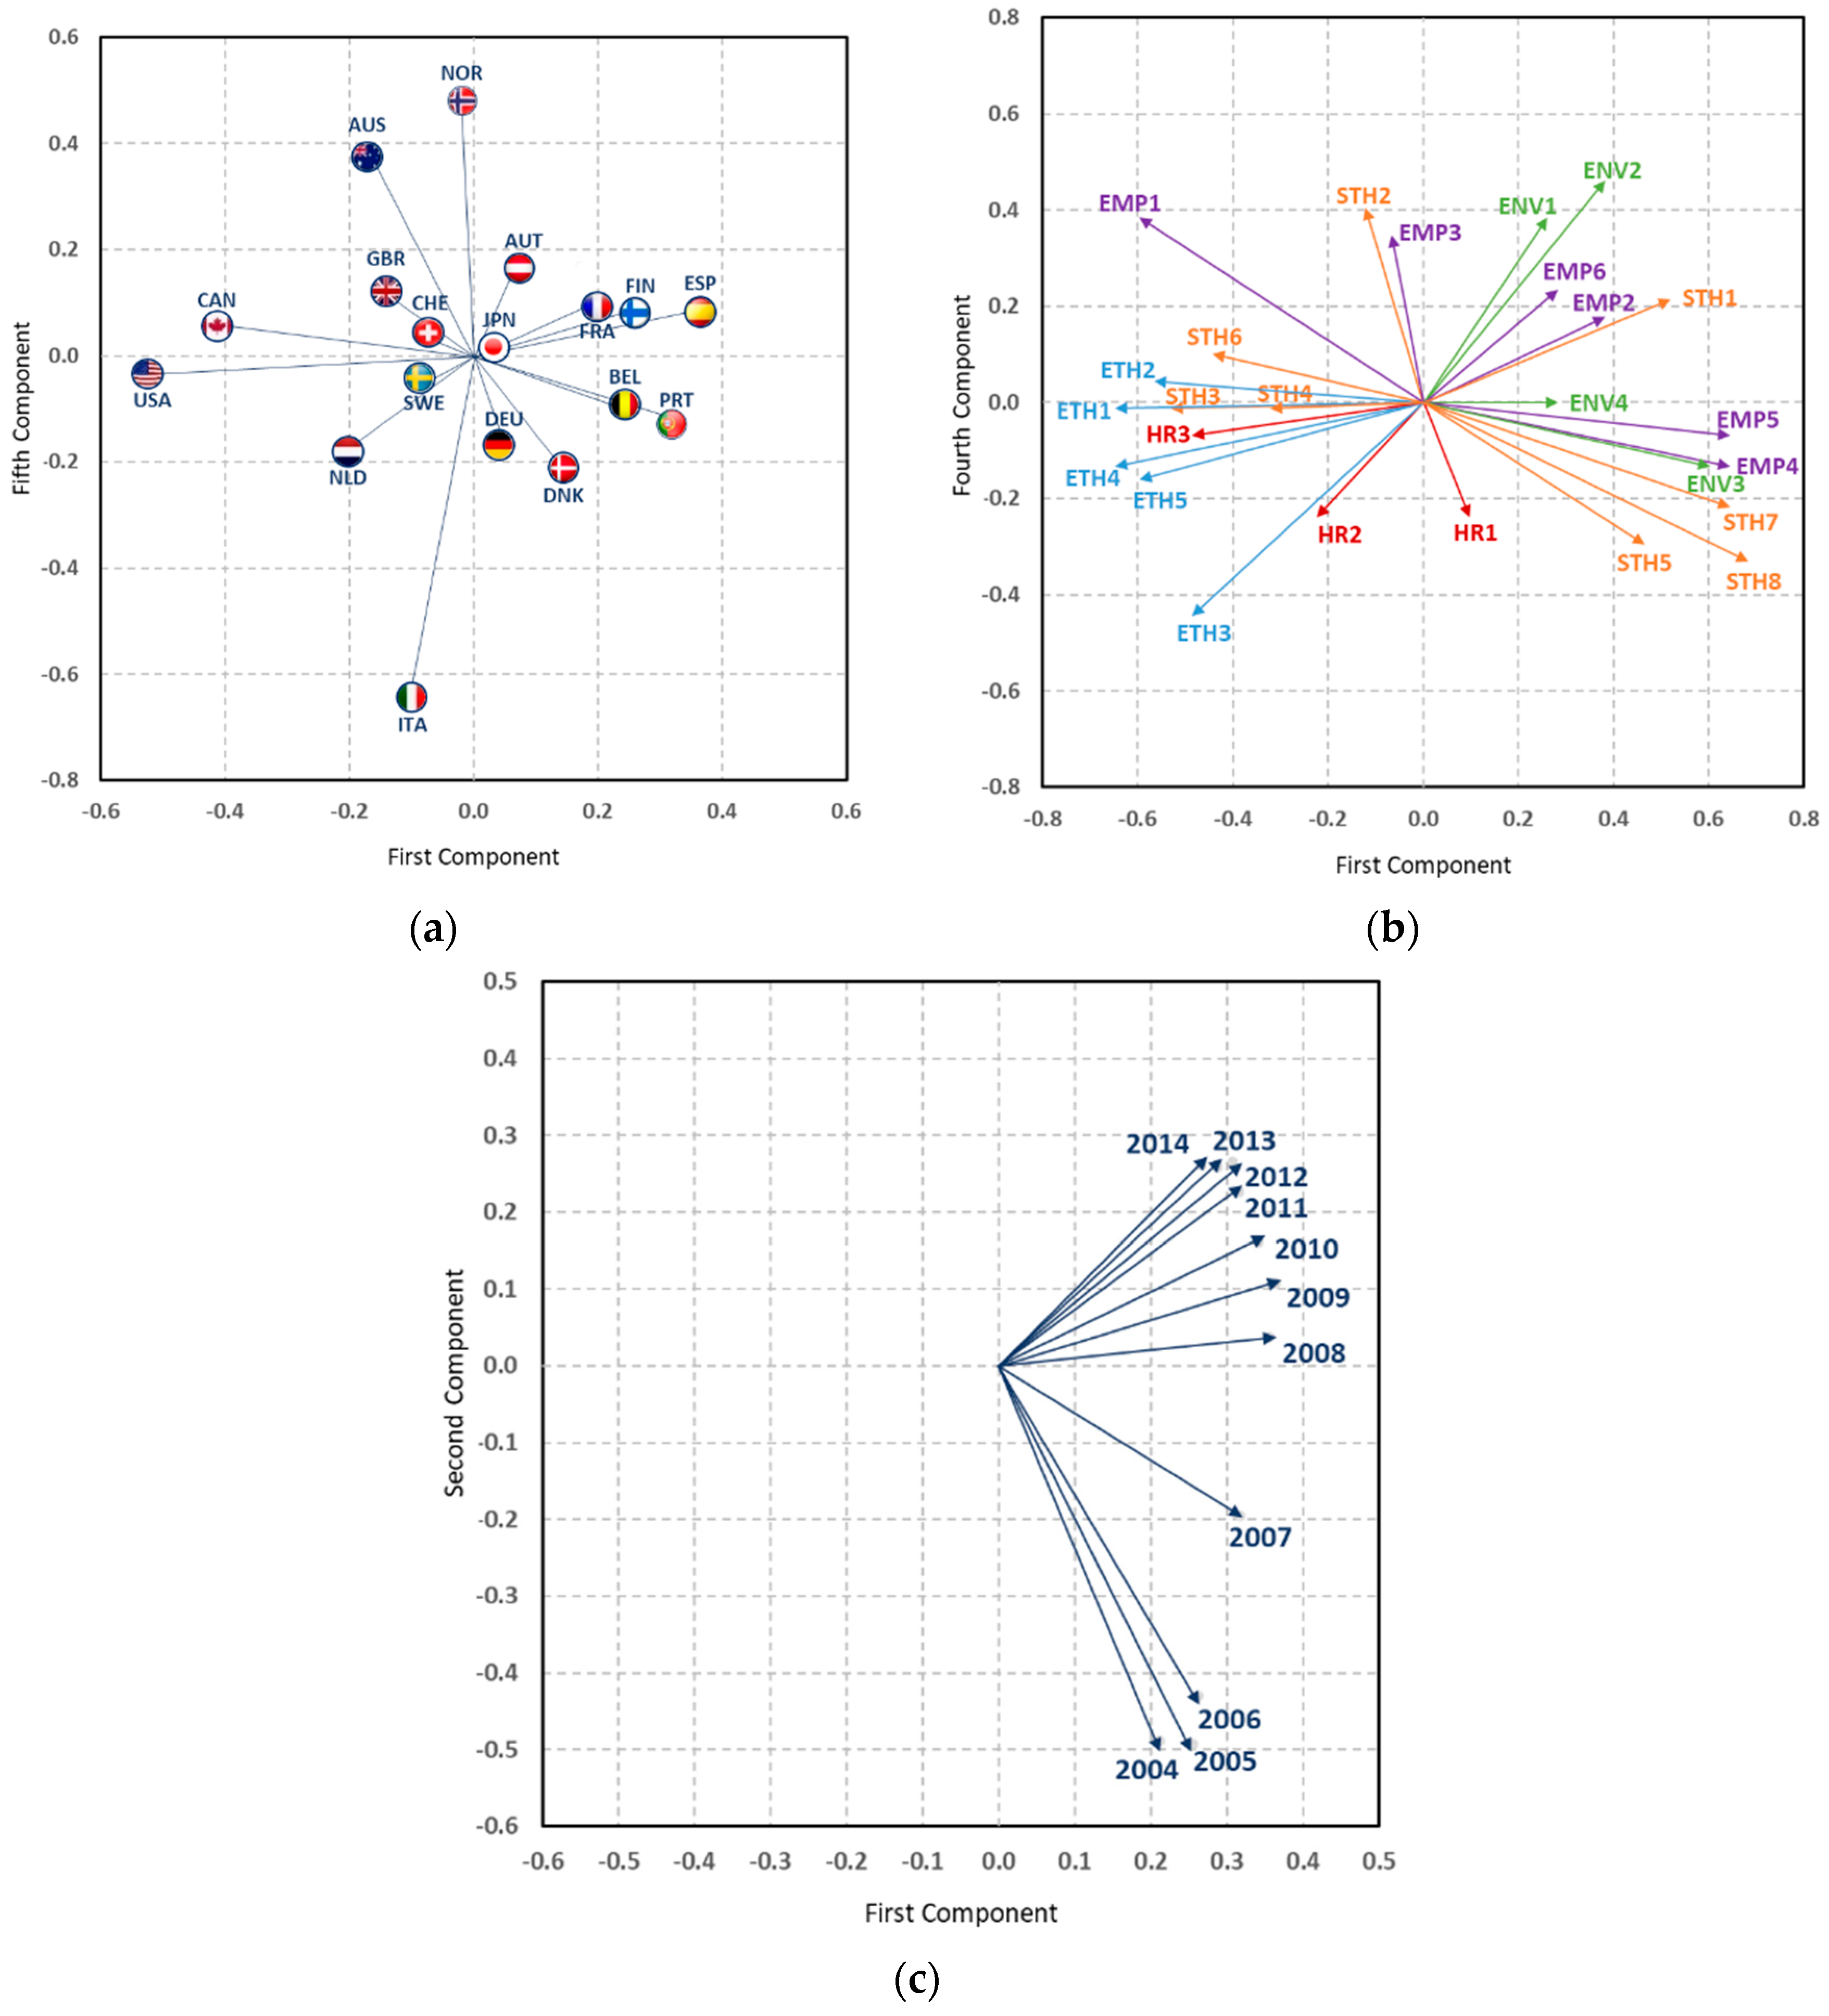
4.2. Characterisation of the Relevance of CSR Practices According to the Country of Origin
5. Discussion
6. Conclusions
- ○
- The corporations coming from the Nordic countries, highlighting Finland and Norway, are considered the foremost in sustainability terms, presenting the highest levels of human rights practices (policy, system, and report), the fight to counter bribery (policy, system, and report), strong environmental practices, and a strong commitment to the community. Firms based in Switzerland and the Netherlands present characteristics close to these countries, highlighting the latter in human rights and ethics.
- ○
- Companies whose country of origin is located in Southern Europe—Portugal, Spain, and France—prioritise their practices in environmental matters, systems that promote equal opportunities, the participation and training of their employees, as well as good relations with clients and suppliers and the systems towards the interest groups and their participation.
- ○
- Other organisations based in Italy—a country that is not very prominent in the study—emphasise their practices in human rights policies and systems, the greater participation of their interest groups, and reports on them, as well as policies to counteract bribery.
- ○
- Firms whose country of origin is Japan only focus on environmental concerns, leaving aside other practices. Companies based in Austria present low values in the study, giving preference to their performance and environmental reports, the participation of their employees, and the responsibility of their stakeholders in decision-making processes, systems, and reports in the fight to counteract the bribe.
- ○
- Companies whose headquarters are centralised in North America countries, such as the United States and Canada, are in an inferior position to other countries in relation to their environmental practices, employees, or stakeholders; however, they improve their levels in those practices aimed at ethical issues and of human rights, with low but similar results to those found for companies of other countries, as well as policies in favour of equal opportunities and policies towards their interest groups, or the importance of these as members of the council and relations with the community.
Author Contributions
Funding
Conflicts of Interest
References
- Aaronson, Susan Ariel. 2003. Corporate Responsibility in the Global Village: The British Role Model and the American Laggard. Business and Society Review 108: 309–38. [Google Scholar] [CrossRef]
- Amor-Esteban, Víctor, Isabel-María García-Sánchez, and Ma-Purificación Galindo-Villardón. 2017. Analysing the Effect of Legal System on Corporate Social Responsibility (CSR) at the Country Level, from a Multivariate Perspective. Social Indicators Research n.d. , 1–18. [Google Scholar]
- Ariztía, Tomas, Dorothea Kleine, S. L. Maria das Graças, Nurjk Agloni, Rita Afonso, and Roberto Bartholo. 2014. Ethical Consumption in Brazil and Chile: Institutional Contexts and Development Trajectories. Journal of Cleaner Production 63: 84–92. [Google Scholar] [CrossRef]
- Barbieri, P., C. A. Andersson, D. L. Massart, S. Predonzani, G. Adami, and E. Reisenhofer. 1999. Modeling Bio-Geochemical Interactions in the Surface Waters of the Gulf of Trieste by Three-Way Principal Component Analysis (PCA). Analytica Chimica Acta 398: 227–35. [Google Scholar] [CrossRef]
- Baskin, Jeremy. 2006. Corporate Responsibility in Emerging Markets. Journal of Corporate Citizenship 24: 29–47. [Google Scholar] [CrossRef]
- Belu, Constantin. 2009. Ranking Corporations Based on Sustainable and Socially Responsible Practices. A Data Envelopment Analysis (DEA) Approach. Sustainable Development 17: 257–68. [Google Scholar] [CrossRef]
- Boudt, Kris, Jonathan Cornelissen, and Christophe Croux. 2013. The Impact of a Sustainability Constraint on the Mean-Tracking Error Efficient Frontier. Economics Letters 119: 255–60. [Google Scholar] [CrossRef]
- Bustamante, Silke. 2011. Localization vs. Standardization: Global Approaches to CSR Management in Mulitinational Companies. Institute of Management. Available online: http://institut-ina.de/wp-content/uploads/2015/05/2011_03_CSR-multinational-companies.pdf (accessed on 18 April 2018).
- Campbell, John L. 2006. Institutional Analysis and the Paradox of Corporate Social Responsibility. American Behavioral Scientist 49: 925–38. [Google Scholar] [CrossRef]
- Campbell, John L. 2007. Why Would Corporations Behave in Socially Responsible Ways? An Institutional Theory of Corporate Social Responsibility. Academy of Management Review 32: 946–67. [Google Scholar] [CrossRef]
- Carroll, Archie B. 1999. Corporate Social Responsibility Evolution of a Definitional Construct. Business & Society 38: 268–95. [Google Scholar]
- Carroll, Archie B. 1991. The Pyramid of Corporate Social Responsibility: Toward the Moral Management of Organizational Stakeholders. Business Horizons 34: 39–48. [Google Scholar] [CrossRef]
- Casey, Ryan J., and Jonathan H. Grenier. 2014. Understanding and Contributing to the Enigma of Corporate Social Responsibility (CSR) Assurance in the United States. Auditing: A Journal of Practice & Theory 34: 97–130. [Google Scholar]
- Davis, Keith. 1973. The Case for and against Business Assumption of Social Responsibilities. Academy of Management Journal 16: 312–22. [Google Scholar]
- DiMaggio, Paul, and Walter W. Powell. 1983. The Iron Cage Revisited: Collective Rationality and Institutional Isomorphism in Organizational Fields. American Sociological Review 48: 147–60. [Google Scholar] [CrossRef]
- Dolédec, Sylvain, and Daniel Chessel. 1994. Co-Inertia Analysis: An Alternative Method for Studying Species-Environment Relationships. Freshwater Biology 31: 277–94. [Google Scholar] [CrossRef]
- Dypdahl, Kristin. 2015. CSR and the Country of Origin Effect in Multinational Corporations—An Comparativ and Contextual Analysis of Brazilian and Norwegian MNCs in the Oil and Gas Industries. Master’s thesis, Utrecht University, Utrecht, The Netherlands. [Google Scholar]
- Ekelenburg, Matthijs van. 2016. Determinants of Voluntary External Assurance on Corporate Sustainability Reports: A Comparison between Europe and North America. Available online: http://theses.ubn.ru.nl/handle/123456789/1684 (accessed on 20 April 2018).
- Escoufier, Yves. 1976. Opérateur Associé à Un Tableau de Données. In Annales de l’INSEE. París: ADRES, pp. 165–79. Available online: http://www.jstor.org/stable/20075217 (accessed on 17 April 2018).
- Esteban, Victor Amor, Ma Purificacion Galindo Villardon, and Isabel Maria Garcia Sanchez. 2017. Cultural Values on CSR Patterns and Evolution: A Study from the Biplot Representation. Ecological Indicators 81: 18–29. [Google Scholar] [CrossRef]
- Filatotchev, Igor, and Günter K. Stahl. 2015. Towards Transnational CSR. Corporate Social Responsibility Approaches and Governance Solutions for Multinational Corporations. Organizational Dynamics 44: 121–29. [Google Scholar] [CrossRef]
- Florini, Ann, and Saleena Saleem. 2011. Information Disclosure in Global Energy Governance. Global Policy 2: 144–54. [Google Scholar] [CrossRef]
- García-Sánchez, Isabel-Maria, Beatriz Cuadrado-Ballesteros, and Jose-Valeriano Frias-Aceituno. 2016. Impact of the Institutional Macro Context on the Voluntary Disclosure of CSR Information. Long Range Planning 49: 15–35. [Google Scholar] [CrossRef]
- García-Sánchez, Isabel-María, and Emma García-Meca. 2017. CSR Engagement and Earnings Quality in Banks. The Moderating Role of Institutional Factors. Corporate Social Responsibility and Environmental Management 24: 145–58. [Google Scholar] [CrossRef]
- García-Sánchez, Isabel-María, Lázaro Rodríguez-Ariza, and José-Valeriano Frías-Aceituno. 2013. The Cultural System and Integrated Reporting. International Business Review 22: 828–38. [Google Scholar] [CrossRef]
- Gjølberg, Maria. 2009. Measuring the Immeasurable? Scandinavian Journal of Management 25: 10–22. [Google Scholar] [CrossRef]
- Gjølberg, Maria. 2012. The Political Economy of Corporate Social Responsibility (CSR). Ph.D. dissertation, University of Oslo, Oslo, Norway. [Google Scholar]
- Grauel, Jonas, and Daniel Gotthardt. 2016. The Relevance of National Contexts for Carbon Disclosure Decisions of Stock-Listed Companies: A Multilevel Analysis. Journal of Cleaner Production 133: 1204–17. [Google Scholar] [CrossRef]
- Habisch, André, Jan Jonker, Martina Wegner, and René Schmidpeter. 2005. Corporate Social Responsibility across Europe. Berlin: Springer. Available online: https://books.google.nl/books?hl=es&lr=&id=4tu5VKLfy2UC&oi=fnd&pg=PA1&dq=Habisch,+A.,+Jonker,+J.,+%26+Wegner,+M.+(2005).+Corporate+social+responsibility+across+Europe.+Berlin:+Springer.&ots=hCT_ZjTDHZ&sig=GRtqhd9oGcQpZ6tdl1gHGSA_Nhk (accessed on 18 April 2018).
- Halkos, George, and Antonis Skouloudis. 2016. National CSR and Institutional Conditions: An Exploratory Study. Journal of Cleaner Production 139: 1150–56. [Google Scholar] [CrossRef]
- Ioannou, Ioannis, and George Serafeim. 2012. What Drives Corporate Social Performance? The Role of Nation-Level Institutions. Journal of International Business Studies 43: 834–64. [Google Scholar] [CrossRef]
- Jackson, Gregory, and Androniki Apostolakou. 2010. Corporate Social Responsibility in Western Europe: An Institutional Mirror or Substitute? Journal of Business Ethics 94: 371–94. [Google Scholar] [CrossRef]
- Jaffrenou, Pierre-Alain. 1978. Sur l’analyse Des Familles Finies de Variables Vectorielles: Bases Algébriques et Application à La Description Statistique. Ph.D. Thèse, Université de Lyon, Lyon, France. [Google Scholar]
- Jamali, Dima, Yusuf Sidani, and Khalil El-Asmar. 2009. A Three Country Comparative Analysis of Managerial CSR Perspectives: Insights from Lebanon, Syria and Jordan. Journal of Business Ethics 85: 173–92. [Google Scholar] [CrossRef]
- Kiers, Henk A. L., and Albert Kinderen. 2003. A Fast Method for Choosing the Numbers of Components in Tucker3 Analysis. British Journal of Mathematical and Statistical Psychology 56: 119–25. [Google Scholar] [CrossRef] [PubMed]
- Kolk, Ans, and Paolo Perego. 2010. Determinants of the Adoption of Sustainability Assurance Statements: An International Investigation. Business Strategy and the Environment 19: 182–98. [Google Scholar] [CrossRef]
- Kroonenberg, Pieter M. 2008. Applied Multiway Data Analysis. Hoboken: John Wiley & Sons, vol. 702. [Google Scholar]
- Lenssen, Gilbert, Wojciech Gasdparski, Boleslaw Rok, Peter Lacy, Atle Midttun, Kristian Gautesen, and Maria Gjølberg. 2006. The Political Economy of CSR in Western Europe. Corporate Governance: The International Journal of Business in Society 6: 369–85. [Google Scholar]
- León, Juan Ángel Poyatos. 2015. Análisis de la Relación Causal de la Responsabilidad Social Corporativa y la Performance Financiera de las Empresas. Ph.D. dissertation, Universitat Politècnica de València, València, Spain, March 31. [Google Scholar] [CrossRef]
- L’Hermier des Plantes, H. 1976. Structuration Des Tableauya Trois Indices de La Statistique. Thése de 3eme Cycle. Montpellier: Université Montpellier II. [Google Scholar]
- Maignan, Isabelle, and David A. Ralston. 2002. Corporate Social Responsibility in Europe and the US: Insights from Businesses’ Self-Presentations. Journal of International Business Studies 33: 497–514. [Google Scholar] [CrossRef]
- Martínez-Ferrero, Jennifer, and Isabel-María García-Sánchez. 2016. Coercive, Normative and Mimetic Isomorphism as Determinants of the Voluntary Assurance of Sustainability Reports. International Business Review 26: 102–18. [Google Scholar] [CrossRef]
- Matten, Dirk, and Jeremy Moon. 2008. ‘Implicit’ and ‘Explicit’ CSR: A Conceptual Framework for a Comparative Understanding of Corporate Social Responsibility. Academy of Management Review 33: 404–24. [Google Scholar] [CrossRef]
- Matten, Dirk, and Jeremy Moon. 2004. Implicit and Explicit CSR. A Conceptual Framework to Understand CSR in Europe. ICCSR Research Paper Series 29: 1–27. [Google Scholar]
- Noorderhaven, Niels G., and Anne-Wil Harzing. 2003. The ‘Country-of-Origin Effect’ in Multinational Corporations: Sources, Mechanisms and Moderating Conditions. In Management and International Review. Berlin: Springer, pp. 47–66. [Google Scholar]
- Oliver, Christine. 1991. Strategic Responses to Institutional Processes. Academy of Management Review 16: 145–79. [Google Scholar] [CrossRef]
- Ortas, Eduardo, Igor Álvarez, Jacques Jaussaud, and Ainhoa Garayar. 2015. The Impact of Institutional and Social Context on Corporate Environmental, Social and Governance Performance of Companies Committed to Voluntary Corporate Social Responsibility Initiatives. Journal of Cleaner Production 108: 673–84. [Google Scholar] [CrossRef]
- Pauly, Louis W., and Simon Reich. 1997. National Structures and Multinational Corporate Behavior: Enduring Differences in the Age of Globalization. International Organization 51: 1–30. [Google Scholar] [CrossRef]
- Purdy, Jill M., Elizabeth A. Alexander, and Stern Neill. 2010. The Impact of National Institutional Context on Social Practices: Comparing Finnish and US Business Communities. European Journal of International Management 4: 234–56. [Google Scholar] [CrossRef]
- Ringov, Dimo, and Maurizio Zollo. 2007. The Impact of National Culture on Corporate Social Performance. Edited by Gilbert Lenssen. Corporate Governance: The International Journal of Business in Society 7: 476–85. [Google Scholar] [CrossRef]
- Scholtens, Bert. 2011. Corporate Social Responsibility in the International Insurance Industry. Sustainable Development 19: 143–56. [Google Scholar] [CrossRef]
- Scott, W. Richard. 1995. Institutions and Organizations. Foundations for Organizational Science. London: SAGE Publication. [Google Scholar]
- Semenova, Natalia, and Lars G. Hassel. 2008. Financial Outcomes of Environmental Risk and Opportunity for US Companies. Sustainable Development 16: 195–212. [Google Scholar] [CrossRef]
- Simier, Monique, L. Blanc, Frédéric Pellegrin, and Daniel Nandris. 1999. Approche Simultanée de $ K $ Couples de Tableaux: Application à l’étude Des Relations Pathologie Végétale-Environnement. Revue de Statistique Appliquée 47: 31–46. [Google Scholar]
- Tang, Lu, and Hongmei Li. 2009. Corporate Social Responsibility Communication of Chinese and Global Corporations in China. Public Relations Review 35: 199–212. [Google Scholar] [CrossRef]
- Thioulouse, Jean, Monique Simier, and Daniel Chessel. 2004. Simultaneous Analysis of a Sequence of Paired Ecological Tables. Ecology 85: 272–83. [Google Scholar] [CrossRef]
- Tucker, Ledyard R. 1966. Some Mathematical Notes on Three-Mode Factor Analysis. Psychometrika 31: 279–311. [Google Scholar] [CrossRef] [PubMed]
- Weber, Jessica Lee. 2014. Corporate Social Responsibility Disclosure Level, External Assurance and Cost of Equity Capital. University of Colorado at Boulder. Available online: http://gradworks.umi.com/36/35/3635946.html (accessed on 20 April 2018).
- Welford, Richard. 2004. Corporate Social Responsibility in Europe and Asia: Critical Elements and Best Practice. The Journal of Corporate Citizenship 13: 31–47. [Google Scholar] [CrossRef]
- Welford, Richard. 2005. Corporate Social Responsibility in Europe, North America and Asia: 2004 Survey Results. The Journal of Corporate Citizenship 17: 33–52. [Google Scholar] [CrossRef]
- Whetten, David A., Gordon Rands, and Paul Godfrey. 2002. What Are the Responsibilities of Business to Society. In Handbook of Strategy and Management. London: SAGE, pp. 373–408. [Google Scholar]
- Whitley, Richard. 1992. European Business Systems: Firms and Markets in Their National Contexts. Newcastle upon Tyne: SAGE. [Google Scholar]
- Witt, Michael A., and Gordon Redding. 2011. The Spirits of Corporate Social Responsibility: Senior Executive Perceptions of the Role of the Firm in Society in Germany, Hong Kong, Japan, South Korea and the USA. Socio-Economic Review 10: 109–34. [Google Scholar] [CrossRef]


| Countries | Observations | % | Countries | Observations | % | ||
|---|---|---|---|---|---|---|---|
| 1 | Australia | 462 | 7.0 | 2 | Austria | 44 | 0.7 |
| 3 | Belgium | 77 | 1.2 | 4 | Canada | 440 | 6.7 |
| 5 | Denmark | 121 | 1.8 | 6 | Finland | 110 | 1.7 |
| 7 | France | 429 | 6.5 | 8 | Germany | 407 | 6.2 |
| 9 | Italy | 143 | 2.2 | 10 | Japan | 1100 | 16.6 |
| 11 | Netherlands | 165 | 2.5 | 12 | Norway | 66 | 1.0 |
| 13 | Portugal | 44 | 0.7 | 14 | Spain | 165 | 2.5 |
| 15 | Sweden | 275 | 4.2 | 16 | Switzerland | 220 | 3.3 |
| 17 | United Kingdom | 1067 | 16.1 | 18 | United States | 1265 | 19.1 |
| Total | 6600 | 100.0 |
| Environmental Dimension | ||
| Environment | ||
| ENV1 | Environmental policy | How does EIRIS rate the company’s environmental policy and commitment? |
| ENV2 | Environmental systems | How does EIRIS rate the company’s environmental management system? |
| ENV3 | Environmental reporting | How does EIRIS rate the company’s environmental reporting? |
| ENV4 | Environmental performance | What level of improvements in environmental impact can the company demonstrate? |
| Social dimension | ||
| Human Rights | ||
| HR1 | Human rights policy | What is the extent of policy addressing human rights issues? |
| HR2 | Human rights systems | What is the extent of systems addressing human rights issues? |
| HR3 | Human rights reporting | Does the company report on human rights issues? |
| Employees | ||
| EMP1 | Equal opportunities (policy) | How good is the company’s policy on equal opportunity and diversity issues? |
| EMP2 | Equal opportunities (systems) | How clear is the evidence of systems and practices to support equal opportunities and diversity? |
| EMP3 | Health and safety systems | How clear is the evidence of health and safety systems? |
| EMP4 | Trade unions and employee participation | How clear is the evidence of systems that manage employee relations? |
| EMP5 | Training | How clear is the evidence of systems that support employee training and development? |
| EMP6 | Job creation and security | How clear is the evidence of systems and practices that advance job creation and security? |
| Stakeholders | ||
| STH1 | Community relations | How clear is the company’s commitment to community or charitable work? |
| STH2 | Customer/supplier relations policy | Does the Ccmpany have policies on maintaining good relations with customers and/or suppliers? |
| STH3 | Community involvement | How clear is the evidence of systems that maintain good relations with the community? |
| STH4 | Responsibility for stakeholders | How many stakeholder issues have been allocated to board members? |
| STH5 | Stakeholder engagement | What level of engagement with stakeholders is disclosed by the company? |
| STH6 | Stakeholder policy | How good are the company’s policies towards its stakeholders overall? |
| STH7 | Stakeholder systems | How good is the company’s quantitative systems on stakeholder relationships? |
| STH8 | Stakeholder reporting | How good are the company’s management reporting for stakeholders overall? |
| Ethics and Governance | ||
| ETH1 | Codes of ethics | Does the company have a code of ethics and, if so, how comprehensive is it? |
| ETH2 | Codes of ethics systems | Does the company have a system for implementing a code of ethics and, if so, how comprehensive is it? |
| ETH3 | Countering bribery policy | What is the extent of the company’s policy for countering bribery? |
| ETH4 | Countering bribery systems | What is the extent of the company’s system for countering bribery? |
| ETH5 | Countering bribery reporting | What is the extent of the company’s reporting on countering bribery? |
| ETH6 | Board practice | How many of the core elements of corporate governance does the company have? |
| ETH7 | ESG risk management | How well do the board and senior management address company-wide ESG (Environmental, Social, and Governance) risks and opportunities? |
| Summary of All Permissible Analyses with Components Less Than 5 × 5 × 5. Overall Fitted and Residual Sum of Squares (SS) | |||||||||
|---|---|---|---|---|---|---|---|---|---|
| Model Size | Sum of Components (S) | Best given S | Difference in Prop. Fit | SS(Res) | Proportional SS (Fit) | Proportional SS (Res) | Number of Iterations | ||
| 1 | 1 × 1 × 1 | 3 | * | 0.236 | 19.85989 | 0.2362 | 0.7638 | 19 | |
| 2 | 1 × 2 × 2 | 5 | 19.46644 | 0.2513 | 0.7487 | 24 | |||
| 3 | 1 × 3 × 3 | 7 | 19.36555 | 0.2552 | 0.7448 | 31 | |||
| 4 | 1 × 4 × 4 | 9 | 19.30520 | 0.2575 | 0.7425 | 30 | |||
| 5 | 1 × 5 × 5 | 11 | 19.26906 | 0.2589 | 0.7411 | 38 | |||
| 6 | 2 × 1 × 2 | 5 | 19.54406 | 0.2483 | 0.7517 | 24 | |||
| 7 | 2 × 2 × 1 | 5 | * | 0.107 | 17.07668 | 0.3432 | 0.6568 | 50 | M |
| 8 | 2 × 2 × 2 | 6 | * | 0.011 | 16.80365 | 0.3537 | 0.6463 | 50 | M |
| 9 | 2 × 2 × 3 | 7 | 16.78106 | 0.3546 | 0.6454 | 50 | M | ||
| 10 | 2 × 2 × 4 | 8 | 16.77541 | 0.3548 | 0.6452 | 50 | M | ||
| 11 | 2 × 3 × 2 | 7 | 16.17405 | 0.3779 | 0.6221 | 50 | M | ||
| 12 | 2 × 3 × 3 | 8 | 16.13195 | 0.3795 | 0.6205 | 50 | M | ||
| 13 | 2 × 3 × 4 | 9 | 16.10693 | 0.3805 | 0.6195 | 50 | M | ||
| 14 | 2 × 3 × 5 | 10 | 16.10082 | 0.3807 | 0.6193 | 50 | M | ||
| 15 | 2 × 4 × 2 | 8 | 15.92783 | 0.3874 | 0.6126 | 50 | M | ||
| 16 | 2 × 4 × 3 | 9 | 15.83500 | 0.3910 | 0.6090 | 50 | M | ||
| 17 | 2 × 4 × 4 | 10 | 15.79969 | 0.3923 | 0.6077 | 50 | M | ||
| 18 | 2 × 4 × 5 | 11 | 15.78850 | 0.3928 | 0.6072 | 50 | M | ||
| 19 | 2 × 5 × 3 | 10 | 15.67887 | 0.3970 | 0.6030 | 50 | M | ||
| 20 | 2 × 5 × 4 | 11 | 15.61218 | 0.3995 | 0.6005 | 50 | M | ||
| 21 | 2 × 5 × 5 | 12 | 15.58446 | 0.4006 | 0.5994 | 50 | M | ||
| 22 | 3 × 1 × 3 | 7 | 19.47851 | 0.2508 | 0.7492 | 50 | M | ||
| 23 | 3 × 2 × 2 | 7 | 16.31406 | 0.3725 | 0.6275 | 33 | |||
| 24 | 3 × 2 × 3 | 8 | 16.24297 | 0.3753 | 0.6247 | 27 | |||
| 25 | 3 × 2 × 4 | 9 | 16.22352 | 0.3760 | 0.6240 | 50 | M | ||
| 26 | 3 × 2 × 5 | 10 | 16.20727 | 0.3766 | 0.6234 | 50 | M | ||
| 27 | 3 × 3 × 1 | 7 | * | 0.071 | 14.96000 | 0.4246 | 0.5754 | 50 | M |
| 28 | 3 × 3 × 2 | 8 | * | 0.021 | 14.42526 | 0.4452 | 0.5548 | 50 | M |
| 29 | 3 × 3 × 3 | 9 | 14.35978 | 0.4477 | 0.5523 | 50 | M | ||
| 30 | 3 × 3 × 4 | 10 | 14.33347 | 0.4487 | 0.5513 | 50 | M | ||
| 31 | 3 × 3 × 5 | 11 | 14.31549 | 0.4494 | 0.5506 | 50 | M | ||
| 32 | 3 × 4 × 2 | 9 | 13.73359 | 0.4718 | 0.5282 | 50 | M | ||
| 33 | 3 × 4 × 3 | 10 | 13.64108 | 0.4753 | 0.5247 | 50 | M | ||
| 34 | 3 × 4 × 4 | 11 | 13.60055 | 0.4769 | 0.5231 | 50 | M | ||
| 35 | 3 × 4 × 5 | 12 | 13.57635 | 0.4778 | 0.5222 | 50 | M | ||
| 36 | 3 × 5 × 2 | 10 | 13.11528 | 0.4956 | 0.5044 | 50 | M | ||
| 37 | 3 × 5 × 3 | 11 | 13.01122 | 0.4996 | 0.5004 | 50 | M | ||
| 38 | 3 × 5 × 4 | 12 | 12.95215 | 0.5018 | 0.4982 | 50 | M | ||
| 39 | 3 × 5 × 5 | 13 | 12.91216 | 0.5034 | 0.4966 | 50 | M | ||
| 40 | 4 × 1 × 4 | 9 | 19.42840 | 0.2528 | 0.7472 | 50 | M | ||
| 41 | 4 × 2 × 2 | 8 | 16.07294 | 0.3818 | 0.6182 | 34 | |||
| 42 | 4 × 2 × 3 | 9 | 15.99050 | 0.3850 | 0.6150 | 35 | |||
| 43 | 4 × 2 × 4 | 10 | 15.96533 | 0.3859 | 0.6141 | 50 | M | ||
| 44 | 4 × 2 × 5 | 11 | 15.94740 | 0.3866 | 0.6134 | 50 | M | ||
| 45 | 4 × 3 × 2 | 9 | 13.92007 | 0.4646 | 0.5354 | 50 | M | ||
| 46 | 4 × 3 × 3 | 10 | 13.81635 | 0.4686 | 0.5314 | 50 | M | ||
| 47 | 4 × 3 × 4 | 11 | 13.77297 | 0.4703 | 0.5297 | 50 | M | ||
| 48 | 4 × 3 × 5 | 12 | 13.75182 | 0.4711 | 0.5289 | 50 | M | ||
| 49 | 4 × 4 × 1 | 9 | * | 0.032 | 13.58059 | 0.4777 | 0.5223 | 50 | M |
| 50 | 4 × 4 × 2 | 10 | * | 0.039 | 12.55889 | 0.5170 | 0.4830 | 50 | M |
| 51 | 4 × 4 × 3 | 11 | 12.44025 | 0.5215 | 0.4785 | 50 | M | ||
| 52 | 4 × 4 × 4 | 12 | 12.35933 | 0.5246 | 0.4754 | 50 | M | ||
| 53 | 4 × 4 × 5 | 13 | 12.33007 | 0.5258 | 0.4742 | 50 | M | ||
| 54 | 4 × 5 × 2 | 11 | * | 0.030 | 11.76955 | 0.5473 | 0.4527 | 50 | M |
| 55 | 4 × 5 × 3 | 12 | 11.62559 | 0.5529 | 0.4471 | 50 | M | ||
| 56 | 4 × 5 × 4 | 13 | 11.53261 | 0.5564 | 0.4436 | 50 | M | ||
| 57 | 4 × 5 × 5 | 14 | 11.48448 | 0.5583 | 0.4417 | 50 | M | ||
| 58 | 5 × 1 × 5 | 11 | 19.40379 | 0.2537 | 0.7463 | 50 | M | ||
| 59 | 5 × 2 × 3 | 10 | 15.88905 | 0.3889 | 0.6111 | 32 | |||
| 60 | 5 × 2 × 4 | 11 | 15.84346 | 0.3906 | 0.6094 | 33 | |||
| 61 | 5 × 2 × 5 | 12 | 15.82271 | 0.3914 | 0.6086 | 50 | M | ||
| 62 | 5 × 3 × 2 | 10 | 13.75725 | 0.4709 | 0.5291 | 50 | M | ||
| 63 | 5 × 3 × 3 | 11 | 13.61220 | 0.4765 | 0.5235 | 50 | M | ||
| 64 | 5 × 3 × 4 | 12 | 13.55278 | 0.4787 | 0.5213 | 50 | M | ||
| 65 | 5 × 3 × 5 | 13 | 13.52812 | 0.4797 | 0.5203 | 50 | M | ||
| 66 | 5 × 4 × 2 | 11 | 12.18121 | 0.5315 | 0.4685 | 50 | M | ||
| 67 | 5 × 4 × 3 | 12 | 12.04418 | 0.5368 | 0.4632 | 50 | M | ||
| 68 | 5 × 4 × 4 | 13 | 11.93868 | 0.5408 | 0.4592 | 50 | M | ||
| 69 | 5 × 4 × 5 | 14 | 11.89604 | 0.5425 | 0.4575 | 50 | M | ||
| 70 | 5 × 5 × 1 | 11 | 12.37526 | 0.5240 | 0.4760 | 50 | M | ||
| 71 | 5 × 5 × 2 | 12 | * | 0.029 | 11.01160 | 0.5765 | 0.4235 | 50 | M |
| 72 | 5 × 5 × 3 | 13 | * | 0.006 | 10.85058 | 0.5827 | 0.4173 | 50 | M |
| 73 | 5 × 5 × 4 | 14 | * | 0.006 | 10.70568 | 0.5882 | 0.4118 | 50 | M |
| 74 | 5 × 5 × 5 | 15 | * | 0.001 | 10.66897 | 0.5897 | 0.4103 | 50 | M |
| Sum of Components | Model Size | Difference in Prop. Fit | Prop. SS (Fit) | |
|---|---|---|---|---|
| 1 | 3 | 1 × 1 × 1 | 0.23616 | 0.2362 |
| 7 | 5 | 2 × 2 × 1 | 0.10705 | 0.3432 |
| 8 | 6 | 2 × 2 × 2 | 0.01050 | 0.3537 |
| 27 | 7 | 3 × 3 × 1 | 0.07091 | 0.4246 |
| 28 | 8 | 3 × 3 × 2 | 0.02057 | 0.4452 |
| 49 | 9 | 4 × 4 × 1 | 0.03249 | 0.4777 |
| 50 | 10 | 4 × 4 × 2 | 0.03930 | 0.5170 |
| 54 | 11 | 4 × 5 × 2 | 0.03036 | 0.5473 |
| 71 | 12 | 5 × 5 × 2 | 0.02915 | 0.5765 |
| 72 | 13 | 5 × 5 × 3 | 0.00619 | 0.5827 |
| 73 | 14 | 5 × 5 × 4 | 0.00557 | 0.5882 |
| 74 | 15 | 5 × 5 × 5 | 0.00141 | 0.5897 |
| Mode | Variance Total | Components by Mode | |||||
|---|---|---|---|---|---|---|---|
| 1 | 2 | 3 | 4 | 5 | |||
| A | Countries | 0.576 | 0.243 | 0.125 | 0.102 | 0.065 | 0.041 |
| B | CSR Practices | 0.576 | 0.241 | 0.128 | 0.087 | 0.063 | 0.057 |
| C | Years | 0.576 | 0.498 | 0.079 | |||
| Total variance explained | 0.576 | ||||||
| CORE MATRIX | Mode 2 Components | Mode 2 Components | ||||||||||
|---|---|---|---|---|---|---|---|---|---|---|---|---|
| Sum of Residual Squares | Variance Explained (%) | |||||||||||
| 1 | 2 | 3 | 4 | 5 | 1 | 2 | 3 | 4 | 5 | |||
| Mode 3, Component 1 | Mode 1 components | 1 | 2.45 | −0.09 | 0.03 | −0.09 | −0.06 | 23.20 | 0.00 | 0.00 | 0.00 | 0.00 |
| 2 | 0.09 | 1.46 | −0.62 | −0.16 | −0.01 | 0.00 | 8.30 | 1.50 | 0.10 | 0.00 | ||
| 3 | −0.07 | 0.64 | 1.15 | −0.65 | −0.01 | 0.00 | 1.50 | 5.10 | 1.60 | 0.00 | ||
| 4 | 0.05 | 0.09 | −0.40 | −0.47 | 0.89 | 0.00 | 0.00 | 0.60 | 0.90 | 3.00 | ||
| 5 | 0.08 | 0.22 | 0.41 | 0.71 | 0.53 | 0.00 | 0.20 | 0.60 | 2.00 | 1.10 | ||
| Mode 3, Component 2 | Mode 1 components | 1 | −0.24 | −0.10 | 0.23 | 0.03 | 0.38 | 0.20 | 0.00 | 0.20 | 0.00 | 0.60 |
| 2 | 0.21 | 0.60 | −0.01 | 0.53 | 0.06 | 0.20 | 1.40 | 0.00 | 1.10 | 0.00 | ||
| 3 | 0.23 | −0.48 | −0.05 | −0.19 | 0.44 | 0.20 | 0.90 | 0.00 | 0.10 | 0.80 | ||
| 4 | −0.27 | −0.32 | −0.42 | −0.36 | −0.18 | 0.30 | 0.40 | 0.70 | 0.50 | 0.10 | ||
| 5 | 0.01 | 0.12 | 0.00 | −0.02 | −0.21 | 0.00 | 0.10 | 0.00 | 0.00 | 0.20 | ||
© 2018 by the authors. Licensee MDPI, Basel, Switzerland. This article is an open access article distributed under the terms and conditions of the Creative Commons Attribution (CC BY) license (http://creativecommons.org/licenses/by/4.0/).
Share and Cite
Amor-Esteban, V.; Galindo-Villardón, M.-P.; David, F. Study of the Importance of National Identity in the Development of Corporate Social Responsibility Practices: A Multivariate Vision. Adm. Sci. 2018, 8, 50. https://doi.org/10.3390/admsci8030050
Amor-Esteban V, Galindo-Villardón M-P, David F. Study of the Importance of National Identity in the Development of Corporate Social Responsibility Practices: A Multivariate Vision. Administrative Sciences. 2018; 8(3):50. https://doi.org/10.3390/admsci8030050
Chicago/Turabian StyleAmor-Esteban, Víctor, Mª-Purificación Galindo-Villardón, and Fátima David. 2018. "Study of the Importance of National Identity in the Development of Corporate Social Responsibility Practices: A Multivariate Vision" Administrative Sciences 8, no. 3: 50. https://doi.org/10.3390/admsci8030050
APA StyleAmor-Esteban, V., Galindo-Villardón, M.-P., & David, F. (2018). Study of the Importance of National Identity in the Development of Corporate Social Responsibility Practices: A Multivariate Vision. Administrative Sciences, 8(3), 50. https://doi.org/10.3390/admsci8030050