1. Introduction
Public administration plays a crucial role in ensuring the equitable distribution of resources and essential services, contributing to social well-being and economic development. This sector faces the challenge of integrating sustainability and innovation principles to address social demands that promote equitable and sustainable development for all (
Marques et al., 2021;
Silva et al., 2023). In this context, accountability and the capacity of institutions to respond efficiently to citizens’ needs are key factors in strengthening governmental legitimacy and ensuring access to quality public services.
Citizens’ trust in public institutions is closely linked to the perception of efficient and fair management of public resources. Previous studies (
Erkkilä, 2020;
Tavera-Cortés et al., 2024;
Vargas-Merino & Zavaleta-Chávez, 2020) have demonstrated that efficient budgetary management, combined with robust accountability practices, can significantly improve both public perception and the quality of public services. Furthermore, ensuring active citizen engagement in decision-making processes fosters democratic governance and promotes a more transparent and collaborative relationship between governments and the population (
Androniceanu, 2021;
Moreira-Macias & Vegas-Meléndez, 2024).
At the international level, innovative practices in budget allocation and transparent resource management have been shown to transform citizens’ perceptions of public services while strengthening trust in institutions (
Franciskovic, 2013;
Kasdin, 2017;
Marques et al., 2021). In particular, fiscal transparency has been associated with reducing corruption, enhancing perceptions of governmental legitimacy, and achieving a more equitable distribution of resources (
Chen & Neshkova, 2020;
International Monetary Fund, 2007;
Kosack & Fung, 2014). Efficient budget allocation not only addresses the population’s priority needs but also drives sustainable economic and social development (
Akın-Basa, 2023;
Bauhr & Carlitz, 2021;
Ganeshu et al., 2023;
Marques et al., 2021).
However, implementing these practices faces significant barriers (
Ganeshu et al., 2023). Among the most common limitations are structural problems, corrupt practices, resource insufficiency, poor planning, and the lack of training among public officials (
Ganeshu et al., 2023;
Páez-Moreno et al., 2023). These barriers not only hinder the provision of essential services but also negatively impact citizens’ quality of life and fuel distrust in public institutions (
Elliott et al., 2024;
Ganeshu et al., 2023;
Kaplan & Norton, 1996;
Venard & Tshering, 2021). Therefore, it is crucial to identify both the factors that obstruct the implementation of effective governance strategies and those that can strengthen accountability and institutional capacities.
Within this framework, the present study examines the relationship between citizens’ perceptions of public resource management and the quality of municipal services in Ecatepec de Morelos, a municipality facing structural challenges in the provision of essential services such as potable water, sanitation, and public lighting. Managing public resources in highly populated urban areas with high poverty rates requires efficient and transparent strategies to effectively address citizens’ needs. However, in municipalities such as Ecatepec, the perception of opacity and dissatisfaction with public services reflect a significant gap between governmental administration and public expectations.
Although the existing literature has extensively addressed the importance of transparency and accountability in public administration (
Androniceanu, 2021;
Chen & Neshkova, 2020;
Erkkilä, 2020;
Franciskovic, 2013;
Ganeshu et al., 2023;
Holzer, 2022), gaps remain in the analysis of how these variables influence public trust and perceptions (
Grimmelikhuijsen & Meijer, 2014;
Sofyani et al., 2023) of institutional efficiency at the municipal level. This study contributes to this discussion by examining the interplay between perceived opacity, dissatisfaction with municipal services, and the role of citizen participation in public resource management.
Ecatepec de Morelos represents a particularly relevant case for studying municipal governance and public service management due to its combination of high population density, budgetary constraints, and low citizen trust in local institutions. This municipality faces disproportionately high levels of poverty and financial limitations, making it a critical case to analyze governance challenges in urban contexts with structural deficiencies.
To this end, this research has three main objectives: first, to analyze the impact of perceived opacity on the relationship between citizens and local authorities; second, to assess the current budget allocation mechanisms and their capacity to address the population’s priority needs; and third, to propose strategies based on transparency and citizen participation to enhance municipal public administration efficiency. By generating empirical evidence within a local governance context, this study provides key insights for the design of more inclusive, transparent, and effective public policies, aiming to improve the provision of essential services and strengthen public trust in institutions.
2. Theoretical Framework
2.1. Public Budgeting and Its Role in Public Administration
The planning and management of financial resources are essential tools in public administration. The public budget, defined as a document detailing projected revenues and authorized expenditures for a specific fiscal period, not only enables the effective implementation of public policies but also ensures that governmental priorities align with citizens’ needs (
Musgrave & Musgrave, 1989).
The International Monetary Fund (IMF) (
International Monetary Fund, 2007) highlights that the public budget, as an annual financial plan, is indispensable for fostering social well-being through the responsible and transparent management of public resources. Moreover, effective resource management strengthens economic stability and promotes sustainable development by reflecting governmental priorities while simultaneously serving as a control mechanism to ensure the efficient and responsible use of funds (
Stiglitz & Rosengard, 2015).
At the municipal level, the ability to efficiently manage resources is crucial for administrative effectiveness and the strengthening of local governance. It is not merely a technical task but a strategic tool for prioritizing economic and social policies that respond to local needs (
Eslava-Zapata et al., 2019). In this regard, citizen participation in budgeting processes is fundamental to ensuring that decisions reflect community demands and to mitigating risks associated with corruption (
Hogan et al., 2017;
Huarac-Quispe et al., 2022;
Moreira-Macias & Vegas-Meléndez, 2024).
Although the public budget is essential for promoting transparency and efficiency, its implementation faces significant challenges, particularly corruption (
Chen & Neshkova, 2020;
Khasiani et al., 2020;
Sofyani et al., 2023). Control and accountability systems may be compromised by corrupt practices that prioritize private interests over collective needs (
Chen & Neshkova, 2020;
Elliott et al., 2024;
Ganeshu et al., 2023;
Khasiani et al., 2020;
Sofyani et al., 2023).
2.2. Local Context: The Municipality of Ecatepec de Morelos, Mexico
Located in the northeastern part of the Valley of Mexico, Ecatepec de Morelos is one of the 125 municipalities of the State of Mexico (
Bassols-Ricárdez & Espinosa-Castillo, 2011). With a population of 1.645 million inhabitants, it represents approximately 11% of the state’s population and accounts for 16.67% of the population of the Metropolitan Area of the Valley of Mexico, making it one of the most densely populated localities in the country, with a density of 8845 inhabitants per km
2 (
Gobierno de Ecatepec de Morelos, 2022). This rapid demographic growth presents significant challenges in the provision and quality of public services (
Bassols-Ricárdez & Espinosa-Castillo, 2011).
From an economic perspective, Ecatepec has a diversified productive structure, including key sectors such as manufacturing, commerce, and services. In 2020, the municipality contributed 9.44% of the state economy, equivalent to MXN 140.486 billion of the MXN 1.48 trillion generated in the State of Mexico for the national economy (
Gobierno del Estado de México, 2020). If Ecatepec were an independent federal entity, it would rank 29th in the national gross domestic product (NGDP) ranking, surpassing states such as Baja California Sur, Nayarit, Colima, and Tlaxcala (
Instituto Nacional de Estadística Geografía e Informática, 2021).
Despite its economic significance, the quality of life of its population is affected by an inefficient distribution of resources (
Portugués-Flores, 2023). Currently, 47.54% of Ecatepec’s inhabitants live in poverty, amounting to 786,391 people, placing it second nationwide among municipalities with the highest number of people in this condition. Additionally, 5.84% of the population lives in extreme poverty, ranking the municipality sixth at the national level in this category (
Consejo Nacional de Evaluación de la Política de Desarrollo Social, 2021).
Unlike other highly populated municipalities such as Tijuana and Guadalajara, which benefit from greater per capita budgets and more efficient public services, Ecatepec struggles with substantial challenges because of its restricted budget and governance problems. The State of Mexico includes Ecatepec as one of its primary economic centers, yet public service metrics along citizen satisfaction and transparency rankings rank the lowest throughout the nation. The combination of these elements makes Ecatepec an essential example for analyzing how local government shortcomings affect both public confidence and service delivery.
Local governments face numerous difficulties when managing their administration and making decisions due to high population density, widespread poverty, and restricted financial resources. As more people rely on the same limited resources, the strain on municipal services grows, often resulting in deterioration and deficiencies.
The substantial portion of the population who live in poverty intensifies social disparities while pushing municipal governments to establish welfare programs. Ultimately, the interplay of these factors creates a complex governance environment in which municipalities must navigate competing demands with limited resources. The effectiveness of local governments in managing these challenges depends on their ability to implement innovative policies.
This situation leads to insufficient basic services, such as access to potable water, sanitation, and public lighting, directly affecting citizens’ quality of life. The potable water system suffers from distribution losses exceeding 40% due to leaks and obsolete pipelines (
Comisión Nacional del Agua, 2024), while water supply interruptions are frequent, leaving entire neighborhoods without regular access to clean water. The sanitation system is also undeveloped, with only 65% of wastewater receiving any form of treatment, leading to environmental and health concerns (
Comisión Nacional del Agua, 2024). In the case of public lighting, 30% of streetlights are reported as nonfunctional, contributing to perceptions of insecurity (
Gabinete de Comunicación Estratégico, 2019).
2.3. Transparency and Citizen Perception in Public Management
This distrust is supported by data from the National Urban Public Security Survey, which indicates that only 15% of residents over the age of 18 in Ecatepec believe that the municipal government is effective in addressing local problems (
Instituto Nacional de Estadística Geografía e Informática, 2023a). This percentage, which is significantly lower than the national average for perceived governmental effectiveness, highlights a widespread lack of confidence in local institutions.
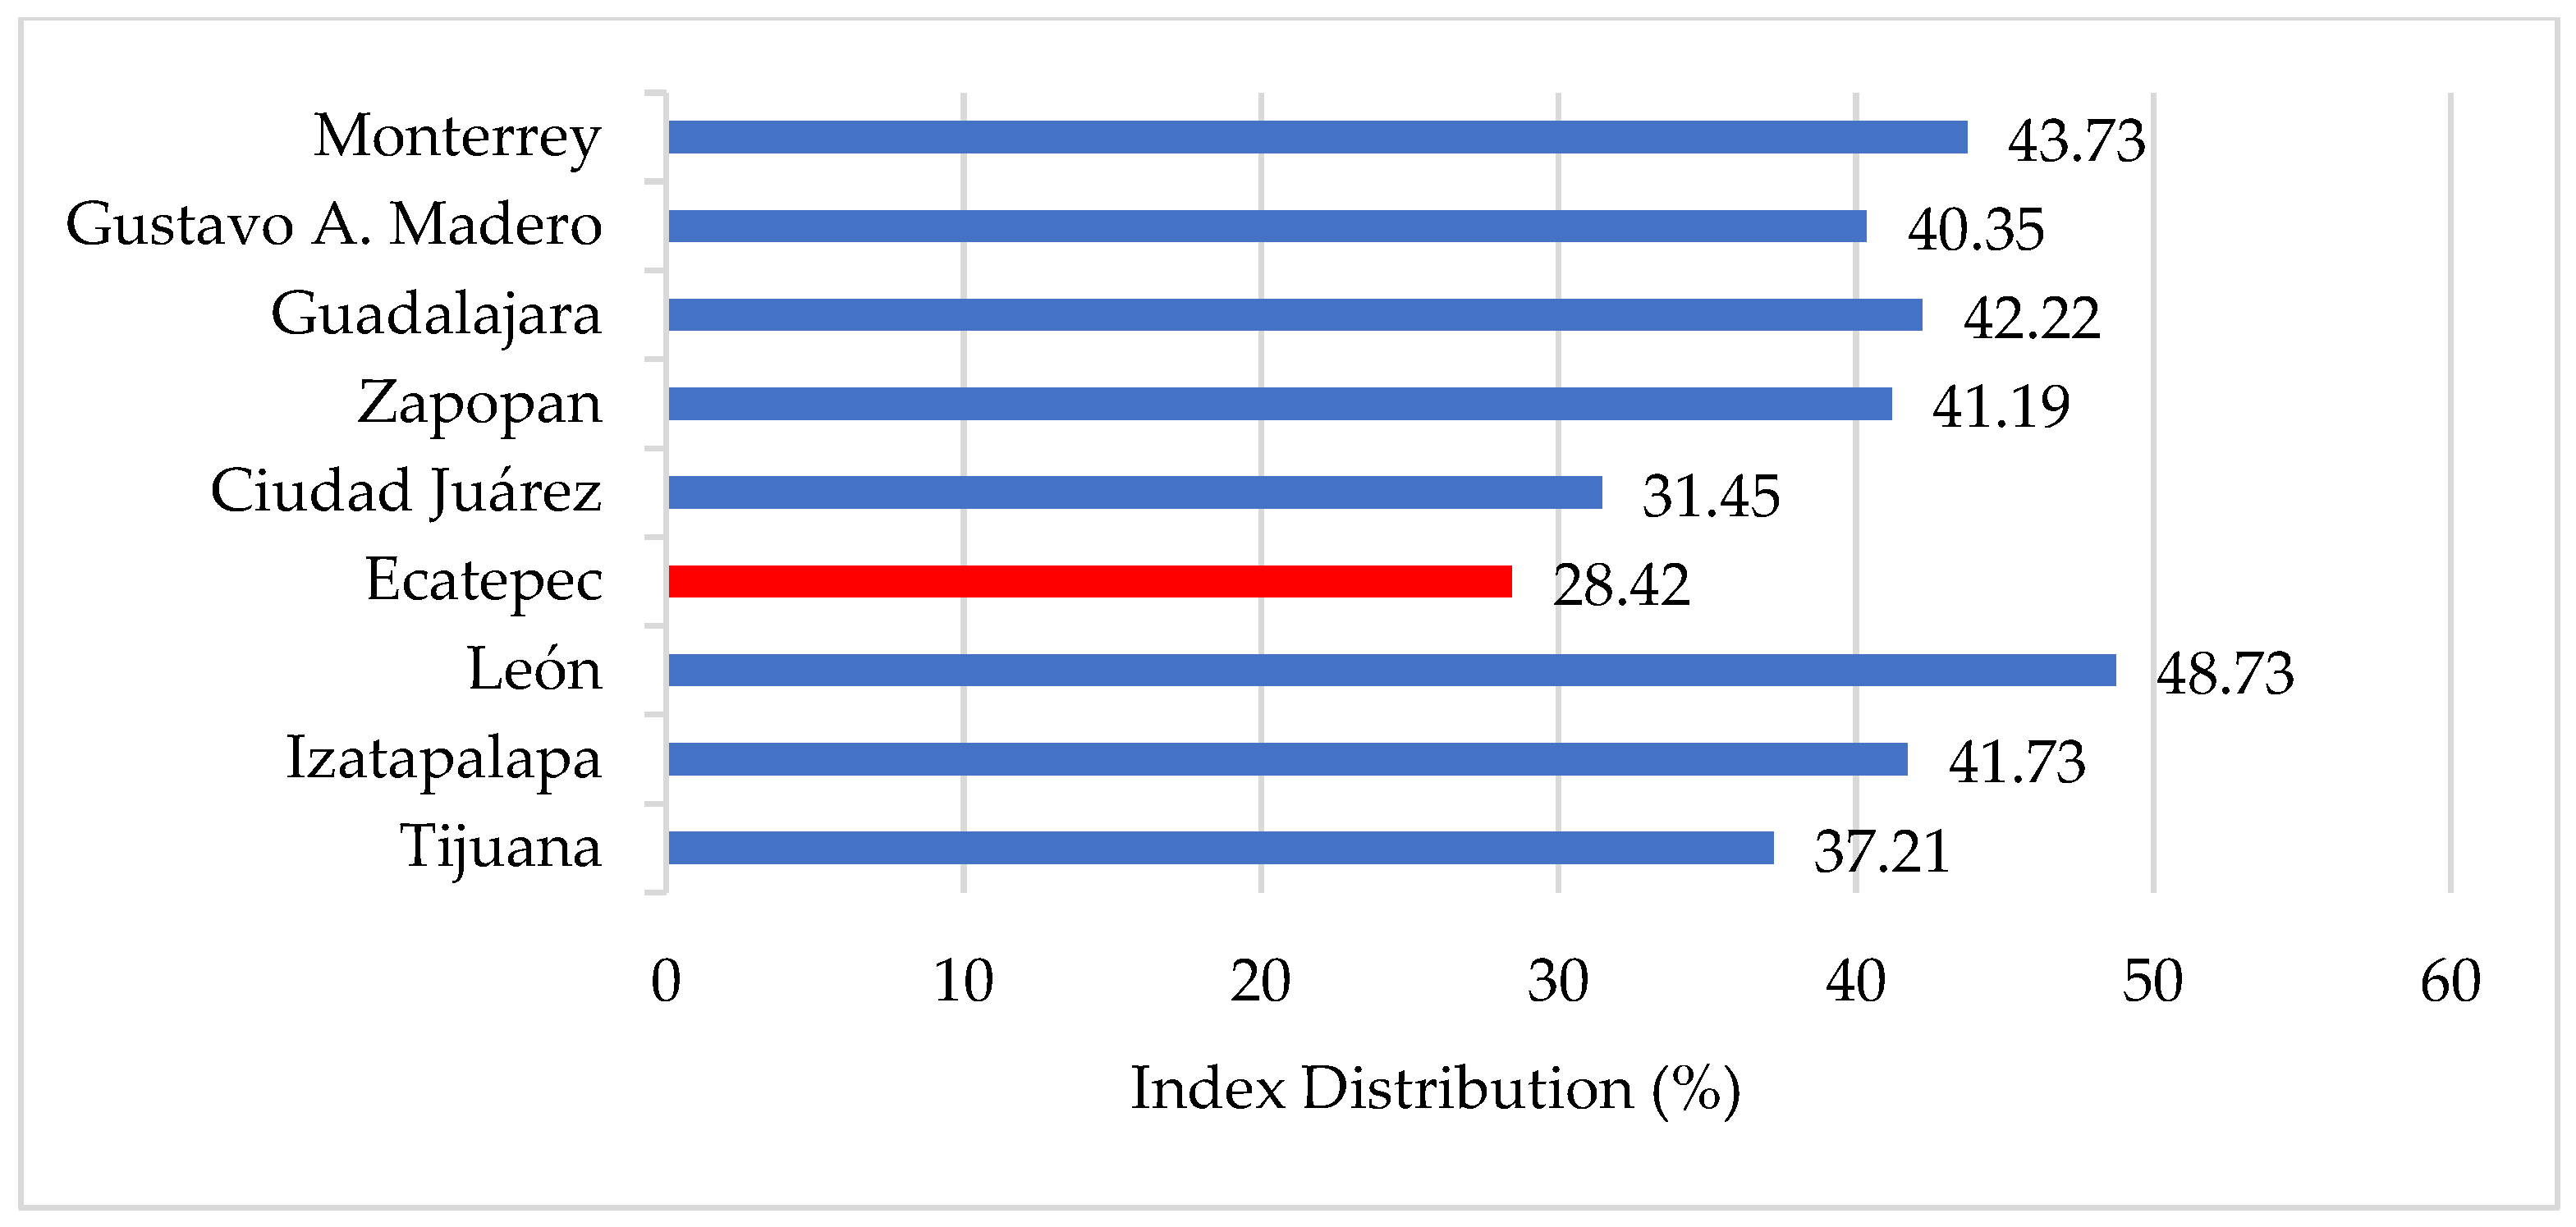
Furthermore, the Municipal Services Satisfaction Index (ISACS) ranks Ecatepec among the worst-performing municipalities in Mexico (
Gabinete de Comunicación Estratégico, 2019). This indicator assesses citizen perceptions of ten key public services, including waste collection, public lighting, drainage, road paving, and park maintenance. Ecatepec received a score of 28.42 points, well below the national average of 39.97 points (
Gabinete de Comunicación Estratégico, 2019). These results reinforce the perception of institutional neglect and inefficiency, perpetuating a cycle of distrust and poor resource management (
Figure 1).
Accountability systems are severely compromised when public resources are mismanaged or diverted, negatively impacting citizens’ perceptions of basic service quality (
de Fine Licht, 2014;
Khasiani et al., 2020;
Philip & Salome, 2023;
Sofyani et al., 2023). In municipalities like Ecatepec, recurrent accusations of corruption and lack of transparency (
Portugués-Flores, 2023) pose critical obstacles to the efficient provision of essential services, particularly in areas such as potable water supply, sanitation, and public lighting (
Androniceanu, 2021;
Bassols-Ricárdez & Espinosa-Castillo, 2011;
Huarac-Quispe et al., 2022;
Mendoza-Zamora et al., 2018).
The Evaluation of Municipalities of the State of Mexico (
Cervantes-Pérez, 2022) identified Ecatepec as one of the least transparent municipalities in the state. This assessment, focused on municipal transparency and governance, analyzed three dimensions: (1) access to public information, including the publication of accounts, public works, and municipal assets; (2) government–society relations, evaluating citizen participation and the existence of advisory councils; and (3) citizen services, considering the quality of administrative procedures, accountability on digital platforms, and the use of social media (
Cervantes-Pérez, 2022). These results highlight deficiencies in the implementation of policies for public information access and citizen participation.
The combination of corruption and a limited budget allocation presents a dual challenge for public service delivery and its perceived quality. On one hand, corruption diverts resources that should be allocated to essential projects and programs, reducing the operational capacity of government institutions (
Chen & Neshkova, 2020;
Sofyani et al., 2023;
Tavera-Cortés et al., 2024;
Venard & Tshering, 2021). On the other hand, funding shortages, even when managed transparently, limit the ability to meet the needs of a rapidly growing population, perpetuating inequalities and negatively impacting citizens’ quality of life (
Chen & Neshkova, 2020;
Khasiani et al., 2020;
Sofyani et al., 2023).
3. Materials
This study adopts a quantitative approach to analyze citizens’ perceptions of the quality of public services in Ecatepec de Morelos. Structured surveys were administered to collect measurable data on public satisfaction with municipal management and services. Participants’ responses were analyzed to understand the underlying factors influencing public perception, trust in government, and perceptions of transparency in public administration.
3.1. Sampling Design and Participant Selection
A convenience sampling method was employed, selecting respondents in accessible public spaces while considering the diversity of socioeconomic profiles within Ecatepec’s population. Although this method facilitated efficient data collection, it is acknowledged that the lack of randomness may introduce sampling bias in the results (
Ilker et al., 2015).
While no official statistics are available on the specific demographic characteristics of those who pay taxes in person during the period selected, it is widely observed that most residents tend to do so due to significant discounts offered by municipal government. Furthermore, there is currently no digital platform available for tax payment in Ecatepec, meaning all tax payments must be completed in person. This situation contributes to a high turnout of citizens from diverse backgrounds, strengthening the representativeness of the sample and reducing the possibility of potential bias. Additionally, to reduce these biases, an adequate sample size was determined using statistical calculations, ensuring the representativeness of the population.
3.2. Sample Size Calculation and Instrument Validation
The sample size was calculated using the equation for finite populations (
Aguilar-Barojas, 2005;
Heckathorn, 2011):
where
is the sample size,
is the total population (1,645,352),
is the Z-score for a 95% confidence level (
= 1.96),
is the expected proportion of the population (
= 0.5), and
is the margin of error (
= 0.05).
Substituting the values into Equation (1):
Based on this calculation, a total of 395 participants were selected, exceeding the minimum required sample size, which strengthens the validity and reliability of the results.
To evaluate the reliability of the questionnaire, a pilot test was conducted with 40 participants, using Cronbach’s alpha coefficient, calculated in SPSS software version 27 (
IBM Corp. Released 2023, 2023). A Cronbach’s alpha value of 0.888 was obtained, indicating high internal consistency of the instrument (
DeVellis, 2016;
Oviedo & Campo-Arias, 2005).
3.3. Questionnaire Structure and Survey Administration Process
The survey instrument was conducted between January and March 2024. Respondents were approached by researchers in the municipality’s main square during the municipal tax payment period, a time selected due to high traffic and the presence of diverse groups of residents as results of seasonal discounts offered by the local government (as previously discussed in
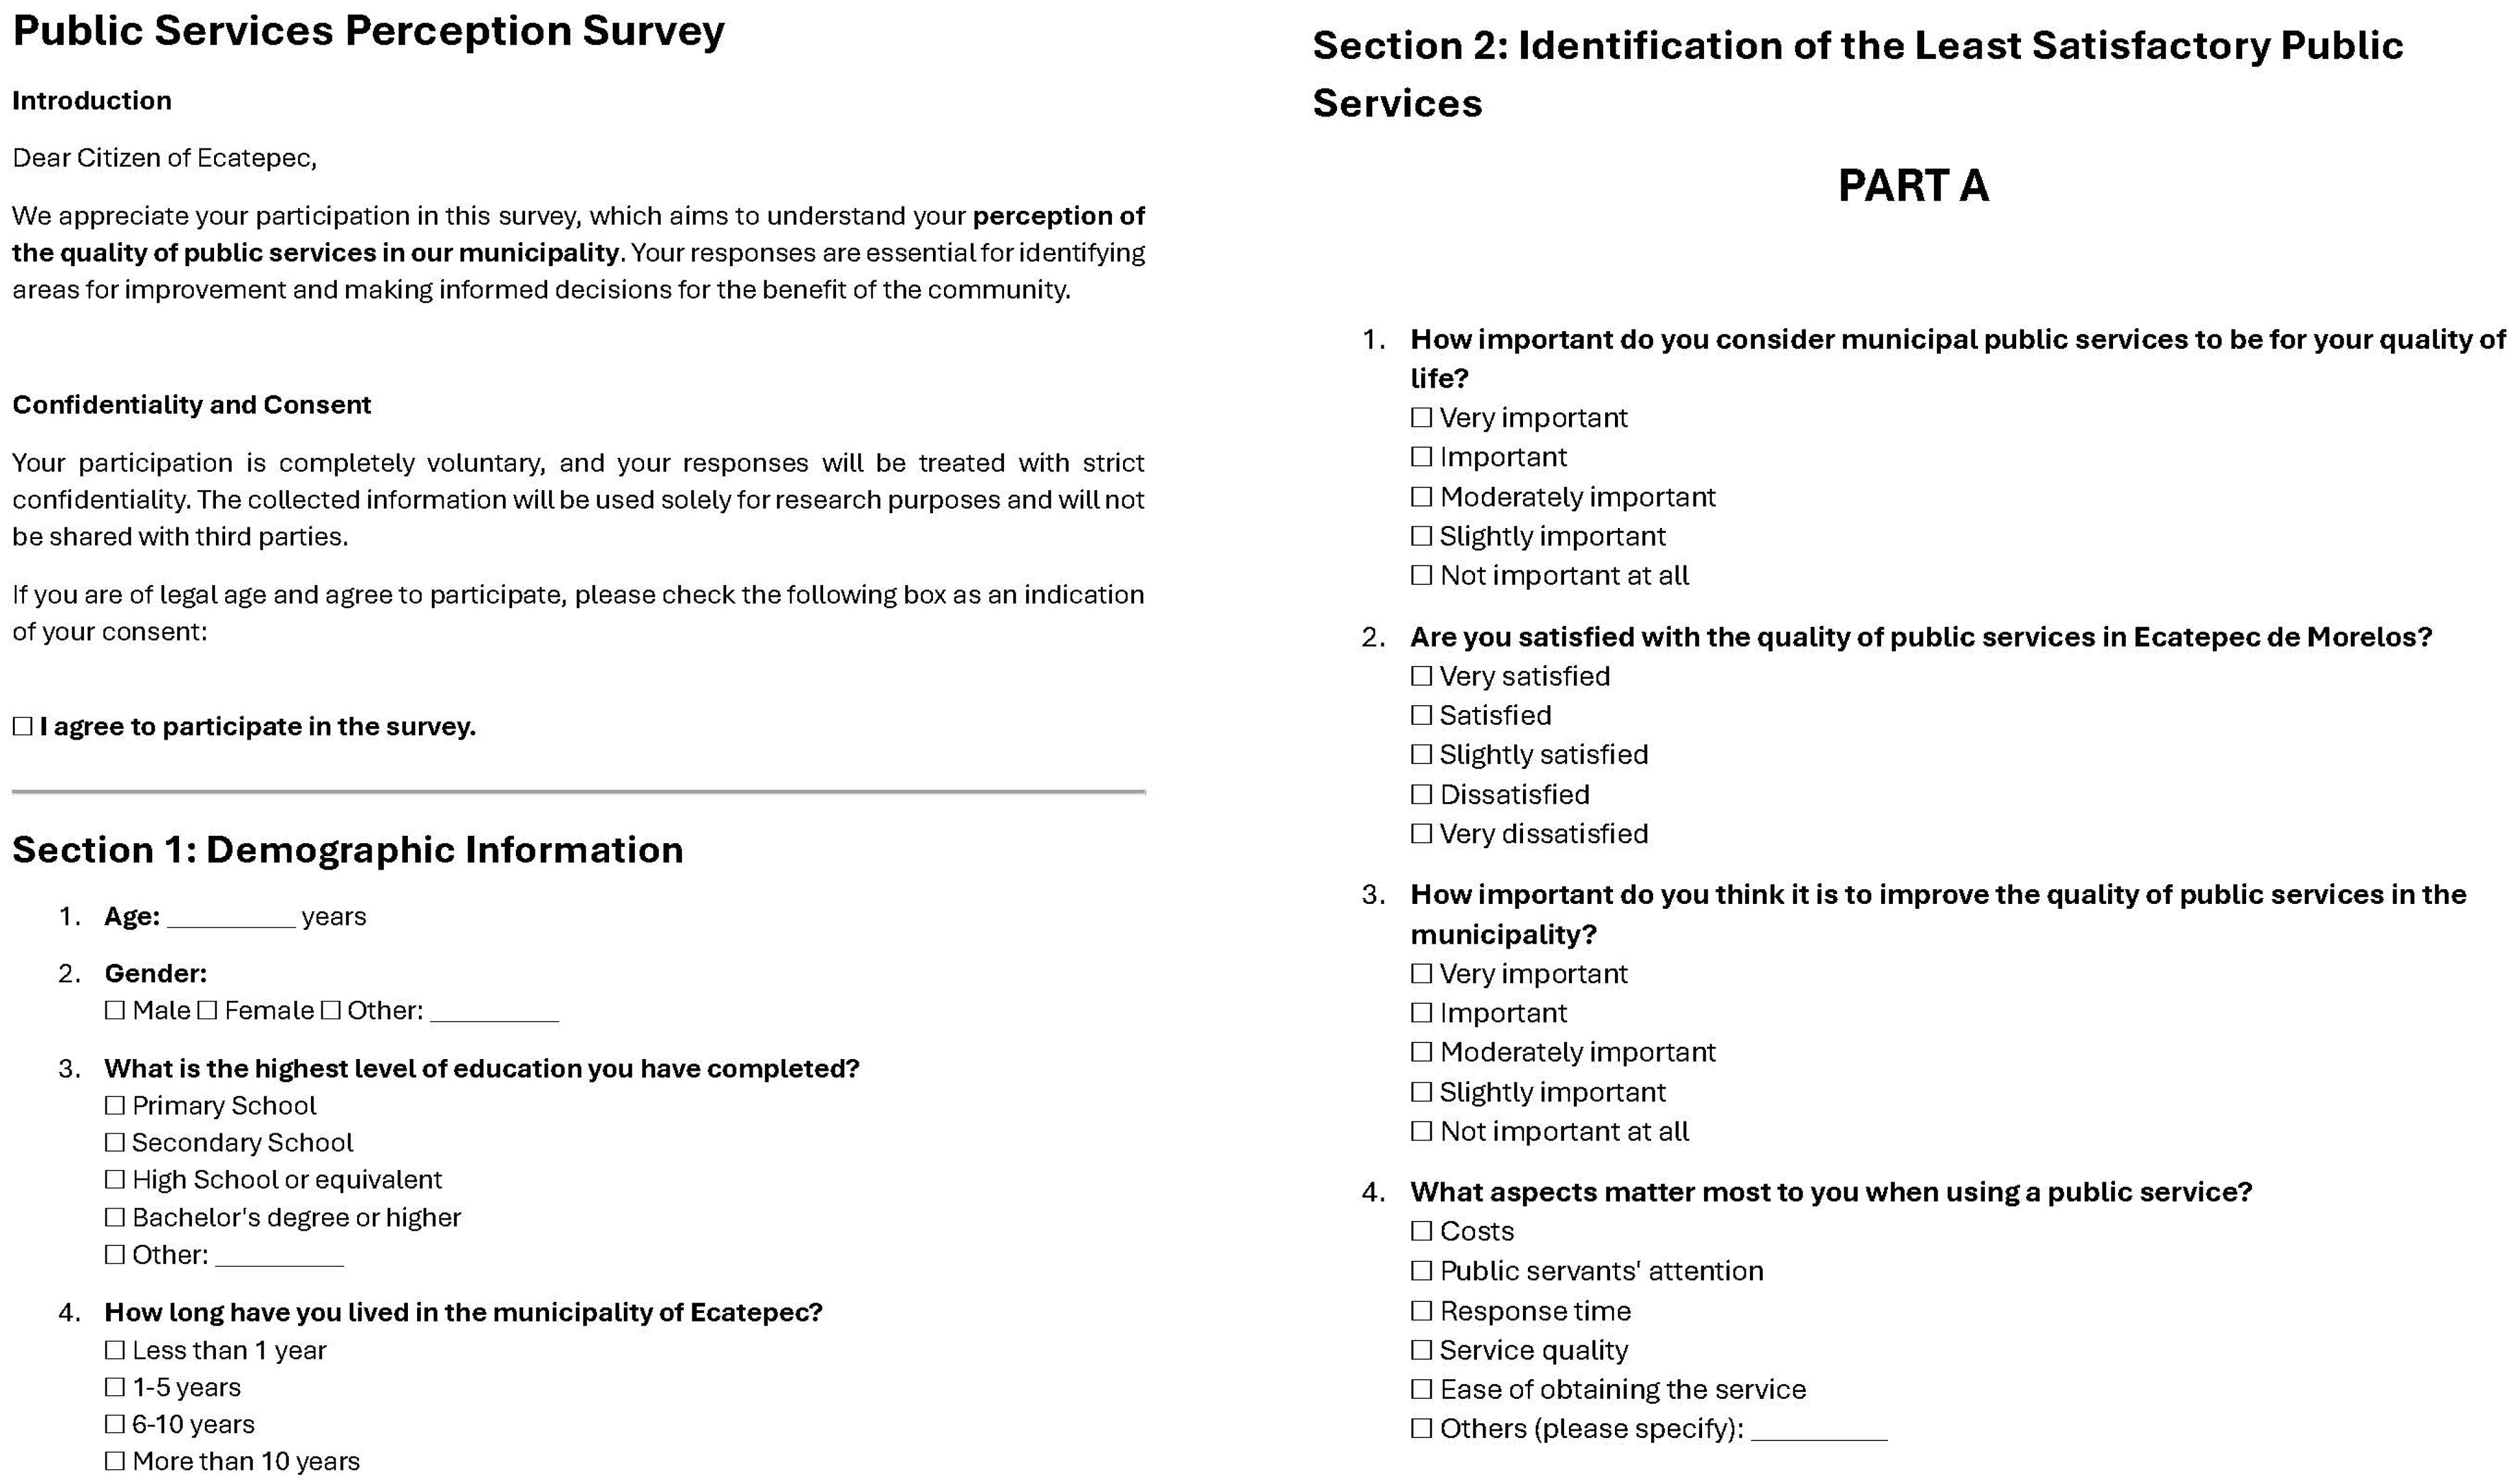
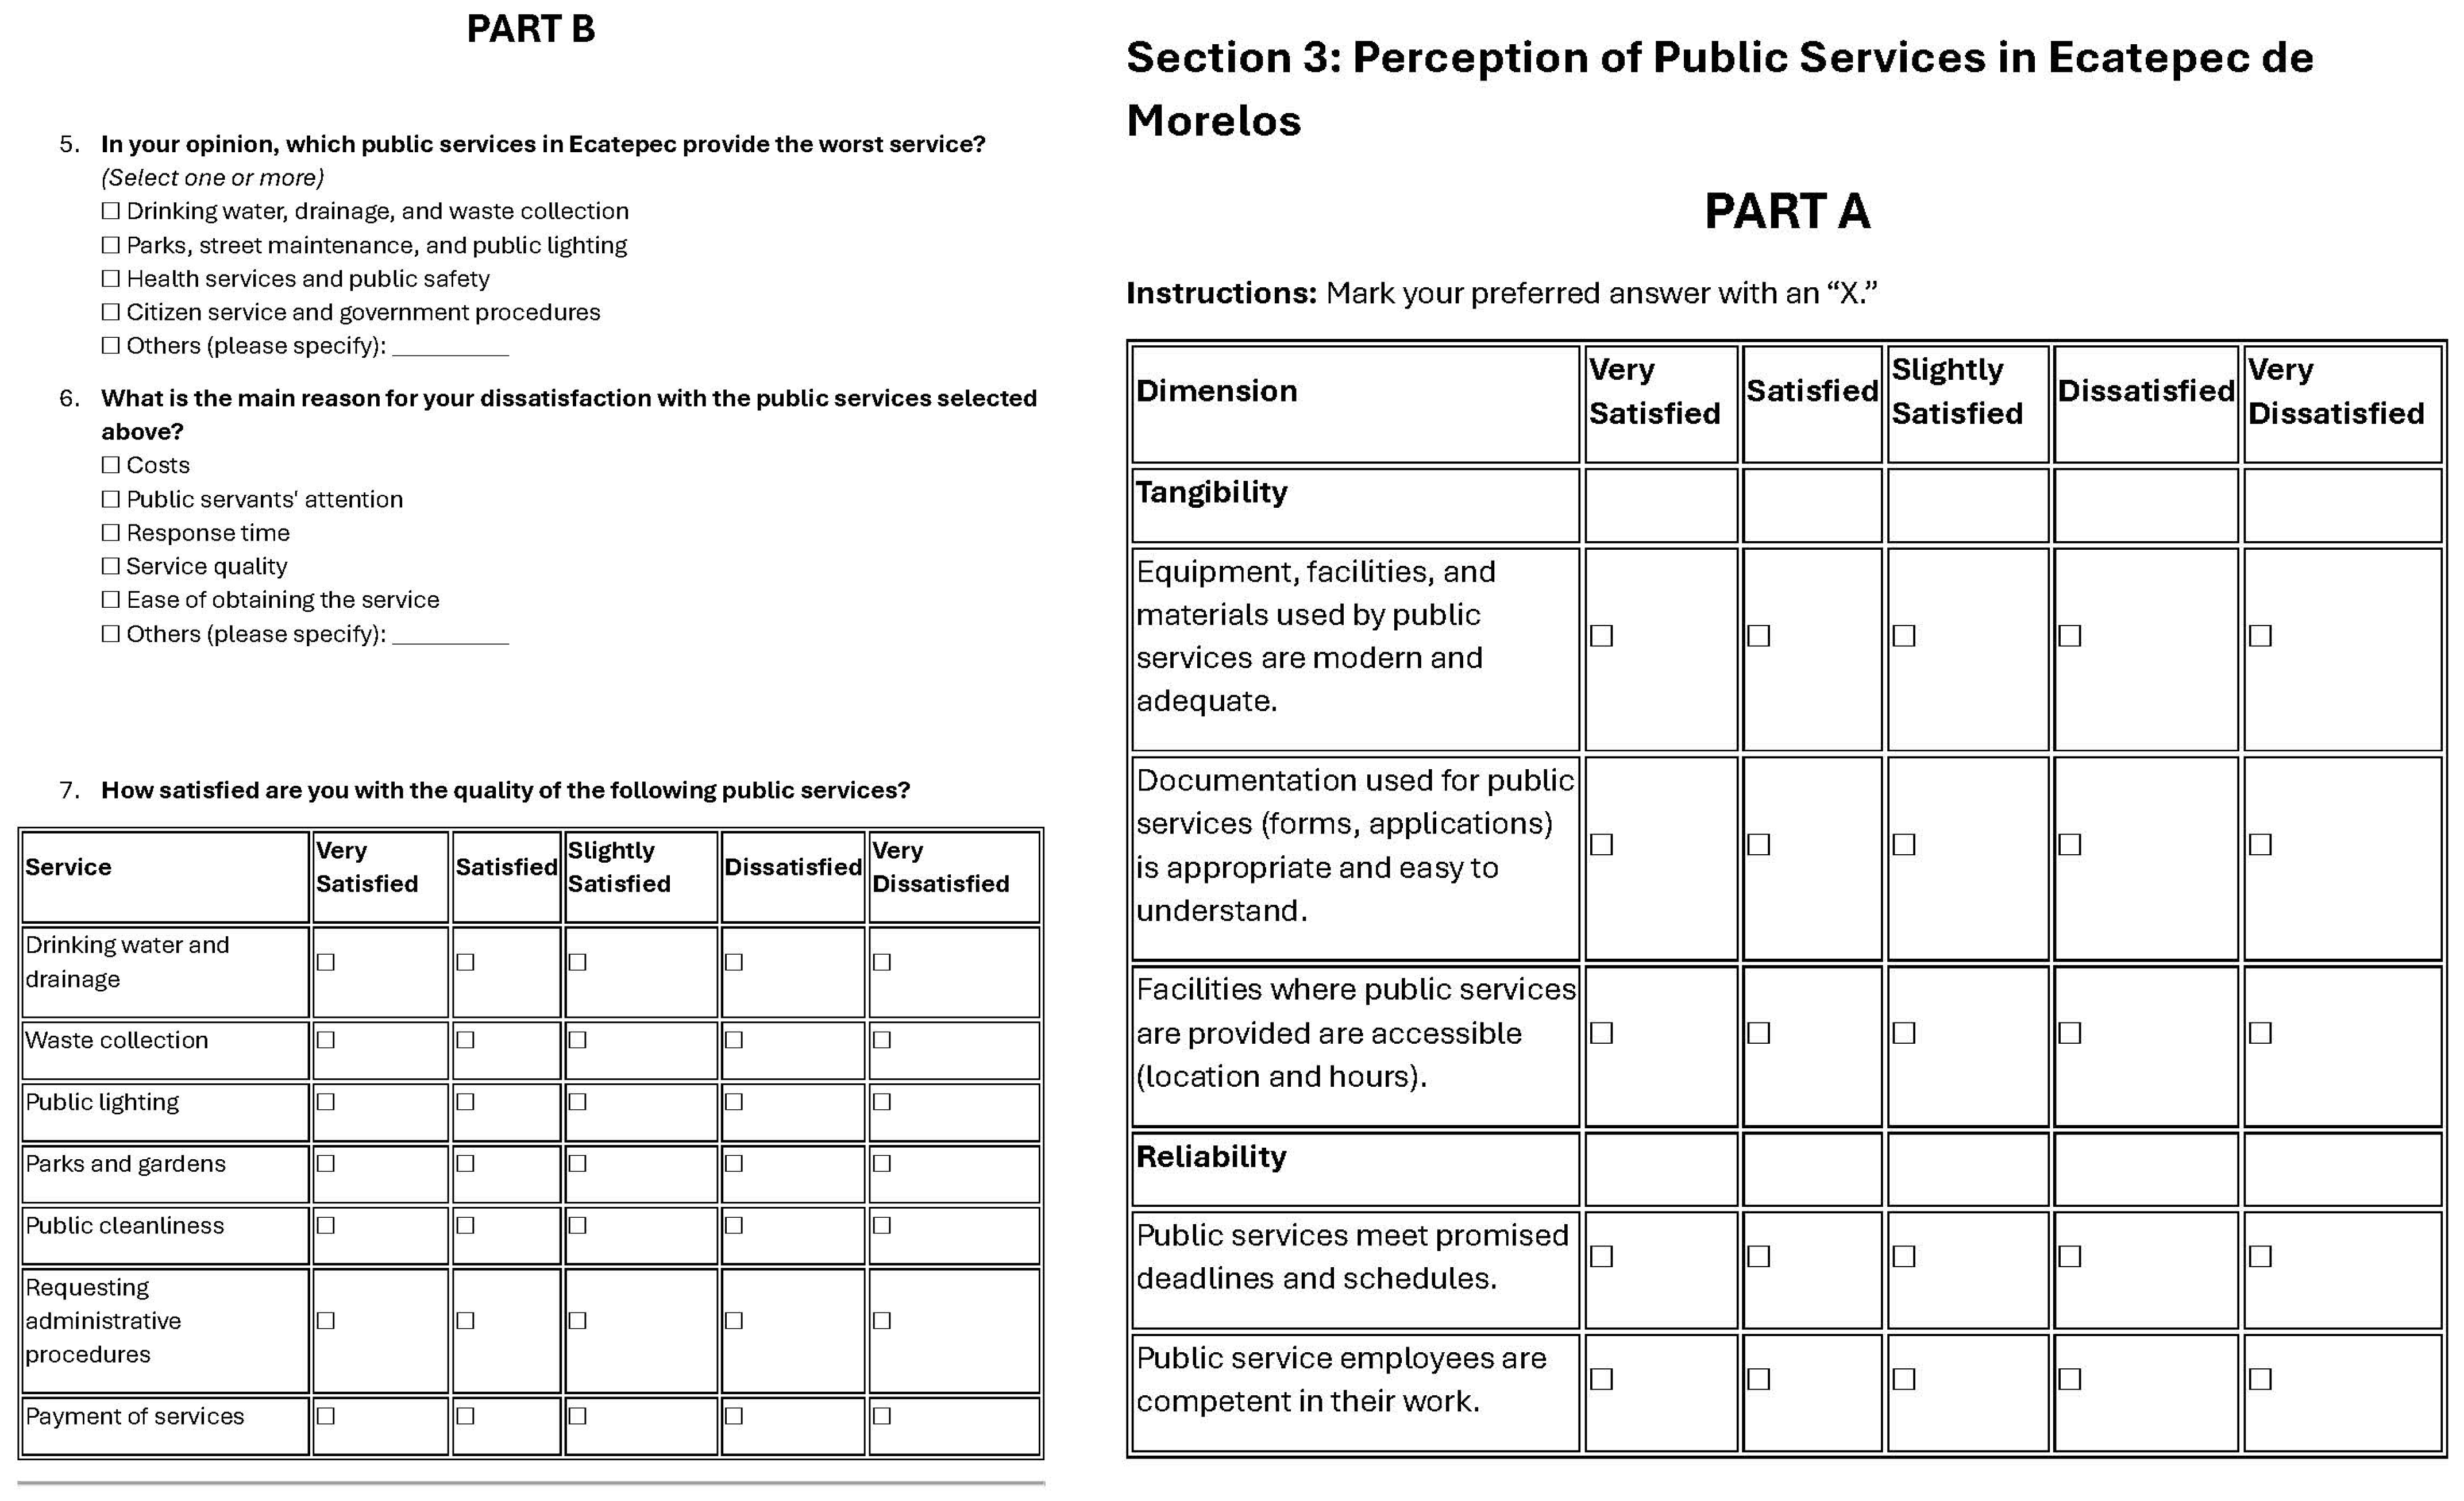
Section 3.1). The survey was administered electronically using tablets and digital forms, facilitating data collection and streamlined data processing. The location and time selected ensured that individuals from various backgrounds were adequately represented, thereby capturing a broad range of citizen perceptions regarding municipal governance and public services. The instrument consisted of 31 items (
Figure A1,
Figure A2 and
Figure A3), distributed into four key categories: (a) demographic information, (b) identification of unsatisfactory public services, (c) perception of public administration in Ecatepec, and (d) perception of transparency and citizen participation. The questionnaire items were designed based on the SERVQUAL model, which measures service quality through five dimensions: tangibles, reliability, responsiveness, assurance, and empathy. The model was adapted to assess citizen perceptions of municipal public services (
Araujo-Romero & López-Marrufo, 2022). The complete questionnaire can be found in
Appendix A.
3.4. Statistical Analysis Framework
A descriptive and exploratory statistical analysis was conducted to examine the relationship between variables captured through the questionnaire. The analysis was structured as follows:
Descriptive statistics: Initial exploration was carried out using percentages to identify overall patterns in citizen perceptions of public services and transparency.
Cross-tabulation analysis: Cross-tabulations were performed to explore relationships between relevant variables and perceptions of service quality, transparency, and citizen participation.
Reliability analysis: Cronbach’s alpha was calculated to evaluate the internal consistency and reliability of questionnaire items.
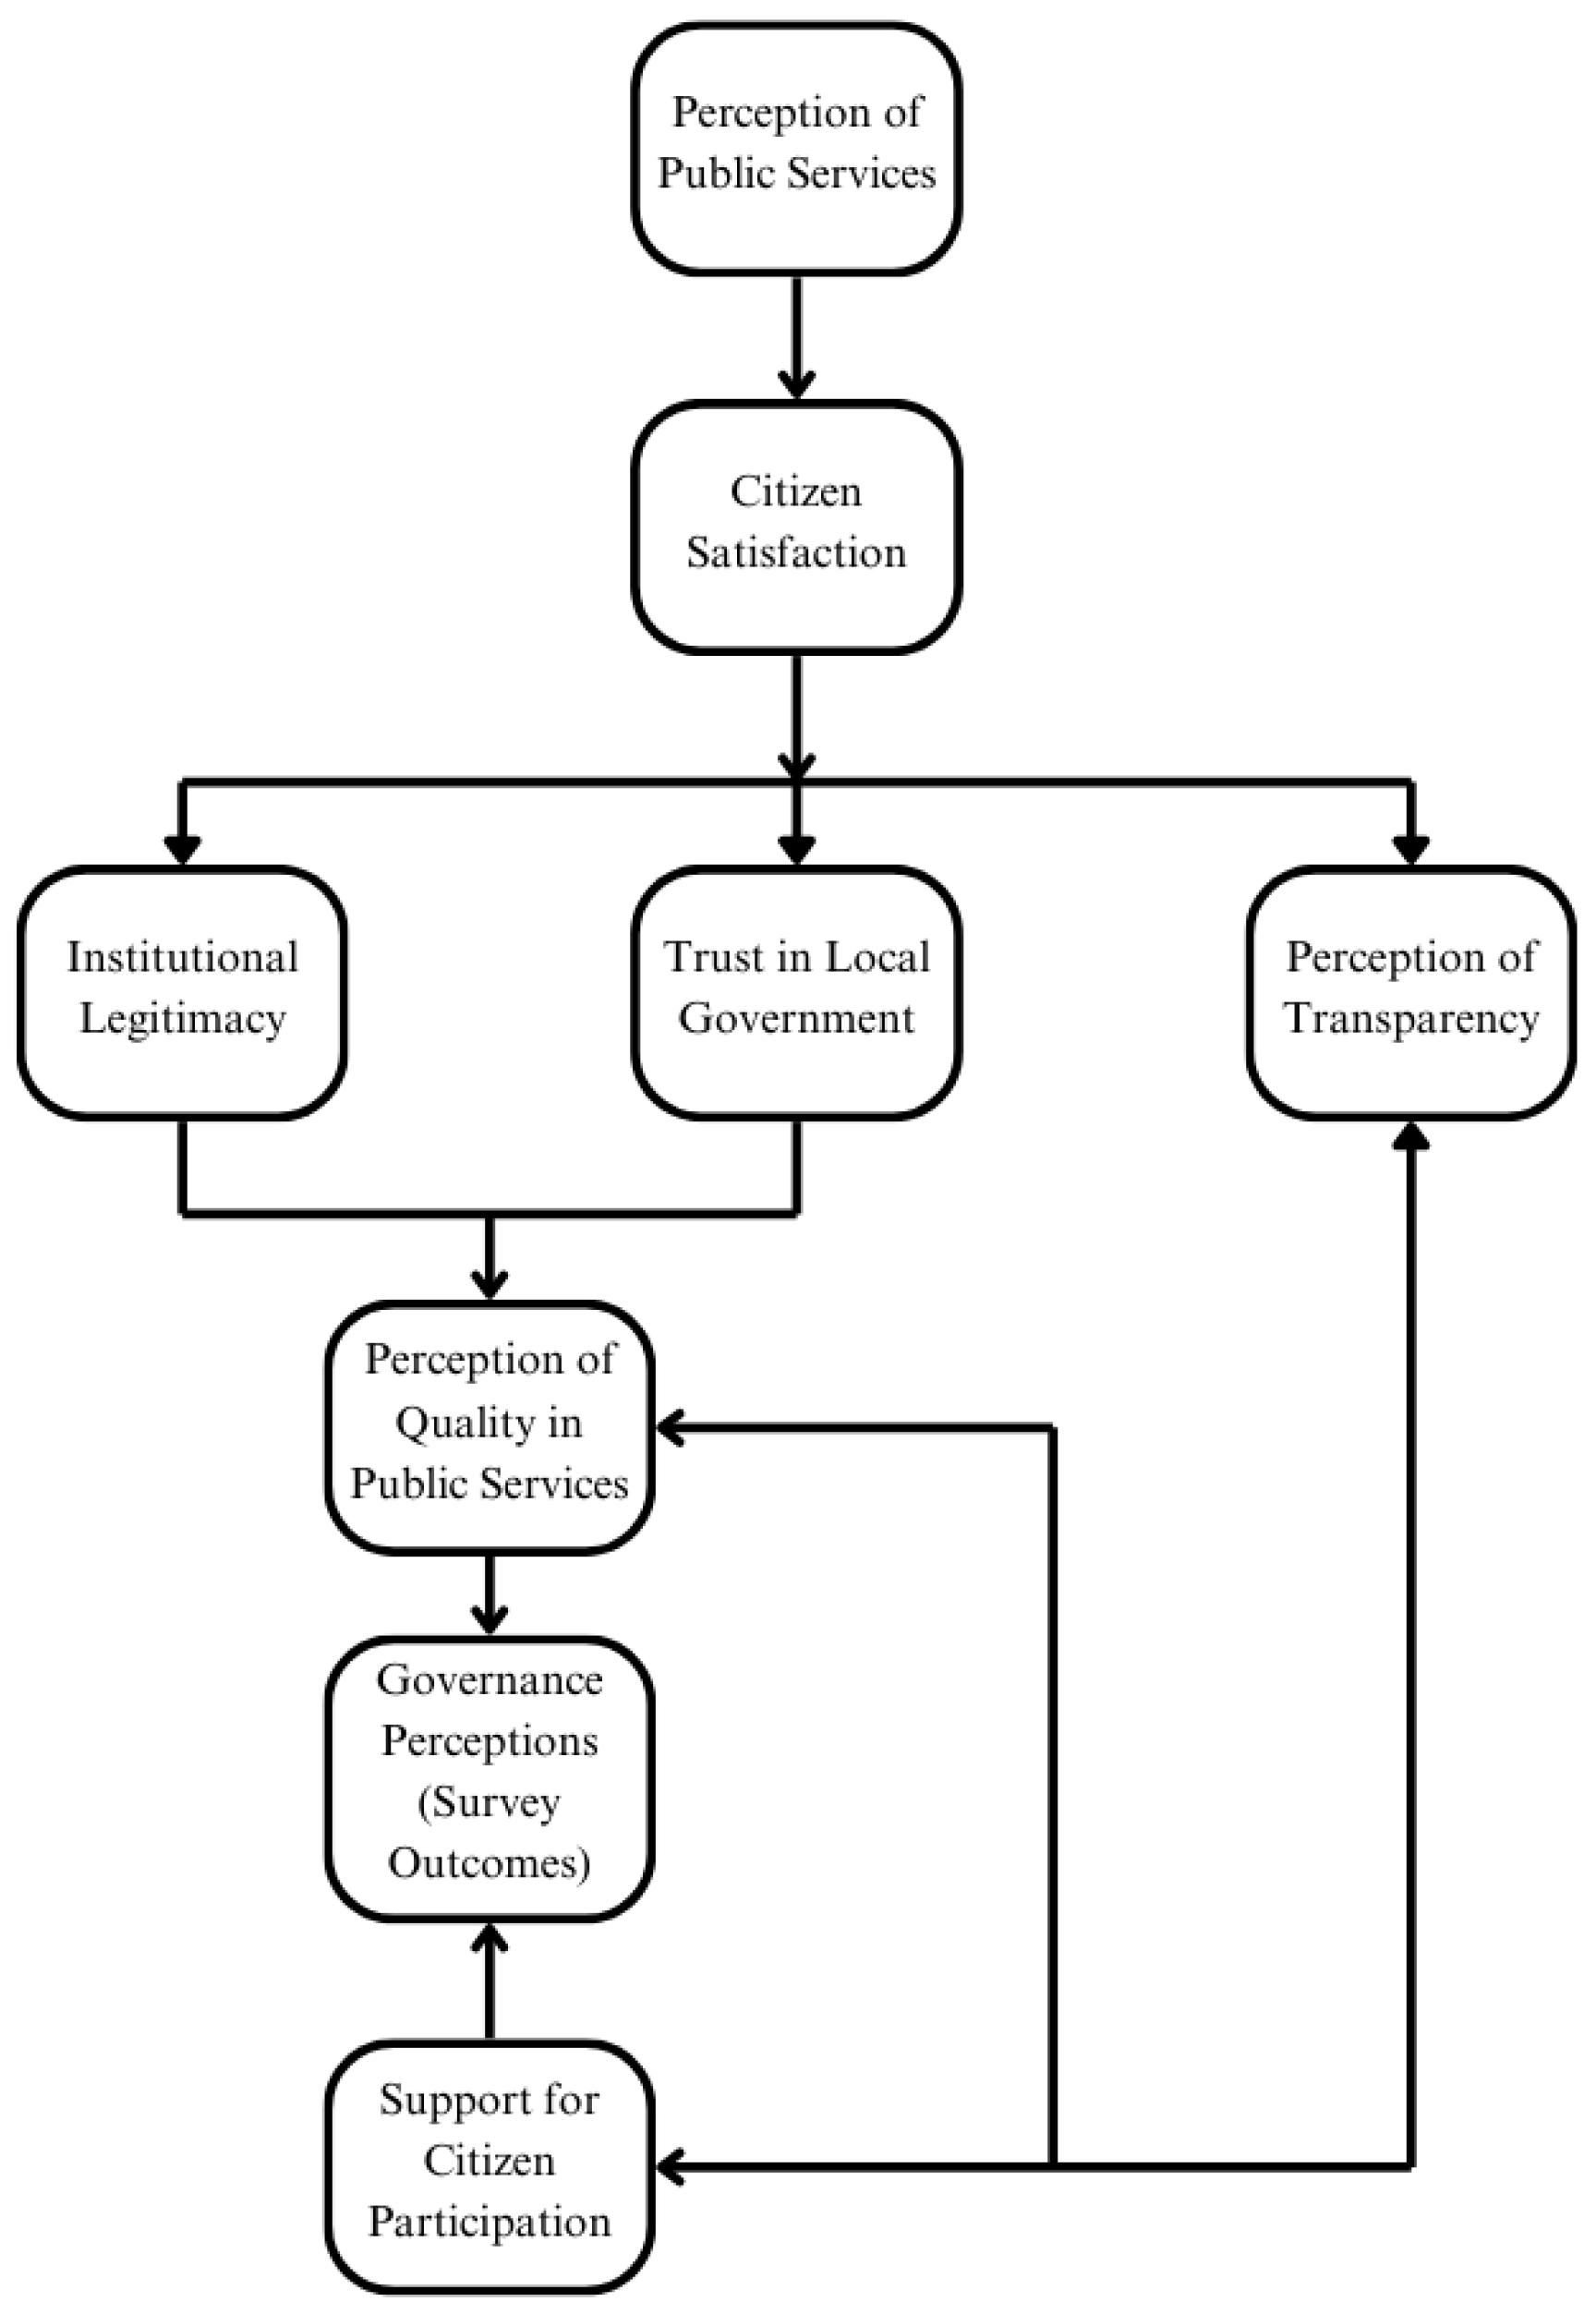
To complement the statistical analysis,
Figure 2 presents a conceptual model that illustrates the analytical framework guiding this study. It highlights the key variables explored through the survey and their interrelation with broader concepts like citizen satisfaction.
4. Results
4.1. Demographic Profile of Respondents
The demographic profile of the survey respondents reflects a balanced gender distribution, with 55% identifying as women and 45% as men (
Table 3). The largest group (39%) falls within the 25- to 34-year-old range, as presented in
Table 4, followed by 28% aged 35 to 44. Regarding the length of residence in the municipality,
Table 5 shows that 67% of participants reported having lived there for more than 10 years, while 19% reported residing there for a period between 6 and 10 years. This reflects an adequate understanding of the main problematics in the area.
To evaluate the representativeness of the sample, it is essential to compare its demographic characteristics with official census data from the locality. According to the most recent figures from national sources, the population of Ecatepec de Morelos consists of approximately 51.5% women and 48.5% men. This distribution closely mirrors the gender composition of the survey sample, suggesting a reasonable degree of representativeness in this dimension (
Instituto Nacional de Estadística y Geografía [INEGI], 2020).
Regarding age distribution, the most populous age groups in the municipality are 20–24 years, 15–19 years, and 25–29 years, which together account for 24.2% of the total population. Compared to the sample, there is a slight overrepresentation of individuals aged 25 to 34. This should be taken into consideration when interpreting age-related perceptions.
4.2. Citizen Perception of the Quality of Public Services in Ecatepec de Morelos
The results indicate that the population of Ecatepec de Morelos perceives public services as essential determinants of their quality of life, highlighting their reliance on these services as fundamental to individual and collective well-being.
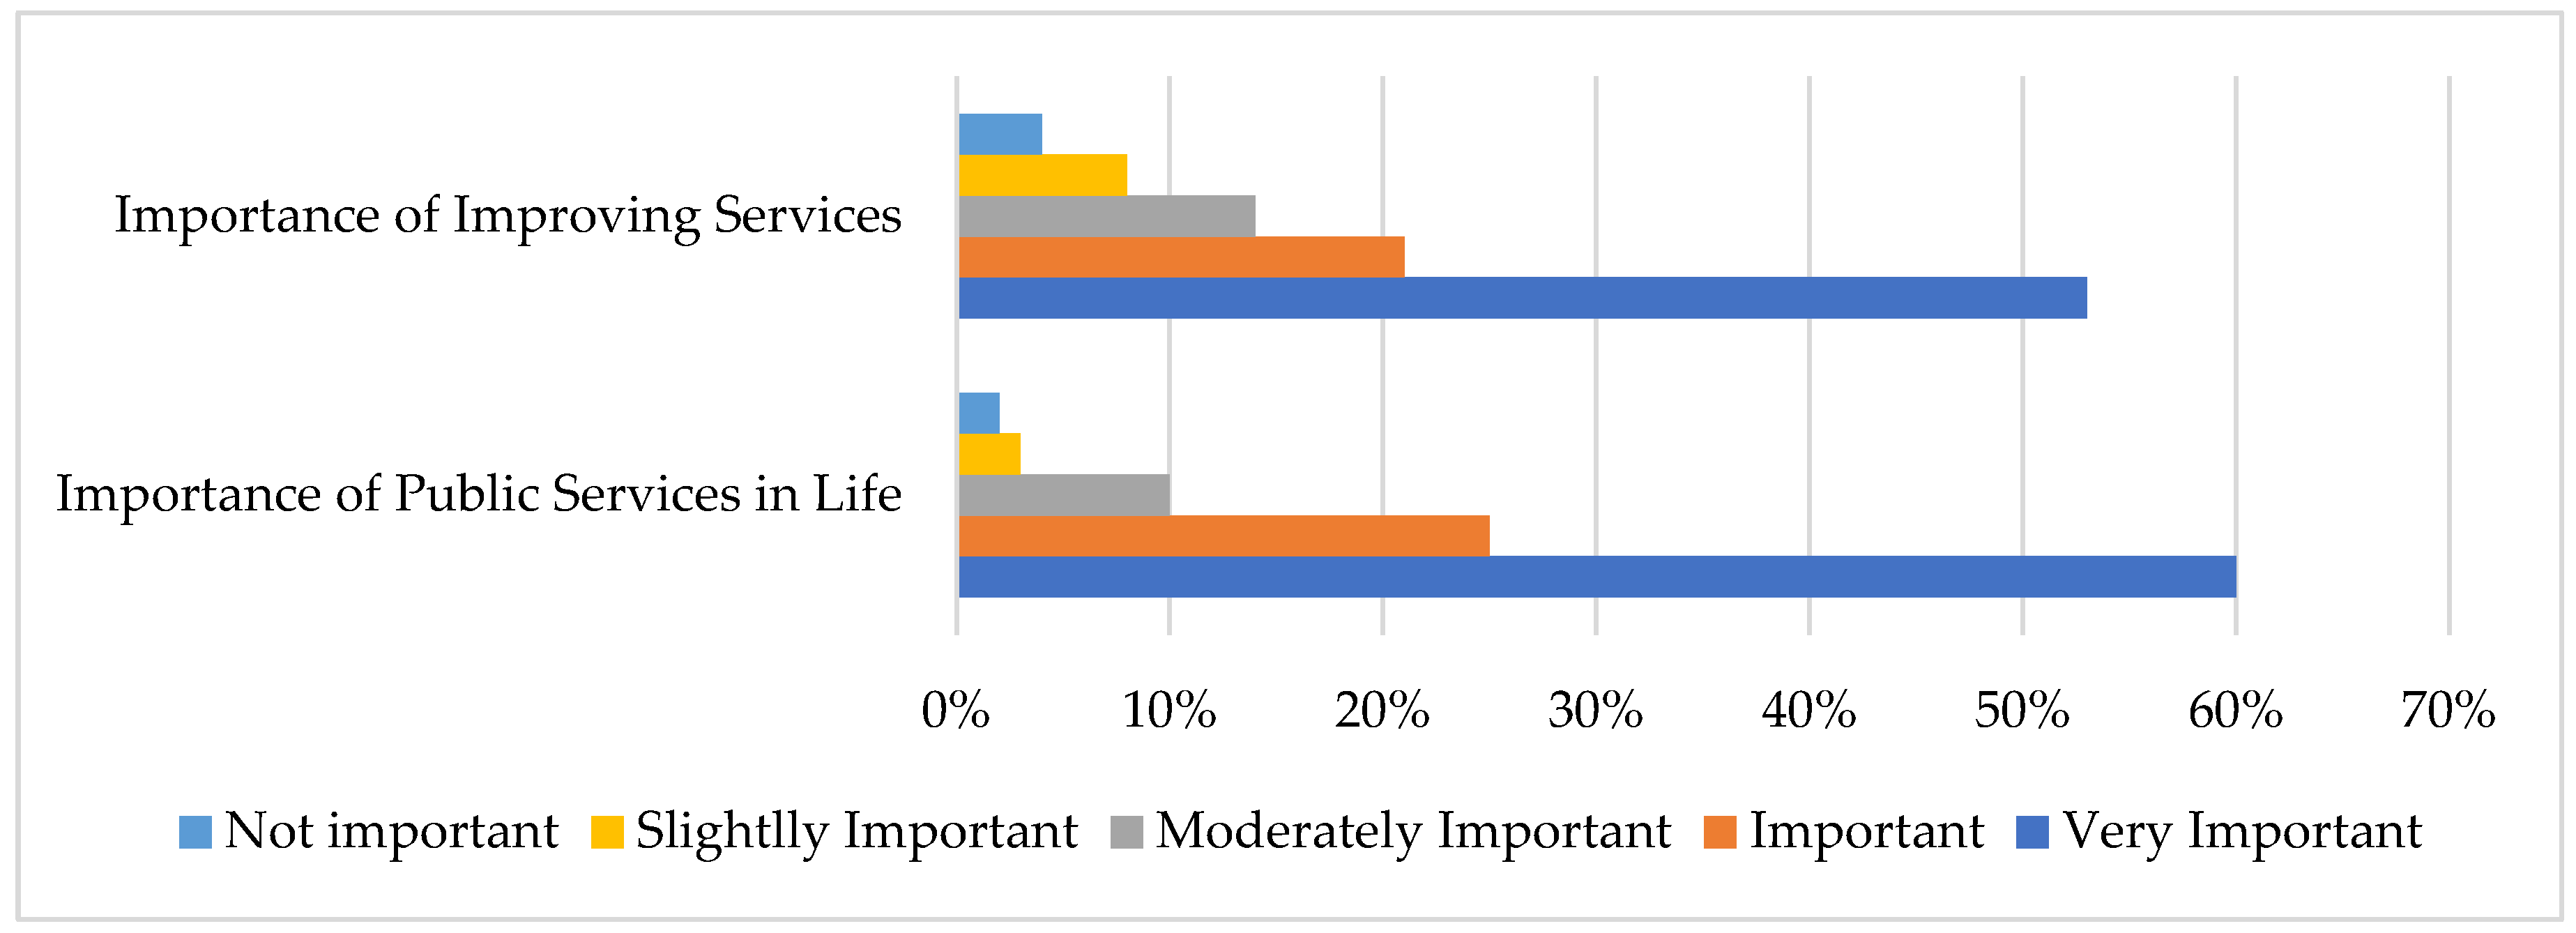
The survey findings also reveal that the majority of residents assign great importance to improving public services, demonstrating a clear link between widespread dissatisfaction and the demand for immediate action by municipal authorities. According to the data, 53% of respondents consider improving the quality of public services to be “very important,” while 21% rate it as “important” (
Figure 3).
Furthermore, citizens’ perception of service quality reflects widespread dissatisfaction, suggesting failures in municipal public administration. This situation is reflected in the population’s satisfaction levels regarding municipal services (
Figure 4).
A total of 45.2% of respondents reported being very dissatisfied, 17.1% dissatisfied, and 27.3% slightly satisfied, while only 4.3% expressed satisfaction. These results were contrasted with specific municipal services, including (a) potable water and drainage supply, (b) waste collection, (c) public lighting, (d) parks and green areas, (e) urban sanitation, (f) administrative services, and (g) payment processing (
Table 6).
4.3. Infrastructure and Efficiency in Public Service Delivery
Citizen perceptions of public services in Ecatepec directly affect public trust in the municipal government’s capacity to manage resources effectively (
Table 7).
The results indicate that only 13.7% of respondents consider that the equipment, facilities, and materials used in public services are modern and adequate. In contrast, 72.6% reported a negative perception, highlighting an outdated infrastructure that limits service efficiency.
4.4. Citizen Priorities for Improving Public Services
Given the recognized importance of public services, analyzing the relationship between citizen satisfaction levels and the perceived importance of improving these public services becomes essential (
Table 8).
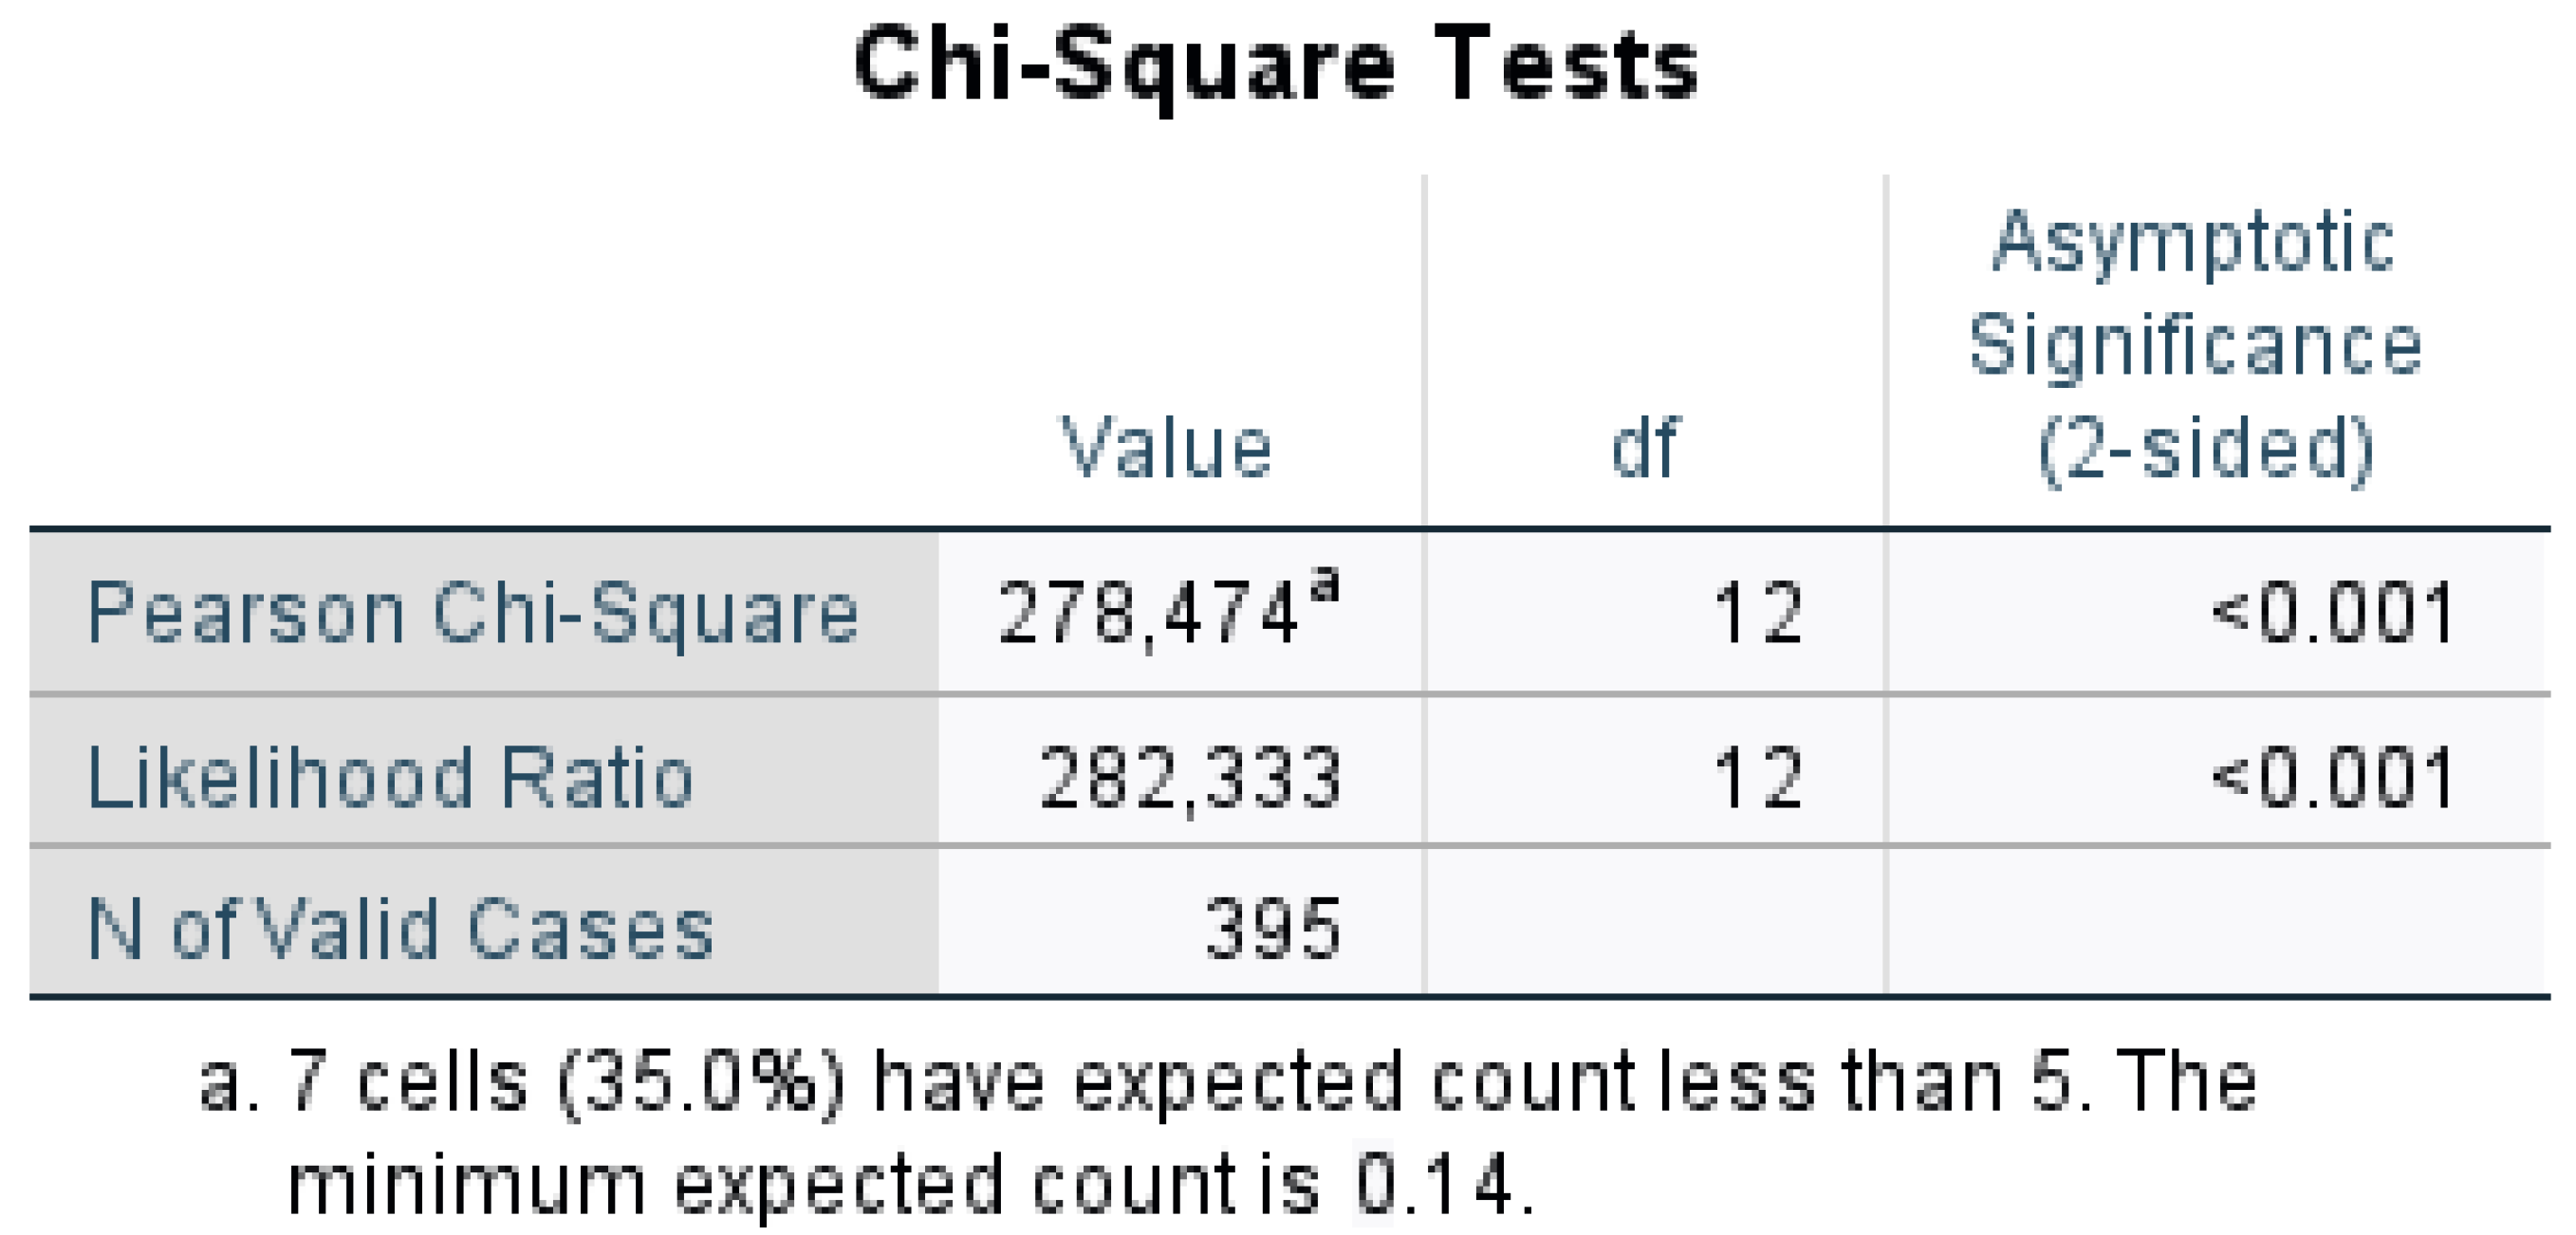
To determine whether the association between the perceived importance of improving public services and citizen satisfaction is statistically significant, a Pearson chi-square test was performed. The test yielded a chi-square value of 278.474, with an asymptotic significance level of
p < 0.001. These results confirm a statistically significant relationship between the two variables, indicating that citizens’ satisfaction levels are closely linked to the importance they place on improving public services (
Figure 5).
These findings support the interpretation that greater dissatisfaction is associated with a higher perceived need for service improvement, underscoring the urgency of addressing citizen concerns through targeted policy responses.
Moreover, the data reveal that among citizens who reported being “very dissatisfied” with public services, 87.9% consider improving these services to be “very important”. This highlights the relevance of understanding how citizens value public services as integral to their quality of life and their willingness to advocate for better provision (
Table 9).
The results indicate that among citizens who consider public services “very important” for their quality of life, 80.3% also classify improvement of them as “very important”.
4.5. Transparency in Budget Management and Citizen Perception
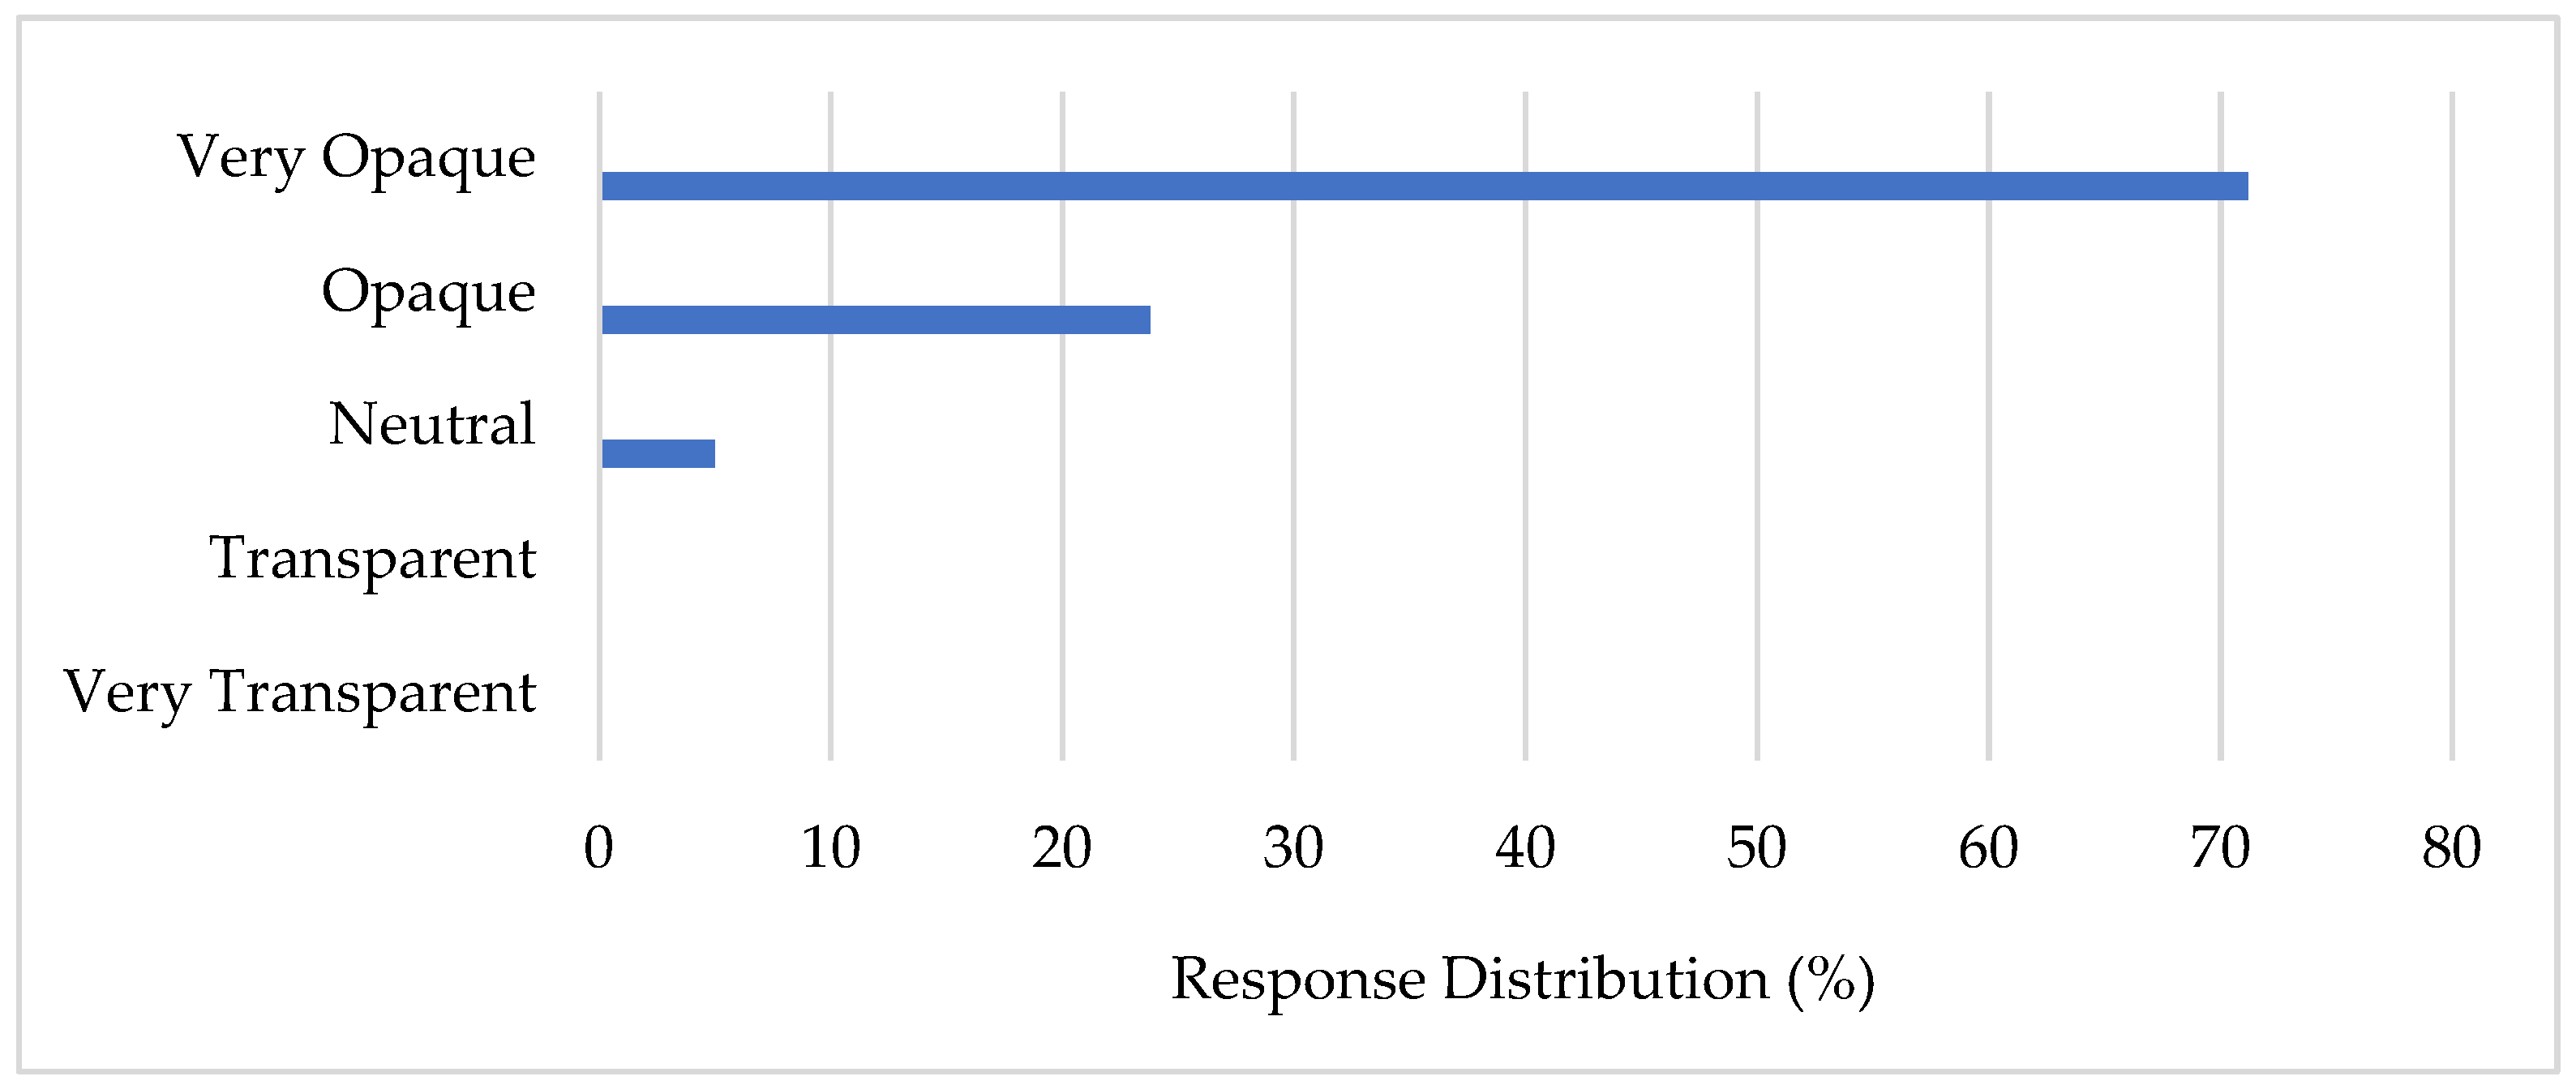
The results reveal a critical challenge in the relationship between citizens and local authorities in Ecatepec: the perception of a profoundly opaque municipal administration. As shown in
Figure 6, a substantial majority of respondents (71.2%) rated the municipal government as “very opaque” and an additional 23.8% as “opaque”. Notably, no respondents rated the administration as “transparent” or “very transparent”. This overwhelming consensus suggests deeply rooted mistrust in the local government’s budgetary and decision-making processes, which significantly undermines institutional legitimacy and hinders effective public engagement.
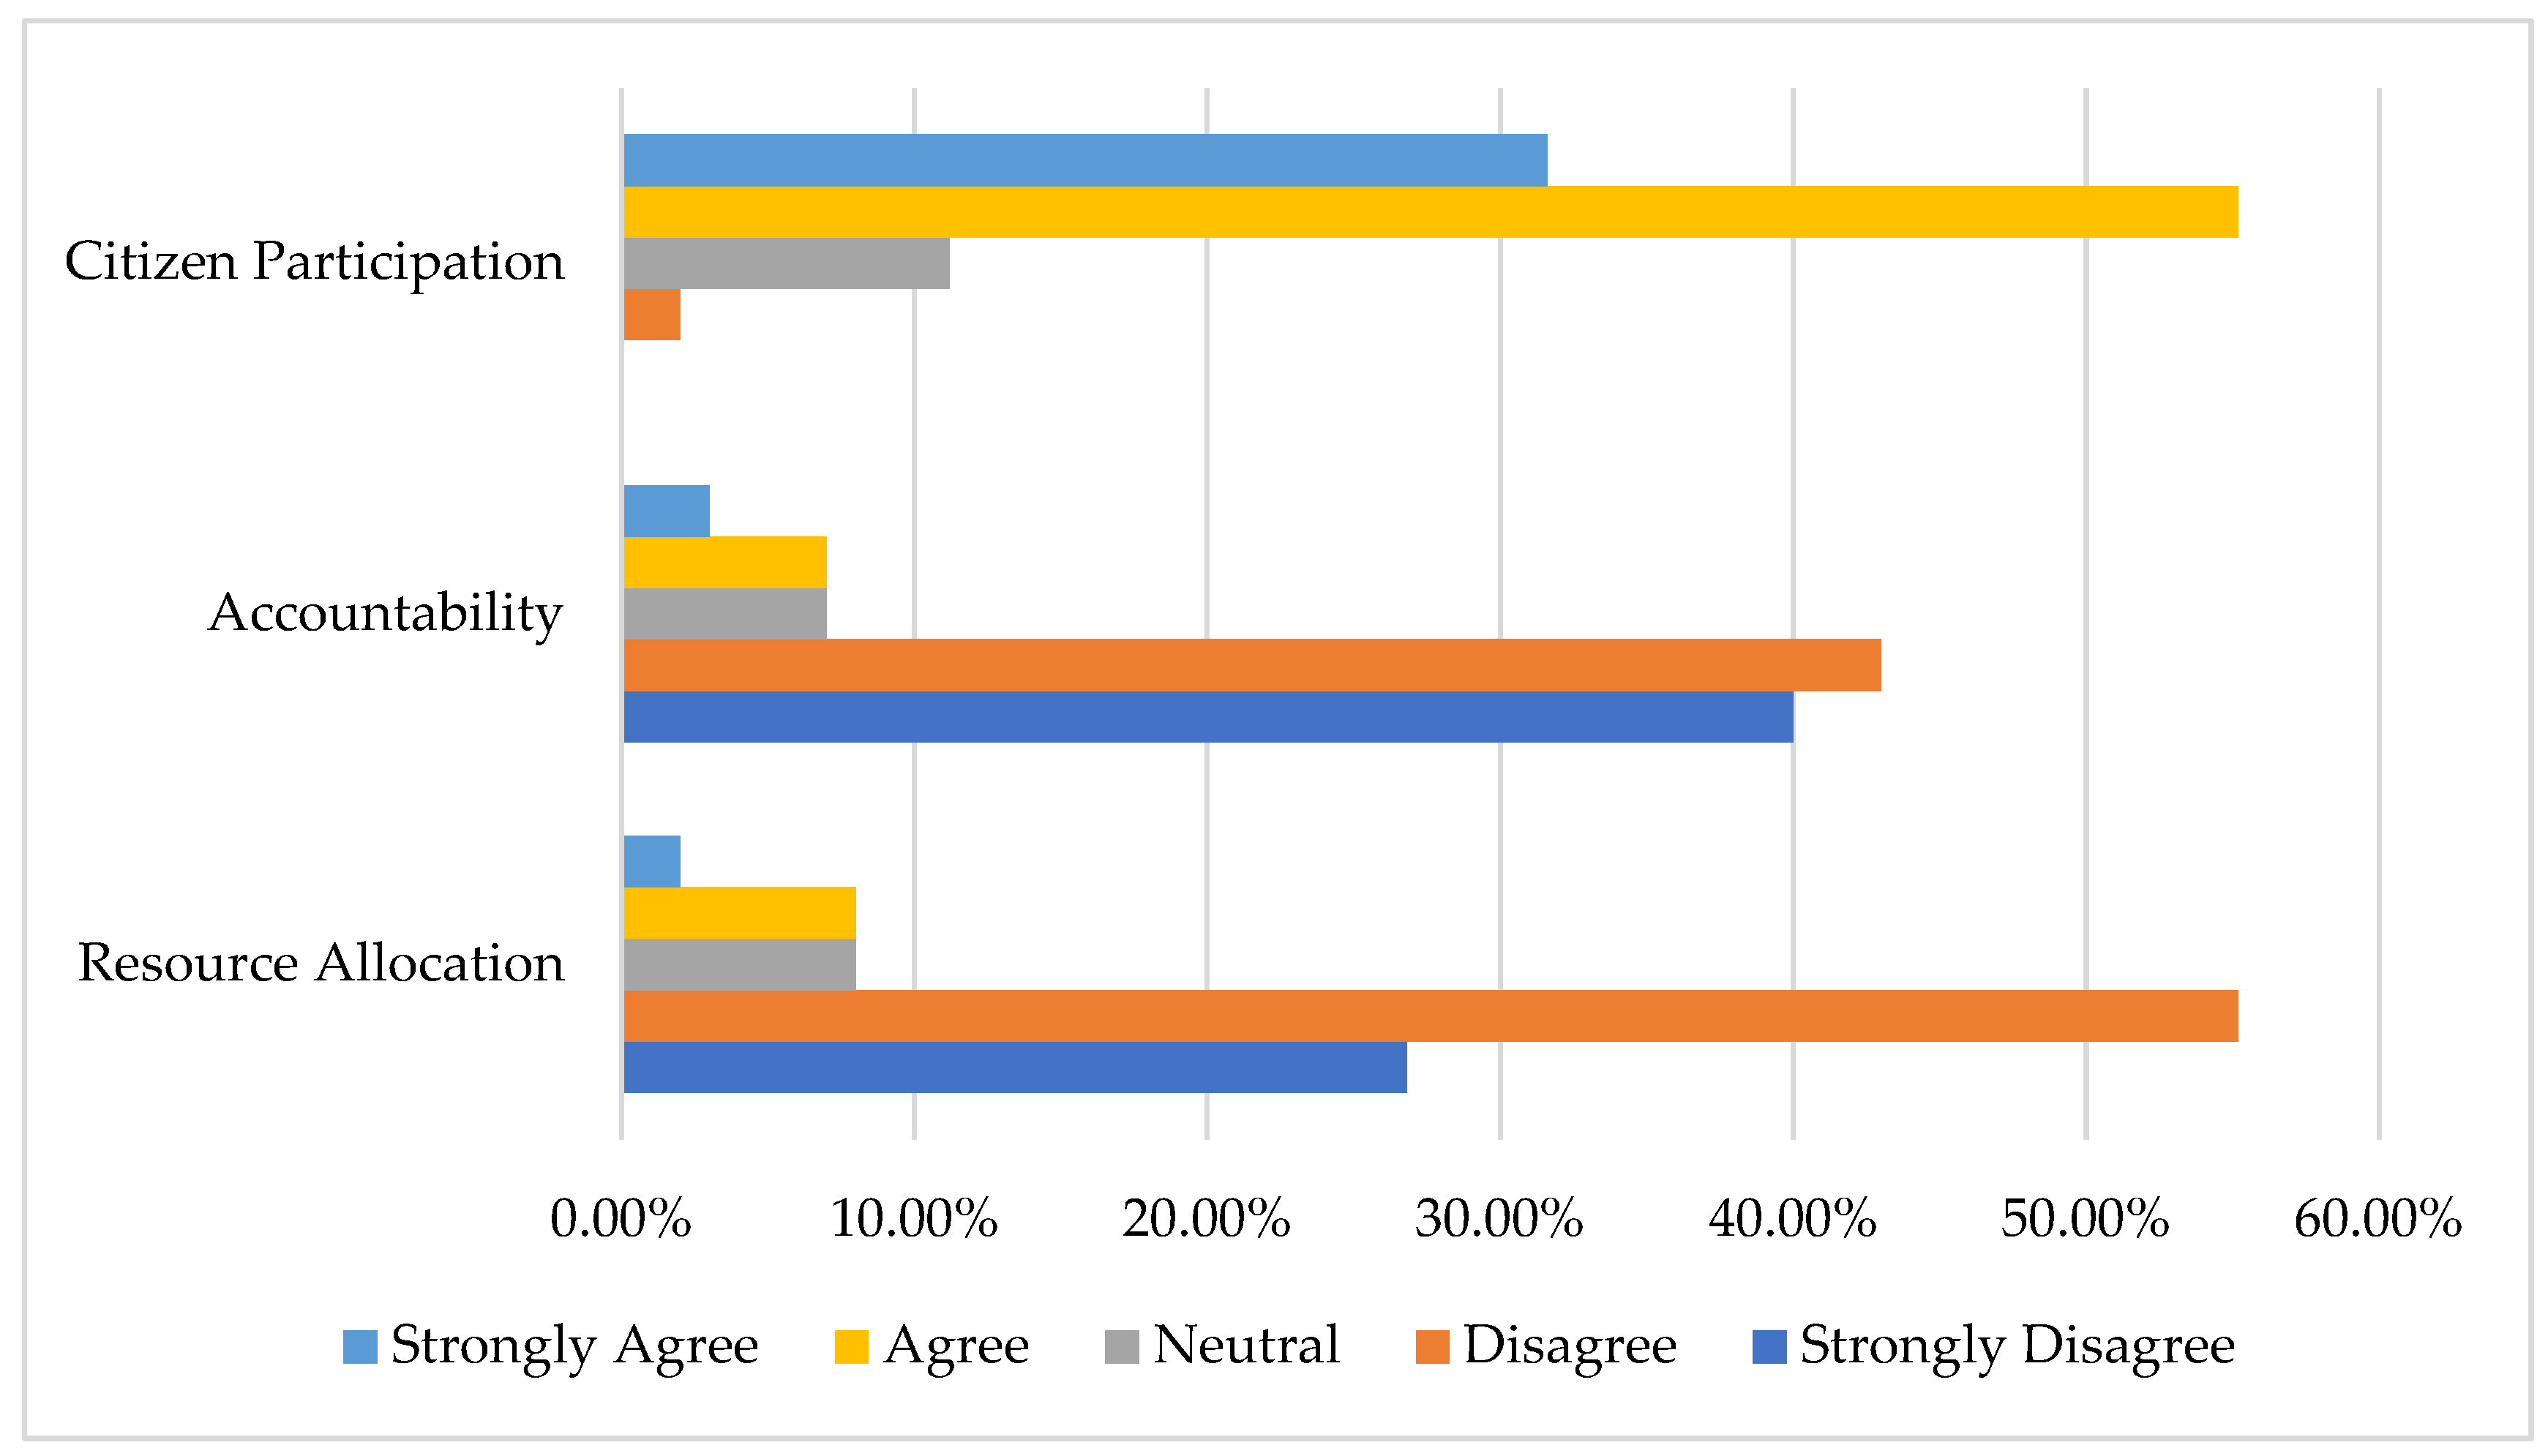
This perception of opacity is further reflected in citizens’ evaluations of three key dimensions of governance: resource allocation, accountability, and citizen participation, as presented in
Figure 7. The data shows a marked dissatisfaction with how municipal resources are distributed. The majority of respondents disagree or strongly disagree with the idea that resources are allocated according to public needs. Similar trends are observed regarding accountability, where responses are predominantly negative. In contrast, perceptions around citizen participation are slightly more favorable, with a higher proportion of agreement and fewer negative responses.
These results point to a paradox: while citizens remain highly critical of how resources are managed and how authorities are held accountable, they also express greater openness toward participatory mechanisms. This suggests an opportunity for municipal authorities to rebuild trust by fostering transparent, participatory processes that align public spending with local priorities.
4.5.1. Relationship Between Transparency and Satisfaction with Public Services
The results (
Table 10) reveal a strong connection between the perception of opacity in governance and dissatisfaction with public services. The majority of citizens who reported being “very dissatisfied” with municipal services also rated the local administration as “very opaque” (81.05%).
To determine whether the perception of transparency in municipal governance is significantly associated with citizen satisfaction with public services, a Pearson chi-square test was conducted. The test yielded a value of 188.135, with a
p-value of <0.001, indicating a statistically significant association between the two variables (
Figure 8).
These findings suggest that more positive perceptions of transparency are associated with greater citizen satisfaction and trust in local government, underscoring the importance of accountability in public administration. Building on this, a key factor in evaluating municipal transparency is its relationship with the priority citizens assign to improving public services (
Table 11).
The results show that 80.77% of respondents who consider improving public services as “very important” also perceive the municipal administration as “very opaque”.
4.5.2. Transparency and the Adequate Use of Public Resources
Similarly, a strong relationship is observed between perceptions of transparency and public opinion on municipal resource management (
Table 12). Data show that among those who perceive the municipality as “very opaque,” 58.36% totally disagree with the statement that public resources are used appropriately, while 30.60% strongly disagree. In contrast, no responses were recorded in the “very transparent” or “transparent” categories, reinforcing the idea of a crisis of confidence in municipal administration.
4.6. Accountability and Citizen Participation in Public Management
The survey results indicate that citizens in Ecatepec perceive a low level of accountability from local authorities, which aligns with the broader perception of opacity in municipal administration. Specifically, 83% of respondents expressed some level of disagreement with the idea that authorities effectively provide accountability regarding the use of public resources (
Figure 7).
In contrast, the data reveal a strong public interest in participating in decisions related to municipal spending. A majority of respondents—with 55.2% agreeing and 31.6% strongly agreeing—believe that citizens should be actively involved in public resource management. This highlights the demand for more inclusive and participatory governance mechanisms in the municipality (
Figure 7).
5. Discussion
5.1. Citizen Perceptions and Dissatisfaction with Municipal Services
The findings of this study reinforce the critical role of public service provision in shaping citizens’ perceptions of government efficiency and legitimacy. Access to quality municipal services is fundamental to social stability and well-being, influencing trust in local institutions and perceptions of transparency in resource management (
Bauhr & Carlitz, 2021;
Musgrave & Musgrave, 1989;
Portugués-Flores, 2023;
Sofyani et al., 2023;
Stiglitz & Rosengard, 2015). However, the widespread dissatisfaction reported in Ecatepec highlights severe structural deficiencies in service delivery, exacerbating governance challenges and undermining institutional credibility.
A key concern identified in the survey is the persistent inefficiency in potable water distribution and drainage maintenance, which poses serious public health risks by increasing exposure to waterborne diseases (
Duran-Juárez & Torres-Rodríguez, 2006;
Evaristo et al., 2023;
Sara de et al., 2024). These issues are compounded by deficiencies in solid waste management, where irregular collection services contribute to environmental pollution and public health hazards (
Abubakar et al., 2022;
Hess et al., 2024;
Ross & Law, 2023). Similarly, inadequate public lighting not only limits mobility but also intensifies perceptions of urban insecurity, aligning with existing research on the correlation between lighting conditions and crime deterrence (
Son et al., 2024;
van Rijswijk & Haans, 2018). The neglect of public parks and green spaces further exacerbates socio-environmental concerns, diminishing opportunities for community engagement and overall urban livability (
Franciskovic, 2013;
Jennings & Bamkole, 2019;
Zhang et al., 2024).
Beyond infrastructure and service quality, administrative inefficiencies significantly impact public perceptions of municipal governance. Excessive bureaucracy, complex documentation requirements, and limited accessibility to municipal offices hinder citizen interaction with local authorities. Dissatisfaction with administrative services—particularly in government procedure management and payment processing—points to operational weaknesses that affect efficiency and responsiveness (
Bannister & Connolly, 2011;
Hartanto et al., 2021;
Hogan et al., 2017;
Ruvalcaba-Gomez & Renteria, 2020). Additionally, the lack of adequate training and responsiveness among public officials emerges as a critical factor fueling dissatisfaction, reinforcing negative perceptions of government capacity and accountability (
Edinov, 2022;
Iskindirova et al., 2024).
These findings align with broader discussions in public administration, emphasizing that service deficiencies not only deteriorate citizen satisfaction but also erode trust in government institutions. The inefficiencies observed in Ecatepec underscore the urgent need for targeted governance reforms that prioritize transparency, participatory decision-making, and service optimization to bridge the gap between government actions and citizen expectations.
5.2. Relationship Between Dissatisfaction with Services and Accountability
The analysis reveals a strong correlation between dissatisfaction with municipal services and perceptions of inadequate governmental accountability. Respondents who perceived higher levels of opacity in municipal management reported greater dissatisfaction with the quality and efficiency of public services. This trend is consistent with previous research, which underscores the role of transparency and accountability in shaping public perceptions of service quality and institutional trust (
Bassols-Ricárdez & Espinosa-Castillo, 2011;
Chen & Neshkova, 2020;
Erkkilä, 2020;
Mendoza-Zamora et al., 2018;
Páez-Moreno et al., 2023;
Philip & Salome, 2023;
Porumbescu, 2015;
Seetharam Sridhar et al., 2020;
Sofyani et al., 2023).
The lack of accountability in local governance not only exacerbates citizen dissatisfaction but also erodes institutional legitimacy, limiting public engagement and reducing compliance with municipal regulations. In contrast, the implementation of robust accountability mechanisms—such as participatory budgeting, open financial reporting, and independent oversight committees—has been shown to improve citizen perceptions of local governance, fostering greater institutional trust and enhancing municipal management practices (
Mr, 2017;
Páez-Moreno et al., 2023;
Seetharam Sridhar et al., 2020;
Sofyani et al., 2023). Strengthening these mechanisms in Ecatepec could help bridge the gap between governmental actions and citizen expectations, ultimately improving service delivery and reinforcing public confidence in local institutions.
5.3. Citizen Participation as Mechanism to Enhance Transparency
A key finding of this study is the strong interest among citizens in actively participating in decisions related to public spending. This presents an opportunity to enhance local governance by fostering participatory mechanisms that improve transparency and align municipal decision-making with community needs. Previous research has demonstrated that citizen participation in budgeting processes contributes to reducing opacity, enhancing public administration efficiency, and ensuring that resource allocation reflects community priorities (
Franciskovic, 2013;
Huarac-Quispe et al., 2022;
Moreira-Macias & Vegas-Meléndez, 2024).
5.4. Implications of the Lack of Accountability on Local Governance
The absence of effective transparency and accountability mechanisms in Ecatepec has profound implications for local governance, negatively affecting both citizen trust and civic engagement. The findings suggest that opaque budget management practices exacerbate dissatisfaction and weaken institutional legitimacy, ultimately undermining the efficient allocation of public resources (
Chen & Neshkova, 2020;
Erkkilä, 2020;
Holzer, 2022;
Philip & Salome, 2023;
Sofyani et al., 2023). Without clear oversight and public access to financial information, municipal decisions remain disconnected from citizen priorities, further deepening governance inefficiencies.
To address these governance deficits, the implementation of strong accountability mechanisms is essential. Strategies such as transparent financial practices, digital platforms for public access to government expenditures, and independent citizen oversight committees have been identified as effective solutions for enhancing accountability in local governance (
de Fine Licht, 2014;
Ganeshu et al., 2023;
Hogan et al., 2017;
Kosack & Fung, 2014;
Ruvalcaba-Gomez & Renteria, 2020). Strengthening transparency and citizen participation can play a pivotal role in reducing dissatisfaction with municipal services while reinforcing trust in local institutions.
Concrete actions, including participatory monitoring, the digitalization of administrative procedures, and the creation of accessible public forums for dialogue, could significantly improve governance efficiency and accountability. These measures not only ensure that municipal decision-making is more inclusive but also strengthen the democratic relationship between citizens and local governments, reinforcing long-term institutional credibility (
Androniceanu, 2021;
Grimmelikhuijsen, 2010;
Kasdin, 2017;
Mendoza-Zamora et al., 2018;
Tavera-Cortés et al., 2024).
6. Conclusions
The findings of this study indicate that perceived opacity in municipal management has a significant negative impact on the relationship between citizens and local authorities in Ecatepec de Morelos. High levels of perceived opacity are closely linked to widespread dissatisfaction with essential public services.
Moreover, the current mechanisms for budget allocation are seen by residents as both insufficient and misaligned with the community’s most pressing needs—such as water supply, sanitation, healthcare, public safety, street and park maintenance, and administrative services. These perceptions highlight a critical gap between government priorities and citizen expectations.
Improving budgetary transparency and promoting citizen participation in decision-making processes are key strategies for strengthening the efficiency and responsiveness of municipal governance. The adoption of participatory practices could significantly increase institutional trust, enhance citizen satisfaction, and ensure that public policies better reflect the real priorities of the local population.
That said, it is important to acknowledge the methodological limitations of this study. Although the sample size was calculated using standard methodological criteria, the survey was based on non-probability convenience sampling. Data collection occurred during a period of high public activity, which allowed access to a diverse range of respondents but does not guarantee statistical representativeness of the broader population. Therefore, the study does not seek to make generalizable inferences but rather to explore prevailing perceptions among residents who engage with municipal services.
Additionally, while the questionnaire was conceptually based on the SERVQUAL model, it was adapted through a pilot test to fit the local context. As such, it cannot be directly compared with studies using the original SERVQUAL instrument. Like most perception-based surveys, the responses are self-reported and may be subject to individual bias. Furthermore, the study focuses on a single municipality with particular governance challenges, which may limit the applicability of the findings to other settings. These considerations do not diminish the value of the research but rather frame it as a context-sensitive, exploratory analysis that can inform future policy and academic discussions.
Future research should consider incorporating mixed-methods approaches and conducting inter-municipal comparisons to gain a more comprehensive understanding of the factors that influence citizen trust and public service delivery across diverse urban contexts.
Ultimately, this research contributes to the innovation of local governance by offering empirical evidence on how citizen perceptions of transparency and service quality can serve as valuable diagnostic tools for improving municipal management. The findings highlight the urgent need to move beyond traditional administrative models toward more participatory and transparent approaches that actively incorporate citizen input in decision-making processes. By embracing these tools, local governments can advance toward a model of data-informed, citizen-centered governance—providing a clear roadmap for authorities seeking to enhance service delivery and rebuild public trust.
Author Contributions
Conceptualization, A.J.T.-S. and M.E.T.-C.; Data curation, A.J.T.-S., Marco M.A.A.-O. and Y.D.O.-H.; Funding acquisition, M.E.T.-C.; Investigation, A.J.T.-S.; Methodology, Marco M.A.A.-O. and Y.D.O.-H.; Project administration, M.E.T.-C.; Resources, A.J.T.-S. and M.E.T.-C.; Supervision, M.E.T.-C., Marco M.A.A.-O. and Y.D.O.-H.; Validation, Marco M.A.A.-O. and Y.D.O.-H.; Writing—original draft, A.J.T.-S. and M.E.T.-C.; Writing—review & editing, A.J.T.-S., Marco M.A.A.-O. and Y.D.O.-H. All authors will be updated at each stage of manuscript processing, including submission, revision, and revision reminder, via emails from our system or the assigned Assistant Editor. All authors have read and agreed to the published version of the manuscript.
Funding
This research received no funding.
Institutional Review Board Statement
The study was conducted according to the guidelines of the Declaration of Helsinki and approved by the Secretaría de Investigación y Posgrado of the Instituto Politénico Nacional (protocol code SeAca-DES-UPIICSA-D-1235-2025 and 24 February 2025).
Informed Consent Statement
Informed consent was obtained from all subjects involved in the study.
Data Availability Statement
The original contributions presented in this study are included in the
Appendix A. Further inquiries can be directed to the corresponding authors.
Acknowledgments
The authors are grateful to the Instituto Politécnico Nacional (IPN) México, Unidad Profesional Interdisciplinaria de Ingeniería y Ciencias Sociales y Administrativas (UPIICSA) for their support; as well as Secretaría de Ciencias, Humanidades, Tecnología e Innovación (SECIHTI) for awarding a grant to the first author to undertake their post-graduate studies in Administration, and Sistema Nacional de Investigadoras e Investigadores (SNII-SECIHTI).
Conflicts of Interest
The authors declare no conflicts of interest.
Abbreviations
The following abbreviations are used in this manuscript:
| IMF | International Monetary Fund |
| ISACS | Municipal Services Satisfaction Index |
| NGDP | National gross domestic product |
Appendix A
Figure A1.
Demographic information and identification of the least satisfactory public service.
Figure A1.
Demographic information and identification of the least satisfactory public service.
Figure A2.
Identification of the least satisfactory public service and perception of public service in Ecatepec de Morelos.
Figure A2.
Identification of the least satisfactory public service and perception of public service in Ecatepec de Morelos.
Figure A3.
Perception of public service in Ecatepec de Morelos and participatory budgeting and transparency.
Figure A3.
Perception of public service in Ecatepec de Morelos and participatory budgeting and transparency.
References
- Abubakar, I. R., Maniruzzaman, K. M., Dano, U. L., AlShihri, F. S., AlShammari, M. S., Ahmed, S. M. S., Al-Gehlani, W. A. G., & Alrawaf, T. I. (2022). Environmental sustainability impacts of solid waste management practices in the global south. International Journal of Environmental Researchand Public Health, 19(19), 12717. [Google Scholar] [CrossRef] [PubMed] [PubMed Central]
- Acevedo-Ortiz, M. A., Lugo-Espinosa, G., & Ortiz-Hernández, Y. D. (2021). Percepciones comunitarias sobre mecanismos de conservación de recursos naturales bajo un enfoque paisajístico en tres ejidos de la Chinantla, Oaxaca. In S. E. Martínez-Pellegrini, J. F. Sarmiento-Franco, & M. C. Valles-Aragón (Eds.), Aproximaciones teórico-metodológicas para el análisis territorial y el desarrollo regional sostenible (Vol. 1, pp. 1–18). Universidad Nacional Autónoma de México, Instituto de Investigaciones Económicas y Asociación Mexicana de Ciencias para el Desarrollo Regional. [Google Scholar]
- Aguilar-Barojas, S. (2005). Fórmulas para el cálculo de la muestra en investigaciones de salud. Salud en Tabasco, 11(1–2), 333–338. [Google Scholar]
- Akın-Basa, Y. N. (2023). Legal function of the public budget [Kamu bütçesinin hukukî fonksiyonu]. Maliye Çalışmaları Dergisi, 1(69), 1–29. [Google Scholar] [CrossRef]
- Androniceanu, A. (2021). Transparency in public administration as a challenge for a good democratic governance. Revista Administratie Si Management Public, 2021(36), 149–164. [Google Scholar] [CrossRef]
- Araujo-Romero, L. A., & López-Marrufo, C. A. (2022). Estado del arte de los estudios del modelo SERVQUAL en la gestión pública. Ciencia Latina Revista Científica Multidisciplinar, 6(6), 6364–6382. [Google Scholar] [CrossRef]
- Bannister, F., & Connolly, R. (2011). The trouble with transparency: A critical review of openness in e-government. Policy & Internet, 3(1), 1–30. [Google Scholar] [CrossRef]
- Bassols-Ricárdez, M., & Espinosa-Castillo, M. (2011). Social construction of urban space: Ecatepec, and Nezahualcoyotl. Two oriental giants. Polis. Investigación y Análisis Sociopolítico y Psicosocial, 7(2), 181–212. [Google Scholar]
- Bauhr, M., & Carlitz, R. (2021). When does transparency improve public services? Street-level discretion, information, and targeting. Public Administration, 99(3), 500–516. [Google Scholar] [CrossRef]
- Cervantes-Pérez, D. R. (2022). Evaluación a municipios del Estado de México 2021. Available online: https://cimtra.org.mx/evaluacion-a-municipios-del-estado-de-mexico-2021/ (accessed on 28 January 2025).
- Chen, C., & Neshkova, M. I. (2020). The effect of fiscal transparency on corruption: A panel cross-country analysis. Public Administration, 98(1), 226–243. [Google Scholar] [CrossRef]
- Comisión Nacional del Agua. (2024). Actualización de la disponibilidad media anual de agua en el acuífero Texcoco (1057), Estado de México. Aguas Subterráneas. Available online: https://sigagis.conagua.gob.mx/gas1/Edos_Acuiferos_18/edomex/DR_1507.pdf (accessed on 17 March 2024).
- Consejo Nacional de Evaluación de la Política de Desarrollo Social. (2021). Pobreza a nivel municipio 2010–2020. Available online: https://www.coneval.org.mx/Medicion/Paginas/Pobreza-municipio-2010-2020.aspx (accessed on 28 January 2025).
- de Fine Licht, J. (2014). Transparency actually: How transparency affects public perceptions of political decision-making. European Political Science Review, 6(2), 309–330. [Google Scholar] [CrossRef]
- DeVellis, R. F. (2016). Scale development: Theory and applications (4th ed.). SAGE Publications. [Google Scholar]
- Duran-Juárez, J. M., & Torres-Rodríguez, A. (2006). Los problemas del abastecimiento de agua potable en una ciudad media. Espiral, 12(36), 129–162. [Google Scholar]
- Edinov, S. (2022). Does competence improve the factors that affect good governance? Governors, 1(1), 15–23. [Google Scholar] [CrossRef]
- Elliott, I. C., Puppim de Oliveira, J. A., & Wu, A. M. (2024). Public administration and development in (historical) perspective. Public Administration and Development, 44(4), 298–314. [Google Scholar] [CrossRef]
- Erkkilä, T. (2020). Transparency in public administration. Available online: https://oxfordre.com/politics/view/10.1093/acrefore/9780190228637.001.0001/acrefore-9780190228637-e-1404 (accessed on 28 January 2025).
- Eslava-Zapata, R. A., Chacón-Guerrero, E. J., & Gonzalez-Júnior, H. A. (2019). Gestión del Presupuesto Público: Alcance y limitaciones. Visión Internacional (Cúcuta), 2(1), 18–24. [Google Scholar] [CrossRef]
- Evaristo, J., Jameel, Y., Tortajada, C., Wang, R. Y., Horne, J., Neukrug, H., David, C. P., Fasnacht, A. M., Ziegler, A. D., & Biswas, A. (2023). Water woes: The institutional challenges in achieving SDG 6. Sustainable Earth Reviews, 6(1), 13. [Google Scholar] [CrossRef]
- Franciskovic, J. (2013). Retos de la gestión pública: Presupuesto por resultados y rendición de cuentas. Journal of Economics Finance and Administrative Science, 18, 28–32. [Google Scholar] [CrossRef]
- Gabinete de Comunicación Estratégico. (2019). Ciudades más habitables 2019. Available online: https://gabinete.mx/index.php/es/ciudades-mas-habitables-2019 (accessed on 28 January 2025).
- Ganeshu, P., Fernando, T., & Keraminiyage, K. (2023). Barriers to, and enablers for, stakeholder collaboration in risk-sensitive urban planning: A systematised literature review. Sustainability, 15(5), 4600. [Google Scholar] [CrossRef]
- Gobierno de Ecatepec de Morelos. (2022). Bando municipal de Ecatepec de Morelos. Available online: https://legislacion.edomex.gob.mx/sites/legislacion.edomex.gob.mx/files/files/pdf/bdo/bdo2022/bdo034.pdf (accessed on 20 March 2024).
- Gobierno del Estado de México. (2020). IMAE. Índice Municipal de Actividad Económica 2020. Available online: https://igecem.edomex.gob.mx/sites/igecem.edomex.gob.mx/files/files/ArchivosPDF/Productos-Estadisticos/Indole-Economica/PIB/IMAE%202020.pdf (accessed on 17 March 2024).
- Gobierno de Zapopan. (2020). Presupuesto participativo 2020. Informe de Resultados. Available online: https://www.zapopan.gob.mx/wp-content/uploads/2020/04/Informe_de_resultados_P_2020.pdf (accessed on 28 January 2025).
- Grimmelikhuijsen, S. G. (2010). Transparency of public decision-making: Towards trust in local government? Policy & Internet, 2(1), 5–35. [Google Scholar] [CrossRef]
- Grimmelikhuijsen, S. G., & Meijer, A. J. (2014). Effects of Transparency on the perceived trustworthiness of a government organization: Evidence from an online experiment. Journal of Public Administration Research and Theory, 24(1), 137–157. [Google Scholar] [CrossRef]
- Hartanto, D., Dalle, J., Akrim, A., & Anisah, H. U. (2021). Perceived effectiveness of e-governance as an underlying mechanism between good governance and public trust: A case of Indonesia. Digital Policy, Regulation and Governance, 23(6), 598–616. [Google Scholar] [CrossRef]
- Heckathorn, D. D. (2011). Comment: Snowball versus respondent-driven sampling. Sociological Methodology, 41(1), 355–366. [Google Scholar] [CrossRef]
- Hernández-Sampieri, R., & Fernández-Collado, C. (2010). Metodología de la investigación (5th ed.). McGraw-Hill. [Google Scholar]
- Hess, C., Dragomir, A. G., Doerner, K. F., & Vigo, D. (2024). Waste collection routing: A survey on problems and methods. Central European Journal of Operations Research, 32(2), 399–434. [Google Scholar] [CrossRef]
- Hogan, M., Ojo, A., Harney, O., Ruijer, E., Meijer, A., Andriessen, J., Pardijs, M., Boscolo, P., Palmisano, E., Satta, M., Groff, J., Baker, M., Détienne, F., Porwol, L., Scarano, V., & Malandrino, D. (2017). Governance, transparency and the collaborative design of open data collaboration platforms: Understanding barriers, options, and needs. In A. Ojo, & J. Millard (Eds.), Government 3.0—Next generation government technology infrastructure and services: Roadmaps, enabling technologies & challenges (pp. 299–332). Springer International Publishing. [Google Scholar]
- Holzer, M. (2022). Public administration at a crossroad: Five enduring challenges. Chinese Public Administration Review, 13(3), 125–136. [Google Scholar] [CrossRef]
- Huarac-Quispe, Y., Díaz-Mújica, M. C., & Cuba-Mayuri, E. E. (2022). Participatory budget and public expenditure management. Revista de Ciencias Sociales, 28(5), 279–289. [Google Scholar]
- IBM Corp. Released 2023. (2023). IBM SPSS statistics for windows. (Version 29.0.2.0). IBM Corp.
- Ilker, E., Sulaiman-Abubakar, M., & Rukayya-Sunusi, A. (2015). Comparison of convenience sampling and purposive sampling. American Journal of Theoretical and Applied Statistics, 5(1), 1–4. [Google Scholar] [CrossRef]
- Instituto Nacional de Estadística Geografía e Informática. (2021). Producto interno bruto por entidad federativa 2020. Available online: https://www.inegi.org.mx/contenidos/saladeprensa/boletines/2021/pibe/PIBEntFed2020.pdf (accessed on 27 July 2021).
- Instituto Nacional de Estadística Geografía e Informática. (2023a). Encuesta nacional de seguridad pública urbana 2023. Available online: https://www.inegi.org.mx/contenidos/saladeprensa/boletines/2023/ensu/ensu2023_10.pdf (accessed on 9 May 2023).
- Instituto Nacional de Estadística Geografía e Informática. (2023b). Población en situación de pobreza por entidad federativa según grado, 2018, 2020 y 2022. Available online: https://www.inegi.org.mx/app/tabulados/interactivos/?pxq=Hogares_Hogares_15_9954f9c6-9512-40c5-9cbf-1b2ce96283e4&idrt=54&opc=t (accessed on 28 January 2025).
- Instituto Nacional de Estadística y Geografía [INEGI]. (2020). Presentación de resultados: Censo de población y vivienda 2020. Estados Unidos Mexicanos. INEGI. Available online: https://www.inegi.org.mx/programas/ccpv/2020/ (accessed on 26 March 2025).
- Inter-American Development Bank. (2021). Dominican republic to strengthen public sector transparency, integrity with IDB support. Available online: https://www.iadb.org/en/news/dominican-republic-strengthen-public-sector-transparency-integrity-idb-support (accessed on 28 January 2025).
- International Monetary Fund. (2007). Manual on fiscal transparency. International Monetary Fund. [Google Scholar]
- Iskindirova, Z., Bekbayev, A., & Bukanova, Z. (2024). Strengthening governance: The role of continuous learning in enhancing professional competence of local government. Journal of Philosophy, Culture and Political Science, 89(3), 79–89. [Google Scholar] [CrossRef]
- Jennings, V., & Bamkole, O. (2019). The relationship between social cohesion and urban green space: An avenue for health promotion. International Journal of Environmental Researchand Public Health, 16(3), 452. [Google Scholar] [CrossRef] [PubMed] [PubMed Central]
- Kaplan, R. S., & Norton, D. P. (1996). The balanced scorecard: Translating strategy into action. Harvard Business Press. [Google Scholar]
- Kasdin, S. (2017). An evaluation framework for budget reforms: A guide for assessing public budget systems and selecting budget process reforms. International Journal of Public Administration, 40(2), 150–163. [Google Scholar] [CrossRef]
- Khasiani, K., Koshim, Y., Mfombouot, A., & Singh, A. (2020). Budget execution controls to mitigate corruption risk in pandemic spending. Special series on COVID-19. Fiscal issues. Available online: https://www.imf.org/-/media/Files/Publications/covid19-special-notes/enspecial-series-on-covid19budget-execution-controls-to-mitigate-corruption-risk-in-pandemic-spendin.ashx (accessed on 26 March 2025).
- Kosack, S., & Fung, A. (2014). Does transparency improve governance? Annual Review of Political Science, 17(2014), 65–87. [Google Scholar] [CrossRef]
- Marques, I., Leitão, J., Carvalho, A., & Pereira, D. (2021). Public administration and values oriented to sustainability: A systematic approach to the literature. Sustainability, 13(5), 2566. [Google Scholar] [CrossRef]
- Mendoza-Zamora, W. M., Loor-Carvajal, V. M., Salazar-Pin, G. E., & Nieto-Parrales, D. A. (2018). La asignación presupuestaria y su incidencia en la Administración Pública. Dominio de las Ciencias, 4(3), 313–333. [Google Scholar] [CrossRef]
- Moreira-Macias, M., & Vegas-Meléndez, H. (2024). Participatory budgeting for public policy making. A view from the discourse of institutional governance. 593 Digital Publisher CEIT, 9(1), 479–496. [Google Scholar] [CrossRef]
- Mr, K. (2017, November 23–25). The concept of accountability in good governance. Proceedings of the International Conference on Democracy, Accountability and Governance (ICODAG 2017), Pekanbaru, Indonesia. [Google Scholar]
- Musgrave, R. A., & Musgrave, P. B. (1989). Public finance in theory and practice (5th ed.). McGraw-Hill International Book Company. [Google Scholar]
- Oviedo, H. C., & Campo-Arias, A. (2005). Aproximación al uso del coeficiente alfa de Cronbach. Revista Colombiana de Psiquiatría, 34(4), 572–580. [Google Scholar]
- Páez-Moreno, Á. E., Ibarra-Sánchez, C. D., Ríos-Incio, F. A., & Rodríguez-Casallas, D. F. (2023). Evolución de la noción de transparencia y rendición de cuentas en el sector público. Justicia, 28(44), 183–196. [Google Scholar] [CrossRef]
- Philip, A., & Salome, M. (2023). Public budget management techniques and financial governance. African Journal of Emerging Issues, 5(17), 22–40. [Google Scholar]
- Portugués-Flores, D. (2023). La actual deficiencia de los servicios públicos en Ecatepec de Morelos. La división del municipio como solución. Alegatos, (113), 139–157. [Google Scholar]
- Porumbescu, G. A. (2015). Does transparency improve citizens’ perceptions of government performance? Evidence from Seoul, South Korea. Administration & Society, 49(3), 443–468. [Google Scholar] [CrossRef]
- Ross, D. E., & Law, H. J. (2023). Evolution of municipal solid waste management in North America. Waste Management & Research, 41(7), 1177–1187. [Google Scholar] [CrossRef]
- Ruvalcaba-Gomez, E. A., & Renteria, C. (2020). Contrasting perceptions about transparency, citizen participation, and open government between civil society organization and government. Information Polity, 25, 323–337. [Google Scholar] [CrossRef]
- Sara de, W., Euphrasia, L., David, B., Joe, B., Jayant, B., Barbara, E., Matthew, C. F., Guy, H., Isha, R., Ian, R., Sheillah, S., Oliver, C., & Clare, I. R. C. (2024). Water, sanitation and hygiene (WASH): The evolution of a global health and development sector. BMJ Global Health, 9(10), e015367. [Google Scholar] [CrossRef]
- Seetharam Sridhar, K., Gadgil, R., & Dhingra, C. (2020). Good governance in the transparency, accountability, public participation and capacity (TAP-C) framework. In K. S. Sridhar, R. Gadgil, & C. Dhingra (Eds.), Paving the way for better governance in urban transport: The transport governance initiative (pp. 1–18). Springer. [Google Scholar]
- Silva, A. F., Sánchez-Hernández, M. I., & Carvalho, L. C. (2023). Local public administration in the process of implementing sustainable development goals. Sustainability, 15(21), 15263. [Google Scholar] [CrossRef]
- Sofyani, H., Yaya, R., & Saleh, Z. (2023). Transparency and community trust in village government: Does corruption perception matter? Financial Accountability & Management, 39(2), 355–374. [Google Scholar] [CrossRef]
- Son, D., Im, B., Her, J., Park, W., Kang, S.-J., & Kim, S.-N. (2024). Street lighting environment and fear of crime: A simulated virtual reality experiment. Virtual Reality, 29(1), 8. [Google Scholar] [CrossRef]
- Stiglitz, J. E., & Rosengard, J. K. (2015). Economics of the public sector (4th ed.). W. W. Norton & Company. [Google Scholar]
- Tavera-Cortés, M. E., Torres-Sandoval, A. J., & Sandoval-Gómez, R. J. (2024). Asignación eficiente del presupuesto en México. Revista Iberoamericana para la Investigación y el Desarrollo Educativo, 14(28), 1–33. [Google Scholar] [CrossRef]
- van Rijswijk, L., & Haans, A. (2018). Illuminating for safety: Investigating the role of lighting appraisals on the perception of safety in the urban environment. Environ Behav, 50(8), 889–912. [Google Scholar] [CrossRef] [PubMed Central]
- Vargas-Merino, J. A., & Zavaleta-Chávez, W. E. (2020). La gestión del presupuesto por resultados y la calidad del gasto en gobiernos locales. Revista Científica Visión de Futuro, 24(2), 37–59. [Google Scholar] [CrossRef]
- Venard, B., & Tshering, K. (2021). Barriers to transparency in Bhutan’s public administration: A new typology of opacity. Public Administration and Development, 41(4), 203–216. [Google Scholar] [CrossRef]
- Zhang, W., Yang, B., Wang, R., & Guo, X. (2024). An analysis of the effects of different urban park space environment construction on national health. Frontiers in Environmental Science, 12, 1433319. [Google Scholar] [CrossRef]
Figure 2.
Key variables and their interaction in municipal governance.
Figure 2.
Key variables and their interaction in municipal governance.
Figure 3.
Perceived importance of municipal public services in quality of life.
Figure 3.
Perceived importance of municipal public services in quality of life.
Figure 4.
Public satisfaction with the quality of municipal services in Ecatepec de Morelos. Question: Are you satisfied with the quality of public services in Ecatepec de Morelos?
Figure 4.
Public satisfaction with the quality of municipal services in Ecatepec de Morelos. Question: Are you satisfied with the quality of public services in Ecatepec de Morelos?
Figure 5.
Chi-square test results based on data from
Table 8.
Figure 5.
Chi-square test results based on data from
Table 8.
Figure 6.
Public perception of transparency in municipal budget management in Ecatepec. Question: How would you rate the level of transparency in the municipality of Ecatepec?
Figure 6.
Public perception of transparency in municipal budget management in Ecatepec. Question: How would you rate the level of transparency in the municipality of Ecatepec?
Figure 7.
Public perceptions on transparency, accountability, and participation.
Figure 7.
Public perceptions on transparency, accountability, and participation.
Figure 8.
Chi-square test results for
Table 10.
Figure 8.
Chi-square test results for
Table 10.
Table 1.
Comparison of public spending, population, and poverty in Mexico’s largest municipalities.
Table 1.
Comparison of public spending, population, and poverty in Mexico’s largest municipalities.
| Municipality | Population | Population in Poverty (%) | 2023 Budget (Million MXN) |
|---|
| Tijuana | 1,922,523 | 23.58 | 8855 |
| Iztapalapa | 1,835,486 | 43.9 | 6161 |
| León | 1,721,215 | 47.45 | 7835 |
| Ecatepec | 1,645,352 | 47.54 | 5810 |
| Ciudad Juárez | 1,512,450 | 25.07 | 8364 |
| Zapopan | 1,476,491 | 26.27 | 9600 |
| Guadalajara | 1,385,629 | 24.29 | 10,602 |
| Gustavo A. Madero | 1,173,351 | 32.53 | 5025 |
| Monterrey | 1,142,994 | 27.4 | 7191 |
Table 2.
Phases of the survey process on public administration perception in Ecatepec.
Table 2.
Phases of the survey process on public administration perception in Ecatepec.
| Phase | Description |
|---|
| 1. Survey design | A structured questionnaire was developed to assess municipal management and public services. A Likert scale was used to measure perceptions. |
| 2. Sample selection | Convenience sampling was employed, considering logistical constraints and resource availability. |
| 3. Survey administration | The survey was conducted in person, ensuring participants’ informed consent. |
| 4. Instrument validation | The reliability of the questionnaire was assessed using Cronbach’s alpha coefficient. |
| 5. Data analysis | Data were processed in a structured database and analyzed comparatively to identify patterns and differences. |
Table 3.
Gender distribution of respondents.
Table 3.
Gender distribution of respondents.
| Gender | Distribution (%) |
|---|
| Women | 55 |
| Men | 45 |
Table 4.
Age distribution of respondents.
Table 4.
Age distribution of respondents.
| Age Range | Distribution (%) |
|---|
| 18–24 years | 13 |
| 25–34 years | 39 |
| 35–44 years | 28 |
| 45–54 years | 12 |
| Over 54 years | 8 |
Table 5.
Length of residence in the municipality.
Table 5.
Length of residence in the municipality.
| Length of Residence | Distribution (%) |
|---|
| Less than a year | 5 |
| 1–5 years | 9 |
| 6–10 years | 19 |
| More than 10 years | 67 |
Table 6.
Satisfaction levels with specific public services in Ecatepec de Morelos.
Table 6.
Satisfaction levels with specific public services in Ecatepec de Morelos.
| Service | Very Satisfied (%) | Satisfied (%) | Slightly Satisfied (%) | Dissatisfied (%) | Very Dissatisfied (%) |
|---|
| Potable water and drainage | 0 | 2.30 | 19.50 | 30.40 | 47.80 |
| Garbage collection | 0 | 3.30 | 23.30 | 49.60 | 23.80 |
| Public lighting | 0.30 | 9.40 | 36.20 | 30.60 | 23.50 |
| Parks and gardens | 0.50 | 11.40 | 26.30 | 43 | 18.70 |
| Urban cleaning | 0.30 | 5.60 | 25.80 | 38.50 | 29.90 |
| Administrative procedures | 0.50 | 6.10 | 20.50 | 48.60 | 24.30 |
| Service payments | 0.50 | 5.80 | 19.50 | 35.40 | 38.70 |
Table 7.
Public perception of infrastructure, service efficiency, and administrative performance in Ecatepec.
Table 7.
Public perception of infrastructure, service efficiency, and administrative performance in Ecatepec.
| Statement | Strongly Agree (%) | Agree (%) | Neutral (%) | Disagree (%) | Strongly Disagree (%) |
|---|
| Do you consider the equipment, facilities, and materials used by public services in Ecatepec to be modern and adequate? | 0.80 | 12.90 | 13.70 | 42 | 30.60 |
| The documentation used to provide public services (forms, applications) is appropriate and easy to understand. | 0.80 | 11.40 | 12.90 | 36.70 | 38.20 |
| The facilities where the services are provided are accessible (easy to reach and with convenient hours). | 1.50 | 10.90 | 12.40 | 46.10 | 29.10 |
| Do public services in Ecatepec meet the promised deadlines and schedules? | 1 | 8.90 | 11.90 | 40 | 38.20 |
| Are public service employees in Ecatepec competent in their work? | 0.80 | 7.80 | 13.70 | 47.80 | 29.90 |
| Do public officials respond adequately to your needs and questions? | 0.80 | 7.30 | 12.20 | 38 | 41.80 |
| Do public services in Ecatepec effectively resolve your problems or concerns? | 0.80 | 9.40 | 10.40 | 47.10 | 32.40 |
| Do public officials have the necessary training for service delivery? | 0.50 | 7.30 | 11.10 | 38.70 | 42.30 |
| Does the public service provide clear and accurate information about the services it offers? | 0.50 | 7.80 | 13.90 | 46.30 | 31.40 |
| Do public officials demonstrate a genuine commitment to solving your problems and meeting your needs? | 2.30 | 18.70 | 19.20 | 32.40 | 27.30 |
| Are public officials friendly and courteous in their interactions? | 2.30 | 23.30 | 17.70 | 36.50 | 20.30 |
Table 8.
Perceived importance of improving public services vs. satisfaction with public services.
Table 8.
Perceived importance of improving public services vs. satisfaction with public services.
| Satisfaction with Public Services * | Very Important (%) | Important (%) | Moderately Important (%) | Slightly Important (%) | Not Important (%) |
|---|
| Dissatisfied | 22.2 | 56.9 | 11.1 | 9.7 | 0 |
| Very dissatisfied | 87.9 | 9.5 | 0.5 | 1.1 | 1.1 |
| Slightly satisfied | 21.7 | 19.1 | 46.1 | 12.2 | 0.9 |
| Satisfied | 0 | 11.1 | 50 | 38.9 | 0 |
Table 9.
Perceived importance of public services in quality of life vs. importance of improving public services.
Table 9.
Perceived importance of public services in quality of life vs. importance of improving public services.
| | | Perceived Importance of Public Services in Quality of Life |
|---|
| | | Very Important (%) | Important (%) | Moderately Important (%) | Slightly Important (%) | Not Important (%) |
|---|
| Importance of Improving Public Services * | Very important | 80.3 | 17.8 | 1.9 | 0 | 0 |
| Important | 32.5 | 51.8 | 15.7 | 0 | 0 |
| Moderately important | 8.5 | 35.2 | 45.1 | 11.3 | 0 |
| Slightly important | 10.0 | 16.7 | 30.0 | 40.0 | 3.3 |
| Not important | 66.7 | 0 | 0 | 33.3 | 0 |
Table 10.
Perception of transparency vs. satisfaction with public services.
Table 10.
Perception of transparency vs. satisfaction with public services.
| Satisfaction with Public Services * | Very Opaque (%) | Opaque (%) | Neutral (%) | Transparent (%) | Very Transparent (%) |
|---|
| Very dissatisfied | 81.05 | 18.42 | 0.53 | 0 | 0 |
| Dissatisfied | 66.67 | 30.56 | 2.78 | 0 | 0 |
| Slightly satisfied | 67.83 | 28.70 | 3.48 | 0 | 0 |
| Satisfied | 5.56 | 22.22 | 72.22 | 0 | 0 |
Table 11.
Perception of transparency vs. importance of improving public services.
Table 11.
Perception of transparency vs. importance of improving public services.
| Importance of Improving Public Services * | Very Opaque (%) | Opaque (%) | Neutral (%) | Transparent (%) | Very Transparent (%) |
|---|
| Very important | 80.77 | 18.27 | 0.96 | 0 | 0 |
| Important | 63.86 | 31.33 | 4.82 | 0 | 0 |
| Moderately important | 60.56 | 29.58 | 9.86 | 0 | 0 |
| Slightly important | 46.67 | 30.00 | 23.33 | 0 | 0 |
| Not important | 100.00 | 0 | 0 | 0 | 0 |
Table 12.
Perception of transparency vs. adequacy of public resource allocation.
Table 12.
Perception of transparency vs. adequacy of public resource allocation.
| Perception of Transparency in the Municipality * | Strongly Agree (%) | Agree (%) | Neutral (%) | Disagree (%) | Strongly Disagree (%) |
|---|
| Very opaque | 0 | 2.49 | 8.54 | 58.36 | 30.6 |
| Opaque | 0 | 3.19 | 20.21 | 55.32 | 21.28 |
| Neutral | 0 | 40 | 50 | 10 | 0 |
| Transparent | 0 | 0 | 0 | 0 | 0 |
| Very transparent | 0 | 0 | 0 | 0 | 0 |
| Disclaimer/Publisher’s Note: The statements, opinions and data contained in all publications are solely those of the individual author(s) and contributor(s) and not of MDPI and/or the editor(s). MDPI and/or the editor(s) disclaim responsibility for any injury to people or property resulting from any ideas, methods, instructions or products referred to in the content. |
© 2025 by the authors. Licensee MDPI, Basel, Switzerland. This article is an open access article distributed under the terms and conditions of the Creative Commons Attribution (CC BY) license (https://creativecommons.org/licenses/by/4.0/).

 ,
, 


