Abstract
Firm-based approaches to international trade have revolutionized the study of trade politics. Corporate participation in political processes is costly, limiting access to large, productive, well-resourced, and often internationally engaged firms. This implies a pro-trade bias in corporate lobbying demands over trade policy. I examine this relationship in the case of three free trade agreements passed by the United States Congress in 2011. I combine public statements from firms on the FTAs with corporate lobbying activities and find that both lobbying firms and those that lobbied and publicly disclosed their policy positions were more productive than the typical publicly traded firm. Likewise, firms with income from foreign affiliates were more likely to be politically active than others. These results contribute to a vibrant body of research into the complex relationships firms hold with policies governing access to international markets.
1. Introduction
Firm-level characteristics influence the ways in which firms are affected by internationalization and consequently shape their demands over policies relating to foreign-market access. Large, highly productive firms with access to a wide range of resources tend to leverage these advantages across international markets through various forms of value-chain integration. These same competitive advantages also enable them to overcome the costs associated with political market participation, enabling them to directly engage in policy-making processes to seek favorable outcomes. As a result, corporate demands over trade policies tend to reflect liberalizing concerns rather than protectionist attitudes.
In this study, I link two bodies of research on firms in trade politics: the first focuses on the determinants of firm-level trade-policy stances, while the second examines corporate political activities. Because political activity is costly, small and low productivity firms—which are most likely to favor trade protection—are unlikely to be able to engage, leading to representation of corporate demands dominated by those for trade liberalization. Using the case of three free trade agreements (FTAs) passed by the United States (US) Congress in 2011, I link corporate financial-disclosure data with lobby-disclosure reports to analyze corporate lobbying patterns. I also combine these with public statements on the FTAs that reveal some of the lobbying firms’ demands for liberalization. In line with expectations, politically active firms are large and highly productive and tend to favor trade liberalization. In addition to firm-level productivity, income from foreign affiliates is positively linked to trade-policy lobbying. Furthermore, public disclosure appears to be the result of an internal strategic process; even when compared to the relative rarity of lobbying on trade, few corporations went public with their support for any of the FTAs, although these firms are also highly productive and internationally invested.
This study contributes to our understanding of trade politics by explicitly linking the direction of corporate demands to their political activities; existing research into corporate involvement in trade politics has assumed directionality when investigating patterns of participation based on firms’ behaviors and industry characteristics. The importance of a firm’s characteristics for lobby participation, particularly productivity and foreign affiliates, adds to a growing body of research emphasizing these features. Notably, and perhaps surprisingly, given the literature’s foundations in trade models that focused primarily on exports, exports do not appear to significantly affect corporate lobby participation. Crucially, this result is in accordance with other recent empirical studies.
2. Corporate Political Activities
Scholars have long been interested in producer influences on policy-making processes, and research into corporate participation in trade politics has a particularly rich research lineage.1 Historically, research in this vein focused on the policy demands and political activities of large firms, because firm size has been robustly linked to political engagement through lobbying and other means. The US case has received particular attention in empirical studies due to the relatively detailed lobbying disclosure requirements for both lobbying activities and contributions to political campaigns (Brasher and Lowery 2006; Drope and Hansen 2006; Richter et al. 2009). The latter, in particular, formed the early empirical basis for research into lobbying activities in the US context.
However, both activities are distinct, both in terms of donors’ intents and the amounts of spending involved. Campaign contributions are a form of access lobbying, in which corporations and other interest groups provide financial support to parties and political candidates in return for future access to party leaders or political candidates once they have been elected, with the aim of influencing policy decisions (Lohmann 1995). With uncertainty over future electoral outcomes, donors will typically distribute access-oriented funds widely, across all competitive candidates in a district, ensuring access regardless of whoever is eventually elected.
Lobbying sitting politicians or bureaucrats is known as informational lobbying, in which corporations and interest groups provide policy makers with information on the expected impacts of proposed policy or rule changes (Brasher and Lowery 2006; Richter et al. 2009). Informational lobbying expenditures far exceed access lobbying spending, and in the corporate context, the two face distinct drivers: industry structure is more influential than firm-specific characteristics for access lobbying, while the latter is true for informational lobbying (Kim 2008; Richter et al. 2009). Corporate lobby participation is also sticky: once they begin lobbying, firms tend to remain active, switching policy issues as they are addressed, as a means of maintaining valuable relationships with policy makers (Kerr et al. 2014).
Finally, there is the question of corporate collective action, which has received particular attention in the realm of trade politics. Depending on the industry structure, particularly factors like product differentiation, intra-industry trade, and market concentration, producers may have incentives to lobby collectively, through an organization representing industry-wide interests (Grossman and Helpman 1994; Bombardini 2008; Bombardini and Trebbi 2012; Madeira 2016). Among these factors, product differentiation has emerged as central to determining the extent to which producer interests over trade policy converge or diverge within a given industry, consequently affecting the appeal of collective action. Where industrial output is differentiated, producers have an incentive to lobby individually to guarantee any preferred policy outcomes that incorporate their outputs, while potentially excluding those of their competitors. Ultimately, firm-focused research in the international political economy has found firm-level characteristics to be more influential in the lobbying decision than industry structures (Osgood 2016a, 2016b; Kim 2017). The focus of this study, however, is not on this question of collective action but on the nature of individual corporate lobbying efforts themselves.
3. Heterogeneous Firms and Corporate Trade Interests
While the literature on corporate lobbying gives us insights into which firms might engage in lobbying over trade policy, the nature of their demands has often remained implicit due to limitations in lobby disclosure regulations. In most cases, corporate demands are assumed based on insights from the firm-based approach to international trade, which have revealed a great variety in the ways in which producers compete in global markets (Bernard et al. 2003; Melitz 2003; Bernard et al. 2007).
From models that first linked firm size and total factor productivity (TFP) to exporting, a large section of the literature has emerged linking these same producer characteristics to other methods of engaging foreign markets, such as foreign direct investment (FDI), importing, and offshoring.2 Across these activities, larger and more productive producers are more likely to engage in internationalizing endeavors, as they are most easily able to absorb the relatively high costs of engaging foreign markets. The largest and most internationally engaged MNCs dominate cross-border transactions, while the majority of firms—their much smaller and less productive counterparts—focus their participation on the less costly domestic market.
The distinct contrast in material fortunes between producers that can (and often do) internationalize and those that cannot seems to imply a comparable division in firm-level trade-policy stances. To some extent, a general pattern along these lines does appear to hold in survey-based research: large and internationally active firms are more likely to favor trade liberalization than their small and domestically focused counterparts (Osgood et al. 2017; Plouffe 2017).
However, trade-policy stances are affected by a range of influences, from the complexity of the domestic policy environment to the scope and nature of firms’ direct or indirect participation in global value chains; as a result, expressed policy stances may be neutral or indeterminate or driven by policy considerations beyond conventional subsidies and tariffs (Blanchard and Matschke 2015; Plouffe 2017; Osgood 2018; Kim et al. 2019).
4. Lobbying for Trade Liberalization
Lobbying is a costly activity. While data on lobbying expenditures are unavailable for most of the world, in the US, corporations frequently spend several million dollars a year on their individual lobbying activities. Even where costs may be lower, and firm resources are finite and smaller, less productive firms would still face difficulties overcoming additional non-production costs for political engagement. Rather than attempting to lobby individually, which would likely have little payoff as well as pose a survival threat, these firms are more likely to rely on producer and industry associations to represent their interests (Plouffe 2012; Plouffe 2015).
The result is that individual corporate lobbying activities are dominated by large producers. These firms are highly productive, often from a combination of factors, such as economies of scale, organizational structure, and knowledge capital (Bernard et al. 2007). This emphasis on firm size and productivity captures, to some extent, another window into firm heterogeneity: the resource-based view of the firm (Wernerfelt 1984; Barney 1991). Among the countless sources of firm heterogeneity are variations in organizational structure, knowledge capital, and tangible and intangible assets that, when combined, can provide a firm with a competitive advantage over others. A focus on productivity provides an analytically tractable approach to capturing differences across a large number of firms.
H1:
Lobby participation is likely to be dominated by highly productive firms.
As discussed in the preceding sections, large and highly productive firms—those that are most likely to engage in lobbying—are also those that are most likely to participate in global value chains. Doing so ties their financial interests to access to foreign markets.
H2:
Lobbying firms are more likely to seek liberalizing trade reforms than oppose them.
While this may contribute to liberalizing demands in private, public declarations are a different matter. When deciding to publicly announce trade-policy demands, firms face a strategic choice. While public disclosure may place pressure on politicians by providing a broader base of support for the firm’s arguments around firm-specific or economy-wide consequences. However, whether public opinion can be marshalled in such a way is an exercise in probabilities: while some voters may support the lobbying firm’s demands, others may oppose them, potentially with negative consequences for the firm’s revenues. Consequently, the decision to go public with trade-policy demands is likely to rest on an assessment of whether such a move would provide sufficient leverage on policy makers while avoiding significant adverse reactions among other groups.
H3:
Public revelation of corporate trade-policy demands is likely to be less common than lobby participation without public disclosure, but like lobbying, it will be dominated by large and highly productive firms.
5. Examining Firm Heterogeneity and Lobbying over FTAs
For this study, I focus my analysis of firms’ political activities on those relating to the passage of the three FTAs ratified in 2011. These FTAs are useful from an analytical standpoint because their ratification involved specific Congressional legislation; this means that lobbying activities can be tied directly to the bills themselves. This stands in contrast with several more recent trade issues, such as the Trans-Atlantic Trade and Investment Partnership and the Trans-Pacific Partnership, for which no legislation was enacted. This means that lobbying demands are vaguely defined in the absence of public declarations, and lobbying on trade may not even be linked to the trade agreements at hand. More recent examples of trade legislation, the renegotiations of NAFTA and the Korea-US FTA, took place in a highly politically polarized environment, in which trade was weaponized as a salient political issue (Plouffe 2023). This political context would have disincentivized public statements on trade policy, making it more difficult to observe H3 under what one might optimistically describe as normal circumstances.
Looking at earlier historically important pieces of trade legislation, the North American Free Trade Agreement (NAFTA) and the Central America Free Trade Agreement (CAFTA), predated the 1995 passage of the Lobbying Disclosure Act (LDA) and its subsequent revision under the Honest Leadership and Open Government Act of 2007 (HLOGA). The LDA introduced the requirement that lobbyists register with the federal government, and the 2007 HLOGA significantly increased the penalties for failure to comply with the LDA. Lobbying data are available starting in 1998; although, reports filed prior to 2007 frequently lack crucial information such as the bills and issue areas addressed.
6. The 2011 Colombia, Korea, and Panama FTAs
In October 2011, the United States Congress ratified three bilateral FTAs. While the timelines differed slightly, negotiations took place in the mid 2000’s, and congressional ratification was delayed until 2011. Each of the agreements was signed in June 2007, before President Bush’s fast-track authority expired on 1st July 2007 in the face of congressional Democrats’ reluctance to extend Bush’s authority. They were then submitted to Congress in October 2011 by President Obama and quickly ratified.
The Korea (KORUS) FTA, the most noteworthy of the three agreements, was initially negotiated between 2006 and 2007. Ratification was stalled due to significant opposition by the Democrats over beef and automobiles. Efforts at renegotiation took place in late 2010, notably resulting in the United Auto Workers expressing support for the agreement and for the first time breaking ranks with the AFL-CIO on a trade issue. KORUS passed the Senate by 83-15 and the House by 278-151.
Negotiations for both the Colombia and Panama agreements were concluded in 2006, although the talks with Colombia had begun in 2004. The Colombia agreement passed the Senate by 66-33, and the House by 262-167, after some components of the initial settlement were renegotiated. The Panama agreement was ratified after a 77-22 vote in the Senate and a 300-129 vote in the House.
Approximately 300 organizations filed reports on the bills relating to the passage of these agreements. Among corporations that filed reports, the vast majority are publicly traded. Many of the lobbying reports focus on KORUS and/or the two Latin American FTAs together; where organizations lobby on all three FTAs (or even just two of the three), their statements are consistent: they either favor or oppose the passage of the FTAs they address, either within the lobbying reports or through more public means.
7. Firm-Level Financial and Political Data
The data for this project originate from three different sources. Firm financials for publicly listed North American firms are taken from Standard and Poor’s Compustat databases. Lobbying activities are sourced from the Center for Responsive Politics’ (CRP) Open Data project, which contains information culled from the lobbying reports filed with Federal Elections Commission (FEC), Senate Office of Public Records (SOPRs), and House of Representatives Legislative Resource Center (HRLRC). Finally, information regarding firms’ policy positions is gleaned from public statements.
Compustat’s North American Annual Fundamentals (NAA) database provides balance sheet and cash-flow information for firms listed on the American and Canadian stock exchanges gleaned from the official SEC and other regulatory filings, while Compustat Segments provides information from shareholder reports. The data in Segments are organized at the sub-firm segment level and must be re-aggregated for firm-level matching with the NAA data. TFP estimation requires a number of elements from the NAA, while Segments complements these items with a number of market-behavior indicators, including export sales. Compustat’s reporting of only publicly held firms leads to underrepresentation of small and medium enterprises, but these firms are highly unlikely to lobby;3 among larger firms, the use of regulator data leads to a highly representative sample.
There are a number of shortcomings in Compustat’s data. Export sales are aggregated across the globe; there is no way to break these down by region or country. Foreign income faces similar limitations, with no indication of geographic breakdown. Compustat provides no data on import sourcing. There is no practical solution to these limitations; the US Census Bureau collects transaction-level data, but access is extremely limited and generally not granted to projects investigating political matters.
The CRP’s Open Data project provides a wealth of information concerning the use of money in American politics for academics. Lobbying-expenditure data are sourced directly from quarterly lobbying disclosure reports and organized in a relational database. The reports are filed by individuals registered as lobbyists and contain information regarding their clients, total expenditures for the period, and the bills (when appropriate) and the issues addressed. Each report includes at least one of the 77 general issue codes used by SOPR and HRLRC; the use of multiple issue codes is especially common among reports involving high levels of expenditure. Lobbyists can indicate specific aspects of the targeted issues in an open-ended response field. For this project, lobbying on FTAs is sourced from the returns to queries on the relevant bill identifiers, followed by queries on overlapping general issues with relevance determined by reports’ specific-issue entries.
The reports filed by lobbyists rarely contain information hinting at favored policy outcomes. In the vast majority of cases, they merely indicate the issues which the lobbyists and their clients sought to influence. To situate firms’ and organizations’ stances surrounding these trade issues, I searched for public statements that gave a clear indication of these positions. These statements come from open letters, public testimony before Congress and other arms of the federal government, interviews given by firm decision makers, and individual or jointly signed statements of support or opposition.4 The firms making these statements are all large and many are MNCs.
8. Estimating Productivity
TFP represents producers’ abilities to effectively combine their inputs, such as skilled and unskilled labor, capital, and raw materials, to generate output. As a result, TFP is never directly observed, but instead is indirectly estimated or captured through the use of a proxy indicator. In the latter case, a measure of firm size—usually total revenue, net sales, or market share—is a common proxy for TFP across the empirical literature due to the strong correlation between size and productivity. However, because existing research on corporate lobbying has focused extensively on the link between firm size and lobbying activities, I turn to an estimate of TFP in this study.
The simplest method for estimating TFP is to use a single equation to estimate the expected output based on weighted inputs specified according to a Cobb–Douglas production function. While this method benefits from simplicity in its application, and the flexibility to be applied to cross-sectional data, it suffers from simultaneity and selection biases. Simultaneity bias arises from producers’ knowledge of their own productivity, which influences their selection of inputs (and consequently, future TFP), while selection bias arises from the relationship between productivity shocks and the likelihood of production-market exit. The Olley–Pakes method of production function estimation proposes a multiple-equation, semi-parametric solution to these sources of bias.5 For this analysis, the Olley–Pakes routine is run over the population of firms from Compustat’s North America database over the period of 2003 through 2011,6 with the values for 2010 extracted for the cross-sectional lobbying models.7
The resulting TFP estimate behaves largely as expected, correlating with common indicators of firm size, as demonstrated in Table 1. The relationships with export sales and (pre-tax) foreign income appear to be somewhat weaker, although these correlations increase greatly when accounting for firm-level engagement in these activities. Among exporting firms, the correlation coefficient of TFP and export sales is 0.9, while it is 0.48 between TFP and foreign income, among firms reporting foreign subsidiaries.

Table 1.
Pairwise correlations.
9. Producer Lobbying over the Korea, Colombia, and Panama FTAs
In examining producer lobbying over the trio of 2011 FTAs, data on lobbying expenditures between 2010 and 2011 are identified and pooled before merging with firm-level financials from the 2010 fiscal year. A total of 99 publicly held firms lobbied on at least one of the three FTAs passed in October of 2011, with many lobbying on multiple FTAs. Just over 50 of these also released statements of their positions, either directly or indirectly (through coalitions with other businesses, where the letters were publicly and jointly signed), leaving roughly 4850 politically inactive firms in the dataset; although, missing data on some variables reduces sample sizes in some models. Lists of the firms that made public statements and those that lobbied can be found in Table A1 and Table A2 in Appendix A.
The aims of taking this approach to assessing firm-level FTA lobbying activities are to maximize cross-sectional coverage while focusing on efforts to build support for the FTAs’ passage. Lobbying on these issues in the early stages of the FTA negotiations is more likely to reflect firm- or industry-specific demands, rather than efforts to see the FTAs signed. By focusing on the latter set of activities, I avoid the need to necessarily identify the nature of these private demands and their potential hidden evolution over time.
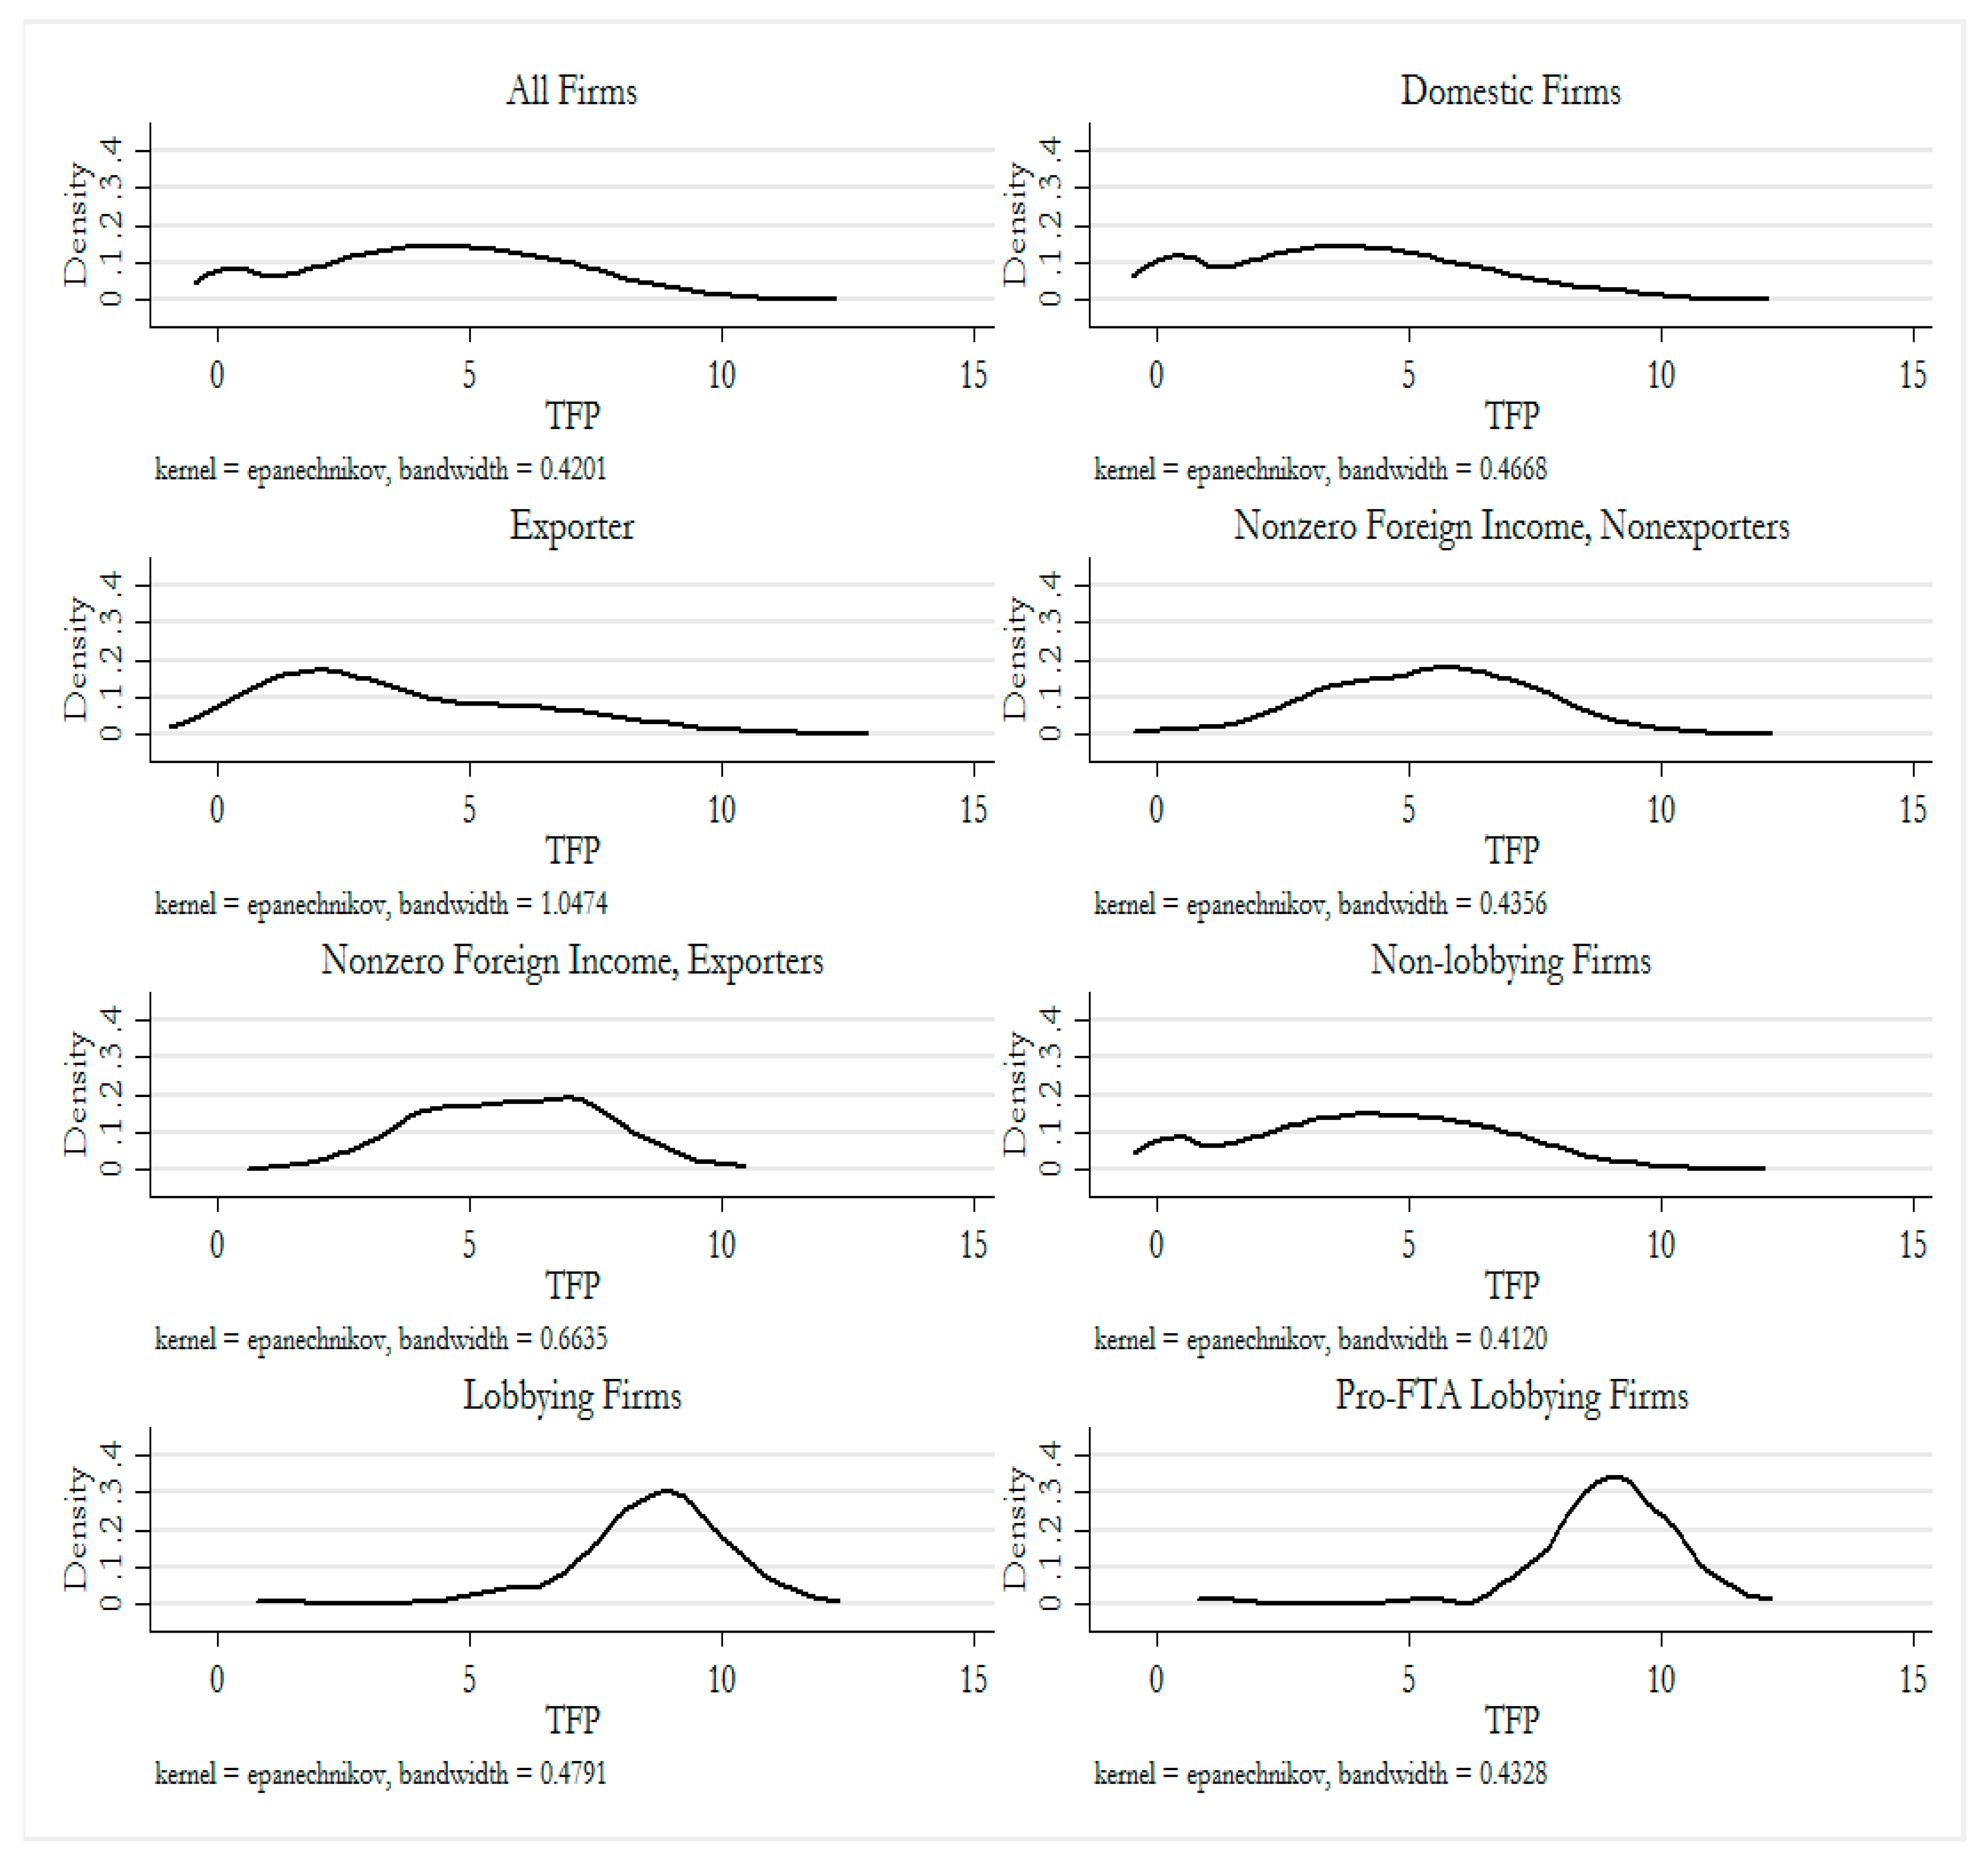
Figure 1 illustrates the differences in means for key firm-level characteristics. The exporter premia over domestic firms (those that neither export nor have any pre-tax foreign income) across these figures are largely consistent with expectations from the existing literature. Exporters are larger in terms of revenue, capital, and employees and have a higher value added. The sample of all firms includes those with foreign affiliates; consequently, the difference between exporters and the average firm is less marked.
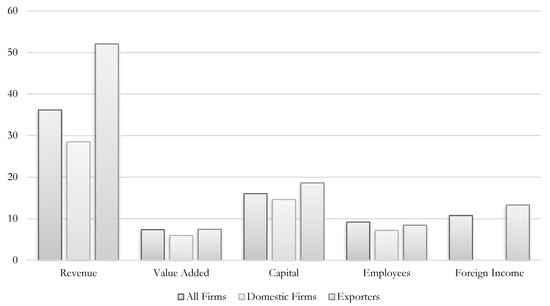
Figure 1.
Mean firm characteristics by export engagement. Note: Apart from employees, all values are in 2010 USD. Revenue, value added, and capital are presented in hundreds of millions, while foreign income is presented in tens of millions.
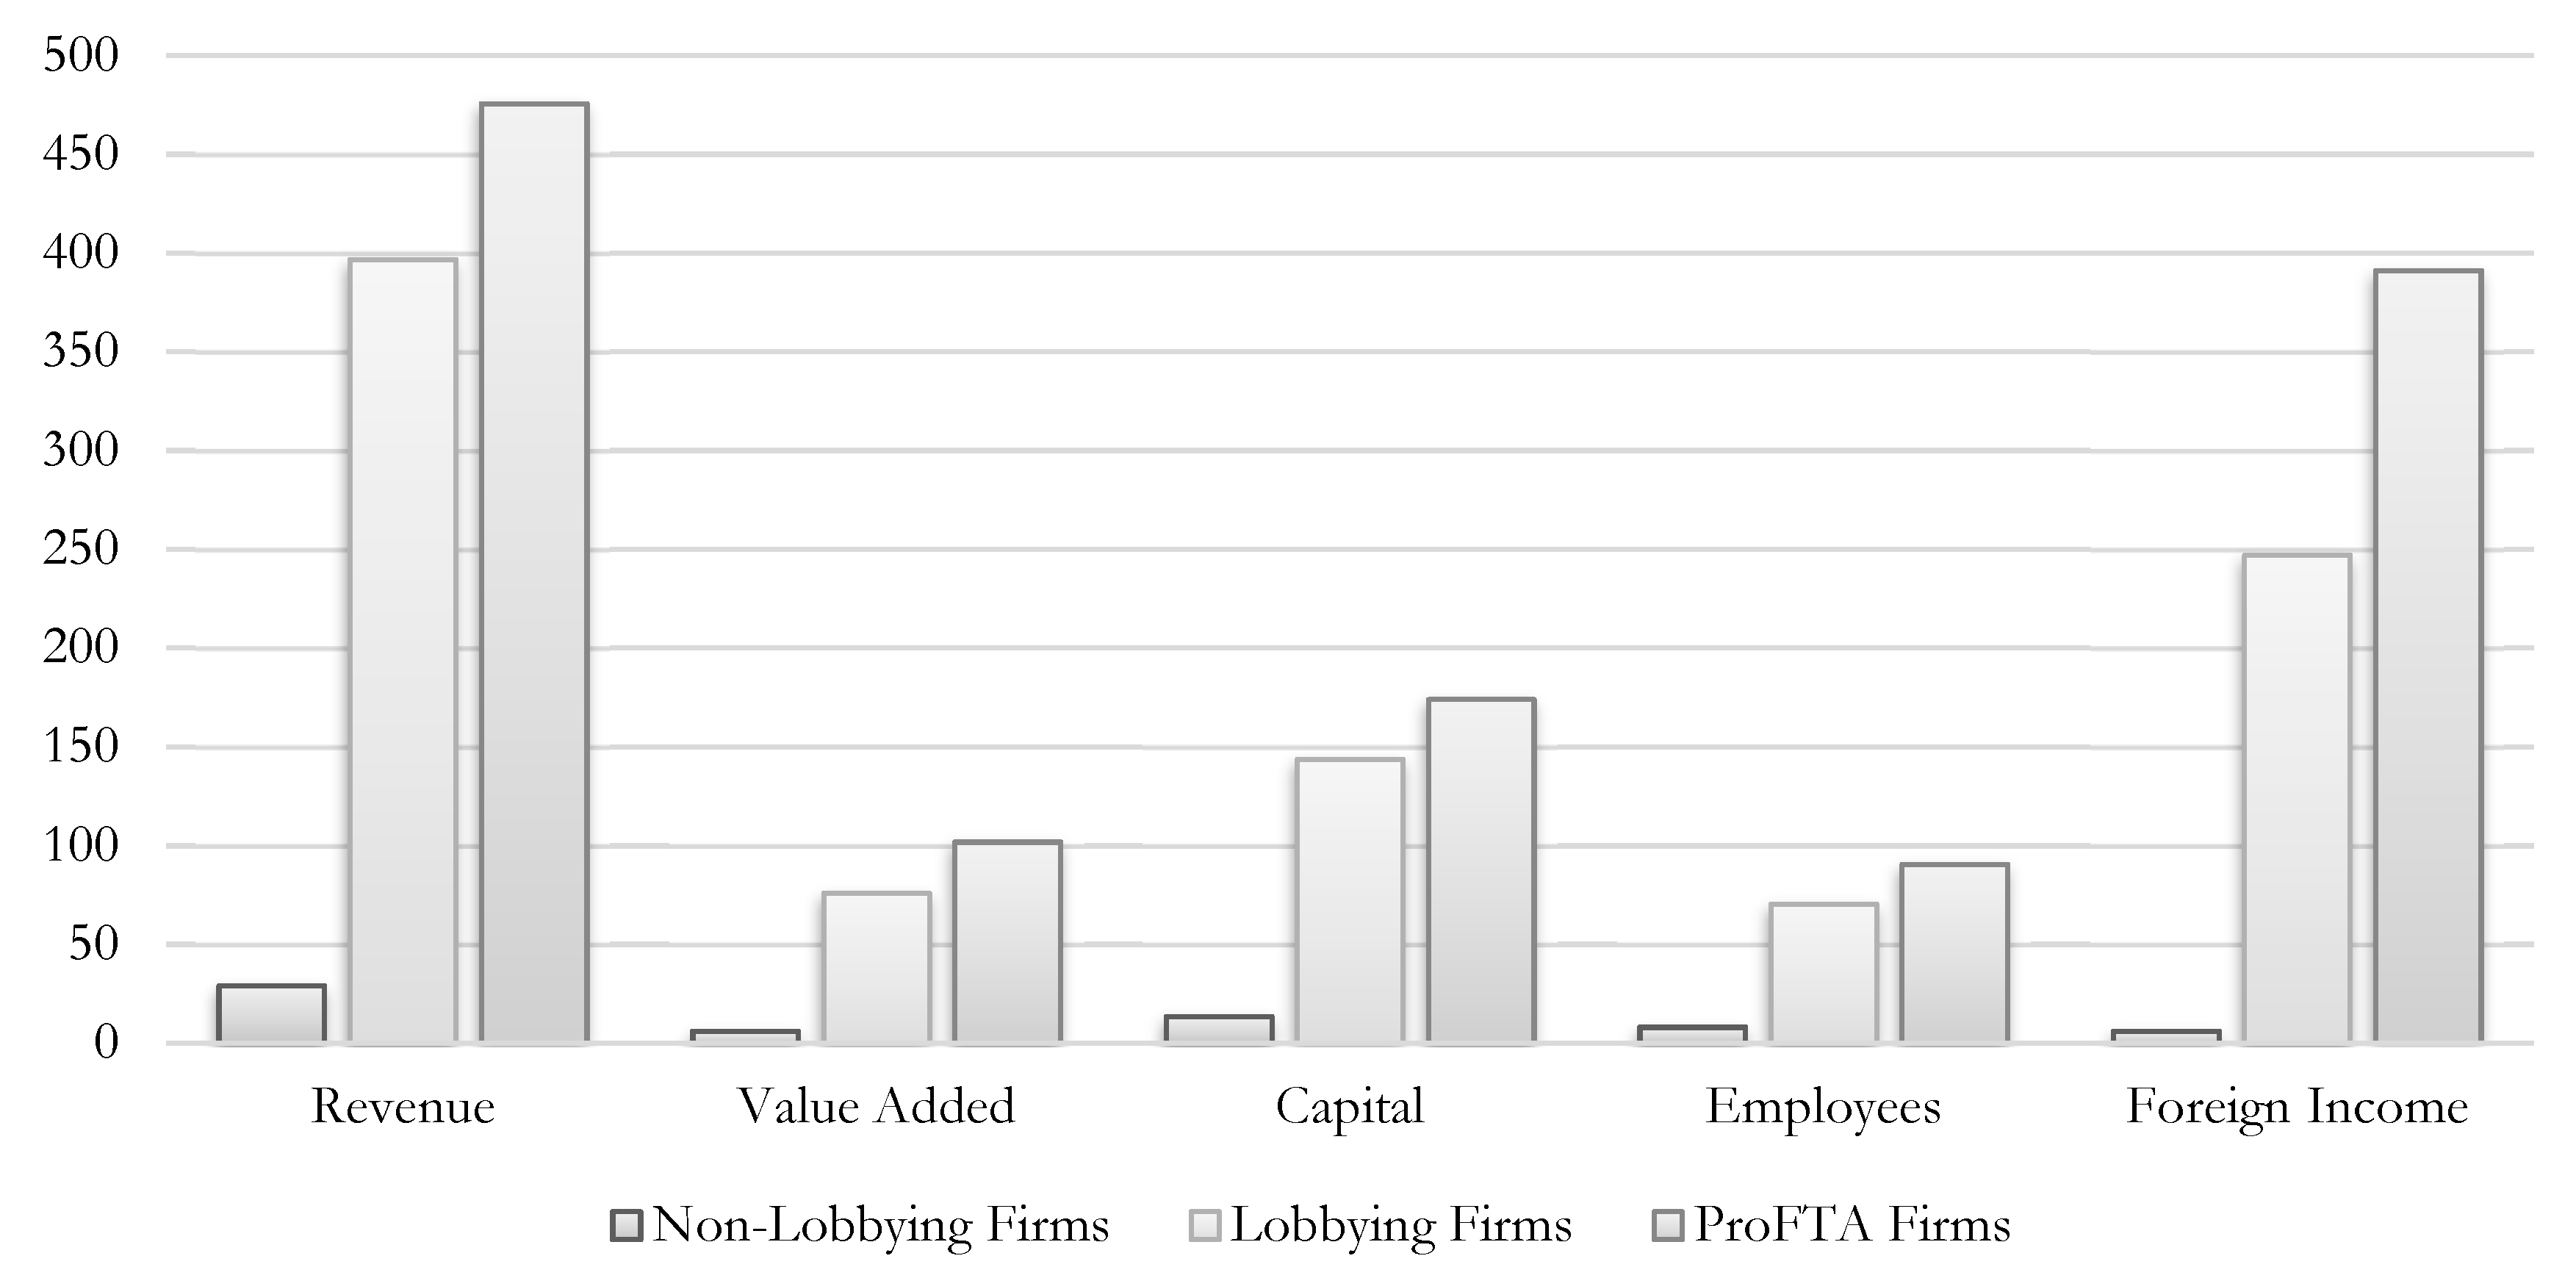
Figure 2 presents a similar comparison between firms that did and did not lobby between 2010 and 2011 on any of the FTAs. Consistent with other research on business lobbying, the producers that lobbied are much larger across all measures than non-lobbying firms. Perhaps more remarkable is the disparity in size between the firms that lobbied and took a public stance on the FTAs and those that remained disengaged from the political process.

Figure 2.
Lobbying and non-lobbying firms, 2010–2011. Note: Apart from employees, all values are in 2010 USD. Revenue, value added, and capital are presented in hundreds of millions, while foreign income is presented in tens of millions.
A comparison based on TFP is presented in Figure 3. Domestic firms have the lowest mean TFP, while exporters exhibit a significant TFP premium over domestic producers. The difference between lobbying and non-lobbying firms is more remarkable, however, with a lobbying TFP premium of nearly 100 percent (8.6 to 4.3). As the firm-level variations in Figure 2 suggest, firms publicly lobbying in favor of the FTAs are both the largest and most productive group. Descriptive statistics are also presented in Table A3 in Appendix A.
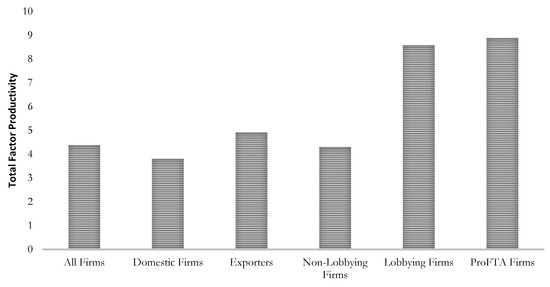
Figure 3.
Mean TFP comparison across market and political activities.
10. Results
In the models presented in this paper, TFP is used alongside log-transformed export sales and foreign income. Because pre-tax foreign income as reported in shareholder reports may be negative to indicate a loss, it is linearly transformed prior to undergoing log transformation. Firms not reporting foreign income are treated as having no foreign income.
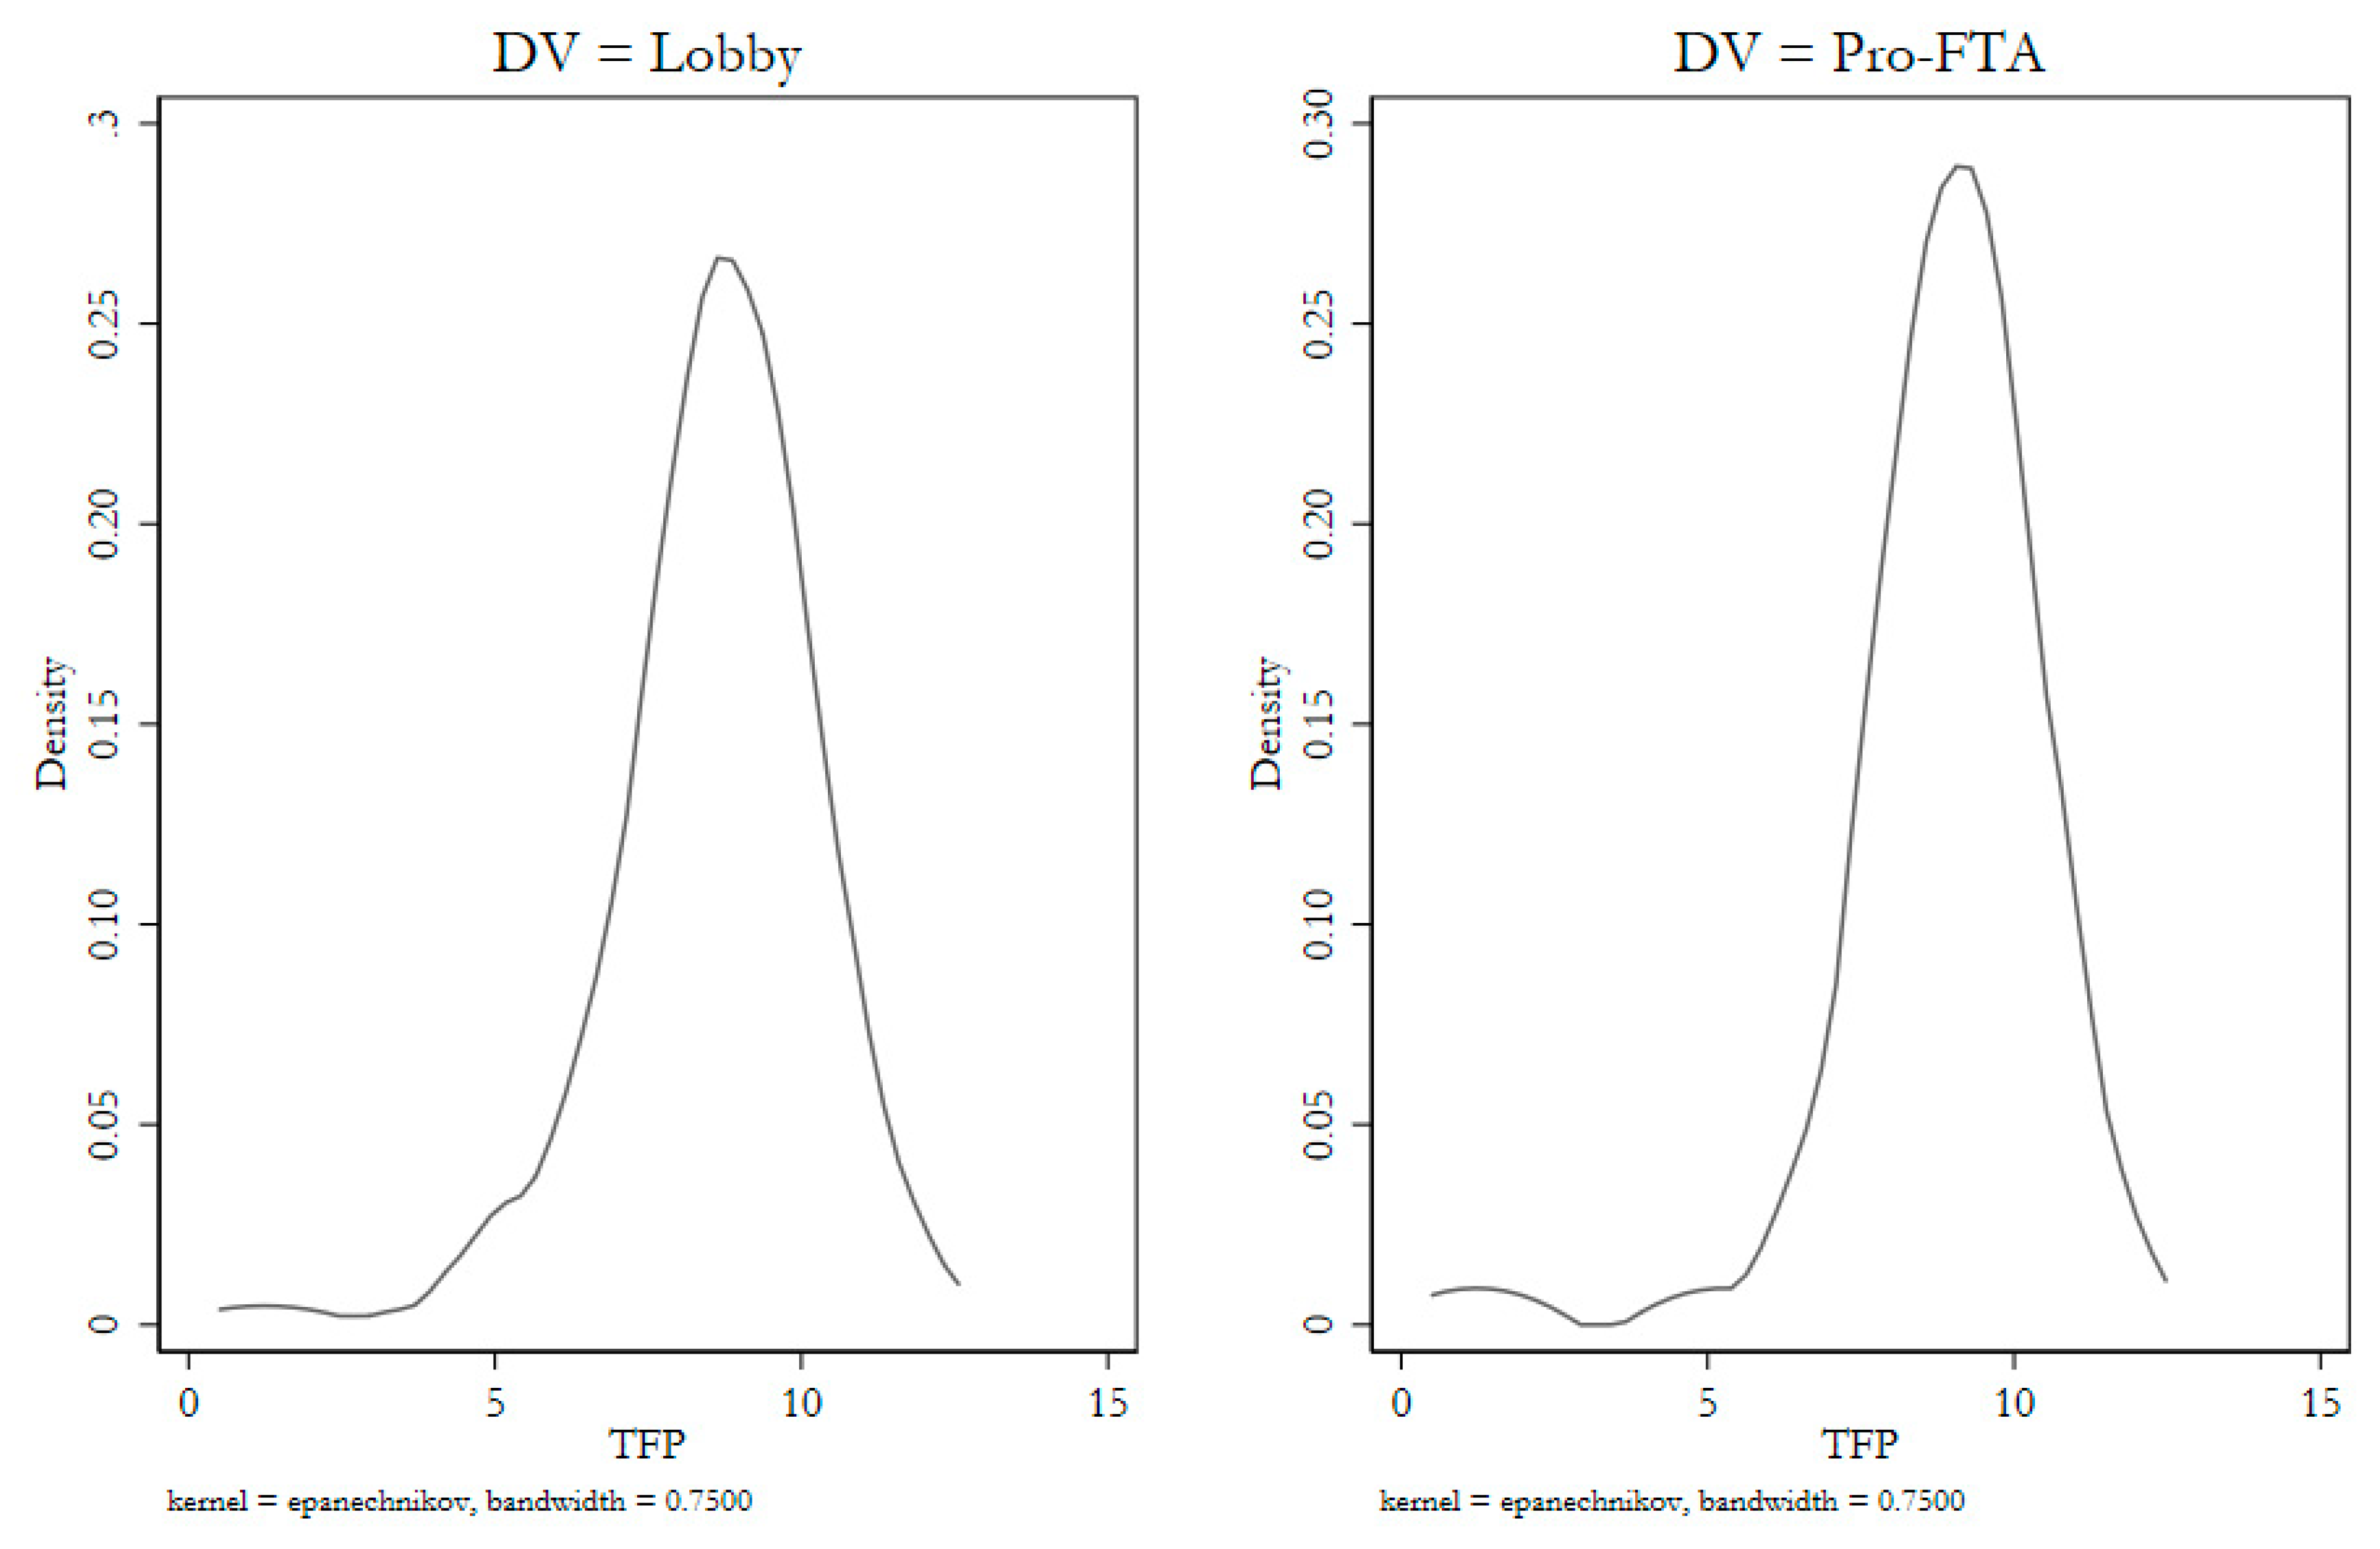
TFP is positively linked to the likelihood of both lobbying (lobby) and lobbying alongside public expressions of support for FTAs (pro-FTA) when controlling for firms’ export status and sales, and it is robust to a range of estimation strategies. Figure 4 presents kernel-density estimates of the TFP distribution where lobby and pro-FTA are both non-zero, demonstrating both the skewed nature of the distribution and the fact that highly productive firms are much more likely to engage in these activities than their less productive counterparts. For example, among firms with a TFP between 7 and 10, those that lobbied make up 10% of the sample, while those that lobbied and publicly supported the FTAs accounted for nearly 6% of all of these firms. Among firms with a TFP greater than 10, these politically active firms make up 5% and 3% of the group, respectively.
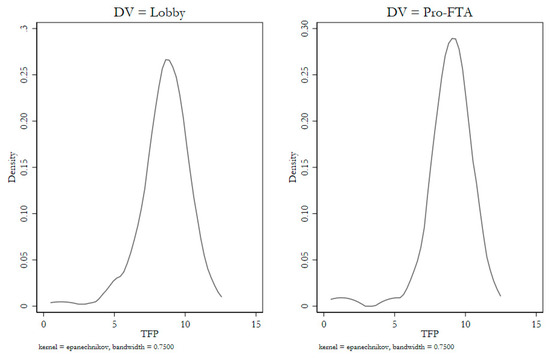
Figure 4.
Kernel density of TFP for lobbying and pro-FTA firms.
Table 2 presents firm-level models estimated using scobit (for skewed logit), conditional logit (Chamberlain 1980), and multinomial logit models. The scobit is a generalization of the logit that more accurately captures the underlying data-generating process: rather than relying on the assumption, as both logit and probit do, that the effects of changes among the independent variables on the dichotomous outcome Y are greatest where pr (Y = 1) = 0.5, it allows this point to vary based on the underlying structure of the data.8 The conditional logit allows for conditioning at the industry level, essentially treating industries in a manner comparable to a fixed effects model, but without the risk of bias that may arise as a result of the incidental parameters problem.
Table 2.
Firm-level attributes and FTA lobbying.
Table A7, Table A8, Table A9, Table A10 and Table A11 in Appendix A replicate these models and reduced specifications dropping either export sales or foreign income, estimated with logit, linear probability, scobit, conditional logit, and multinomial logit models, respectively. All results are consistent with those presented here.
The models in Table 2 paint a consistent picture of the effects of TFP on the lobby and pro-FTA. In Models 1 and 2, a unit increase in TFP is associated with a 1.5% and 0.8% increase in the likelihood of lobbying or lobbying with a public pro-FTA stance, respectively. Export sales are positively linked to lobby but not pro-FTA, while foreign income is positively associated with both behaviors. The scobit models with foreign income included are quite similar to a standard logit, as demonstrated by α’s of 0.579 and 0.497, respectively; this is in stark contrast with those relying solely on TFP and export indicators (see Appendix A for results). Models 3 and 4 present conditional logit results with industry effects. While export sales are insignificant in both instances, the AMEs for TFP and foreign income are larger relative to those in Models 1 and 2; this is likely due to the fact that industries without variation in the dependent variables are dropped from the sample. Model 5 presents multinomial logit results, with lobby and pro-FTA presented as alternate choices for firms to take in the political market, in addition to not lobbying. As in the preceding models, TFP is positively linked to both lobby and pro-FTA, as is foreign income.
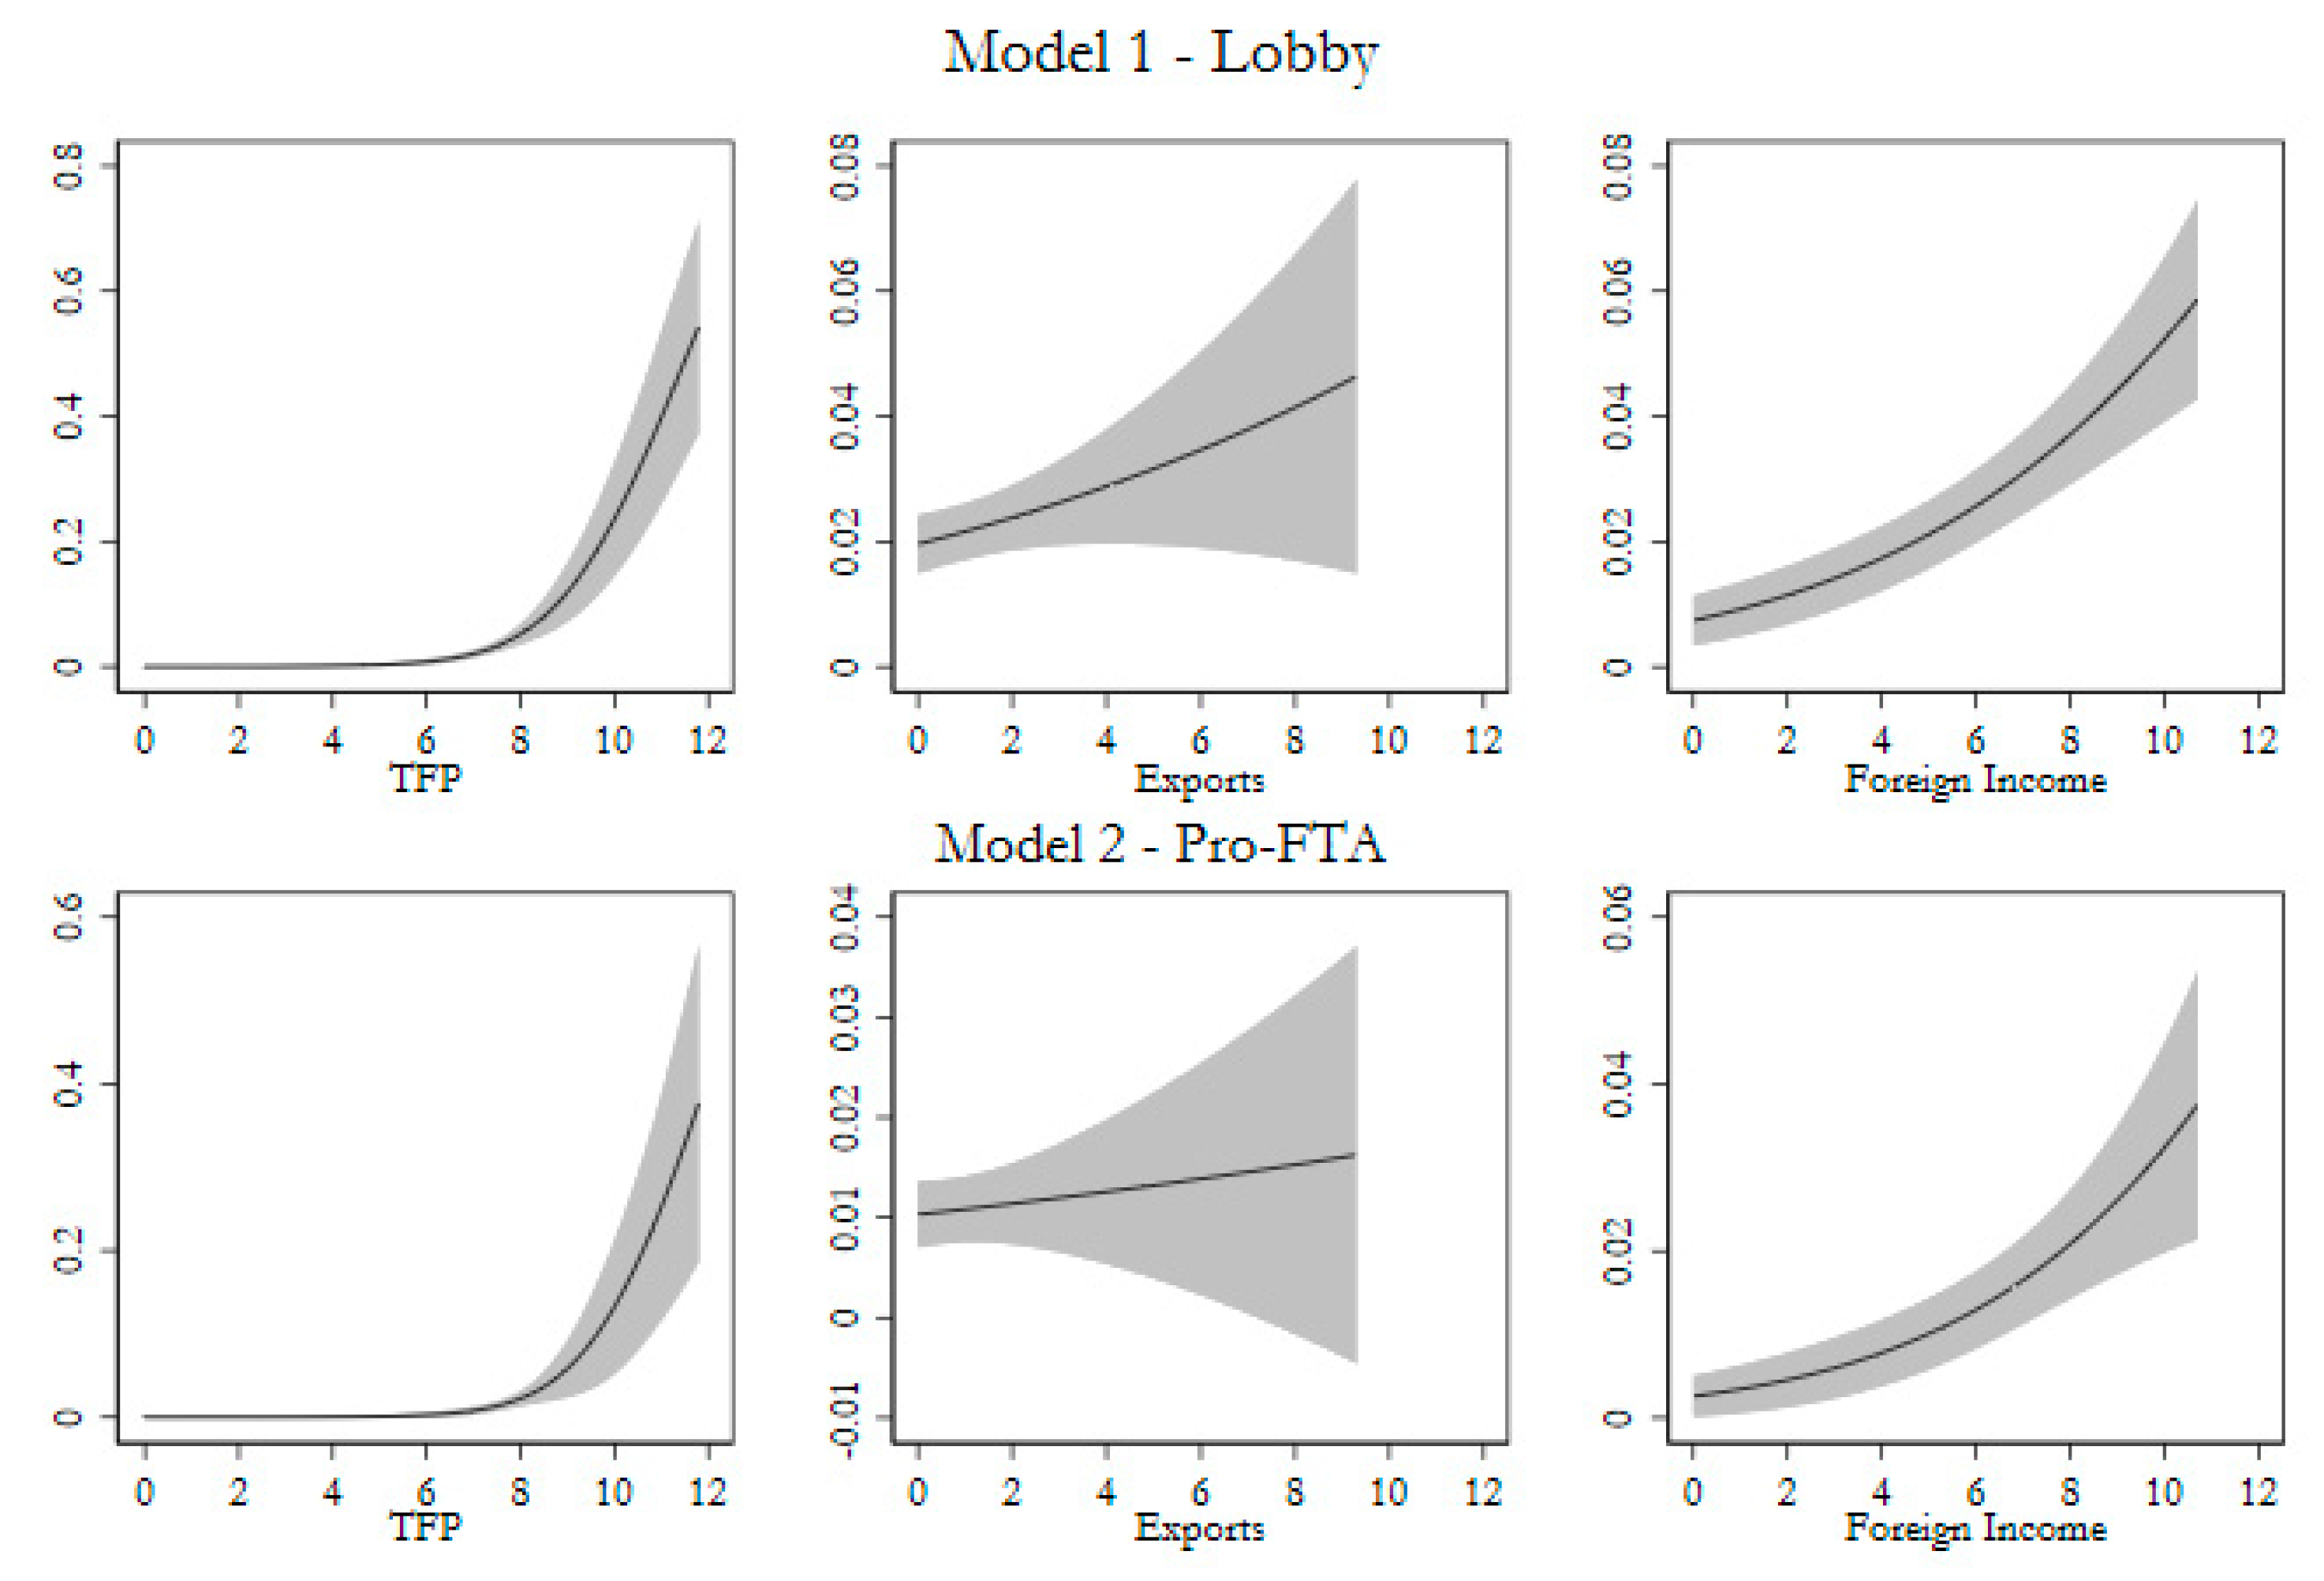
Figure 5 presents the range of the marginal effects across all firm-level attributes presented in both models. TFP exhibits a steep nonlinear effect on both lobby and pro-FTA, reflecting the significant TFP difference between these firms and non-lobbying firms. This reflects the skewed distribution presented in Figure 4, although the predicted probabilities of lobby and pro-FTA are still increasing at the top end of the TFP distribution. The effects of export sales are more linear in shape; while the marginal effect is statistically significant for lobby, the confidence interval widens to overlap with zero as export sales increase for pro-FTA. Finally, foreign income exhibits an increasing nonlinear effect on both lobby and pro-FTA.
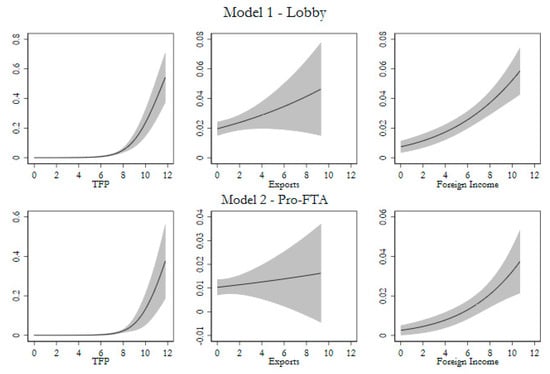
Figure 5.
Continuous marginal effects for firm-specific attributes.
Research on producers and trade politics has focused extensively on the role played by industry characteristics in determining firm behaviors such as market entry. Table 3 accounts for industry-level factors using mixed-effects models, with the industry indicators divided by their basis in conventional comparative-advantage accounts of trade or new trade theory. Models 6 and 7 incorporate three comparative-advantage indicators in the second level, while Models 8 and 9 have new-trade variables. Unlike the other models in Table 2, the models in Table 3 focus exclusively on the agricultural and manufacturing sectors, a limitation of the industry-level measures.
Table 3.
Firms, Industries, and Lobbying.
Estimated using logit, scobit, mixed-effects logit fit using QR decomposition, and multinomial logit models. The results are consistent with those presented here.
Two of the three comparative-advantage terms utilize trade-flow measures from the World Integrated Trade Solution (WITS): trade balance is generated from the simple industry-level trade balance for 2010;9 RCA is the WITS calculation of revealed comparative advantage.10 The final comparative-advantage proxy is capital intensity, calculated by Peter Schott to capture industries’ factor compositions (Schott 2003). None of these variables are highly correlated with the others, despite proxying for the same underlying construct.11
The new-trade variables include product differentiation (Broda and Weinstein 2006), concorded to SIC four-digit industry from HS3 industry; concentration, which captures the four-firm concentration ratio based on NAICS industry from the 2007 US Economic Census;12 and intra-industry trade, which is calculated using the Grubel–Lloyd Index (Grubel and Lloyd 1975).
In Appendix A, Table A12, Table A13, Table A14, Table A15, Table A16 and Table A17 incorporate individual second-level variables,
The results presented in Table 3 are consistent with those in Table 2. TFP remains strongly associated with both lobbying and lobbying while publicly supporting FTA passage. Foreign income is also positively linked with both outcomes, while export sales do not exhibit a significant relationship with either outcome. Among the comparative-advantage industry-level variables, only RCA is positive and significant in Model 6, while only trade balance is positive and significant in Model 7. The new trade variables appear to fare better. The Grubel–Lloyd Index is significant in Model 8, indicating that intra-industry trade is positively associated with lobby participation. In Model 9, both product differentiation and concentration are significant: firms in differentiated and concentrated industries are more likely to lobby while making public statements favoring the FTAs.
The results across all specifications are remarkably consistent. TFP and foreign income play central roles in determining whether firms decided to lobby on the 2011 FTAs. Interestingly, export participation (export sales) does not appear to have any consistent influence on whether producers lobbied on the trade agreements (the same result holds for pro-FTA), a result that appears to correspond with other findings within the literature. Finally, while public statements (pro-FTA) are less common than lobby participation, they appear to be driven by the same influences as lobby participation.
However, in light of these results, it is worth noting that there are limitations in the underlying dataset. Compustat does not report the full breadth of internationalization activities, omitting importing and other means through which firms may engage with global value chains. It similarly does not capture the foreign markets with which firms are engaging. Looking beyond data limitations, there are questions about generalizability beyond the US. A lack of comparability across legal jurisdictions, along with a widespread lack of transparency regarding lobbying activities, limits our ability to interpret these results in a broader cross-national context.
11. Conclusions and Implications
The firm-focused approach to international trade led to a revolution in trade models; the related growing body of research into firms in trade politics has generated a comparable transformation to our understanding of corporate demands over trade policy. MNCs and other internationalizing firms are large, highly productive, and resource rich. This places them at a benefit compared to other firms when it comes to engagement in costly political activities. Consequently, the literature has anticipated that corporate trade-policy demands will be shaped by the nature of their international activities.
This study contributes to the existing literature on corporate lobbying on trade policy by linking data on firms’ lobbying activities on FTAs to public statements on those same FTAs, providing an explicit link between political activities and directional trade-policy demands. In line with expectations, lobbying firms and those that also make their trade-policy demands public are more productive than non-lobbying firms. Furthermore, public demands are rarer than privately-communicated lobbying demands.
This study also provides a link between research on firms’ trade-policy stances and their lobbying activities. As anticipated by the literature linking firm heterogeneity to trade-policy stances and value-chain participation, firms that lobby are also likely to seek liberalization.
Looking at firm behaviors, the result of the importance of foreign income for lobbying activities corresponds with findings from other studies of the importance of foreign investments and value-chain participation. While perhaps surprising on the basis of the firm-heterogeneity literature’s focus on exporting, the lack of a statistically significant link between export participation and lobbying is also consistent with previous empirical results. However, globally integrated producers will care greatly about access to foreign investments, as protectionism would reduce the value of those assets.
Questions may arise about the generalizability of research into trade-policy lobbying in the US to other legal jurisdictions. Unfortunately, the widespread variability in lobby disclosure regulations and a general tendency against transparency hinders research; although, further research into other environments would likely yield valuable dividends. Even with variations in the costs of corporate political activity, however, it is likely that the voice in the realm of trade politics will remain skewed towards the broadly pro-trade demands of large and internationally engaged firms, as small firms will find the trade-off between output-focused tasks and non-market activities to be particularly acute.
Funding
This research received no external funding.
Institutional Review Board Statement
Not applicable.
Informed Consent Statement
Not applicable.
Data Availability Statement
Restrictions apply to the availability of these data. Compustat data were obtained from Wharton Research Data Services and are available at https://wrds-www.wharton.upenn.edu (accessed on 18 October 2023) with an appropriate subscription. Lobbying data were obtained from the Center for Responsive Politics and are available at https://www.opensecrets.org/, accessed on 18 October 2023.
Conflicts of Interest
The author declares no conflict of interest.
Appendix A
Table A1.
Firms with public statements supporting the FTAs.
Table A1.
Firms with public statements supporting the FTAs.
| Abbott Laboratories | Cisco Systems | Motorola Solutions |
| Ace Ltd. | Cummins | Network 1 Financial Group |
| Aegon NV | Daimler AG | News Corp. |
| Alcatel-Lucent | Ebay | Occidental Petroleum Corp. |
| Americredit Corp. | Emerson Electric Co. | Pfizer |
| Apple | Exxon Mobil | PPG Industries |
| Applied Materials | FMC | Procter & Gamble |
| AT&T | General Electric Cap. Corp. | Prudential Financial |
| BASF SE | General Electric Capital Svc. | Qualcomm |
| Baxter International | General Motors Co. | Seaboard Corp. |
| Bayer AG | Halliburton | Textron Financial Corp. |
| Boston Scientific Group | Hewlett-Packard | Time Warner Inc. |
| Bunge Ltd. | Honeywell International | Tyco International Ltd. |
| Campbell Soup Co. | Intel | Tyson Foods Inc. |
| Caterpillar | International Business Machines | United Parcel Service |
| Chevron Corp. | Lockheed Martin | United Technologies |
| Chubb Corp. | Microsoft | Xerox |
| Motorola Mobility Holdings Inc. |
Note: Financial services and regulated industries were omitted from the analysis due to variations in reporting requirements. Corporations in those sectors that lobbied publicly are included here.
Table A2.
Firms lobbying on the FTAs.
Table A2.
Firms lobbying on the FTAs.
| Abbott Laboratories | Ebay | Motorola Mobility Holdings Inc. |
| Ace Ltd. | Emerson Electric Co. | Motorola Solutions |
| Aegon NV | Entegris | Nestle SA/AG |
| Alcatel-Lucent | Exxon Mobil | Network 1 Financial Group |
| AmeriCredit Corp. | Fluor | News Corp. |
| Apple | FMC | Nokia |
| Applied Materials | Ford Motor Co. | Nucor |
| ArcelorMittal | General Electric Cap. Corp. | Occidental Petroleum Corp. |
| AT&T | General Electric Capital Svc. | Pfizer |
| BASF SE | General Motors Co. | Philip Morris Intl. |
| Baxter International | Globe Specialty Metals | Potlatch Corp. |
| Bayer AG | Goldman Sachs Group | PPG Industries |
| Boeing Capital Corp. | Procter & Gamble | |
| Boston Scientific Group | Halliburton | Prudential Financial |
| Braskem SA | Hanesbrands | Qualcomm |
| Bunge Ltd. | Hewlett-Packard | Raytheon |
| Campbell Soup Co. | Hexcel Corp. | Rhodia |
| Caterpillar | Honeywell International | Rockwell Collins |
| Chemtura Corp. | Hospira | Royal Dutch Shell PLC |
| Chevron Corp. | Huntsman | Seaboard Corp. |
| Chubb Corp. | Intel | TE Connectivity Ltd. |
| Cisco Systems | International Business Machines | Texas Instruments Inc. |
| Columbia Sportswear Co. | Kraft Foods | Textron Financial Corp. |
| ConocoPhillips | L-3 Communications | Time Warner Inc. |
| Corning Inc. | LaFarge SA | Timken Co. |
| Covidien | Leggett & Platt | Titanium Metals Corp. |
| Cummins | Liberty Media Capital Group | Tyco International Ltd. |
| Daimler AG | Lockheed Martin | Tyson Foods Inc. |
| Dean Foods Co. | LyondellBasell Industries | United Parcel Service |
| Deere & Co. | Marsh & McLennan Cos. | United States Steel Corp. |
| Delta Air Lines | Masco | United Technologies |
| Du Pont | MeadWestVaco | Weyerhauser Co. |
| Eastman Chemical Co. | Microsoft | Xerox |
Note: Financial services and regulated industries were omitted from the analysis due to variations in reporting requirements. Corporations in those sectors that lobbied publicly are included here.
Table A3.
Descriptive statistics.
Table A3.
Descriptive statistics.
| Variable | N | Mean | Standard Deviation | Minimum | Maximum |
|---|---|---|---|---|---|
| Lobby | 4935 | 0.020 | 0.140 | 0 | 1 |
| Pro-FTA | 4935 | 0.011 | 0.102 | 0 | 1 |
| Productivity | 4675 | 4.375 | 2.530 | −0.051 | 11.831 |
| Export Sales | 4951 | 0.115 | 0.765 | 0 | 9.289 |
| Foreign Income | 4951 | 2.416 | 3.372 | 0 | 10.731 |
| Trade Balance | 2524 | −21,988.44 | 69,233.12 | −262,454.00 | 49,474.00 |
| RCA | 1540 | 1.529 | 1.092 | 0.128 | 7.167 |
| K Intensity | 2377 | 9.283 | 0.989 | 6.531 | 10.995 |
| Sigma | 2547 | 4.460 | 10.991 | 1/148 | 108.19 |
| 4-Firm Concentration | 4288 | 38.656 | 18.936 | 1.4 | 99.9 |
| Grubel–Lloyd Index | 1744 | 0.649 | 0.291 | 0.003 | 0.980 |
Appendix A.1. Data for TFP Estimation
The source of firm-level data for the purpose of TFP estimation is the Compustat North America fundamental annual database, for the years 2003–2010, giving approximately 55,600 valid firm-year observations. For firm-level output, net sales is used (this is interchangeable with total revenues). For fixed inputs, ppegt (gross plants, property and equipment) represents the capital stock, and for variable inputs, emp (number of employees) provides the basis for labor costs. All terms are log transformed.
The capital investment rate is given by the ratio of capx (capital expenditures) to ppegt.13 As expected from studies on innovation, research and development, and investment at the firm level, there is a positive link between size and caprate.
Firm-specific labor costs are calculated from emp multiplied by national-average wages from the Social Security Administration. The alternative firm-based measure, Compustat’s wage variable (xlr), has too much missingness to be useful or reliable. Given the relationship between firm heterogeneity and wages, the use of national-average wages might consequently bias high productivity estimates downward, but the TFP estimates still retain the expected properties.
Additional firm variables used to calculate the value added and expenses are oibdp and cogs. Capital stock is generated from a three-year moving average of ppegt with dp used as a depreciation multiplier.
All firm-level data are deflated using price indices from the Bureau of Economic Analysis. The deflator index for private fixed investment is used on investment terms, such as capx and ppegt, while other firm attributes are deflated using the price index. Firm age (age) is calculated from the beginning of the panel and included as a state variable.
Table A4 reports the estimated coefficients and bootstrapped standard errors for TFP inputs.
The estimator can then be compared against standard firm-level characteristics (see Table A5), correlating very highly with firm-size indicators as anticipated by the large literature on heterogeneous firms in economics, as well as foreign income, the pre-tax revenue from foreign affiliates, and export sales.
Table A4.
Total factor productivity estimation by the Olley–Pakes Method.
Table A4.
Total factor productivity estimation by the Olley–Pakes Method.
| Coefficients (Bootstrapped Standard Errors) | |
|---|---|
| Capital Stock | 0.087 *** (0.006) |
| Labor | 0.016 * (0.010) |
| Materials | 0.849 *** (0.009) |
| Industry | 8.58 × 10⁻⁵ *** (5.13 × 10⁻⁶) |
| Age | 0.004 (0.003) |
| Year | 0.017 ** (0.007) |
*** p < 0.01, ** p < 0.05, * p < 0.1.
Table A5.
Correlation between firm-level characteristics.
Table A5.
Correlation between firm-level characteristics.
| Revenue | Capital Stock | Labor | Productivity | Export Sales | Foreign Income | |
|---|---|---|---|---|---|---|
| Revenue | 1.000 | |||||
| Capital Stock | 0.834 | 1.000 | ||||
| Labor | 0.845 | 0.767 | 1.000 | |||
| Productivity | 0.939 | 0.869 | 0.857 | 1.000 | ||
| Export Sales | 0.093 | 0.091 | 0.078 | 0.103 | 1.000 | |
| Foreign Income | 0.323 | 0.261 | 0.319 | 0.291 | 0.106 | 1.000 |
Measures of revenue, capital stock, labor, export sales, and foreign income are all transformed by natural logarithm.
Table A6 presents correlation coefficients for the several industry-structure variables employed in the multilevel models.
Table A6.
Correlation between industry characteristics.
Table A6.
Correlation between industry characteristics.
| Trade Balance | RCA | K Intensity | Sigma | 4-Firm Concentration | Grubel–Lloyd Index | |
|---|---|---|---|---|---|---|
| Trade Balance | 1.000 | |||||
| RCA | 0.099 | 1.000 | ||||
| K Intensity | −0.173 | 0.230 | 1.000 | |||
| Sigma | −0.095 | −0.073 | −0.152 | 1.000 | ||
| 4-Firm Concentration | 0.130 | −0.029 | 0.104 | −0.039 | 1.000 | |
| Grubel–Lloyd Index | 0.419 | 0.351 | −0.090 | 0.0016 | −0.086 | 1.000 |
Trade balance, RCA, and K intensity are log-transformed.
RCA is the revealed comparative advantage as calculated in WITS:
Appendix A.2. Kernel Density Plots for TFP
Appendix A.3. Scobit Estimator
The skewed logit—or scobit—model is a generalization of the ubiquitous logit model that, in many cases, provides a more appropriate modeling approach for many types of data.14 Logit and probit models, utilizing the logistic and normal distributions for their cumulative distribution functions (CDF), respectively, impose a strong assumption on the data they are used to analyze: the effects of changes among the independent variables on the dichotomous outcome Y are greatest where pr (Y = 1) = 0.5.15 Consequently, if we expect the firms that are most responsive to changes to lie at a different initial probability than 0.5, then the distributional assumptions may lead to incorrect and biased inferences. Consequently, a scobit model can better represent the anticipated relationship between firm characteristics and lobby participation, with the bulk of these activities occurring among larger and more productive firms.
In the logit model, if P is the probability of success (where Y = 1), then the CDF is represented as
where z = Xβ, which is the product of the vectors of independent variables (X) and their coefficients (β). Q, the probability of failure (Y = 0), is symmetric:
The Nagler (1994) scobit formulation incorporates an additional term, taking advantage of the fact that a real number in the unit interval remains within the unit interval if raised to a positive power. Thus, if we apply this to P and Q in the context of the logit, where 0 ≤ P, Q ≤ 1, then 0 ≤ Pα, Qα ≤ 1, where α > 0. Focusing on Qα, the probabilities of success and failure in the scobit, P* and Q*, respectively, can be defined, and the maximum responsiveness to changes is no longer limited to P = 0.5. Thus, where α > 0, the probability of failure with the scobit is
And the probability of success is
When α = 1, this model simplifies to the logit. For lower values of α, maximum responsiveness shifts to the upper end of the distribution of observations. In the case of business lobbying, this means that large, highly productive firms are most likely to lobby.
Because the incorporation of α does away with the symmetric nature of the CDF, the position of the largest marginal effect also changes from P = 0.5 under the logit to
with the scobit. This enables a more accurate model estimation where the response function is asymmetrical or skewed.
Appendix A.4. Robustness Tests
The average marginal effects (AMEs) are reported for most results. AMEs indicate the instantaneous response rate of the DV to the reported IV and are analogous to the slope of a linear predictor.
Table A7.
Productivity and lobbying on 2011 FTAs, logits.
Table A7.
Productivity and lobbying on 2011 FTAs, logits.
| Model 1 | Model 2 | Model 3 | Model 4 | Model 5 | Model 6 | Model 7 | Model 8 | Model 9 | Model 10 | |
|---|---|---|---|---|---|---|---|---|---|---|
| (Lobby) | (Pro-FTA) | (Lobby) | (Pro-FTA) | (Lobby) | (Pro-FTA) | (Lobby) | (Pro-FTA) | (Lobby) | (Pro-FTA | |
| TFP | 0.016 *** | 0.009 *** | 0.016 *** | 0.009 *** | 0.015 *** | 0.009 *** | 0.015 *** | 0.008 *** | 0.015 *** | 0.008 *** |
| (0.002) | (0.002) | (0.02) | (0.002) | (0.002) | (0.002) | (0.002) | (0.002) | (0.002) | (0.002) | |
| Export Status | 0.026 ** | 0.006 | ||||||||
| (0.012) | (0.010) | |||||||||
| Export Sale | 0.003 *** | 0.001 | 0.002 *** | 0.001 | ||||||
| (0.001) | (0.001) | (0.001) | (0.001) | |||||||
| Foreign Income | 0.004 *** | 0.003 *** | 0.004 *** | 0.003 *** | ||||||
| (0.001) | (0.001) | (0.001) | (0.001) | |||||||
| Constant | −10.09 *** | −11.35 *** | −10.21 *** | −11.38 *** | −41.60 *** | −11.36 *** | −11.52 *** | −13.04 *** | −11.55 *** | −13.06 *** |
| N | 4659 | 4659 | 4659 | 4659 | 4659 | 4659 | 4659 | 4659 | 4659 | 4659 |
| Pseudo R2 | 0.33 | 0.33 | 0.34 | 0.33 | 0.34 | 0.33 | 0.39 | 0.41 | 0.40 | 0.41 |
| Wald χ2 | 118.73 *** | 68.35 *** | 113.00 *** | 72.35 *** | 136.65 *** | 69.49 *** | 109.69 *** | 61.70 *** | 126.85 *** | 62.54 *** |
*** p < 0.01, ** p < 0.05. DV is indicated under the model number, and AMEs are reported. All models are logit regressions with robust standard errors clustered on industry.
Table A8.
Productivity and lobbying on 2011 FTAs, linear probability models.
Table A8.
Productivity and lobbying on 2011 FTAs, linear probability models.
| Model 1 | Model 2 | Model 3 | Model 4 | Model 5 | Model 6 | Model 7 | Model 8 | Model 9 | Model 10 | |
|---|---|---|---|---|---|---|---|---|---|---|
| (Lobby) | (Pro-FTA) | (Lobby) | (Pro-FTA) | (Lobby) | (Pro-FTA) | (Lobby) | (Pro-FTA) | (Lobby) | (Pro-FTA) | |
| TFP | 0.014 *** | 0.009 *** | 0.014 *** | 0.009 *** | 0.014 *** | 0.009 *** | 0.012 *** | 0.007 *** | 0.012 *** | 0.007 *** |
| (0.002) | (0.001) | (0.002) | (0.001) | (0.002) | (0.001) | (0.002) | (0.001) | (0.002) | (0.001) | |
| Export Status | 0.012 | 0.003 | ||||||||
| (0.016) | (0.011) | |||||||||
| Export Sales | 0.008 | 0.003 | 0.007 | 0.002 | ||||||
| (0.006) | (0.005) | (0.006) | (0.005) | |||||||
| Foreign Income | 0.003 *** | 0.002 *** | 0.003 *** | 0.002 *** | ||||||
| (0.001) | (0.001) | (0.001) | (0.001) | |||||||
| σu | 0.108 | 0.041 | 0.108 | 0.051 | 0.107 | 0.051 | 0.108 | 0.051 | 0.107 | 0.051 |
| σe | 0.132 | 0.098 | 0.132 | 0.098 | 0.132 | 0.098 | 0.131 | 0.098 | 0.131 | 0.098 |
| ρ | 0.402 | 0.214 | 0.401 | 0.214 | 0.397 | 0.212 | 0.401 | 0.213 | 0.397 | 0.212 |
| Constant | −0.041 *** | −0.027 *** | −0.041 *** | −0.027 *** | −0.041 *** | −0.027 *** | −0.041 *** | −0.027 *** | −0.041 *** | −0.027 *** |
| N | 4659 | 4659 | 4659 | 4659 | 4659 | 4659 | 4659 | 4659 | 4659 | 4659 |
*** p < 0.01. DV is indicated under the model number. Linear regressions include robust standard errors clustered at the industry level and industry-specific fixed effects.
Table A9.
Productivity and lobbying on 2011 FTAs, scobit models.
Table A9.
Productivity and lobbying on 2011 FTAs, scobit models.
| Model 1 | Model 2 | Model 3 | Model 4 | Model 5 | Model 6 | Model 7 | Model 8 | Model 9 | Model 10 | |
|---|---|---|---|---|---|---|---|---|---|---|
| (Lobby) | (Pro-FTA) | (Lobby) | (Pro-FTA) | (Lobby) | (Pro-FTA) | (Lobby) | (Pro-FTA) | (Lobby) | (Pro-FTA) | |
| TFP | 0.015 *** | 0.009 *** | 0.015 *** | 0.009 *** | 0.015 *** | 0.009 *** | 0.015 *** | 0.008 *** | 0.015 *** | 0.008 *** |
| (0.002) | (0.002) | (0.002) | (0.002) | (0.002) | (0.002) | (0.002) | (0.002) | (0.002) | (0.002) | |
| Export Status | 0.021 | 0.004 | ||||||||
| (0.011) | (0.007) | |||||||||
| Export Sales | 0.003 ** | 0.001 | 0.002 ** | 0.001 | ||||||
| (0.001) | (0.001) | (0.001) | (0.001) | |||||||
| Foreign Income | 0.004 *** | 0.002 *** | 0.004 *** | 0.003 *** | ||||||
| (0.001) | (0.001) | (0.001) | (0.001) | |||||||
| Constant | −9.99 *** | −11.44 *** | −10.02 *** | −11.40 *** | −9.97 *** | −11.34 *** | −11.52 *** | −13.02 *** | −11.49 *** | −12.98 *** |
| N | 4659 | 4659 | 4659 | 4659 | 4659 | 4659 | 4659 | 4659 | 4659 | 4659 |
| lnα | −1.664 | −2.157 | −1.487 | −2.080 | −1.498 | −2.040 | −0.811 | −0.904 | −0.546 | −0.699 |
| α | 0.189 | 0.116 | 0.226 | 0.125 | 0.224 | 0.130 | 0.444 | 0.405 | 0.579 | 0.497 |
*** p < 0.01, ** p < 0.05. DV is indicated under the model, and AMEs are reported, along with robust standard errors clustered on industry.
Table A10.
Productivity and lobbying on 2011 FTAs, conditional logit models.
Table A10.
Productivity and lobbying on 2011 FTAs, conditional logit models.
| Model 1 | Model 2 | Model 3 | Model 4 | Model 5 | Model 6 | Model 7 | Model 8 | Model 9 | Model 10 | |
|---|---|---|---|---|---|---|---|---|---|---|
| (Lobby) | (Pro-FTA) | (Lobby) | (Pro-FTA) | (Lobby) | (Pro-FTA) | (Lobby) | (Pro-FTA) | (Lobby) | (Pro-FTA) | |
| TFP | 3.074 *** | 3.165 *** | 3.080 *** | 3.165 *** | 3.068 *** | 3.156 *** | 3.028 *** | 3.080 *** | 3.028 *** | 3.078 *** |
| (0.479) | (0.701) | (0.481) | (0.696) | (0.479) | (0.695) | (0.579) | (0.881) | (0.581) | (0.889) | |
| Export Status | 1.978 | 1.711 | ||||||||
| (1.049) | (1.151) | |||||||||
| Export Sales | 1.117 | 1.083 | 1.082 | 1.088 | ||||||
| (0.081) | (0.100) | (0.092) | (0.093) | |||||||
| Foreign Income | 1.212 *** | 1.319 *** | 1.208 *** | 1.318 *** | ||||||
| (0.064) | (0.123) | (0.064) | (0.123) | |||||||
| N | 1936 | 1572 | 1936 | 1572 | 1936 | 1572 | 1936 | 1572 | 1936 | 1572 |
| Groups | 63 | 37 | 63 | 37 | 63 | 37 | 63 | 37 | 63 | 37 |
| Groups Dropped | 335 | 361 | 335 | 361 | 335 | 361 | 335 | 361 | 335 | 361 |
| Pseudo R2 | 0.45 | 0.48 | 0.45 | 0.49 | 0.45 | 0.49 | 0.49 | 0.55 | 0.49 | 0.55 |
| Wald χ2 | 51.86 *** | 27.05 *** | 51.89 *** | 28.00 *** | 52.10 *** | 28.98 *** | 33.62 *** | 15.47 *** | 33.47 | 15.77 *** |
*** p < 0.01. DV is indicated under the model, and odds ratios are reported with robust standard errors. Groups are segregated based on SIC industry code (a total of 398 industries are included in the full sample). Groups dropped indicates the number of industries omitted as a result of a lack of variation in the dependent variable among the constituent observations.
Table A11.
Productivity and lobbying on 2011 FTAs, multinomial logit model.
Table A11.
Productivity and lobbying on 2011 FTAs, multinomial logit model.
| Lobby | Pro-FTA | |
|---|---|---|
| TFP | 0.007 *** | 0.008 *** |
| (0.001) | (0.002) | |
| Export Sales | 0.001 ** | 0.001 |
| (0.001) | (0.001) | |
| Foreign Income | 0.001 *** | 0.003 *** |
| (3.68 × 10⁻⁴) | (5.46 × 10⁻⁴) | |
| Constant | −10.98 *** | −13.81 *** |
| N | 4675 | |
| Pseudo R2 | 0.35 | |
| Wald χ2 | 132.86 *** | |
*** p < 0.01, ** p < 0.05. DV is indicated under the model, and the baseline category is non-lobbying firms. AMEs are reported with robust standard errors clustered on industry.
Industry-level features are omitted from the preceding tests. Including these environmental characteristics is somewhat problematic, due to the inclusion of a wide range of firms, including multiproduct producers. Consequently, a number of firms are included in the 3-digit SIC or 2–5-digit NAICS sectors. Among these are 14 lobbying firms (including 7 pro-FTA firms) in the NAICS sample, and one lobbying firm (no pro-FTA firms) in the SIC sample. A large number of additional 4-digit SIC or 6-digit NAICS sectors are omitted as a result of a lack of comparable industry-level data. Consequently, tests involving industry-level variables are conducted on roughly half of the original firm-level sample.
Table A12.
Productivity, industries, and lobbying scobit and logit models.
Table A12.
Productivity, industries, and lobbying scobit and logit models.
| Model 1 | Model 2 | Model 3 | Model 4+ | Model 5 | Model 6+ | |
|---|---|---|---|---|---|---|
| (Lobby) | (Pro-FTA) | (Lobby) | (Pro-FTA) | (Lobby) | (Pro-FTA) | |
| TFP | 0.021 *** | 0.012 *** | 0.019 *** | 0.009 *** | 0.023 *** | 0.012 *** |
| (0.004) | (0.003) | (0.004) | (0.003) | (0.004) | (0.003) | |
| Export Sales | 0.002 | −2.81 × 10⁻⁴ | 1.35 × 10⁻⁴ | 1.32 × 10⁻⁴ | 0.002 | 0.001 |
| (0.001) | (0.001) | (0.002) | (0.001) | (0.001) | (0.001) | |
| Foreign Income | 0.005 *** | 0.003 *** | 0.005 *** | 0.004 *** | 0.004 *** | 0.004 *** |
| (0.001) | (0.001) | (0.001) | (0.001) | (0.001) | (0.001) | |
| Trade Balance | 3.44 × 10⁻⁸ | 1.98 × 10⁻⁹ | ||||
| (3.73 × 10⁻⁸) | (3.48 × 10⁻⁸) | |||||
| Revealed Comparative Advantage | 2.56 × 10⁻⁴ | −0.001 | ||||
| (0.006) | (0.004) | |||||
| Capital Intensity | −0.001 | 0.002 | ||||
| (0.004) | (0.003) | |||||
| Constant | −12.33 *** | −29.19 | −12.61 *** | −13.69 *** | −12.30 *** | −16.052 *** |
| N | 2482 | 2482 | 1517 | 1517 | 2341 | |
| lnα | −1.064 | −3.071 | −1.255 | −1.378 ** | ||
| α | 0.345 | 0.046 | 0.285 | 0.252 |
*** p < 0.01, ** p < 0.05. DV is indicated under the model, and AMEs are reported with robust standard errors clustered on industry. +Models 4 and 6 report AMEs for standard logit results because the scobit estimator does not converge.
Table A13.
Productivity, industries, and lobbying ME QR-decomposition logits.
Table A13.
Productivity, industries, and lobbying ME QR-decomposition logits.
| Model 6 | Model 7 | Model 8 | Model 9 | Model 10 | Model 11 | |
|---|---|---|---|---|---|---|
| (Lobby) | (Pro-FTA) | (Lobby) | (Pro-FTA) | (Lobby) | (Pro-FTA) | |
| TFP | 0.022 *** | 0.011 *** | 0.022 *** | 0.012 *** | 0.025 *** | 0.013 *** |
| (0.003) | (0.002) | (0.004) | (0.003) | (0.003) | (0.002) | |
| Export Sales | 0.002 | 7.47 × 10⁻⁴ | 6.52 × 10⁻⁴ | 2.22 × 10⁻⁵ | 0.003 | 7.12 × 10⁻⁴ |
| (0.001) | 6.62 × 10⁻⁴ | (0.002) | (0.001) | (0.002) | 7.83 × 10⁻⁴ | |
| Foreign Income | 0.004 *** | 0.003 *** | 0.005 *** | 0.003 ** | 0.004 *** | 0.003 *** |
| (0.001) | (5.83 × 10⁻⁴) | (0.001) | (8.95 × 10⁻⁴) | (0.001) | (6.75 × 10⁻⁴) | |
| Group, RE Parameter | SIC, Trade Balance | SIC, RCA | SIC, Capital Intensity | |||
| Industry Effect | 3.26 × 10⁻¹⁷ | 1.758 * | 0.762 * | 2.76 × 10⁻¹⁸ | 0.113 * | 0.557 * |
| Industry Coefficient | 1.234 * | 6.642 * | 0.349 * | 6.714 * | 0.971 * | 6.041 * |
| Constant | 4.19 × 10⁻⁷ *** | 4.45 × 10⁻¹⁴ *** | 6.57 × 10⁻⁷ *** | 4.05 × 10⁻¹² *** | 4.96 × 10⁻⁷ *** | 1.55 × 10⁻¹² *** |
| N | 2842 | 2842 | 1517 | 1517 | 2341 | 2341 |
| Groups | 204 | 204 | 105 | 105 | 214 | 214 |
| Wald χ2 | 76.37 *** | 14.03 *** | 39.83 *** | 10.98 ** | 74.63 *** | 16.34 *** |
| LR Test vs. Logit (χ2) | 14.92 *** | 19.82 *** | 7.26 * | 7.94 * | 16.49 *** | 17.83 *** |
*** p < 0.01, ** p < 0.05, * p < 0.1. DV is indicated under the model, and odds ratios are reported. RE variance reports the variance of the second-level random effect (trade balance, revealed comparative advantage, capital intensity); group variance reports the variance of the group-specific constant term, determined by SIC industry. Trade balance and capital intensity are cut into three equal groups for convergence.
Table A14.
Productivity, industry characteristics, and lobbying multinomial logit.
Table A14.
Productivity, industry characteristics, and lobbying multinomial logit.
| Model 1 | Model 2 | Model 3 | ||||
|---|---|---|---|---|---|---|
| Lobby | Pro-FTA | Lobby | Pro-FTA | Lobby | Pro-FTA | |
| TFP | 0.010 *** | 0.011 *** | 0.009 *** | 0.009 *** | 0.011 *** | 0.012 *** |
| (0.002) | (0.003) | (0.003) | (0.003) | (0.002) | (0.003) | |
| Export Sales | 0.001 | 0.001 | 0.001 | 4.46 × 10⁻⁵ | 0.002 | 0.001 |
| (0.001) | (0.001) | (0.001) | (0.001) | (0.001) | (0.001) | |
| Foreign Income | 0.002 ** | 0.004 *** | 0.002 *** | 0.004 *** | 0.001 * | 0.004 *** |
| (0.001) | (0.001) | (0.001) | (0.001) | (0.001) | (0.001) | |
| Trade Balance | 1.06 × 10⁻⁷ | −3.83 × 10⁻⁸ | ||||
| (7.16 × 10⁻⁸) | (2.30 × 10⁻⁸) | |||||
| Revealed CA | −9.47 × 10⁻⁴ | −9.65 × 10⁻⁴ | ||||
| (0.005) | (0.004) | |||||
| Capital Intensity | −0.003 | 0.002 | ||||
| (0.004) | (0.003) | |||||
| Constant | −10.60 *** | −15.72 *** | −10.93 *** | −14.89 *** | −8.88 *** | −16.95 *** |
| Industry Clusters | 204 | 105 | 214 | |||
| N | 2494 | 1527 | 2352 | |||
| Pseudo R2 | 0.40 | 0.39 | 0.39 | |||
| Wald χ2 | 96.07 *** | 104.72 *** | 94.70 | |||
*** p < 0.01, ** p < 0.05, * p < 0.1. DV is indicated under the model, and the baseline category is non-lobbying firms. AMEs are reported with robust standard errors clustered on industry.
Table A15.
Productivity, industries, and lobbying scobit models.
Table A15.
Productivity, industries, and lobbying scobit models.
| Model 1 | Model 2 | Model 3 | Model 4 | Model 5 | Model 6 | |
|---|---|---|---|---|---|---|
| (Lobby) | (Pro-FTA) | (Lobby) | (Pro-FTA) | (Lobby) | (Pro-FTA) | |
| TFP | 0.021 *** | 0.012 *** | 0.016 *** | 0.009 *** | 0.018 *** | 0.010 *** |
| (0.004) | (0.003) | (0.003) | (0.002) | (0.004) | (0.004) | |
| Export Sales | 0.002 | −1.80 × 10⁻⁴ | 0.002 ** | 7.22 × 10⁻⁴ | 0.001 | −4.84 × 10⁻⁴ |
| (0.001) | (0.001) | (0.001) | (8.73 × 10⁻⁴) | (0.002) | (0.002) | |
| Foreign Income | 0.005 *** | 0.003 *** | 0.004 *** | 0.003 *** | 0.005 *** | 0.003 *** |
| (0.001) | (0.001) | (0.001) | (0.001) | (0.001) | (0.001) | |
| Product Differentiation | −0.002 | −0.006 * | ||||
| (0.005) | (0.004) | |||||
| 4-Firm Concentration | 1.22 × 10⁻⁴ | 6.49 × 10⁻⁵ | ||||
| (1.13 × 10⁻⁴) | (7.29 × 10⁻⁵) | |||||
| Grubel–Lloyd Index | −0.009 | −0.013 | ||||
| (0.017) | (0.016) | |||||
| Constant | −12.693 *** | −25.661 *** | −11.728 *** | −13.381 *** | −12.412 *** | −15.604 |
| N | 2502 | 2502 | 4038 | 4038 | 1717 | 1717 |
| lnα | −1.305 * | −2.840 *** | 0.064 | 0.077 | −1.163 | −1.708 |
| α | 0.271 | 0.058 | 1.066 | 1.080 | 0.312 | 0.181 |
*** p < 0.01, ** p < 0.05, * p < 0.1. DV is indicated under the model, and AMEs are reported with robust standard errors clustered on industry.
Table A16.
Productivity, industries, and lobbying ME QR-decomposition logits.
Table A16.
Productivity, industries, and lobbying ME QR-decomposition logits.
| Model 12 | Model 13 | Model 14 | Model 15 | Model 16 | Model 17 | |
|---|---|---|---|---|---|---|
| (Lobby) | (Pro-FTA) | (Lobby) | (Pro-FTA) | (Lobby) | (Pro-FTA) | |
| TFP | 0.024 *** | 0.012 *** | 0.016 *** | 0.009 *** | 0.022 *** | 0.011 *** |
| (0.003) | (0.002) | (0.002) | (0.002) | (0.003) | (0.003) | |
| Export Sales | 0.003 | 6.84 × 10⁻⁴ | 0.002 | 6.18 × 10⁻⁴ | 0.002 | −2.52 × 10⁻⁵ |
| (0.001) | 7.40 × 10⁻⁴ | (0.001) | 7.33 × 10⁻⁴ | (0.002) | (0.001) | |
| Foreign Income | 0.004 *** | 0.003 *** | 0.003 *** | 0.002 *** | 0.005 *** | 0.003 *** |
| (0.001) | (0.001) | (0.001) | (5.27 × 10⁻⁴) | (0.001) | (0.001) | |
| Group, RE Parameter | SIC, Product Differentiation | NAICS, Concentration | SIC, Grubel–Lloyd Inde × | |||
| Industry Effect | 1.24 × 10⁻⁹ | 1.32 × 10⁻¹² | 0.041 * | 0.045 * | 1.656 * | 6.92 × 10⁻⁷ |
| Industry Coefficient | 1.200 * | 6.564 * | 0.766 * | 0.980 * | 2.86 × 10⁻¹⁹ | 6.773 * |
| Constant | 3.93 × 10⁻⁷ *** | 1.57 × 10⁻¹² *** | 1.99 × 10⁻⁶ *** | 2.00 × 10⁻⁷ *** | 2.91 × 10⁻⁷ *** | 1.55 × 10⁻¹² *** |
| N | 2502 | 2502 | 4038 | 4038 | 1717 | 1717 |
| Groups | 223 | 223 | 647 | 647 | 190 | 190 |
| Wald χ2 | 77.94 *** | 18.41 *** | 117.17 *** | 65.26 *** | 51.74 *** | 11.51 *** |
| LR Test vs. Logit (χ2) | 15.84 *** | 17.16 *** | 9.10 * | 5.79 | 10.52 ** | 9.33 *** |
*** p < 0.01, ** p < 0.05, * p < 0.1. DV is indicated under the model, and odds ratios are reported. RE variance reports the variance of the second-level random effect (product differentiation, concentration ratio, or Grubel–Lloyd Index); group variance reports the variance of the group-specific constant term, determined by SIC or NAICS industry. To achieve convergence, concentration ratio is divided into three equal groups (low, medium, highly concentrated). Doing the same for product differentiation and the Grubel–Lloyd Index has no substantive impact on the estimated results of those models.
Table A17.
Productivity, industry characteristics, and lobbying Multinomial Logit.
Table A17.
Productivity, industry characteristics, and lobbying Multinomial Logit.
| Model 1 | Model 2 | Model 3 | ||||
|---|---|---|---|---|---|---|
| Lobby | Pro-FTA | Lobby | Pro-FTA | Lobby | Pro-FTA | |
| TFP | 0.010 *** | 0.011 *** | 0.007 *** | 0.009 *** | 0.008 *** | 0.009 *** |
| (0.002) | (0.003) | (0.001) | (0.002) | (0.002) | (0.002) | |
| Export Sales | 0.002 * | 0.001 | 0.002 ** | 7.73 × 10⁻⁴ | 0.002 | 3.35 × 10⁻⁵ |
| (0.001) | (0.001) | (0.001) | (6.90 × 10⁻⁴) | (0.001) | (0.001) | |
| Foreign Income | 0.002 ** | 0.003 *** | 0.002 *** | 0.003 *** | 0.002 *** | 0.004 *** |
| (0.001) | (0.001) | (4.00 × 10⁻⁴) | (0.006) | (5.85 × 10⁻⁴) | (0.001) | |
| Differentiation | 0.004 | −0.006 * | ||||
| (0.003) | (0.003) | |||||
| Concentration | 5.49 × 10⁻⁵ | 6.58 × 10⁻⁵ | ||||
| 9.00 × 10⁻⁵ | 7.22 × 10⁻⁵ | |||||
| Grubel–Lloyd Index | 0.005 | −0.017 * | ||||
| (0.010) | (0.009) | |||||
| Constant | −10.799 *** | −15.356 *** | −11.044 *** | −14.199 *** | −11.069 *** | −14.477 *** |
| Industry Clusters | 223 | 647 | 119 | |||
| N | 2514 | 4052 | 1727 | |||
| Pseudo R2 | 0.39 | 0.35 | 0.41 | |||
| Wald χ2 | 92.67 *** | 109.93 *** | 155.81 *** | |||
*** p < 0.01, ** p < 0.05, * p < 0.1. DV is indicated under the model, and the baseline category is non-lobbying firms. AMEs are reported. Robust standard errors are clustered on industry (SIC for Models 1 and 3, NAICS for Model 2).
Notes
| 1 | (Schattschneider 1935; Bauer et al. 1972; Destler et al. 1987; Milner 1988) are notable examples. |
| 2 | (Bernard et al. 2012) provide an overview. |
| 3 | Only one producer that lobbied individually on the trade bills in this study and was a privately held textile firm. |
| 4 | Table A1 in the appendix provides a list of these firms. |
| 5 | (Olley and Pakes 1996; Yasar et al. 2008) describe the Stata implementation of the routine. |
| 6 | The variables used in the estimation routine are described in the appendix. |
| 7 | TFP values between the years of this sample are very highly correlated (98–99%), and results are not substantively impacted when different years are substituted. |
| 8 | (Nagler 1994; Achen 2002). A technical definition of the scobit model is presented in the appendix. |
| 9 | Single-level scobit models relying on the raw data produce comparable results, available in Appendix A. |
| 10 | The formula for the calculation is included in Appendix A. |
| 11 | Correlation coefficients for all of the industry-level variables are available in the Appendix A in Table A4. |
| 12 | The data can be found here: https://www.census.gov/econ/concentration.html (accessed on 18 October 2023). |
| 13 | This follows (Eisfeldt and Papanikolaou 2013). |
| 14 | Prentice (1976) and Aranda-Ordaz (1981) provide the initial formulations of this approach. Nagler (1994) and Achen (2002) apply it to political science and discuss it in greater detail. |
| 15 | In addition to this, the probit’s reliance on the cumulative normal distribution makes it particularly unsuited for application in this case. |
References
- Achen, Christopher H. 2002. Toward a New Political Methodology: Microfoundations and ART. Annual Review of Political Science 5: 423–50. [Google Scholar] [CrossRef]
- Aranda-Ordaz, Francisco J. 1981. On Two Families of Transformations to Additivity for Binary Response Data. Biometrika 68: 357–63. [Google Scholar] [CrossRef]
- Barney, Jay. 1991. Firm Resources and Sustained Competitive Advantage. Journal of Management 17: 99–120. [Google Scholar] [CrossRef]
- Bauer, Raymond A, Ithiel de Sola Pool, and Lewis Anthony Dexter. 1972. American Business and Public Policy: The Politics of Foreign Trade. Chicago: Aldine-Atherton, Inc. [Google Scholar]
- Bernard, Andrew B., J. Bradford Jensen, Stephen J. Redding, and Peter K. Schott. 2007. Firms in International Trade. Journal of Economic Perspectives 21: 105–30. [Google Scholar] [CrossRef]
- Bernard, Andrew B., J. Bradford Jensen, Stephen J. Redding, and Peter K. Schott. 2012. The Empirics of Firm Heterogeneity and International Trade. Annual Review of Economics 4: 283–313. [Google Scholar] [CrossRef]
- Bernard, Andrew B., Jonathan Eaton, J. Bradford Jensen, and Samuel S. Kortum. 2003. Plants and Productivity in International Trade. American Economic Review 93: 1268–90. [Google Scholar] [CrossRef]
- Blanchard, Emily, and Xenia Matschke. 2015. US Multinationals and Preferential Market Access. Review of Economics and Statistics 97: 839–54. [Google Scholar] [CrossRef]
- Bombardini, Matilde. 2008. Firm Heterogeneity and Lobby Participation. Journal of International Economics 75: 329–48. [Google Scholar] [CrossRef]
- Bombardini, Matilde, and Francesco Trebbi. 2012. Competition and Political Organization: Together or Alone in Lobbying for Trade Policy? Journal of International Economics 87: 18–26. [Google Scholar] [CrossRef]
- Brasher, Holly, and David Lowery. 2006. The Corporate Context of Lobbying Activity. Business and Politics 8: 1–23. [Google Scholar] [CrossRef]
- Broda, Christian, and David Weinstein. 2006. Globalization and the Gains from Variety. Quarterly Journal of Economics 121: 541–85. [Google Scholar] [CrossRef]
- Chamberlain, Gary. 1980. Analysis of Covariance with Qualitative Data. Review of Economic Studies 47: 225–38. [Google Scholar] [CrossRef]
- Destler, Irving M., John S. Odell, and Kimberly A. Elliott. 1987. Anti-Protection: Changing Forces in United States Trade Politics. Washington, DC: Institute for International Economics. [Google Scholar]
- Drope, Jeffrey M., and Wendy L. Hansen. 2006. Does Firm Size Matter? Analyzing Business Lobbying in the United States. Business and Politics 8: 1–17. [Google Scholar] [CrossRef]
- Eisfeldt, Andrea L., and Dimitris Papanikolaou. 2013. Organization Capital and the Cross-Section of Expected Returns. Journal of Finance 68: 1365–1406. [Google Scholar] [CrossRef]
- Grossman, Gene M., and Elhanan Helpman. 1994. Protection for Sale. American Economic Review 84: 833–50. [Google Scholar]
- Grubel, Herbert G., and Peter John Lloyd. 1975. International Trade in Differentiated Products. London: Macmillan. [Google Scholar]
- Kerr, William R., William F. Lincoln, and Prachi Mishra. 2014. The Dynamics of Firm Lobbying. American Economic Journal: Economic Policy 6: 343–79. [Google Scholar]
- Kim, In Song. 2017. Political Cleavages within Industry: Firm-Level Lobbying for Trade Liberalization. American Political Science Review 111: 1–20. [Google Scholar] [CrossRef]
- Kim, In Song, Helen V. Milner, Thomas Bernauer, Iain Osgood, Gabriele Spilker, and Dustin Tingley. 2019. Firms and Global Value Chains: Identifying Firms’ Multidimensional Trade Preferences. International Studies Quarterly 63: 153–67. [Google Scholar] [CrossRef]
- Kim, Jin-Hyuk. 2008. Corporate Lobbying Revisited. Business and Politics 10: 1–23. [Google Scholar] [CrossRef]
- Lohmann, Susanne. 1995. Information, Access, and Contributions: A Signaling Model of Lobbying. Public Choice 85: 267–84. [Google Scholar] [CrossRef]
- Madeira, Mary Anne. 2016. New Trade, New Politics: Intra-Industry Trade and Domestic Political Coalitions. Review of International Political Economy 23: 677–711. [Google Scholar] [CrossRef]
- Melitz, Marc. 2003. The Impact of Trade on Intra-Industry Reallocations and Aggregate Industry Productivity. Econometrica 71: 1695–725. [Google Scholar] [CrossRef]
- Milner, Helen. 1988. Resisting Protectionism: Global Industries and the Politics of International Trade. Princeton: Princeton University Press. [Google Scholar]
- Nagler, Jonathan. 1994. Scobit: An Alternative Estimator to Logit and Probit. American Journal of Political Science 38: 230–55. [Google Scholar] [CrossRef]
- Olley, G. Steven, and Ariel Pakes. 1996. The Dynamics of Productivity in the Telecommunications Equipment Industry. Econometrica 64: 1263–97. [Google Scholar] [CrossRef]
- Osgood, Iain. 2016a. Differentiated Products, Divided Industries: Firms and the Politics of Intra-Industry Trade. Economics and Politics 28: 161–80. [Google Scholar] [CrossRef]
- Osgood, Iain. 2016b. The Breakdown of Industrial Opposition to Trade: Firms, Product Variety and Reciprocal Liberalization. World Politics 69: 184–231. [Google Scholar] [CrossRef]
- Osgood, Iain. 2018. Globalizing the Supply Chain: Firm and Industrial Support for US Trade Agreements. International Organization 72: 455–84. [Google Scholar] [CrossRef]
- Osgood, Iain, Dustin Tingley, Thomas Bernauer, In Song Kim, Helen V. Milner, and Gabriele Spilker. 2017. The Charmed Life of Superstar Exporters: Survey Evidence on Firms and Trade Policy. Journal of Politics 79: 133–52. [Google Scholar] [CrossRef]
- Plouffe, Michael. 2012. Liberalization for Sale: Heterogeneous Firms and Lobbying Over FTAs. Paper presented at the Annual Convention of the International Studies Association, San Diego, CA, USA, April 2. [Google Scholar]
- Plouffe, Michael. 2015. Heterogeneous Firms and Policy Preferences. In The Oxford Handbook of the Political Economy of International Trade. Edited by Lisa Martin. Oxford: Oxford University Press, pp. 196–209. [Google Scholar]
- Plouffe, Michael. 2017. Heterogeneous Firms and Trade-Policy Stances: Evidence from a Survey of Japanese Producers. Business and Politics 19: 1–40. [Google Scholar] [CrossRef]
- Plouffe, Michael. 2023. Politically Endogenous Trade-Policy Attitudes: Evidence from the 2016 US Presidential Election Cycle. Preprint, Submitted on August 10. Available online: https://osf.io/e4q5f/ (accessed on 11 August 2023).
- Prentice, Ross L. 1976. A Generalization of the Probit and Logit Methods for Dose Response Curves. Biometrics 32: 761–68. [Google Scholar] [CrossRef]
- Richter, Brian Kelleher, Krislert Samphantharak, and Jeffrey F. Timmons. 2009. Lobbying and Taxes. American Journal of Political Science 53: 893–909. [Google Scholar] [CrossRef]
- Schattschneider, Elmer E. 1935. Politics, Pressure, and the Tariff. New York: Prentice Hall. [Google Scholar]
- Schott, Peter K. 2003. One Size Fits All? Heckscher-Ohlin Specialization in Global Production. American Economic Review 93: 686–708. [Google Scholar] [CrossRef]
- Wernerfelt, Birger. 1984. A Resource-Based View of the Firm. Strategic Management Journal 5: 171–80. [Google Scholar] [CrossRef]
- Yasar, Mahmut, Rafal Raciborski, and Brian Poi. 2008. Production Function Estimation in Stata using the Olley and Pakes Method. Stata Journal 8: 221–31. [Google Scholar] [CrossRef]


Disclaimer/Publisher’s Note: The statements, opinions and data contained in all publications are solely those of the individual author(s) and contributor(s) and not of MDPI and/or the editor(s). MDPI and/or the editor(s) disclaim responsibility for any injury to people or property resulting from any ideas, methods, instructions or products referred to in the content. |
© 2023 by the author. Licensee MDPI, Basel, Switzerland. This article is an open access article distributed under the terms and conditions of the Creative Commons Attribution (CC BY) license (https://creativecommons.org/licenses/by/4.0/).