Article

A Study on Customer Satisfaction in Bali’s Luxury Resort Utilizing Big Data through Online Review

by
Angellie Williady
1,
Herwinda Novitya Wardhani
1 and
Hak-Seon Kim
2,3,*
1
Department of Global Business, Kyungsung University, Busan 48434, Korea
2
School of Hospitality & Tourism Management, Kyungsung University, Busan 48434, Korea
3
Wellness & Tourism Big Data Research Institute, Kyungsung University, Busan 48434, Korea
*
Author to whom correspondence should be addressed.
Adm. Sci. 2022, 12(4), 137; https://doi.org/10.3390/admsci12040137
Submission received: 15 September 2022 / Revised: 6 October 2022 / Accepted: 9 October 2022 / Published: 14 October 2022
(This article belongs to the Special Issue A Global Perspective on the Hospitality and Tourism Industry)

Abstract

:
Bali is known as one of the region’s most popular and long-established mass tourism destinations. However, the tourism sector in Indonesia saw a drastic decrease in the number of local and foreign tourists due to COVID-19. The objective of this study is to analyze the factors that are related to customer satisfaction post-COVID-19 in Bali’s resorts. The data consist of a total of 7370 hotel reviews collected from Google Travel. Text mining was used to conduct a frequency analysis to determine which attributes were frequently mentioned. Additionally, semantic network analysis was used to analyze customer experiences and satisfaction in Bali resorts. As a result, the top 88 keywords were divided into five clusters such as “Location”, “Health Protocol”, “Destination Resort”, “Value”, and “F&B”. The first quantitative analysis, factor analysis, shows there are 18 words out of 88 words related to six different clusters. Furthermore, the absolute value result of the linear regression analysis indicated that intangible service is affecting customer satisfaction negatively. As a result of the factor analysis, the two aspects that are related to the intangible service, “hospitality” and “staff”, are considered to be the most important aspects of resorts and should be improved in order to increase customer satisfaction.

1. Introduction

According to Indonesia’s Ministry of Tourism and Creative Economy of Indonesia (2020), 4% of Indonesia’s Gross Domestic Product (GDP) in 2020 came from the tourism sector and is predicted to grow to 4.5%. Indonesia is ranked 44th as the most visited country in the world in absolute terms, with a total of 4 million tourists in 2020 (World Data 2020). With more than 13,400 islands (Wonderful Indonesia 2022a) two cities, particularly Bali and Jakarta, have seen a large influx of investment in the upper-end market in recent years (Indonesia Investments 2016).
Bali is one of the most popular tourist destinations in Indonesia in the eyes of international visitors. A small island with an area of 5632 km it attracts the world with its rich nature (Mayuzumi 2022). The harmony of culture, people, nature, activities, weather, culinary delights, nightlife, and beautiful accommodations makes it one of the best travel destinations in the world and it has been awarded by countless websites, review portals, and travel magazines (Bali.com 2022). However, due to strict border control measures caused by the pandemic, Bali went from receiving about 6.2 million international arrivals in 2019 to 1.05 million in 2020, and compared to the number of international visitors, it dropped from millions of countries to 45 countries in 2021 (Jamaluddin and Marcus 2021).
A previous study by Koerniawaty and Sudjana (2022) mentioned that the tourism sector in Indonesia saw a drastic decrease in the number of local and foreign tourists due to the COVID-19 pandemic. Prior to the relaxation of the border, the Indonesian government started a campaign, CHSE (Cleanliness, Health, Safety, and Environmental Sustainability) Certification Travel with Confidence during COVID-19, at the end of 2020 (TUV Rheinland 2022). Established by the Ministry of Tourism and Creative Economy of Indonesia, a series of standards need to be fulfilled by each establishment to be CHSE Certified (Ministry of Tourism and Creative Economy of Indonesia 2020). Based on a study by Prideaux (2009), Bali resorts are classified as a destination. With that being said, the resort offers more than meals and accommodation (TheyDiffer 2015). Considered a destination themselves, resorts offer entertainment, shopping, and other activities (Morrow 2021). For instance, one of the resorts that are part of this study is the An antara Uluwatu Bali Resort that offers a Balinese Dance Lesson (Anantara Uluwatu Bali Resort 2022), and Maya Sanur Bali offers the Floating Journey, which is a floating dining experience for its guest (Maya Sanur Bali 2022). Despite the ongoing pandemic, there have been few studies conducted during the time frame of the COVID-19 pandemic. There is no significant difference between the satisfaction level before and during the COVID-19 pandemic according to a study conducted regarding a restaurant in Bali in 2022 (Agustiono 2022).
Due to the fact that the Indonesian government has eased up Bali’s travel restrictions towards domestic and foreign travelers (Wonderful Indonesia 2022b), Bali should be prepared for an increase in tourism numbers soon. Taking these factors into consideration, the major objective of this research is to analyze big data in order to analyze the factors that are related to customer satisfaction post-COVID-19 in Bali’s resorts. To achieve the research objectives, this research will endorse the frequency analysis to reveal the key attributes affecting customer satisfaction. CONCOR analysis will then group the attributes into a certain dimension. The outcome of this study will be that the resort manager will be able to identify the key attributes affecting customer satisfaction post-COVID-19 and adapt their marketing strategy in order to generate more revenue. With that being said, there will be five parts in this paper building up to the result. The first part being the introduction, followed by the literature for this study, methodology, result, and lastly, the discussion and conclusion.

2. Literature Review

2.1. Bali Luxury Resorts

A destination resort is defined as a business entity that is simultaneously classified as both a transient lodging establishment and an amusement classification that provides on-site recreational facilities, such as a golf course, skiing, or a water park (Brey et al. 2007). The word luxury is frequently used synonymously with first class and highest standard, the term first class fits more easily into a rating system. A hotel and resort is rated based on the physical attributes present, including the availability of tea-making facilities, bar refrigerators, cable television, internet connections, marble finishes in the lobby with gilt mirrors and carpet, and whether or not there is a doorman, concierge, or room service (Cordato 2008).
A self−contained luxury resort has more than 1500 hotel rooms, with superior restaurant, sports, entertainment, and shopping facilities. Based on their geographic location, leisure resort hotels are categorized into three types: hot spring leisure hotels, seaside leisure hotels, and casino leisure hotels (X. Zhang et al. 2021). In a comparison of the characteristics of casino leisure resort hotels using the two-dimensional factor cluster perception map of recreation businesses developed by C. Zhang (2002), it can be seen that leisure resort hotels and casino resort hotels fall into opposing categories (namely, natural recreation versus artificial entertainment).
Tourism literature has increasingly focused on competition among resort destinations, and evaluating their competitiveness has become one of the most important tools in the process of positioning and marketing (Hudson et al. 2004). Currently, resort destination construction planning and coordination agencies have been established in a number of provinces (Meyer 1997). The future plans for destination resorts can be seen in various news outlets, such as “Moon Dubai”, a project that includes luxurious resorts, a wellness section, a nightclub, and a global meeting space (Team Udayavani 2022). Furthermore, there are many tourist destinations that proclaim to be a resort destination or a destination resorts, such as Phuket (Mariano 2022) and Langkawi (Service India Blooms News 2022).
Bali is renowned as one of the region’s most popular and long-established mass tourism destinations. Erviani (2009) reported that Bali, Indonesia, received an award as “Best destination in Asia” by Asia Wellness at the Asia Wellness Festival Gold Awards at the Landmark Hotel, Bangkok. In addition, Bali was also awarded as the “World’s Best Destination”. This award was given by the Berlin-based fitness magazine Senses, and was accepted at the annual International Tourism Bourse (ITB) in Berlin (Mahadewi and Irwanti 2016). Moreover, Bali has beaches, high-rise resorts, and entertainment opportunities, for example, surfing, stunning natural landscapes, and cultural and religious traditions. Bali islands also possess a wide range of natural resources that make it possible to participate in activities such as rafting, cycling, canoeing, and trekking (Cohen 1996).

2.2. Health Protocol—Cleanliness, Health, Safety, and Environmental Sustainability (CHSE)

Health protocols based on the CHSE framework were developed by the Indonesian government as a derivative of the health protocols (Cleanliness, Health, Safety, and Environmental Sustainability) initially developed by the Ministry of Health and several other departments. The CHSE protocol adopts a regulation issued by an international organization, including the UNWTO. With the CHSE protocol launched, the Ministry of Tourism and Creative Economy clarify the aim of this protocol is to be implemented in the all-tourism business actors associated with the tourism ecosystem, including airlines, hotels, restaurants, SMEs, buses, ferries, airports, sea sports, terminals, and trains as a strategy to develop the quality of tourism. In Indonesia, there are 6.626 companies registered as CHSE certified, from 34 provinces and 300 cities, since this certification was introduced at the beginning of November 2020 (Syahrini 2021).
In order to improve the health protocols for local and international tourists, Cleanliness, Health, Safety, and Environmental Sustainability (CHSE) are being implemented in the tourism and creative economy sectors (Maemunah 2021). The hotel industry utilizes CHSE in several areas, including employee areas (dining and changing areas), offices, housekeeping, kitchen areas, and other public areas, including banquets, coffee shops or restaurants, guest rooms, front desks and concierges (lobbies), and hotel entrances (Ani and Vivian Octariana 2021). The certification is to provide a sense of security to both consumers and employees and follows standard health protocols. Implementing the CHSE standard can be used as an appropriate choice of strategy in rebuilding tourists’ trust again. The Health Protocol is a mandatory criterion that all hotels need to follow when carrying out activities in the new normal period (Galit et al. 2020). A practical CHSE protocol developed by the Ministry of Tourism and Creative Economy was used to increase public awareness of the importance of maintaining health, cleanliness, and safety at the hotels so as to satisfy hotel demands.

2.3. Text Mining of Online Review

As a result of two-way communication through online review sites, large amounts of data related to travel targets, travel facilities, and hotels is created. It is important to recognize the impact of online reviews on the behavior of travelers since tourism is an information-intensive industry (Ernst and Dolnicar 2018). Among the advantages of researching textual customer reviews are the provision of details on customer consumption experiences, the highlights the product and service attributes that customers care about, and the provision of detailed information about consumer perceptions.
Online customer reviews reflect these emotional reactions in the clearest way and are the most direct indication of whether they are satisfied or not. Online reviews have proven to be a rich source of information for analyzing customer opinions, practices, and behaviors (Liu et al. 2017). Online reviews have been found to increase customer awareness and scrutiny of the hotel industry. In the pre-purchase evaluation of hotels, online travel reviews have become an increasingly important source of information. The core parts of online reviews are digital ratings and text reviews (Vermeulen and Seegers 2009).
Text mining is the process of extracting and analyzing large amounts of data from a variety of different sources to discover the hidden patterns within a dataset. It provides information about hidden trends related to products, customers, market trends, and other key factors (Galit et al. 2020). Recently, research using text mining has been conducted in the hospitality industry. The research conducted by Li et al. (2013) used text mining and content analysis of 42,668 online traveler reviews covering star-rated hotels in Beijing, China. In addition, Zhao et al. (2019) analyzed hotels in San Francisco and provided a comprehensive view of the roles of the technical attributes of online reviews in predicting customer ratings. Dong et al. (2014) found that the following seven dimensions are important attributes generating customer satisfaction with hotels in Sanya city, China, based on text mining and content analysis. Ban et al. (2019) investigated the key attributes in the experience and satisfaction of 25 hotels, and Xu and Li (2016) analyzed customer satisfaction and dissatisfaction toward various types of hotels in the United States.

2.4. Customer Satisfaction

Customer satisfaction is an attitude or evaluation formed by comparing their expectations of what they would receive from a product with their subjective perceptions of the actual performance of the product (Oliver 1980). A market-oriented firm considers it to be one of the most significant outcomes of marketing activities (Kandampully and Suhartanto 2003). Another previous study also defined customer satisfaction as the feeling that experienced customers have after comparing their initial expectations and the perceived performance that they received (Kotler and Keller 2009). Customer satisfaction indexes are an effective way of measuring customer satisfaction in hotels (Deng et al. 2013).
There are many factors that lead to customer satisfaction. Gu and Ryan (2008) identified seven elements that positively influence customers’ overall satisfaction: bed comfort, the cleanliness of the bathroom facilities, the size of the rooms and conditions of the facilities, the location and accessibility, the quality of the food and drink, ancillary services, and the performance of the hotel staff. In addition, Ren et al. (2016) categorized the sources of customer satisfaction as follows: tangible and sensorial experiences, staff performance, aesthetic perception, and location. Hotels offer a wide range of core attributes and services. However, some incidental actions can also lead to customer satisfaction, such as corporate social responsibility practices and sustainability practices, which illustrate that the hotel’s operating philosophy is to “do good to do well” (Garay and Font 2012). Customer satisfaction is important to the enhancement of a hotel’s demand, which will improve financial performance and efficiency.

3. Methodology

3.1. Data Collection

It is important to virtualize the information search process. A review is an evaluative statement or statement of opinion written by a customer or potential customer and made available on the internet to end users and institutions (Stauss 2000). This is an essential element of the selection process for prospective hotel guests, enabling them to take advantage of the experiences of other travelers (Levy et al. 2013). Academic research indicates that positive online hotel reviews lead to improved financial performance for hotels (Sparks and Browning 2011) and enhance customer trust (Öǧüt and Onur Taş 2012).
The data from the online resort reviews for this study were collected from Google Travel. Therefore, online reviews can be easily accessed and shared. In order to collect the data, a web crawler was written in SCTM 3.0, which stands for Smart Crawling and Text Mining (Wei and Kim 2022). SCTM 3.0 is a program developed by the Wellness & Tourism Big Data Institute of Kyungsung University for web crawling and data analysis (Handani et al. 2022a). Several types of information were collected, including resort brand names, the identification code of the writer, written date, overall score, and reviews. Many previous studies adopted this methodology to investigate customer satisfaction in different industries, such as airlines (Kwon et al. 2021), theme parks (Zhang and Kim 2021), and wine bars (Fu et al. 2022). All of the previous research was focused on customer satisfaction in the respective industries.
A total of 12.693 reviews were collected from the top 10 resorts in Bali. This ranking information was derived from Trip Advisor (tripadvisor.com). The top 10 resorts ranked based on the number of reviews are presented in Table 1. The number of online reviews remained at 7370. This is after deleting online reviews that only provide a score without a comment. These data were collected for the period from August 2019 to March 2022, that is, from the time the CHSE certificate was implemented.

3.2. Data Analysis

This study adopted both qualitative and quantitative analysis. There were three analyses under qualitative analysis, which were Frequency analysis, Semantic Network Analysis (SNA), and CONCOR analysis. The frequency analysis was based on top-frequency words, which are the words that are frequently mentioned by the guests, followed by finding the relationship between the top frequency words with Semantic Network Analysis through the freeman degree centrality and eigenvector centrality. Afterward, CONCOR analysis was performed to form clusters made from the top-frequency words. A quantitative approach was also used with Exploratory Factor Analysis (EFA) to reduce the countless variables to more concise factors through the oblique rotation process (Tang and Kim 2022). Lastly, the linear regression analysis was performed to predict the value of a variable based on another variable. The research procedure is shown in Figure 1.

4. Result

4.1. Data Collected

Through text mining, a total of 7370 reviews were collected from 10 resorts in Bali that are CHSE certified. The ranks of the words that appeared in valid comments collected were determined by their frequency. A summary of the frequency of numerical ratings from 1 to 5 is provided in Table 2. The following table can be used as a benchmark for evaluating the customer satisfaction levels. The average review rating for resorts in Bali and nearby cities was 4.6 out of 5, and 78% of the reviews were five-star ratings to the resorts. Generally, 6% of customers were dissatisfied with their experience since they provided a rating of 1 or 2.

4.2. Frequency Analysis

According to Table 3, which lists 88 frequent words associated with the resort experience, the top five words were ‘hotel’, ‘good’, ‘room’, ‘pool’, and ‘staff’. In general, the first five ranking words relate to terms associated with the resort industry. The most frequently used word is “hotel”, with 4972 frequencies. ‘Good’ is the second word with a frequency of 2287. The third to the fifth position is occupied by the terms ‘room’, ‘pool’, and ‘staff’ with a frequency of 2109, 1903, and 1873.

4.3. Frequency Analysis

Semantic network analysis examines the relationship between words and exhibits their linkage through the structure of the network (Kim and Kim 2022). This research utilized centrality analysis, which is made up of two indicators. Freeman degree centrality, which is an index, measures the degree of connection between one node and other nodes in the network (Ban et al. 2019). The second indicator is eigenvector centrality, which is used to identify the most influential node in the network. The comparisons between the frequency rank and centrality rank are reflected in Table 4. The centrality rank shows the relationship between the words.
As a result, there was the highest frequency, the coefficient of Freeman’s degree centrality, and coefficient of Eigenvector centrality for the word ‘hotel’. It means that the word “hotel” possesses the highest level of associated meaning. The word exists to be a common and relevant word that is closely related to other words such as ‘good’, ‘room’, ‘pool’, ‘staff’, and ‘service’, which are also significantly high in both freeman degree centrality and eigenvector centrality, thereby indicating that they are closely related to other words of high frequency. Moreover, the words related to the “CHSE” certification appear in the results, such as ‘clean’ in the eighteenth position in frequency but with a higher degree and eigenvector centrality.

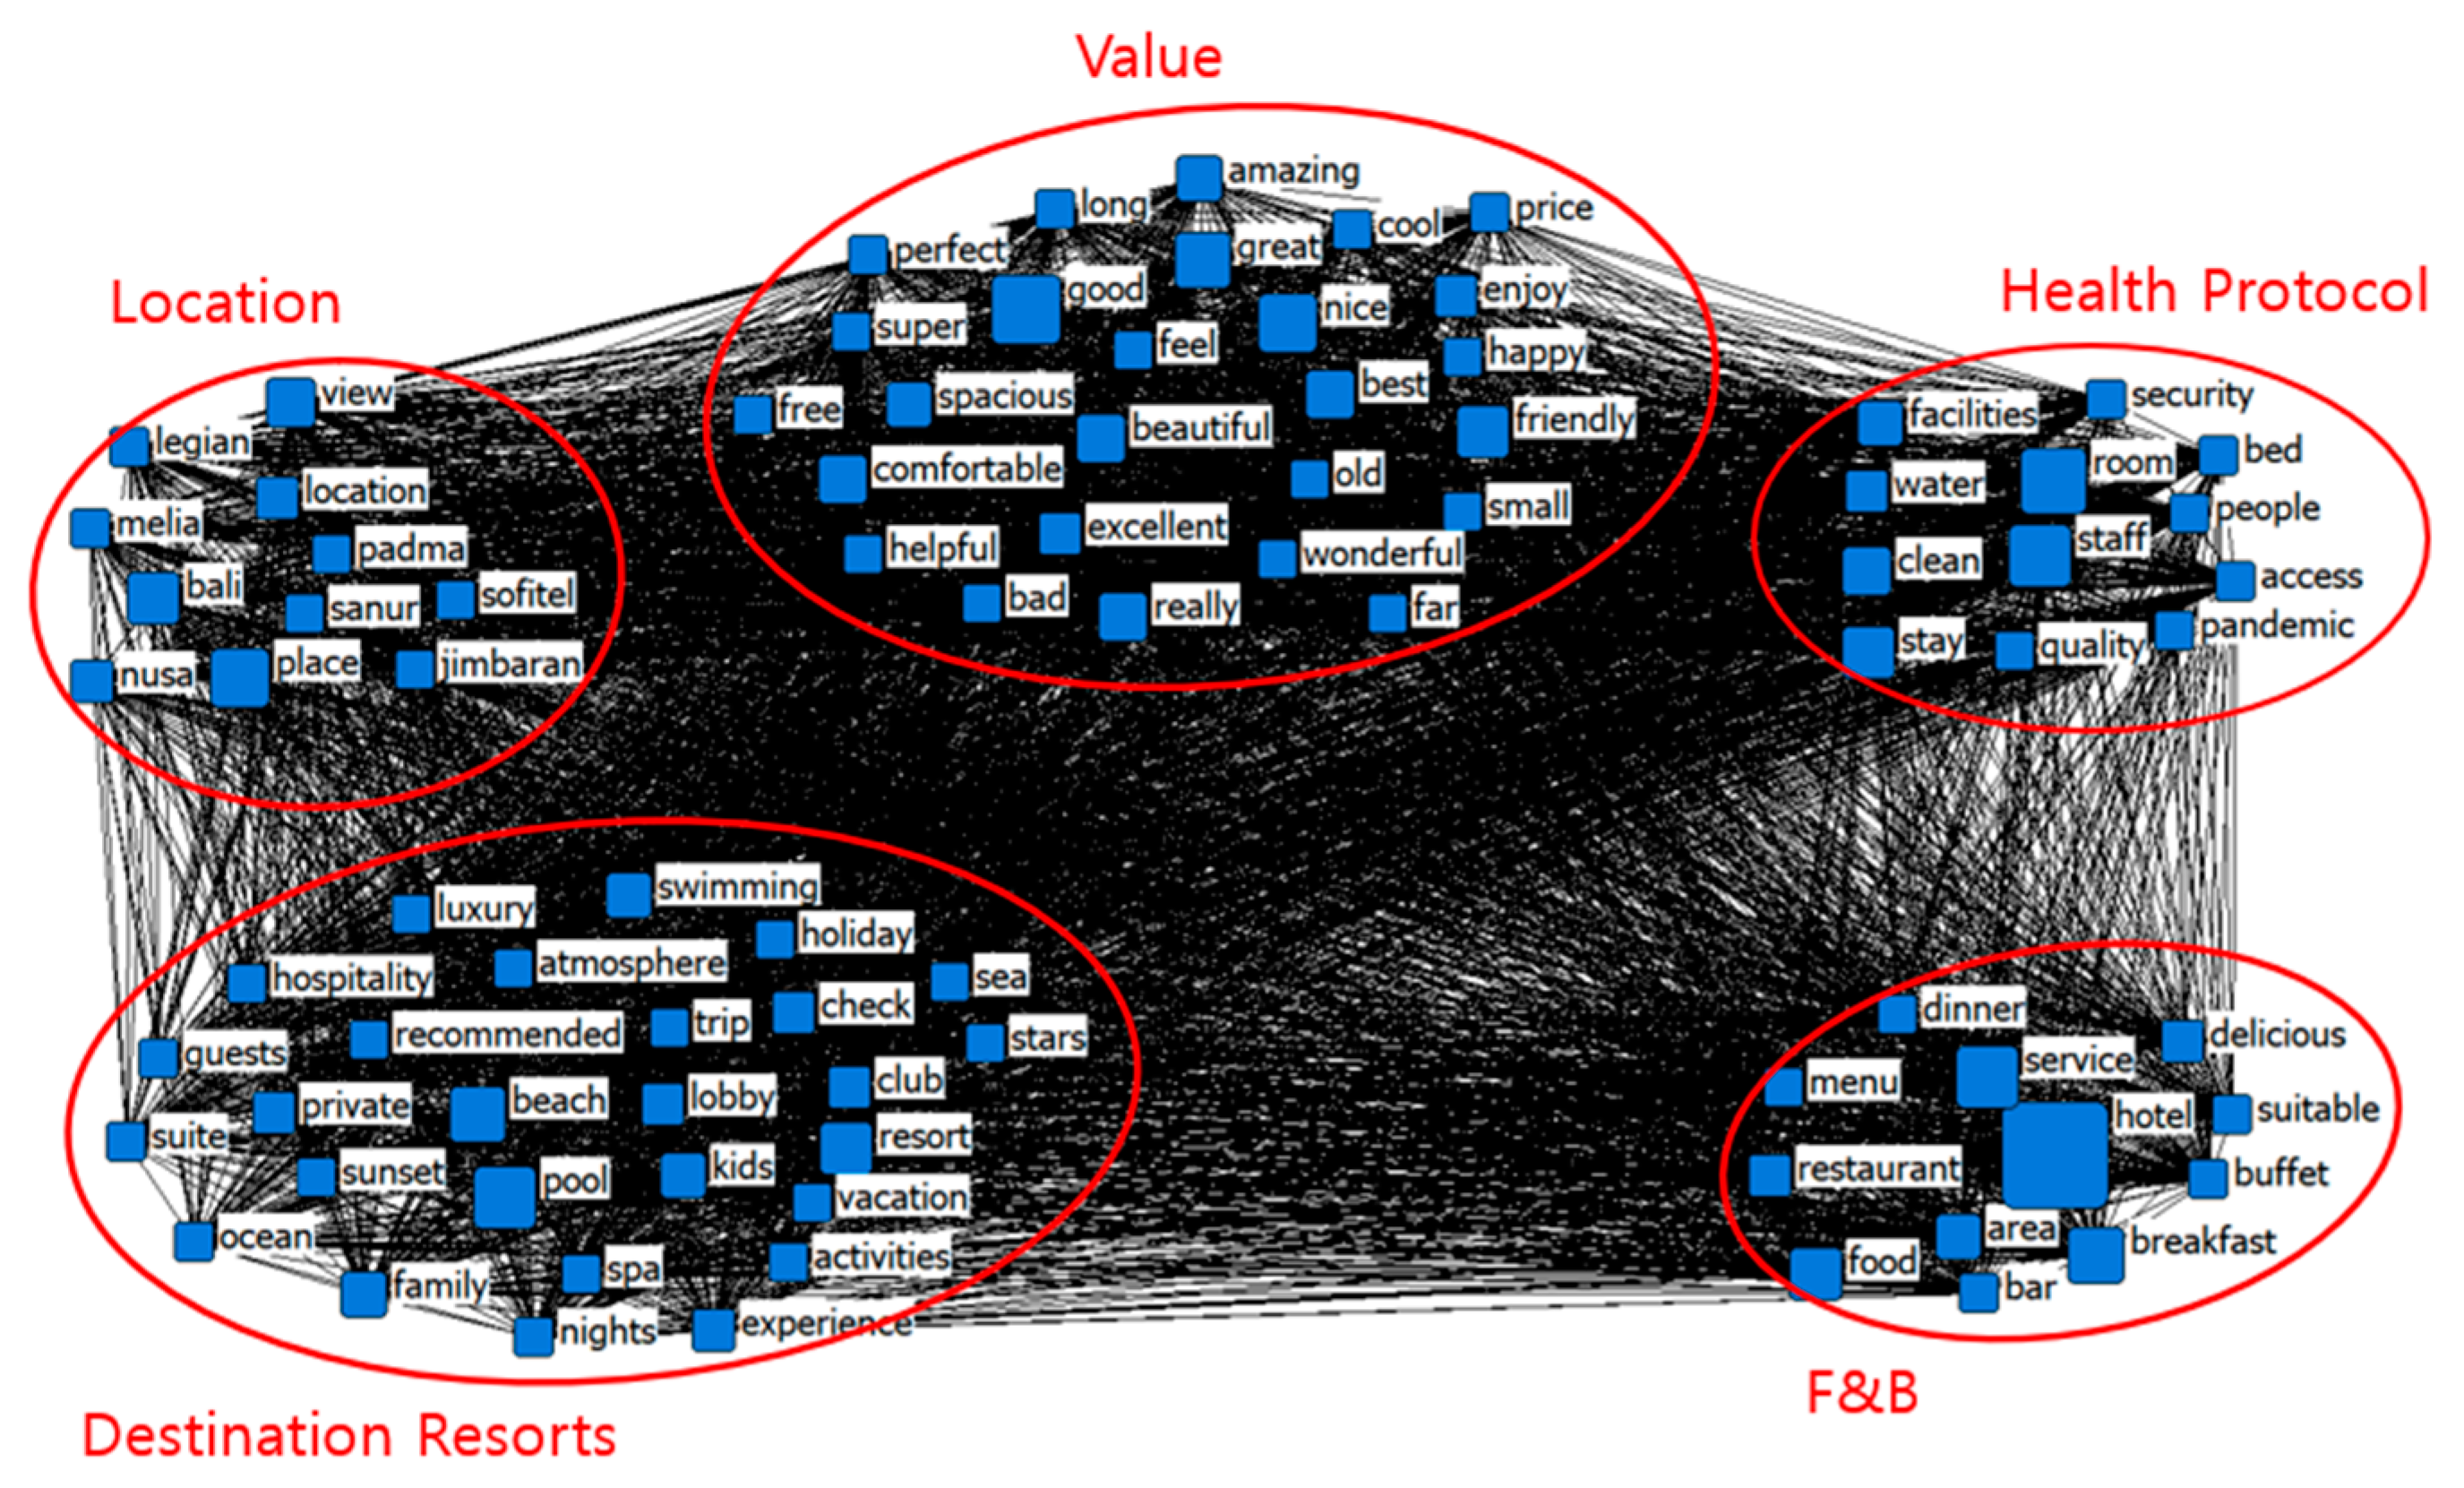
4.4. Convergence of Literated Correlation (CONCOR) Analysis

As shown in Figure 2, this study extracted the top 88 frequent words from the online review. Then, we arranged them into five clusters based on CONCOR Analysis in Figure 3. CONCOR measures the structural equivalence between the words by using Pearson correlation coefficients (Prell 2012). Using the correlation coefficient of the matrices of the concurrent keywords, the study identifies blocks of nodes and forms clusters that include similar keywords. A NetDraw program in UCINET 6.0 was used to visualize the results. Each node is represented by a blue square, its size indicates the frequency, and the network shows the connectivity between them.
Using the CONCOR clustering method, the clusters were generated based on the words from the original reviews that had notable relevance and were subsequently named according to their meanings. This visualized evaluation of the CONCOR analysis is shown in Figure 3. To make it easier to identify which words belong to each group, the words included in the cluster and those to be noted have been listed and summarized in Table 5. In this study, five clusters were intricately entwined with one another. Based on the words, the group was defined as ‘Health Protocol’, ‘Destination Resort’, ‘Location’, ‘F&B’, and ‘Value’.

4.5. Factor Analysis Results

This study utilized factor analysis to determine the factors explaining the relationship and correlation between various independent factors. Based on the variance of keywords in the customer reviews of destination resorts in Bali, this illustrates the relationship between the variables. In factor analysis, the variables are reduced using an oblique rotation process to produce smaller variables. There is a substantial percentage of variance in this study represented by the eigenvalue, which is greater than 1.0. There were 18 words removed from the 88 keywords in total
The KMO (Kaiser–Mayer–Olkin) index in Table 6 was greater than 0.6 with a value of 0.6876 in a Bartlett chi-squared, with the overall significance of the correlation matrix being p < 0.001; this means that these data are acceptable. The six factors were identified as follows: Value (Factor 1), Health Protocol (Factor 2), Intangible Service (Factor 3), Destination Resort (Factor 4), Location (Factor 5), and F&B (Factor 6). Factor 1 contains ‘perfect’, ‘good’, and ‘friendly’, and it was a core value provided by the hotel. Factor 2 contains ‘clean’, ‘security’, ‘pandemic’, ‘pool’, and ‘security’, which referred to a health protocol that was based on the CHSE-certified criteria. Factor 3 Intangible Service contains two, ‘hospitality’ and ‘staff’. Factor 4 was composed of concrete facilities related to destination resorts, these include ‘resorts’, ‘spa’, ‘rooms’, and ‘views’. In Factor 5, words related to the resort’s location are identified, such as ‘location’ and ‘nusa’. Factor 6 had ‘restaurant’ and ‘food’, which related to food and beverages.

4.6. Regression Analysis Results

Following the factor analysis, linear regression was used to analyze guest experience and satisfaction. Table 7 summarizes the independent variables in the linear regression analysis: Value (V), Health Protocol (HP), Intangible Service (IS), Destination Resort (DS), Location (L), and Food and Beverage (FB). The overall variance explained by the six predictors was 29% (R2 = 0.293). The two variables were shown to have positive impacts on guest satisfaction, with “Destination Resort” (β = 0.008, p < 0.001) and “Health Protocol” (β = 0.003, p < 0.05), and we can see the numbers reflected in the reviews, for example: “A great experience to stay here lovely resort with a beautiful garden landscape peaceful and serenity”; “They also offer lots of activities inside the hotel (cycling, tennis, basketball, football, badminton, archery etc.”; “We choose Melia the health protocol is very safe”. Destination resort attributes have largely standardized coefficients, indicating that they are the most important factor associated with customer satisfaction, despite the fact that other studies on customer experience have not focused on this aspect.
In addition, based on its standardized coefficient values, four additional factors: “Value” (β = −0.002, p < 0.05), “Intangible Service” (β = −0.059, p < 0.001), “Location” (β = −0.009, p < 0.001), and “F&B” (β = −0.010, p < 0.001) had a negative impact on guest satisfaction ratings. According to the guest reviews, they are not pleased with the “Value”, “Location”, “Intangibles”, and “Food and Beverage” factors with the review as: “Food is too expensive it’s not worthy, poor menu”, “Nice place but staff not so much”, “Rude and unfriendly Frontline”, “The hotel is good but it is far from where really for a vacation for the family”, “just in the lobby it’s really sucks, the porter/bell boy cannot see the condition, no valet service, and car park far away, bad service”. Despite some negative reviews regarding certain variables, all of the resorts have an overall rating of 4.6 or higher out of 5. This means that even though there are some factors of the hotel that the guests are not satisfied with, the overall service provided by the resort still meets the expectations of the guests.

5. Discussion and Conclusions

5.1. Main Findings

The purpose of this study was to uncover the customer experience and customer satisfaction of 10 luxury resorts based on the top 10 luxury resorts in TripAdvisor that are resisted with an official CHSE certificate. The process of conducting this study involves several steps. To identify the words with highest relationship with other words, the 88 keywords were examined for degree and eigenvector centrality based on the results of frequency analysis. The CONCOR analysis clustered into five different clusters, namely “Value”, “Location”, “Food & Beverage”, “Destination Resort”, and “Health Protocol”. We can see that the word “Clean” is ranked 18 in the frequency and rank 16 and 14 in the freeman degree and eigenvector centrality. This means that even though it is not included in the top 10 frequency words, the word “Clean”, which is one of the main parts of the CHSE certificates, have a significant relationship with the other words. A previous study that used the period during the COVID-19 pandemic also revealed that cleanliness is one of the main attributes that visiting guests pay attention to these days (Lam et al. 2021).
Linear regression analysis provides six Independent variables: Value (V), Health Protocol (HP), Intangible Service (IS), Destination Resort (DR), Location (L), and Food and Beverage (FB). All of the variance is explained by the six variables were 29.3% (R2 = 0.293). The significance level for four variables out of six was 0.001, and two variables were significant at 0.05. According to the standardized coefficient value, two factors positively impacted the average guest satisfaction ratings were “Health Protocols” and “Destination Resort”. However, “Value”, “Intangible Service”, “F&B”, and “Location” variables have been identified as having a negative impact on guest satisfaction.

5.2. Theoretical Implication

This study analyzed 88 top keywords through frequency analysis by using big data followed by centrality analysis (freeman’s degree and eigenvector centrality), CONCOR analysis, factor analysis, and lastly, linear regression analysis. This study utilized SCTM3.0 to perform text mining from the online review, the R program to refine the online review, and lastly, UCINET6.0 to visualize the data (Handani et al. 2022b). The CONCOR analysis was performed to cluster the top keywords into a certain specific cluster, which can help to clarify the implication for empirical application. According to the CONCOR analysis, there were the “Health Protocol” and “Destination Resort’ clusters, which consist of words describing each cluster title. For example, the word “clean”, “security”, and “pandemic” are the reflection of CHSE certificate which all falls into the Health Protocol cluster (Ministry of Tourism and Creative Economy of Indonesia 2020). The words “ocean”, “experience”, and “spa” are a reflection of the destination resort (Prideaux 2009).
According to the linear regression analysis, there were a number of factors such as “Destination Resort” with the words “resort”,”spa”,”room”, and”view” that have a high correlation with guest satisfaction and have a positive impact. We can also conclude that Bali resorts provide several of the activities, facilities, and experiences that are available at destination resorts, which contributes to a higher level of satisfaction for guests. There is an insight that people travel because they are motivated by push and pull factors, push factor is a motivating factor that is intrinsic in nature and may include the desire to escape, the need for rest and relaxation, social interaction, prestige, and health. In addition, to the attractive features of a destination, such as beaches, recreational facilities, and cultural attractions, pull factors also relate to travelers’ expectations and motivations, such as novelty, benefit expectations, and image of traveling (Costa et al. 2004). Various resorts provide some educational opportunities to guests (e.g., massage techniques, cooking lessons, swimming, snorkeling, etc.) that are important in developing memories and positive behavior. Such experiences are particularly important when it comes to developing memories and positive behavior (Ali et al. 2014).

5.3. Managerial Implication

The pandemic has created a huge slope in the tourism and hospitality industry. The number of visitors in Bali dropped from 6.28mil to 1.07mil in 2020 (Statista 2022). The Indonesian president, Jokowi, mentioned that Indonesia has stepped into the new normal and is slowly easing travel restrictions (Fealy 2020). Accordingly, the luxury resorts in Bali should prepare and create a strategic approach towards the new normal to gain more financial benefits.
The first finding in this research allows resort managers to recognize the top-mentioned words, which are the attributes affecting customer satisfaction. With these attributes, the resort managers will be able to adopt it as a marketing approach or evaluation approach to gain more customer satisfaction and other management goals. This study also inspires resort managers to pay more attention to the online reviews that previous customers have written since it provides various information that the resort management will be able to utilize that can affect the future customer satisfaction level. The second result of this study may also be used by managers to reevaluate their resort parts in an effort to gain more guests by investigating customer satisfaction through online reviews. Moreover, it can affect the intentions of other potential guests to book and the loyalty of existing customers from their experience at destination resorts.

5.4. Limitation and Future Research

This study had limitations regarding the collection of data. The study only focused on the top 10 resorts in Bali for the sample, and in order to generalize the results, future studies should examine data from other accommodation types, such as budget hotels and privately owned villas. In addition, the analysis of the collected text was determined based on word frequency and the relationship between the words. Therefore, it was difficult to determine the additional meanings of the words. It is expected that future studies will conduct a deeper analysis of both the positive and negative sentiments for an improved understanding of customer experience and satisfaction.

Author Contributions

Supervision, H.-S.K.; Writing—original draft, A.W. and H.N.W. All authors have read and agreed to the published version of the manuscript.

Funding

This work was supported by the Ministry of Education of the Republic of Korea and the National Research Foundation of Korea (NRF-2022S1A5A2A03052622).

Institutional Review Board Statement

Not applicable.

Informed Consent Statement

Not applicable.

Data Availability Statement

Not applicable.

Conflicts of Interest

The authors declare no conflict of interest.

References

  1. Agustiono, Putu Ema Werdiastuti. 2022. The Effect of product quality and price towards repuchase intentin. Asian Management and Business Review 2: 193–206. [Google Scholar] [CrossRef]
  2. Ali, Faizan, Kashif Hussain, and Neethiahnanthan Ari Ragavan. 2014. Memorable customer experience: Examining the effects of customers experience on memories and loyalty in Malaysian resort hotels. Procedia Social and Behavioral Sciences 144: 273–79. [Google Scholar] [CrossRef] [Green Version]
  3. Anantara Uluwatu Bali Resort. 2022. Leisure: Balinese Dance Lesson. Available online: https://www.anantara.com/en/uluwatu-bali/leisure/?category=at-the-resort (accessed on 28 May 2022).
  4. Ani, Sofiani, and Vivian Octariana. 2021. Efektivitas Penerapan CHSE pada hotel katagori bintang 3 di kota Depok. Journal of Tourism Research 3: 22–35. [Google Scholar] [CrossRef]
  5. Bali.com. 2022. Magical Bali. Available online: https://bali.com/ (accessed on 25 May 2022).
  6. Ban, Hyun-Jeong, Hayeon Choi, Eun-Kyong Choi, Sanghyeop Lee, and Hak-Seon Kim. 2019. Investigating key attributes in experience and satisfaction of hotel customer using online review data. Sustainability 11: 6570. [Google Scholar] [CrossRef] [Green Version]
  7. Brey, Eric T., Alastair M. Morrison, and Juline E. Mills. 2007. An examination of destination resort research. Current Issues in Tourism 10: 415–42. [Google Scholar] [CrossRef]
  8. Cohen, Erike. 1996. Thai Tourism: Hill Tribes, Island and Open-Ended Prostitution. Bangkok: White Lotus Press. [Google Scholar]
  9. Cordato, Anthony. 2008. Luxury holidays. Is luxury a standard, actionable at law? International Travel Law Journal 3: 107–9. [Google Scholar]
  10. Costa, George, Eleni Glinia, Mario Goudas, and Panagiotis Antoniou. 2004. Recreational services in resort hotels: Customer satisfaction aspects. Journal of Sport and Tourism 9: 117–26. [Google Scholar] [CrossRef]
  11. Deng, Weijaw, Mingliang Yeh, and M. L. Sung. 2013. A customer satisfaction index model for international tourist hotels: Integrating consumption emotions into the American customer satisfaction index. International Journal of Hospitality Management 35: 133–40. [Google Scholar] [CrossRef]
  12. Dong, Jian, Hongxiu Li, and Xianfeng Zhang. 2014. Classification of customer satisfaction attributes: An application of online hotel review analysis. Paper presented at 13th Conference on E-Business, e-Services and e-Society, Sanya, China, November 28–30; vol. 445, pp. 238–50. [Google Scholar] [CrossRef] [Green Version]
  13. Ernst, Dominik, and Sara Dolnicar. 2018. How to avoid random market segmentation solutions. Journal of Travel Research 57: 69–82. [Google Scholar] [CrossRef] [Green Version]
  14. Erviani, Ni Komang. 2009. Bali named world’s best spa destination. The Jakarta Post. Available online: https://www.thejakartapost.com/news/2009/03/25/bali-named-world039s-best-spa-destination.html (accessed on 15 July 2022).
  15. Fealy, Grey. 2020. Jokowi in the COVID-19 Era: Repressive pluralism, dynasticism and the overbearing state. Bulletin of Indonesian Economic Studies 56: 301–23. [Google Scholar] [CrossRef]
  16. Fu, Wei, Eun-Kyong Choi, and Hak-Seon Kim. 2022. Text mining with network analysis of online reviews and consumers’ satisfaction: A case study in Busan wine bars. Information 13: 127. [Google Scholar] [CrossRef]
  17. Galit, Shmueli, Peter C. Bruce, Inbal Yahav, Nitin R. Patel, and Kenneth C. Lichtendahl Jr. 2020. Data Mining for Business Analytics: Concepts, Techniques, and Applications in R, 1st ed. Hoboken: John Wiley and Sons, Inc. [Google Scholar]
  18. Garay, Luis, and Xavier Font. 2012. Doing good to do well? Corporate social responsibility reasons, practices and impacts in small and medium accommodation enterprises. International Journal of Hospitality Management 31: 329–37. [Google Scholar] [CrossRef] [Green Version]
  19. Gu, Huimin, and Chris Ryan. 2008. Chinese clientele at Chinese hotels-preferences and satisfaction. International Journal of Hospitality Management 27: 337–45. [Google Scholar] [CrossRef]
  20. Handani, Narariya Dita, Angellie Williady, and Hak-Seon Kim. 2022a. An analysis of customer textual reviews and satisfaction at luxury hotels in Singapore’s Marina Bay area (SG-Clean-Certified Hotels). Sustainability 14: 9382. [Google Scholar] [CrossRef]
  21. Handani, Narariya Dita, Aura Lydia Riswanto, and Hak-Seon Kim. 2022b. A study of inbound travelers experience and satisfaction at quarantine hotels in Indonesia during the COVID-19 pandemic. Information 13: 254. [Google Scholar] [CrossRef]
  22. Hudson, Simon, Brent Ritchie, and Seldjan Timur. 2004. Measuring destination competitiveness: An empirical study of Canadian ski resorts. Tourism and Hospitality, Planning and Development 1: 79–94. [Google Scholar] [CrossRef]
  23. Indonesia Investments. 2016. Opportunities in the Tourism Industry of Indonesia. Available online: https://www.indonesia-investments.com/business/industries-sectors/tourism/item6051 (accessed on 25 May 2022).
  24. Jamaluddin, Masrur, and Lilit Marcus. 2021. Bali Only Received 45 International Tourist in 2021 Despite Reopening. Available online: https://edition.cnn.com/travel/article/bali-tourism-collapse-2021-intl-hnk/index.html (accessed on 25 May 2022).
  25. Kandampully, Jay, and Dwi Suhartanto. 2003. The role of customer satisfaction and image in gaining customer loyalty in the hotel industry. Journal of Hospitality and Leisure Marketing 10: 3–25. [Google Scholar] [CrossRef]
  26. Kim, Yae-Ji, and Hak-Seon Kim. 2022. The impact of hotel customer experience on customer satisfaction through online reviews. Sustainability 14: 848. [Google Scholar] [CrossRef]
  27. Koerniawaty, Francisca Titing, and I. Made Sudjana. 2022. Prospects of wellness tourism in Indonesia as tourism sector recovery effort post COVID-19 pandemic. Budapest International Research and Critics Institute-Journal 5: 10082–91. [Google Scholar] [CrossRef]
  28. Kotler, Philip, and Kevin Lane Keller. 2009. Marketing Management, 13th ed. Upper Saddle River: Pearson Prentice Hall. [Google Scholar]
  29. Kwon, Hye-Jin, Hyun-Jeong Ban, Jae-Kyoon Jun, and Jae-Kyoon Jun. 2021. Topic modeling and sentiment analysis of online review for airlines. Information 12: 78. [Google Scholar] [CrossRef]
  30. Lam, Christina, Zahidah Raimy, Yi Ling Teo, Valentino Tan, Yin Kai Ng, and Johnathan Tan. 2021. Sustaining a hotel business during crisis: A Singapore luxury hotel’s journey during COVID-19. A Publication of the Muma College of Business 6: 1–20. [Google Scholar] [CrossRef]
  31. Levy, Stuart E., Wenjing Duan, and Soyoung Boo. 2013. An analysis of one-star online reviews and responses in the Washington, D.C., lodging market. Cornell Hospitality Quarterly 54: 49–63. [Google Scholar] [CrossRef]
  32. Li, Huiying, Qiang Ye, and Rob Law. 2013. Determinants of customer satisfaction in the hotel industry: An application of online review analysis. Asia Pacific Journal of Tourism Research 18: 784–802. [Google Scholar] [CrossRef]
  33. Liu, Yong, Thorsten Teichert, Matti Rossi, Hongxiu Li, and Feng Hu. 2017. Big data for big insights: Investigating language-specific drivers of hotel satisfaction with 412,784 user-generated reviews. Tourism Management 59: 554–563. [Google Scholar] [CrossRef]
  34. Maemunah, Ita. 2021. Implementation of Cleanliness, Health and Environmental Sustainability guidelines in restaurants around the Southern Java crossing route in Ciamis Regency. Budapest International Research and Critics Institute (BIRCI-Journal): Humanities and Social Sciences 4: 2635–42. [Google Scholar] [CrossRef]
  35. Mahadewi, Ni Made, and Ni Ketut Irwanti. 2016. Image Bali as An Ergonomic Island Destination. Dordrecht: Atlantis Press, pp. 150–53. [Google Scholar] [CrossRef] [Green Version]
  36. Mariano, Kristin. 2022. Standing out in a Saturated Market to Be Phuket’s Favorite Resort Destination. Available online: https://www.traveldailymedia.com/standing-out-in-saturated-market-to-be-phuket-favourite-resort-destination/ (accessed on 13 September 2022).
  37. Maya Sanur Bali. 2022. Experiences at Maya Sanur Floating Journey. Available online: https://mayaresorts.com/sanur/experience/floating-journey (accessed on 28 May 2022).
  38. Mayuzumi, Yoko. 2022. Is meeting the needs of tourists through ethnic tourism sustainable? Focus on Bali, Indonesia. Asia-Pacific Journal of Regional Science 6: 423–51. [Google Scholar] [CrossRef]
  39. Meyer, Robert A. 1997. China will try destination resorts, but planning vagueness is evident. Journal of Travel and Tourism Marketing 5: 85–93. [Google Scholar] [CrossRef]
  40. Ministry of Tourism and Creative Economy of Indonesia. 2020. The Tourism and Creative Economy Secotrs’ Target 2020–2024. Jakarta: Manparekraf. [Google Scholar]
  41. Morrow, Kylie. 2021. Resort vs. Hotels: The Differences and Best Option for Your Next Getaway. Available online: https://www.beaches.com/blog/resorts-vs-hotels/#:~:text=Typically%2C (accessed on 28 May 2022).
  42. Öǧüt, Hulis, and Bedri Kamil Onur Taş. 2012. The Influence of Internet Customer Reviews on the Online Sales and Prices in Hotel Industry. Service Industries Journal 32: 197–214. [Google Scholar] [CrossRef]
  43. Oliver, Richard L. 1980. A cognitive model of the antecedents and consequences of satisfaction decisions. Journal of Marketing Research 17: 460–69. [Google Scholar] [CrossRef]
  44. Prell, Christina. 2012. Social Network Analysis: History, Theory and Methodology, 1st ed. London: SAGE Publication. [Google Scholar]
  45. Prideaux, Bruce. 2009. Resort Destinations: Evolution, Management and Development. Oxford: Elsevier Ltd. [Google Scholar]
  46. Ren, Lianping, Hanqin Qiu, Peilai Wang, and Pearl M. C. Lin. 2016. Exploring customer experience with budget hotels: Dimensionality and satisfaction. International Journal of Hospitality Management 52: 13–23. [Google Scholar] [CrossRef]
  47. Service India Blooms News. 2022. Hilton’s Flagship Brand to Debut in Malaysia’s Popular Resort Destination Langkawi. Available online: https://www.indiablooms.com/travel-details/N/1690/hilton-s-flagship-brand-to-debut-in-malaysia-s-popular-resort-destination-langkawi.html (accessed on 13 September 2022).
  48. Sparks, Beverley A., and Victoria Browning. 2011. The impact of online reviews on hotel booking intentions and perception of trust. Tourism Management 32: 1310–23. [Google Scholar] [CrossRef] [Green Version]
  49. Statista Research Department. 2022. Number of Foreign Tourist Arrivals to Bali, Indonesia from 2012 to 2021. Available online: https://www.statista.com/statistics/976842/foreign-tourist-arrivals-numbers-bali-indonesia/ (accessed on 13 September 2022).
  50. Stauss, Berned. 2000. Using new media for customer interaction: A challenge for relationship marketing. In Relation-Ship Marketing. Edited by Ursula Hansen. Berlin: Springer. Available online: https://link.springer.com/chapter/10.1007/978-3-662-09745-8_13 (accessed on 13 September 2022).
  51. Syahrini, Alfi. 2021. Health protocol certification for tourism business due to COVID-19 outbreaks in Bali. Jurnal Geografi Lingkungan Tropik 5: 67–80. Available online: www.jglitrop.ui.ac.id (accessed on 13 September 2022).
  52. Tang, Mmengying, and Hak-Seon Kim. 2022. An exploratory study of Electronic Word-of-Mouth focused on casino hotels in Las Vegas and Macao. Information 13: 135. [Google Scholar] [CrossRef]
  53. Team Udayavani. 2022. “Moon Dubai”: Multi-Billion Destination Resort to Come Up in Dubai. Available online: https://www.udayavani.com/english-news/moon-dubai-multi-billion-destination-resort-to-come-up-in-dubai (accessed on 13 September 2022).
  54. TheyDiffer. 2015. Difference between Hotel and Resort. Available online: https://theydiffer.com/difference-between-hotel-and-resort/ (accessed on 28 May 2022).
  55. TUV Rheinland. 2022. CHSE (Clean, Health, Safety, and Environment) Certification Program for the Indonesian Ministry of Tourism and Creative Economy. Available online: https://www.tuv.com/landingpage/en/new-normal-solutions/reference-cases/him-indonesia-chse.html#:~:text= (accessed on 25 May 2022).
  56. Vermeulen, Ivar E., and Daphne Seegers. 2009. Tried and tested: The impact of online hotel reviews on consumer consideration. Tourism Management 30: 123–27. [Google Scholar] [CrossRef]
  57. Wei, Shengnan, and Hak-Seon Kim. 2022. Online customer reviews and satisfaction with an upscale hotel: A case study of Atlantis, The Palm in Dubai. Information 13: 150. [Google Scholar] [CrossRef]
  58. Wonderful Indonesia. 2022a. Get to Know the Newest Update on Bali Reopening. Available online: https://www.indonesia.travel/kr/en/campaign/welcome-back-to-bali (accessed on 28 May 2022).
  59. Wonderful Indonesia. 2022b. What Are the Difference Ethic Groups in Indonesia? Available online: https://www.indonesia.travel/gb/en/general-information/culture (accessed on 28 May 2022).
  60. World Data. 2020. Tourism in Indonesia. Available online: https://www.worlddata.info/asia/indonesia/tourism.php (accessed on 25 May 2022).
  61. Xu, Xun, and Yibai Li. 2016. The antecedents of customer satisfaction and dissatisfaction toward various types of hotels: A text mining approach. International Journal of Hospitality Management 55: 57–69. [Google Scholar] [CrossRef]
  62. Zhang, Chih. 2002. Recreation Industry Management, 2nd ed. Taipei: Yang Chih Reading Club. [Google Scholar]
  63. Zhang, Xiaobin, and Hak-Seon Kim. 2021. Customer experience and satisfaction of disneyland hotel through big data analysis of online customer reviews. Sustainability 13: 2699. [Google Scholar] [CrossRef]
  64. Zhang, Xi, Hongda Liu, and Pinbo Yao. 2021. Research jungle on online consumer behaviour in the context of web 2.0: Traceability, frontiers and perspectives in the post-pandemic era. Journal of Theoretical and Applied Electronic Commerce Research 16: 1740–67. [Google Scholar] [CrossRef]
  65. Zhao, Yabing, Xun Xu, and Mingshu Wang. 2019. Predicting overall customer satisfaction: Big data evidence from hotel online textual reviews. International Journal of Hospitality Management 76: 111–21. [Google Scholar] [CrossRef]
Figure 1. Research Procedures.
Admsci 12 00137 g001
Figure 2. Keyword visualization of network analysis generated by UCINET 6.0.
Admsci 12 00137 g002
Figure 3. Visualization of Convergence of literated Correlation (CONCOR) analysis.
Admsci 12 00137 g003
Table 1. Number of Review.
RankResortNumber of ReviewsAverage Satisfaction
1Anantara Uluwatu Resort Bali6784.4
2Maya Sanur Resort & Spa5754.6
3Movepick Resort & Spa Jimbaran Bali12324.6
4Rimba Jimbaran Bali by Ayana7294.6
5Viceroy Bali1234.8
6Melia Bali6304.5
7Padma Resort Legian9604.7
8Sofitel Bali14064.3
9The Legian Seminyak Bali2524.8
10The Ritz-Carlton Bali7854.6
Total7370
Average Rating4.6
Table 2. Overview of the overall satisfaction rating.
RatingFrequencyPercentCum. Percent
13094%4%
21452%6%
32704%10%
488312%22%
5583878%100%
Average Rating 4.6
Table 3. Frequency of top keywords for luxury resorts in Bali.
RankWordsFreqRankWordsFreq
1Hotel 497245Super282
2Good 228746Price282
3Room 210947Perfect277
4Pool 190348Sofitel276
5Staff 187349Nights270
6Service 179850Access269
7Nice 156651Trip267
8Place 149852Free266
9Beach 143953Menu264
10Great 132754Recommended251
11Breakfast 131155Padma249
12Friendly 125356Bar246
13Stay 1228 57Suite239
14Resort 119458People236
15Bali114659Legian235
16Food 113360Feel234
17View 92961Ocean233
18Clean 92062Atmosphere228
19Beautiful 88963Security221
20Really 87264Buffet220
21Best 84665Suitable218
22Comfortable 80766Luxury217
23Kids 76267Holiday217
24Facilities 74668Stars213
25Family 72569Wonderful211
26Swimming 60270Spa209
27Amazing 59171Quality208
28Area 55972Vacation208
29Spacious 53873Pandemic199
30Restaurant 46974Happy198
31Experience46175Jimbaran197
32Check42076Activities197
33Excellent41277Small194
34Private37478Melia194
35Nusa37079Hospitality191
36Location36480Far191
37Delicious35381Bad189
38Club34382Long188
39Lobby32483Sea183
40Enjoy30584Sanur182
41Water30285Sunset181
42Cool29486Dinner177
43Helpful28787Bed176
44Guests28788Old175
Table 4. Comparison of frequency and centrality of words.
FreqFreeman Degree
Centrality
Eigenvector
Centrality
FreqRankCoef.RankCoef.Rank
Hotel 4972126.3210.351
Good 2287216.9350.245
Room 2109318.2240.254
Pool 1903418.3220.253
Staff 1873518.2830.252
Service 1798614.7570.216
Nice 1566711.28130.1712
Place 149889.36170.1316
Beach 1439914.8360.207
Great 13271012.29110.1810
Breakfast 13111114.2780.208
Friendly 12531212.9790.199
Stay 1228 1312.22120.1713
Resort 1194149.86150.1317
Bali1146159.90140.1315
Food 11331612.51100.1811
View 929177.65210.1120
Clean 920189.72160.1414
Beautiful 889197.69200.1121
Really 872208.73180.1218
Best 846217.97190.1119
Comfortable 807225.99270.0827
Kids 762237.62220.1123
Facilities 746246.97250.1025
Family 725257.16240.1024
Swimming 602267.35230.1122
Amazing 591275.77300.0830
Area 559286.21260.0826
Spacious 538295.99280.0828
Restaurant 469305.89290.0829
Hotel 4972126.3210.351
Good 2287216.9350.245
Room 2109318.2240.254
Pool 1903418.3220.253
Staff 1873518.2830.252
Service 1798614.7570.216
Nice 1566711.28130.1712
Place 149889.36170.1316
Beach 1439914.8360.207
Great 13271012.29110.1810
Breakfast 13111114.2780.208
Friendly 12531212.9790.199
Stay 1228 1312.22120.1713
Resort 1194149.86150.1317
Table 5. Result of CONCOR Analysis.
Extracted WordsSignificant Word
LocationNusa/sanur/view/melia/place/bali/jimbaran/location/padma/legian/sofitelNusa/sanur/melia/place/bali/ jimbaran/location/padma/legian/sofitel
ValueFar/bad/excellent/comfortable/beautiful/best/enjoy/really/friendly/amazing/good/happy/long/small/helpful/free/price/spacious/nice/cool/perfect/great/super/long/feel/wonderful Comfortable/beautiful/best/friendly//bad/amazing/happy/helpful/price/spacious/nice/cool/perfect/great/super/feel/wonderful/excellent
Health
Protocol
Facilities/quality/staff/people/water/bed/access/room/security/stay/clean/pandemic Facilities/quality/staff/people/water/bed/access/room/security/stay/clean/pandemic
F&BDelicious/food/menu/suitable/bar/hotel/area/buffet/breakfast/dinner/service/restaurant Delicious/food/menu/bar/buffet/breakfast/dinner/service/restaurant
Destination ResortVacations/nights/holiday/family/lobby/trip/luxury/sunset/srecommended/hospitality/club/spa/private/kids/suite/beach/swimming/atmosphere/guests/pool/resort/check/stars/sea/activities/ocean/experience Vacation/nights/holiday/family/trip/luxury/sunset/hospitality/club/spa/private/kids/suite/beach/swimming/atmosphere/guests/pool/resort/stars/sea/activities/ocean/experience
LocationNusa/sanur/view/melia/place/bali/jimbaran/location/padma/legian/sofitelNusa/sanur/melia/place/bali/jimbaran/location/padma/legian/sofitel
Table 6. Factor Analysis Result.
FactorWordsFactor
Loading
Eigen
Value
Cum.
Variance
ValuePerfect0.9843.69916.584
Good0.982
Friendly0.977
Health
Protocol
Clean0.8252.06327.529
Pool0.779
Security0.530
Pandemic0.502
Intangible ServiceHospitality0.9701.92338.152
Staff0.968
Destination ResortResort0.7661.45348.382
Spa0.740
Room0.534
View0.482
LocationLocation0.8751.34957.043
Nusa0.853
F&BRestaurant0.7391.19764.907
Food0.676
Breakfast0.480
KMO (Kaiser Meyer Olkin) = 0.686
Bartlett chi-squared (p) = 10,398.411 (p < 0.001)
Table 7. Linear Regression Analysis Result.
ModelUnstandardized
Coefficients
Standardized
Coefficients
t
βStd. ErrorBeta
(Constant)4.9820.002 2198.702
Value−0.0020.002−0.030−0.862
Health Protocol0.0030.0020.0441.259
Intangible Service −0.0590.004−0.514−14.687 ***
Destination Resort 0.0080.0020.1373.833 ***
Location−0.0090.002−0.139−4.001 ***
F&B−0.0100.003−0.122−3.443 ***
Notes: Dependent Variable: Customer Satisfaction (GS); R2 = 0.293; adjusted R2 = 0.286; F = 40.837; *** p < 0.001.
Publisher’s Note: MDPI stays neutral with regard to jurisdictional claims in published maps and institutional affiliations.

