Article

Longitudinal Analysis of Sucralose at a Water Treatment Wetland

1
Department of Chemistry, University of Central Florida, 4111 Libra Drive, Orlando, FL 32816, USA
2
Department of Chemistry, Utah Valley University, 800 W University Parkway, Orem, UT 84058, USA
3
Orlando Easterly Wetlands, 25155 Wheeler Road, Christmas, FL 32709, USA
*
Author to whom correspondence should be addressed.
Environments 2022, 9(9), 111; https://doi.org/10.3390/environments9090111
Submission received: 13 July 2022 / Revised: 27 August 2022 / Accepted: 28 August 2022 / Published: 31 August 2022

Abstract

:
Sales of low-calorie sweeteners are increasing in the Unites States, with sucralose representing the second largest of the U.S. market share. Since >99% of ingested sucralose is excreted as the parent compound, it represents a contaminant of emerging concern and has been proposed as an indicator of pollution of natural waters by anthropogenic waste. Many report that it is increasingly omnipresent in surface, coastal, and drinking water. Given the increasing consumption of low-calorie sweeteners, changes in influent and effluent sucralose concentrations presage their concentrations in natural waters. The aim of this research was to quantify sucralose at a constructed treatment wetland that was designed to remove nutrients (nitrogen and phosphorus) from secondary treated wastewater. We report the concentrations of sucralose in the surface water, sediment, and porewater throughout the flow train of the wetlands over a period of three years and include surface water sampling following an extreme weather event. The average influent surface water concentration of sucralose was 24 ± 2 ppb, and the average outfall concentration was 20 ± 6 ppb, indicating the sucralose is not subjected to chemical or physical adsorption in the sediment within the wetland.

Graphical Abstract

1. Introduction

Sucralose (1,6-dichloro-1,6-dideoxy-β-d-fructofuranosyl 4-chloro-4-deoxy-α-d-galactopyranoside) is an artificial sweetener made by selective chlorination of three hydroxyl sites in sucrose. As a non-caloric sweetener sold under the brand name Splenda®, it has been used since 2000 in the Unites States and Canada, and since 2003 in the European Union. A common sweetener in diet soda beverages, cereals, and sugar-free desserts, it was the best-selling artificial sweetener in the Unites States for several years [1] and has only recently has fallen to second behind aspartame [2]. The reported trend for the consumption of non/low-caloric sweeteners has been increasing since the early 2000s [2,3,4].
Average daily intake (ADI) of sucralose has not been thoroughly investigated in the United States [5]. However, usage has been estimated by consumer studies and Dunford et al. reported a significant increase in the volume of products containing sucralose that were purchased from 2002 to 2018 [2]. Based on their findings, they estimated an average of 49.4 g per capita per day was purchased in 2018 [2]. Once ingested, sucralose is not hydrolyzed in the human intestine and is excreted (>99%) in urine, feces [6], and breastmilk [7], therefore accounting for its presence in wastewater. Previous studies have shown between 4.5–40.1 µg/L sucralose entering wastewater treatment plants (WWTP) [8]. Processes in municipal WWTPs, including prolonged exposure to ultraviolet radiation and chlorine, do not significantly degrade sucralose [9,10]. Advanced oxidation techniques like ozonation have shown promise, but are very sensitive to the presence of radical scavenging concomitants and are not normally utilized in WWTPs [10]. While degradation in aerobic and anaerobic processes in WWTPs have historically shown limited or no ability to remove sucralose [9,10,11,12,13,14,15], recent studies have shown increased rates of removal linked to new aerobic bacteria [8,16]. Sucralose and other artificial sweeteners have been proposed as indicators of wastewater loading in natural waters [17]. The presence of artificial sweeteners in surface, waste, and drinking water has been increasing [18,19,20], while the slow degradation of sucralose (months or years) ensures its persistence in the environment [10,21,22].
While it has been shown not to affect plant indicator species at reported environmental concentrations [10], another study by Amy-Sagers et al. showed that Lemna minor (a common aquatic freshwater plant) had increased growth over a 21-day period with exposure to sucralose [23]. Sucralose has been predicted to have a low bioaccumulation potential [24] and this has been confirmed in several experimental studies [25,26]. However, a recent study of lettuce and leek crops irrigated with treated and reclaimed wastewater were shown to have sucralose accumulating in the leaves [27].
The human health risks of sucralose are still being debated [28], but evidence has shown that artificial sweeteners can modify the gut microbiota in mice, which may result in glucose intolerance [29]. Environmental risks have long been thought to be negligible, but recent studies on Daphnia magna (a small freshwater planktonic organism) have shown sucralose to have physiological and behavioral effects [30]. Furthermore, in Cyprinus carpio (a freshwater fish) there was a significant increase in oxidative damage to lipids and proteins [25].
The focus of this research was to determine the concentration of sucralose present throughout the flow path of a constructed wetland in the southeastern United States that receives daily loads of wastewater influent from a nearby WWTP. Treatment of wastewater by biotic and abiotic processes at constructed wetlands is a common water polishing process [31]. The presence of heterotrophic microbes [32], submerged and emergent aquatic vegetation [33], organic matter accumulation [34], reduction and oxidation [35], and precipitation and sorption [36] processes that occur in the wetland cause the removal of nutrients such as nitrogen and phosphorus. The Orlando Easterly Wetlands (OEW) was created as a tertiary treatment for water from a nearby Iron Bridge municipal wastewater treatment plant (WWTP) that serves approximately 400,000 residents of east Orange County, Florida, USA. It was connected by a 27 km pipeline to the Iron Bridge WWTP and began receiving approximately 53 million liters per day (MLD) of the outflow in July of 1987 [37]. Intended at its inception to remove nitrogen and phosphorus from the wastewater, the site has been successful, showing a decrease in the total nitrogen from 1.79 mg/L (inflow) to 0.88 mg/L (outfall), and phosphorous from 0.244 mg/L (inflow) to 0.061 mg/L (outfall). The OEW has been a rich source of water treatment research including hydraulic analysis [38], uric acid analysis [39], effects of prescribed burns [35], and service-learning educational research [40].
The purpose of this work was to conduct a longitudinal study of the concentration of sucralose in the constructed wetland treatment system that would provide an indication of two metrics: first, determination of the entry of sucralose into the wastewater varies over time due to changes in human consumption and second, if the concentration profile of sucralose within the wetlands flow train is changing over time. The time frame reported herein extends from October 2015 to October 2018, and includes a sampling after an extreme weather event (i.e., Hurricane Irma in September 2017).

2. Materials and Methods

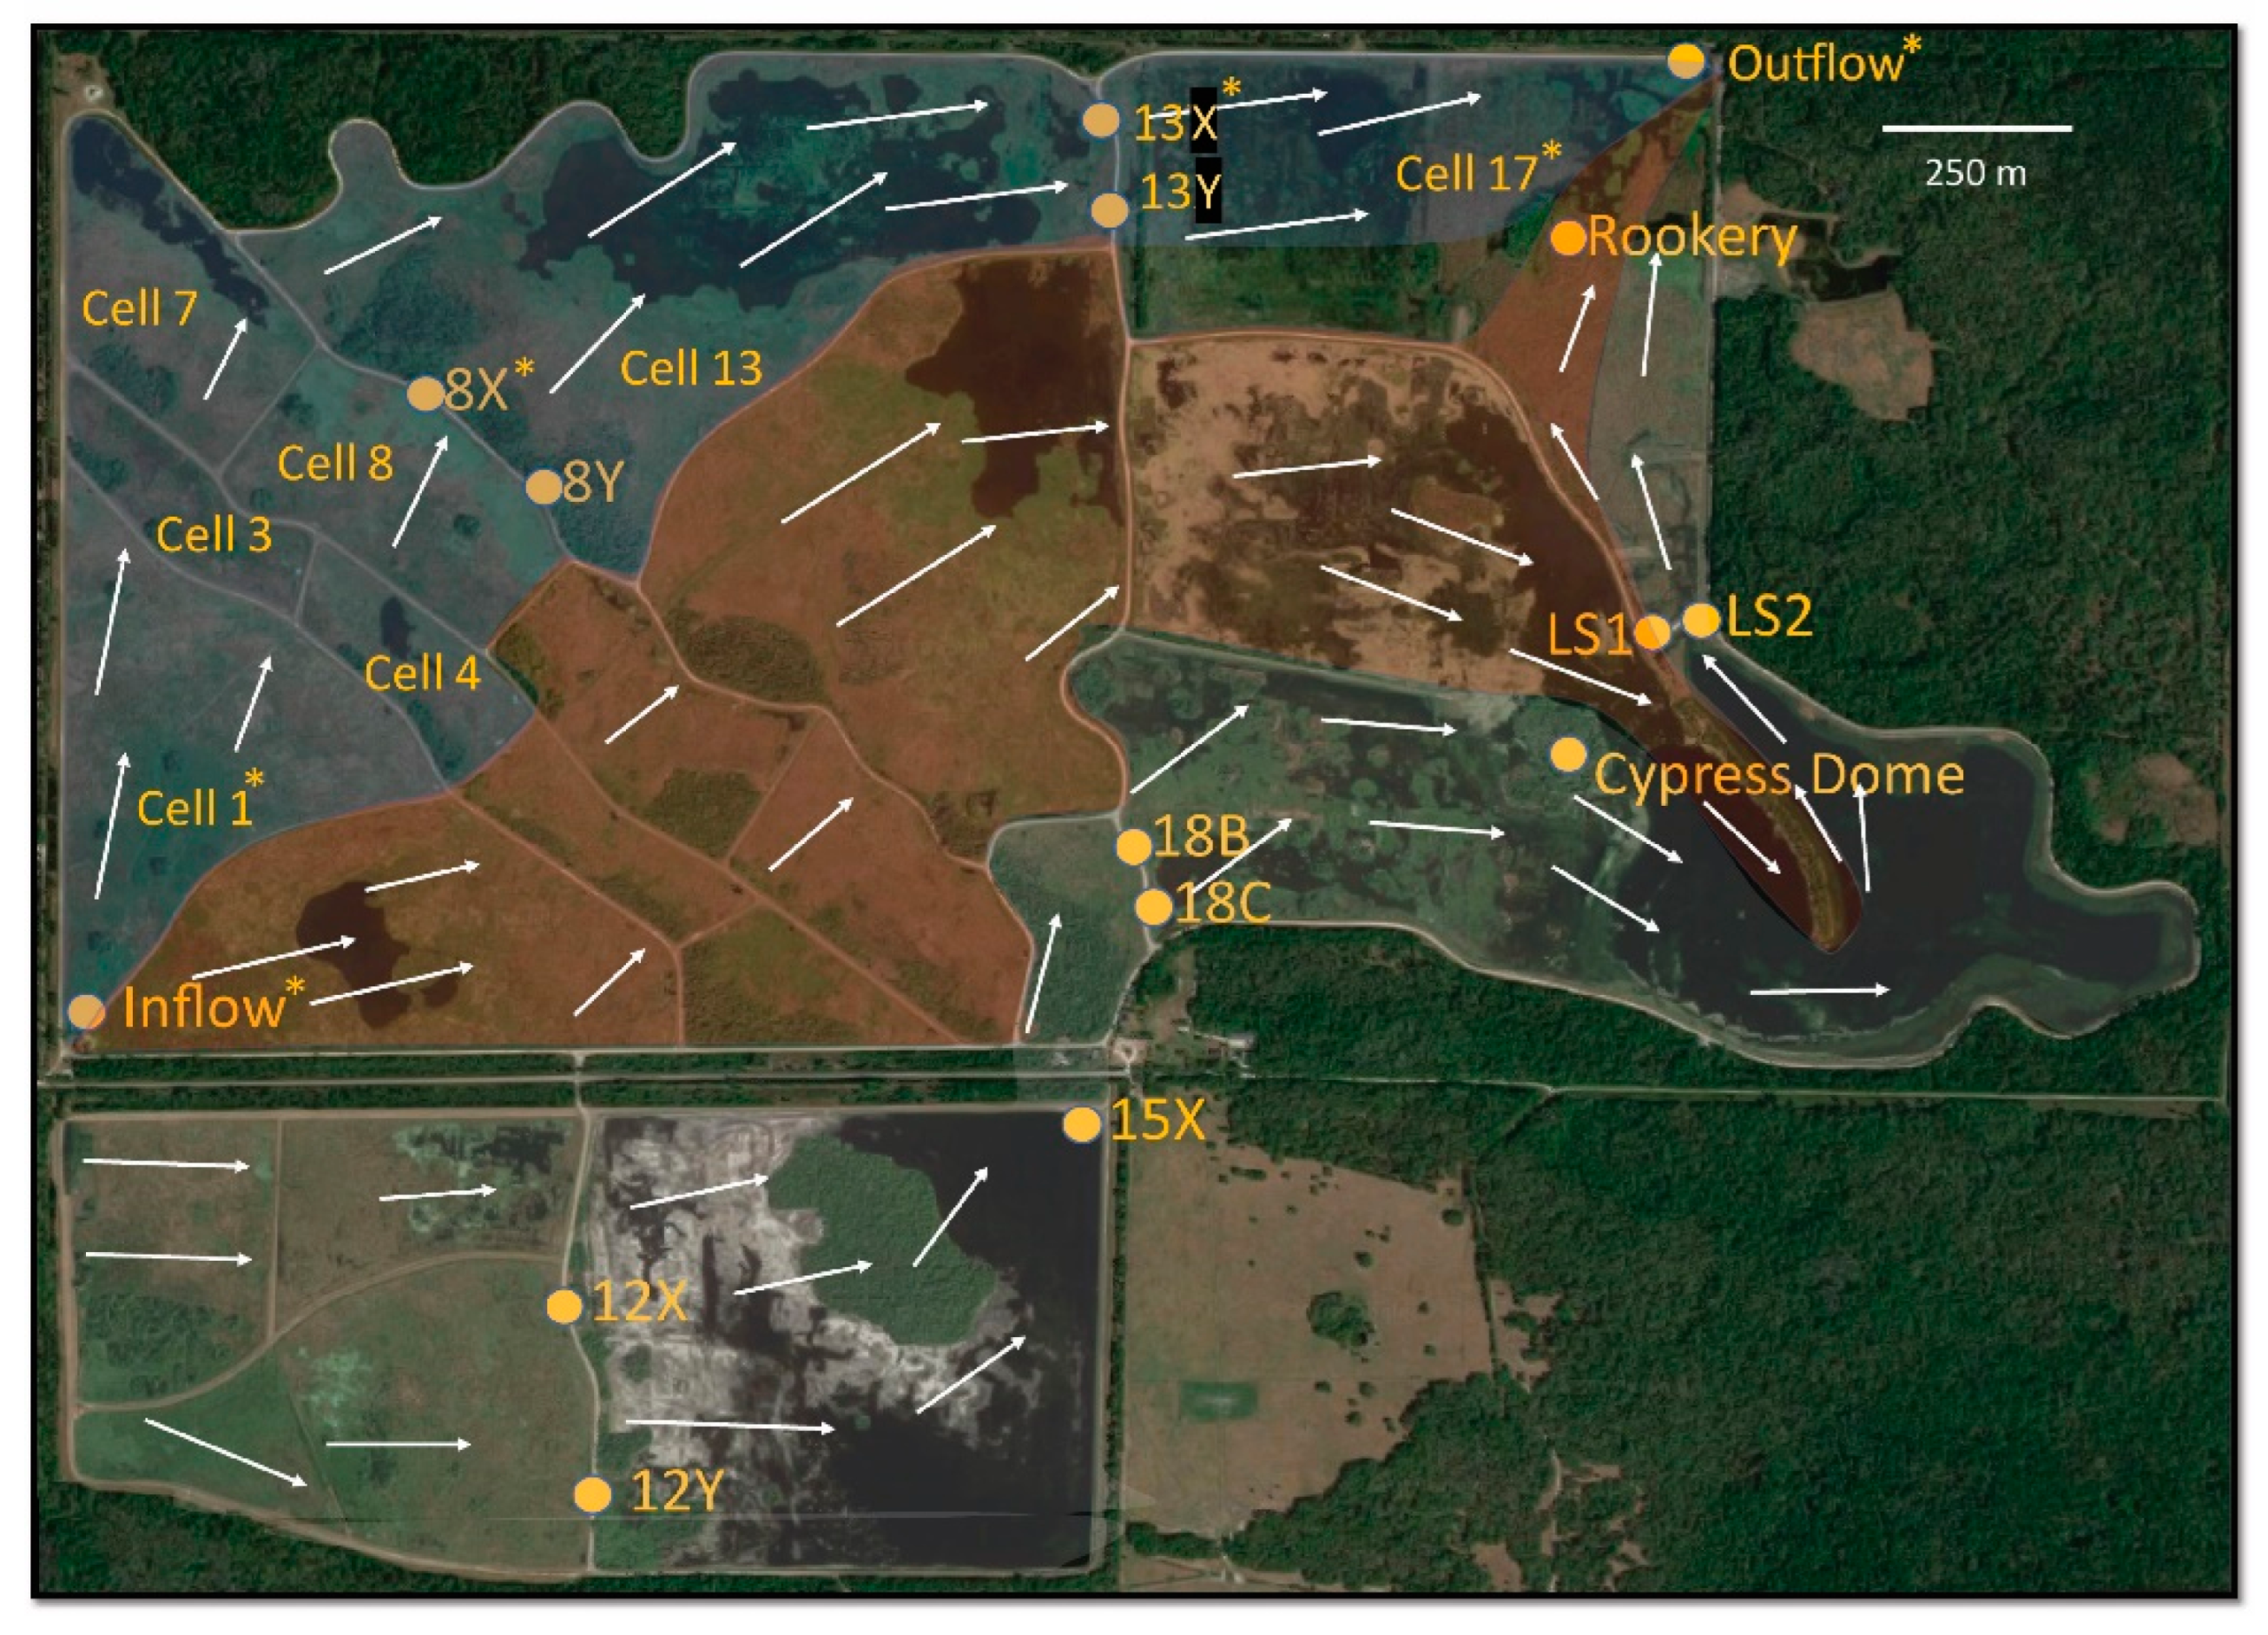
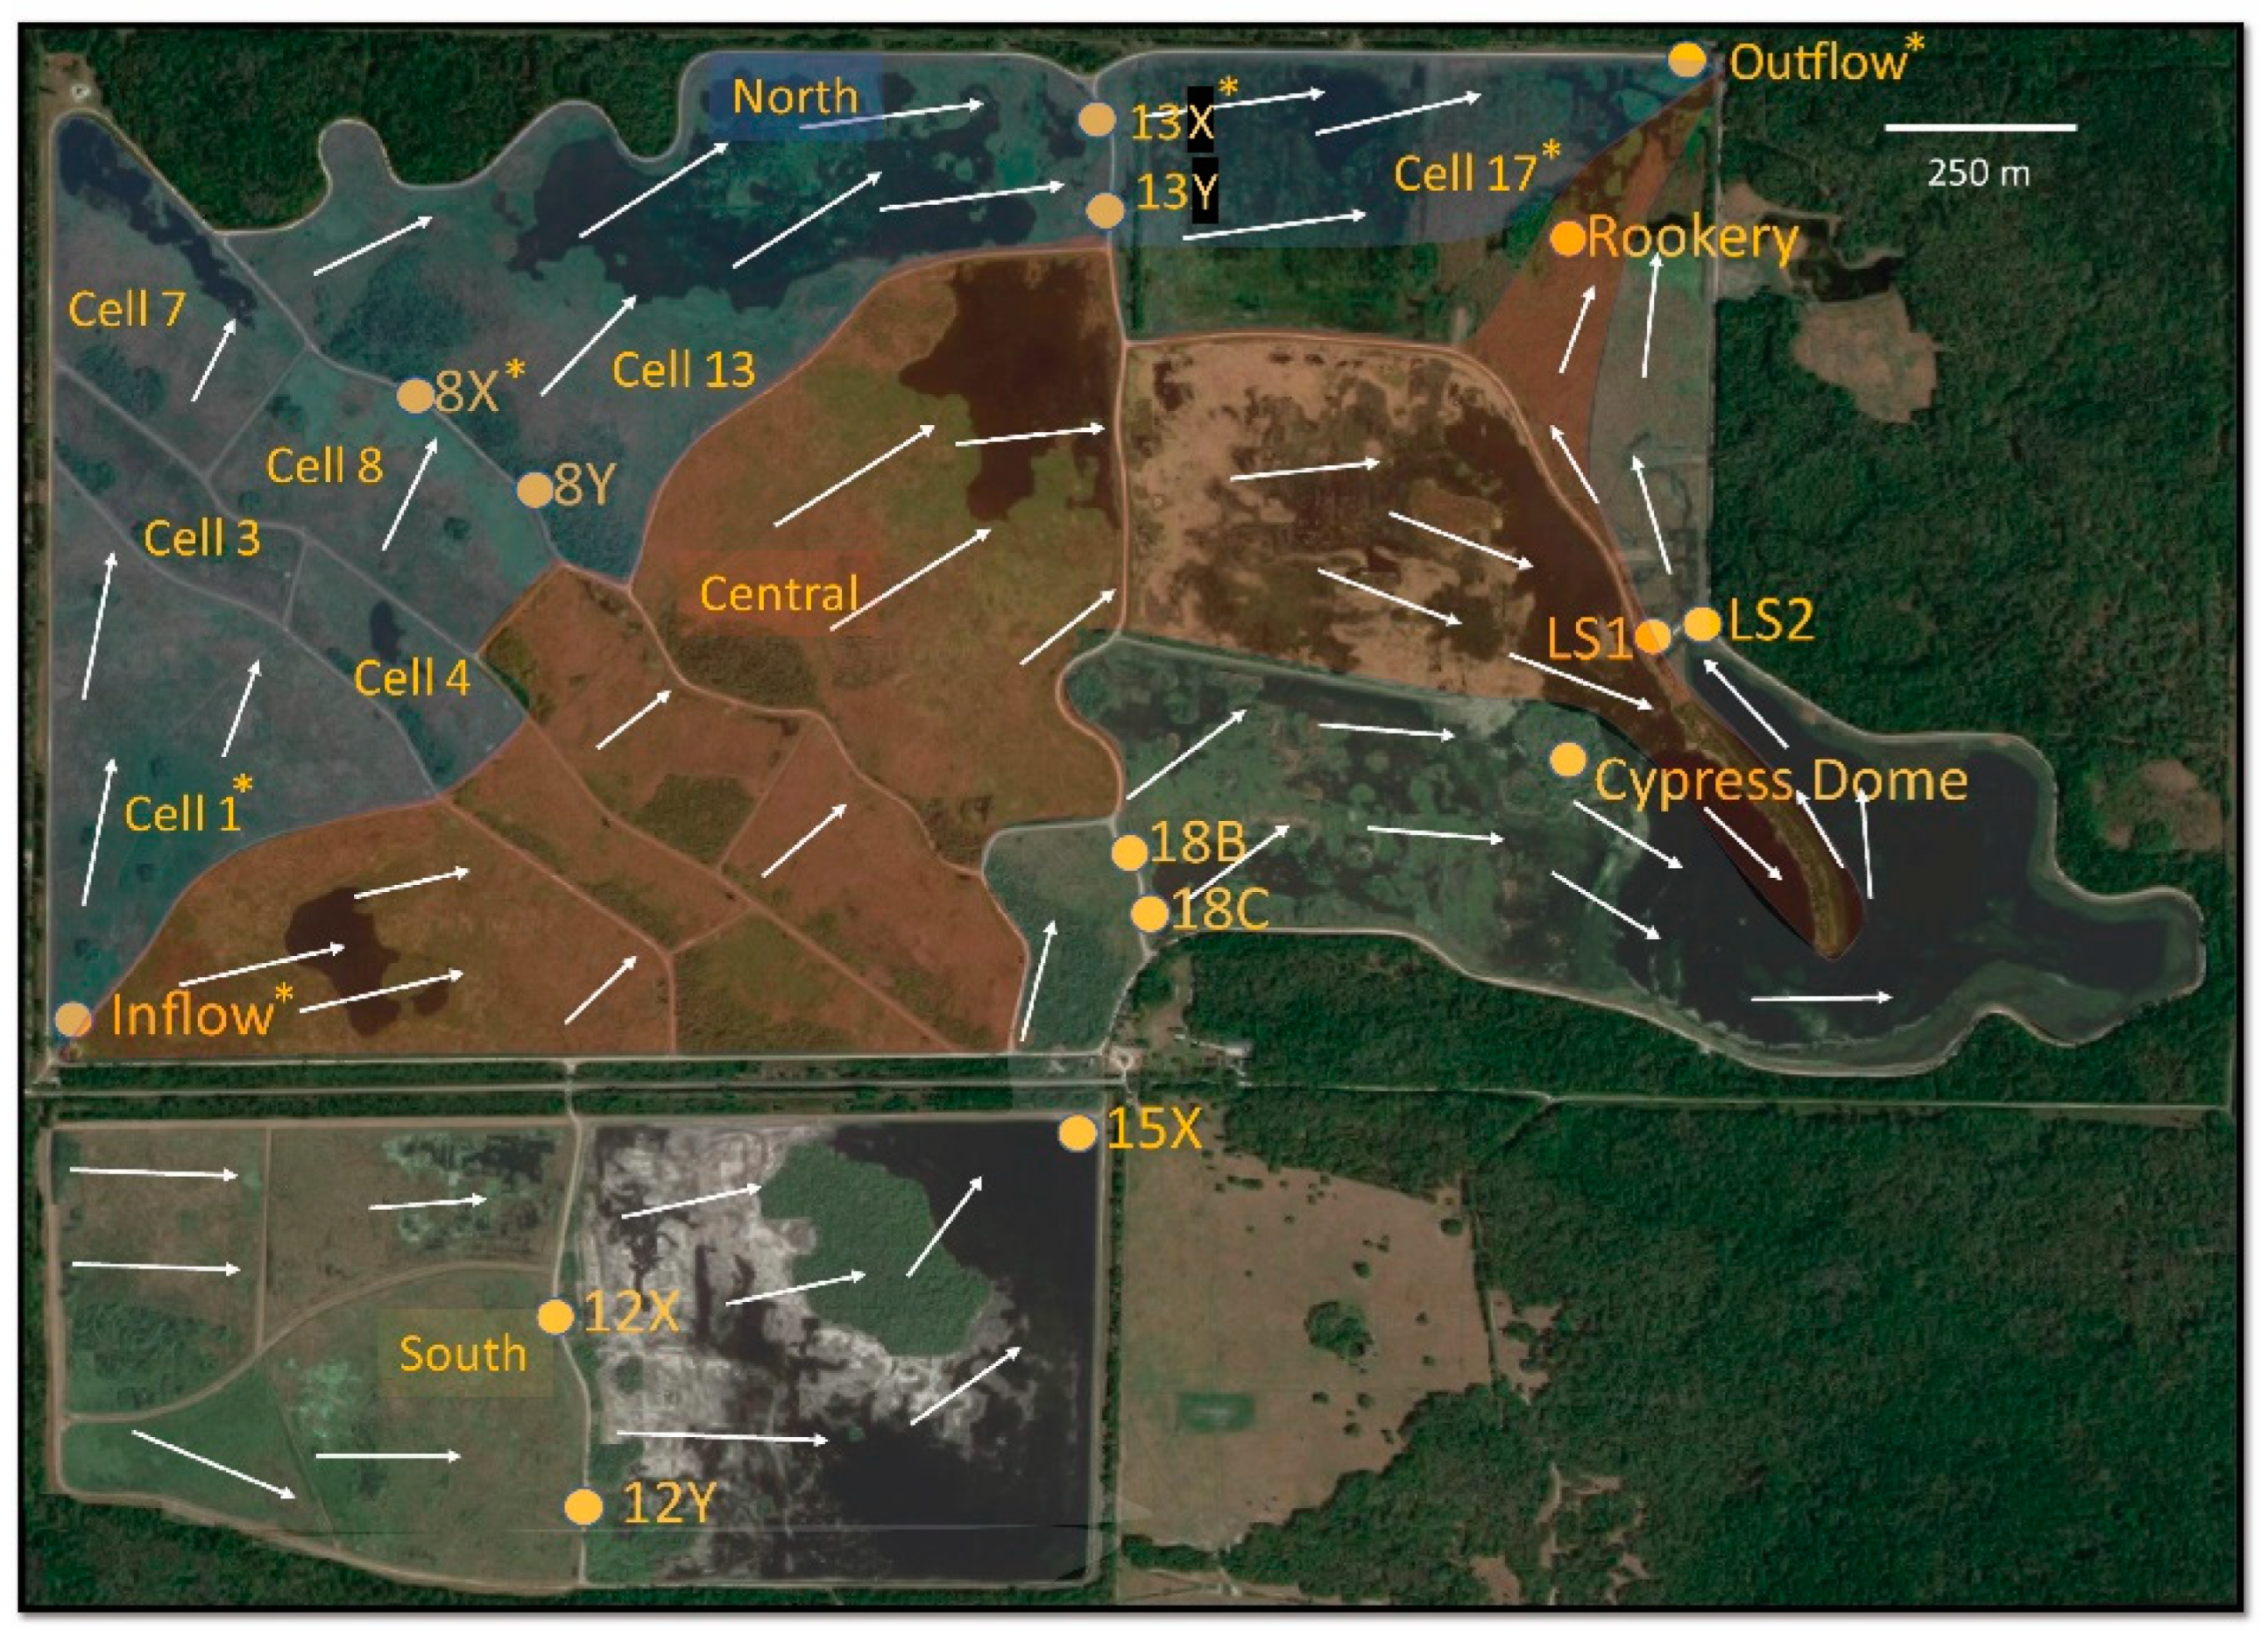
2.1. Site Description

The water at OEW gravity-flows through approximately 4.9 km2 area partitioned into eighteen cells with three main vegetative regions: a 1.6 km2 deep marsh (where most nutrient removal takes place), a 1.5 km2 mixed-marsh, and a 1.6 km2 hardwood swamp with a lake (created to further increase wildlife habitat), before flowing into the St. John’s River. Water entering the wetlands from the WWTP is divided into three main paths (referred to as North, Central, and South) from the influent control structure to flow across different areas of the wetlands. The water’s movement is restricted by berms and water control structures to maintain an approximately 30-day residence in the wetland (Figure 1), as determined by fluorescent tracing. Along with the inflow from Iron Bridge, the wetland receives an average of 16.75 MLD of rain. Much of the rain occurs in the wet season from June to September, which coincides with hurricane season in Florida. Rainfall data were collected by the wetland management and made available in an annual report, along with influent and outflow estimates.

2.2. Sample Collection

For this research, the North flow train was selected as the focus of the study for consistent analysis, although the other flow paths were occasionally sampled for comparison as well. Since the concentration of the nutrients nitrogen and phosphorus decrease from the influent to the outfall [33], a stratified heterogeneous sampling procedure was employed. For each collection date, 500 mL samples were collected at the inflow control structures, at a water control structure past the deep marsh, and 1.2 km from the influent (site 8X in Figure 1), in the mixed marsh (site 13X in Figure 1, 2.5 km from the influent) and in the outfall canal (3.4 km from the influent). The dates of collection were 9 October 2015, 17 September 2017, 1 December 2017, 1 March 2018, and 18 October 2018. Surface water samples were collected in triplicate on the October 9, 2015, sampling date. The September 2017 sampling date occurred 7 days following Hurricane Irma, which passed over central Florida as a Category 1 hurricane on 11 September 2017. Sediment cores were taken in duplicate at Cell 1 (28°34′12.5″ N 81°00′45.2″ W) near the influent, and Cell 17 (28°34′53.2″ N 80°59′24.1″ W) on 18 October 2018. These sites were selected as they were along the northern flow train and represented two different soil types (high and low organic content) from previously studied areas [41]. Although a thorough analysis of the entire site was beyond the scope of this work, on three collection dates, at least one sample was collected from both the Central and South flow train at the rookery and cypress dome.

2.3. Sediment Cores

Cores were collected by hand and processed as described previously [41]. Briefly, acid cleaned polypropylene core liners (7.5 cm dia.) were used to collect sediment samples. They were then stored on ice after collection for transport to the lab. Sediment core depths were in the range of 10 to 14 cm. The cores were extruded (on the day of collection) in 1 cm sections for the first 6 cm and in 2 cm increments after. Subsequently, the sections were centrifuged at 3270 rcf to collect the porewater for analysis. After centrifuging, each section was homogenized and approximately 1 g of the wet centrifuged sediment was suspended in 10 mL of water to obtain the water extractable fraction. The samples were agitated for 24 h and then centrifuged at 3270 rcf for 15 min and the supernatant removed for analysis. The remaining portion of sediment was resuspended in methanol and processed in the same manner 3 additional times to obtain the methanol extractable fraction. The extracted samples were evaporated to dryness in a vacuum oven (Across International, AccuTemp-09s) at −35 psi and 80 °C, then reconstituted in 0.25 mL of methanol with 0.1% formic acid and filtered through a 0.45 µm low volume syringe filter. A volume of 5 µL of these concentrates was injected into the LC-MS for analysis.

2.4. Solid Phase Extraction

The extraction procedure employed was developed by Loos et al., with some modifications described here [18]. Water samples were first vacuum filtered using Whatman grade 1 filter paper to remove macroscopic debris, then filtered again using a 0.22 μm filter to prevent blockage of the solid phase extraction (SPE) cartridges, which pre-concentrated the sucralose. Filtered water samples were extracted using the Oasis HLB SPE cartridges (Waters Corporation; Milford, MA, USA) columns (6 mL volume with 200 mg sorbent material). The SPE cartridges were conditioned with 5 mL of methanol (HPLC-grade), followed by 5 mL of water (Ultrapure, 18.2 MΩ, Thermo Fisher Scientific; Waltham, MA, USA). The flow rate for the conditioning and rinsing was 5 mL·min−1. The pre-concentration occurred when 500 mL sample volume was passed (under vacuum) through the SPE columns, rinsed with 5 mL of deionized water, and then eluted with 5 mL of methanol. The dark brown eluent was evaporated to dryness under nitrogen, the solid reconstituted in 1 mL of methanol, and filtered through a 0.22 μm syringe filter in preparation for analysis.

2.5. Sucralose Quantification

2.5.1. Water Column Samples

Sucralose concentrations in SPE extracted water samples were quantified using reversed-phase liquid chromatography with time-of-flight mass spectrometry (LC-MS TOF). An Agilent 1260 Infinity LC system was employed with quaternary pump, vacuum degasser, and autosampler connected to an Agilent G6230B TOF mass spectrometer (Agilent; Santa Clara, CA, USA). A volume of 5 μL sample was injected onto a Zorbax 15 cm reverse phase C-18 column with 3.5 μm particle size. A binary gradient of 1% formic acid in water (A) and 1% formic acid in acetonitrile (B) at 0.250 mL·min−1 was employed with a gradient elution program: 0–15 min 10–90% B, 15–20 min 90% B, 20–25 min 90–10% B, 25–30 min 10% B. The TOF utilized electrospray ionization (ESI) in negative mode with a capillary voltage −2900 V and 175 V scan fragment voltage. Due to the complex nature of the sample composition, blank samples were injected in between extracted samples to minimize cross-contamination. Sucralose was identified by its retention time (13.8 min) and its m/z peak (395 parent, 441 formate adduct). The limit of detection for extracted samples was 0.005 ppm, with calibration curve correlation coefficient R2 = 0.9978.

2.5.2. Sediment Core Samples

Sediment extracts were analyzed on an Agilent 1290 Infinity II LC system coupled to an Agilent 6545 Q-TOF with a Dual Agilent Jet Stream (AJS) ESI running in single MS mode. The instrument was run with a binary gradient of 1% formic acid in water (A) and 1% formic acid in acetonitrile (B) at 0.500 mL·min−1. The elution program consisted of 0–4 min 10–50% B, 4–6 min 50–10% B. The retention time of sucralose in this method was reduced to 3.6 min, while mass peaks remained consistent with the previous method.

2.5.3. Statistical Analysis

The limit of detection (LOD) for the sucralose calibration curve was determined using Equation (1)
LOD = 3 s y m
where (sy) is the error in y, and m is the slope of the calibration line, as determined by linear regression. Since the limit of detection arises from the statistical calculation, it was possible that samples could generate a chromatographic response, yet the concentration determined from the calibration curve fell below the limit of detection for the calibration method.
To determine the sampling error, surface water samples were collected in triplicate for all sites of the 9 October 2015 sampling date. The standard deviation between samples was found to 4.5 ppb; that is, less than the error in the calibration method (5 ppb). An F-test was performed to determine if the sampling error was distinct from the calibration error, where the F-ratio was determined to be 1.1; that is, less than the critical F-value of 6.6 (p = 0.05).
Hence, individual surface water samples were collected for subsequent sampling dates. Sediment core samples were collected in duplicate.

2.6. Total Organic Carbon Analysis

TOC analysis of solid samples was conducted using a Lotix Combustion TOC Analyzer with LSS Boat (Teledyne Tekmar; Mason, OH, USA), operating on Lotix revision 3.0.6333.26559. The samples were measured in triplicate using 2–50 mg dry sediment. The samples of sediment were homogenized with a mortar and pestle and acidified with phosphoric acid (22%). The processed samples were combusted at a furnace and catalyst temperature of 800 °C. Organic carbon standards (Ricca Chemical; Arlington, TX, USA) were prepared at concentrations ranging from 100 to 2500 μg organic carbon and additionally verified with a 1200 μg check standard.

3. Results

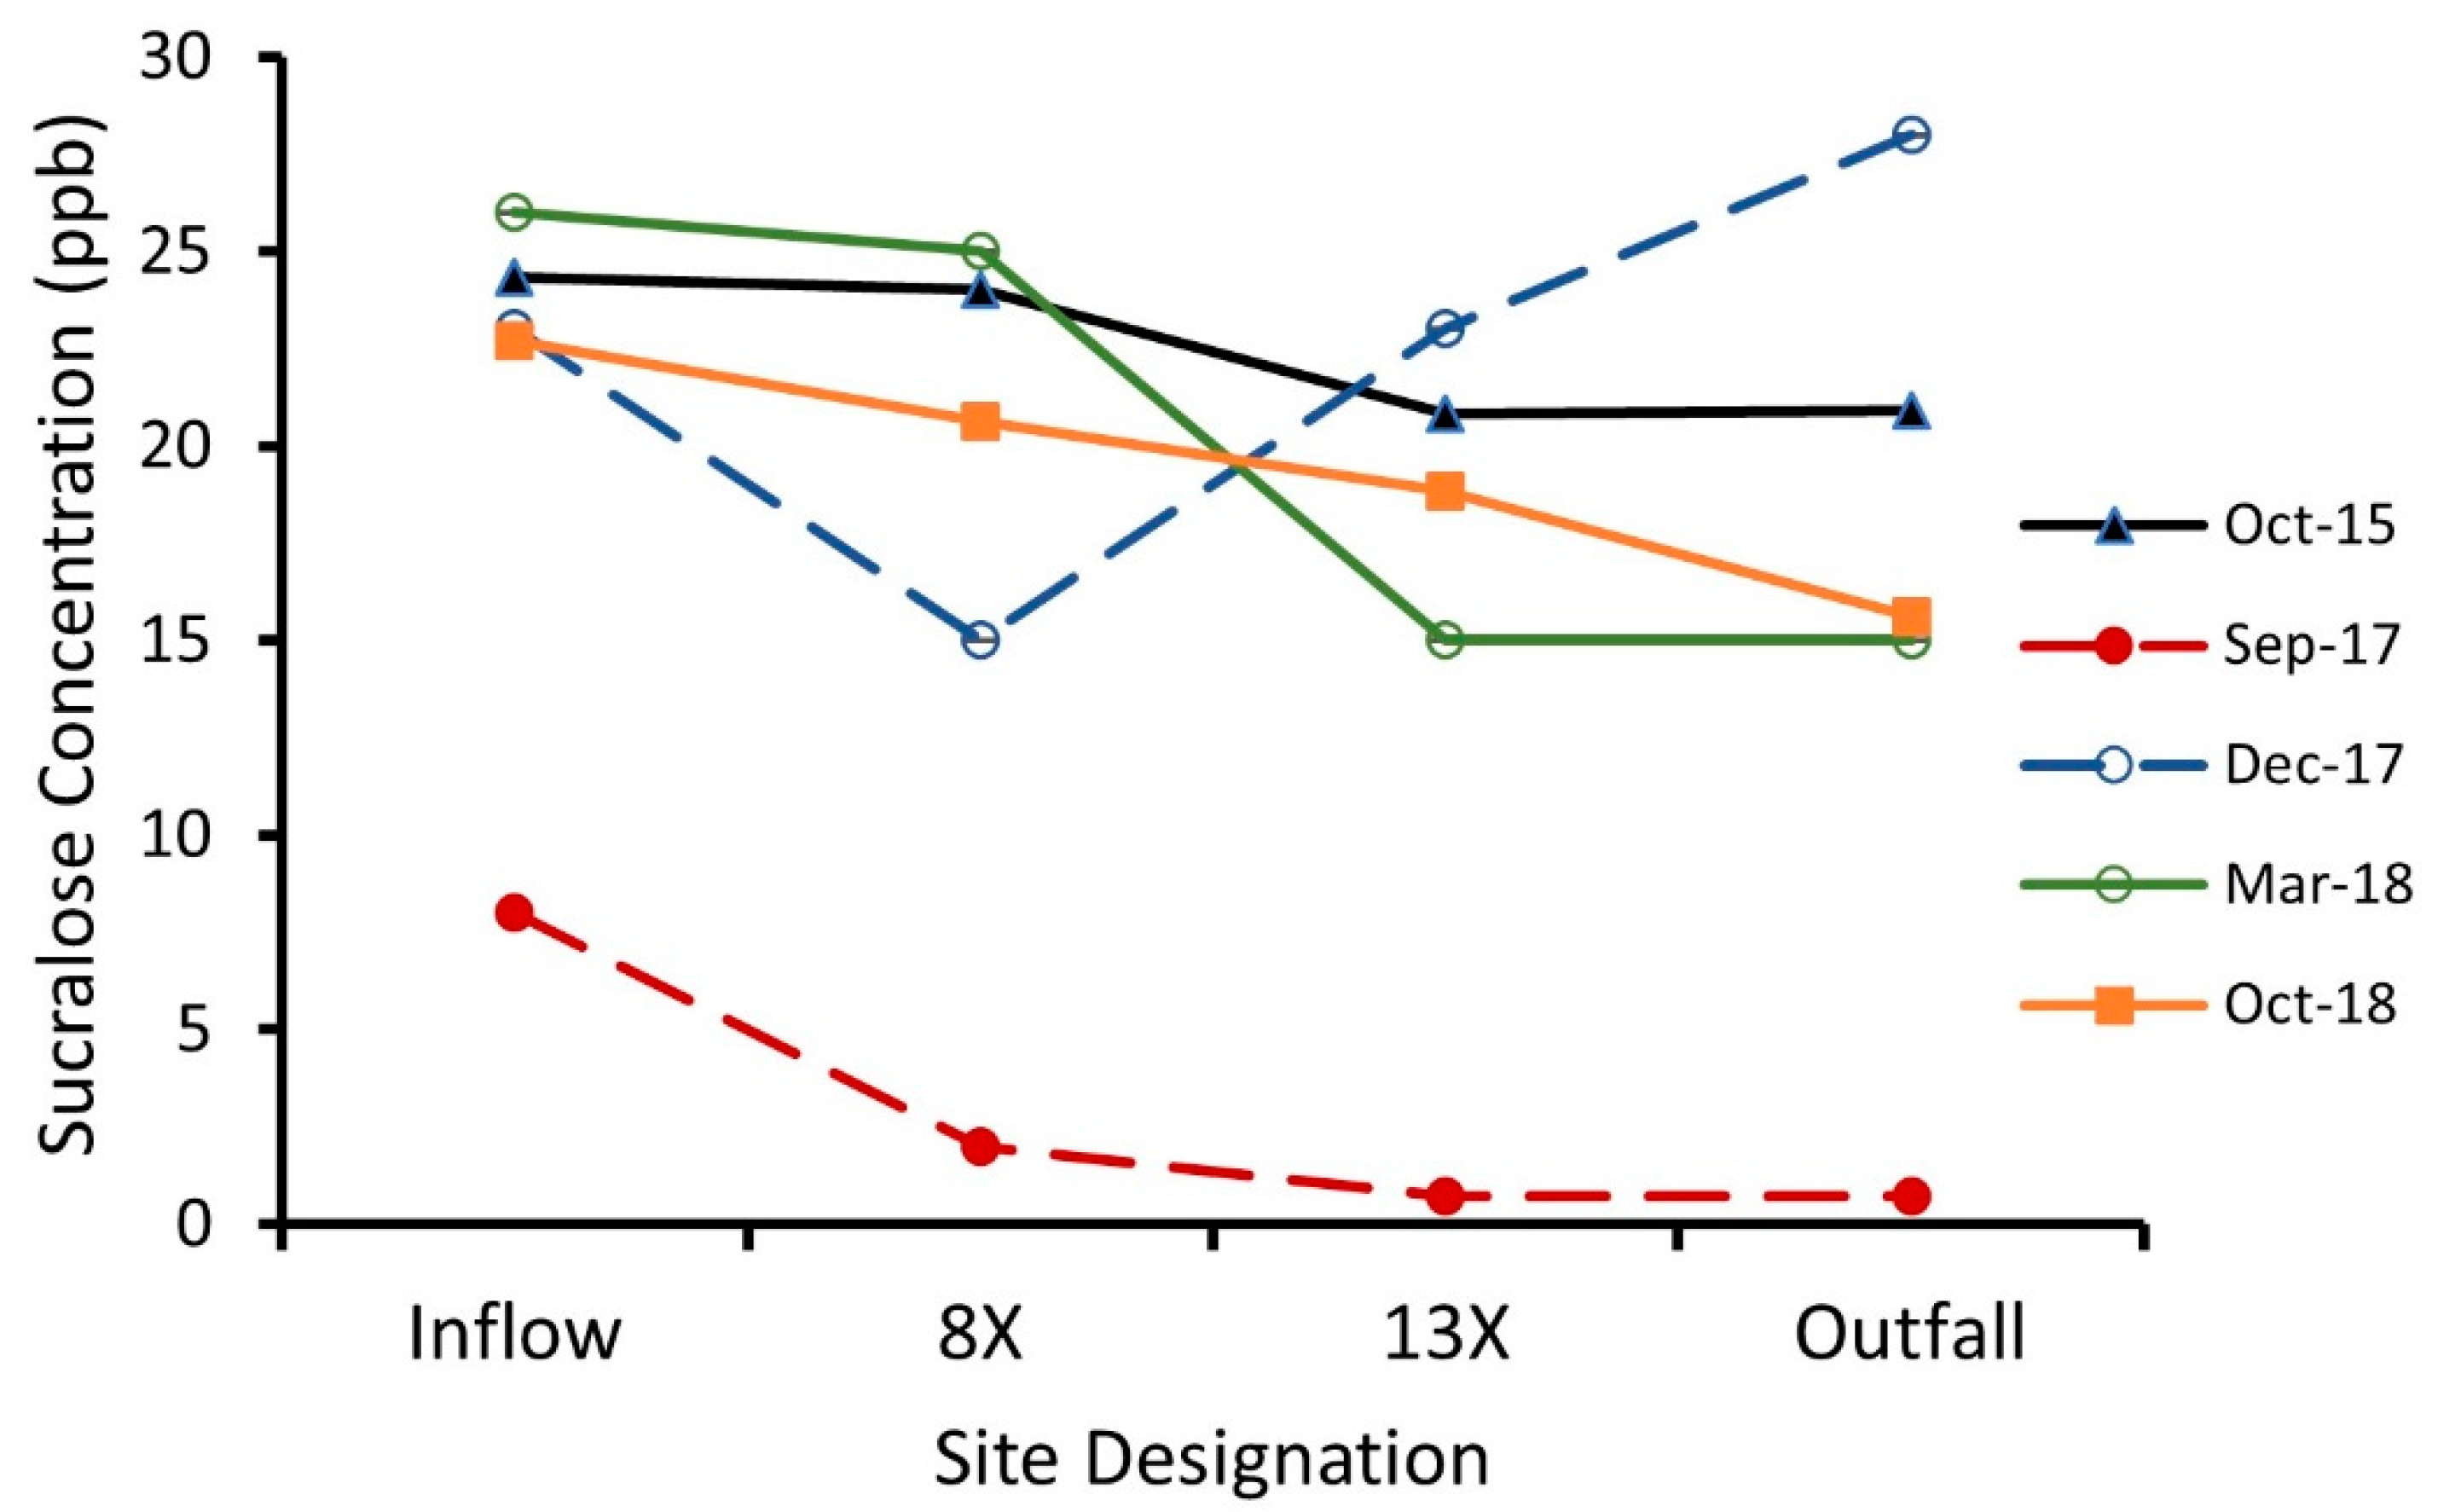
3.1. Sucralose Water Concentration

The concentrations of sucralose for the North flow train are shown in Figure 2. Concentrations were measured at the influent, deep marsh water control structure (labeled 8X in Figure 1, ~1.2 km from the influent), in the mixed marsh water control structure (site 13X in Figure 1, 2.5 km from the influent), and in the outfall canal (3.4 km from the influent). Under most conditions (excluding September 2017, discussed below) the concentration at each site (influent to effluent) and over the period 2015–2018, is constant within the error of the measurement.
For the three occasions when additional samples were collected from the Central and South flow paths, the sucralose concentrations were also measured and are shown in Table 1.
In addition to sucralose, other water quality parameters were measured, including pH and electrical conductivity. The pH measured at the time of water sampling varied throughout the wetland between 6.69 and 8.98 and the average pH was 7.4 ± 0.6. The electrical conductivity of the water that was measured at the time of sampling ranged from 414–536 µS/cm. Using the relationship between conductivity and ionic strength reported by Griffin and Jurinak [42], the ionic strength of the sampled water ranged from 0.06–0.08 M.

3.2. Mass Balance

The mass balance of sucralose through the wetland was estimated from the concentrations measured in the water column, the reported inflow/outflow data from the wetland’s annual report, and rainfall data from The National Weather Service deployed Next Generation Radar (NEXRAD). The mass balance data are shown in the Table 2. The comparison of means t-value was calculated to determine if any of the influent sucralose masses were different from the outfall masses. Using a critical t-value of 6.965 (p = 0.01), none of the influent masses were statistically different from the outfall masses.

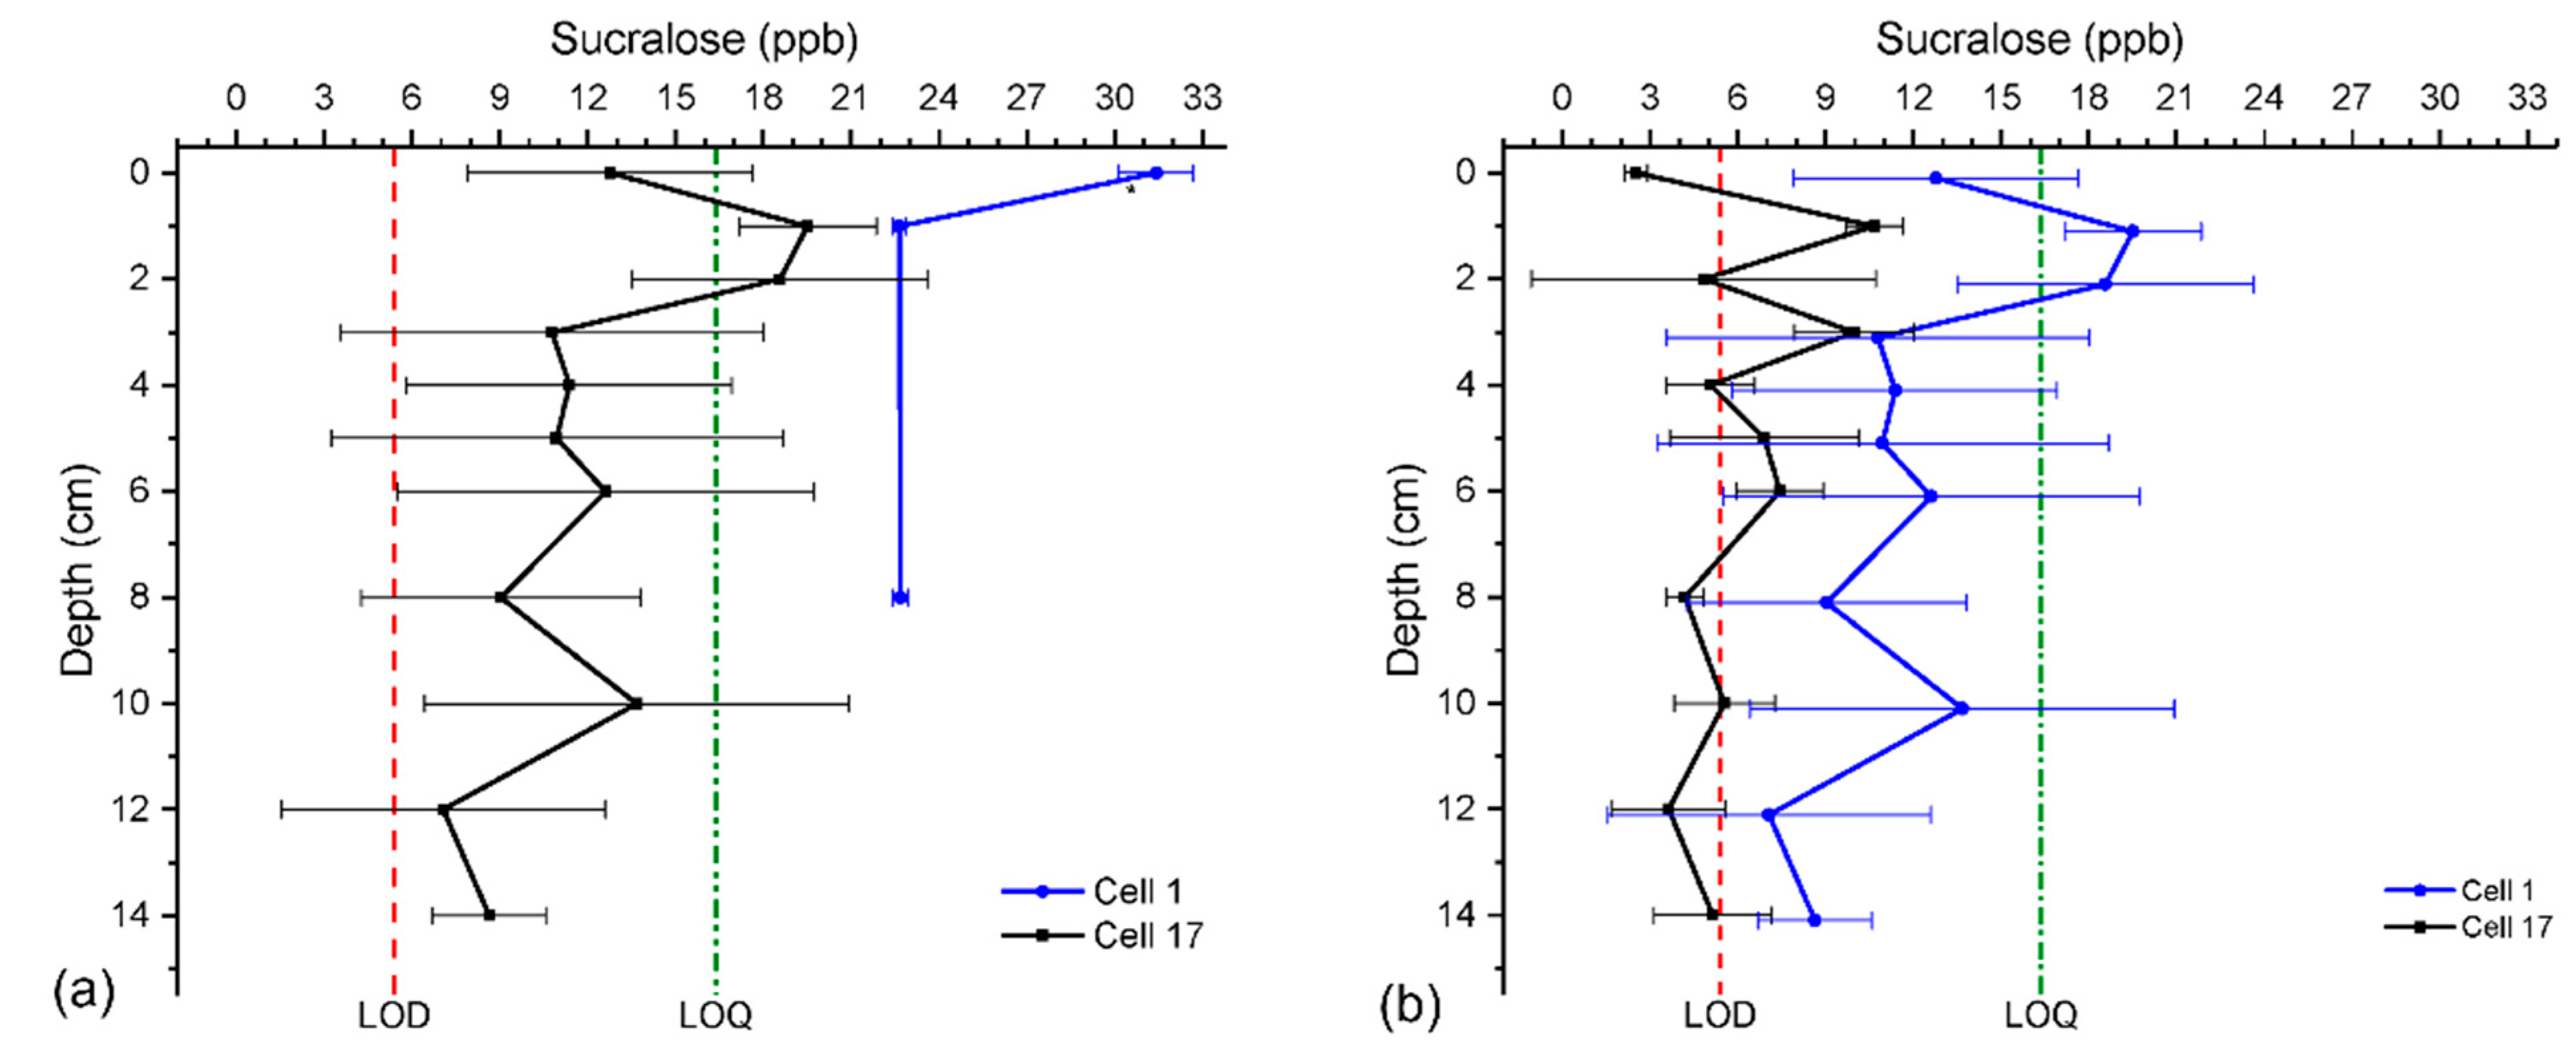
3.3. Sucralose Sediment Concentration

Sucralose was measured in the sediment and porewater of two sites in the North flow train. The results are shown in Figure 3a,b. The first site near the inflow had nominal organic matter or porewater. The site near the outflow was primarily organic matter and had a larger volume of porewater.

4. Discussion

An analysis of the sucralose surface water concentration (Figure 2) shows that average influent concentration (excluding the September 2017 data, discussed below) is 24 ± 2 ppb. This concentration is consistent with literature values of sucralose concentration in septic tanks [17] (0.012–0.069 ppm) and wastewater treatment plants (0.119 ppm) [43]. Curiously, the influent concentration does not show a significant increase over time. This is surprising due to the increased consumption of artificial sweeteners in the United States. Sylvetsky and Rother’s analysis of the National Health and Nutrition Examination Survey (NHANES) showed increases in adult consumption of low calorie sweeteners (LCS), from 8.7% of adults (1999–2000), to 21.1% (2003–2004) to 24.9% (2009–2010), [44] for which sucralose accounts for the majority of the market share in those years. Their prediction of 5.1% annual growth is not reflected in the influent concentration, but may not be detected within the error of the measurement. The concentration of sucralose was found to be invariant from inflow to outfall on the North flow train, within the error of the measurement. Due to limited resources, the Central and South flow paths were only modestly sampled, yet their sucralose concentrations are also consistent with those found throughout the North flow path (Table 1). The mass balance determination also shows that inflow sucralose masses were statistically indistinguishable (99% confidence interval) from outflow masses (Table 2).
In the case of the September 2017 measurements, which occurred within a week of Hurricane Irma, the concentrations are considerably suppressed. This is likely due to the large volume of rain that was flushed through the park as a result of the storm event, simultaneously diluting the amount present in the cells and increasing the rate of effluent discharge (typically 51 million liters per day are discharged, but the average for September 2017 was 76 million liters per day). This flush event temporarily decreased the concentration of sucralose, which was restored to its previously recorded (2015) concentration within three months.
Since the objective of this work was the characterization of the sucralose profile throughout the wetland, consideration of the solubility of sucralose in water and methanol (a solvent used to extract sucralose from sediment) is warranted. The research of Li and coworkers [45] reports the solubility of sucralose at a range of temperatures (10.0–35.0 °C) in water, methanol and isopropyl alcohol. Their results show increasing solubility as a function of temperature in all three solvents, with the solubility in methanol three times greater than the solubility in water. Their measured mole fraction solubility was modeled with an empirically derived, modified Apelblat equation:
x = A + B T + C l n T
where x is the mole fraction of sucralose, and A, B and C are empirically derived constants. In the case of water, A = −7.8705, B = 326.43, C = 1.1917. The coldest temperature measured in the OEW water was 12.0 °C (December 2017) and the warmest occurred in September 2017 at a temperature of 29.7 °C, both within the temperature range of that reported by Li et al. Based on their equation and reported parameters, the solubility of sucralose at coldest measured temperature (12.0 °C) would have a mole fraction of 0.0107, or 234 g sucralose per kilogram water. This solubility is well above that measured in the surface waters of the OEW, and it is therefore assumed that precipitation of sucralose can be excluded when considering the possible mechanisms whereby sucralose may by deposited within the wetland.
To determine if chemi- or physisorption of sucralose was occurring, sucralose was also quantified in sediment cores and porewater. Figure 3 shows the sucralose concentrations in the porewater near the inflow are close to the concentration measured in the water column. However, at the site close to the outflow the concentration is lower and decreases with depth. The sediment shows more consistent concentrations with both cores falling around the detection limit of the method. The water extractions from sediment had only two points that exceeded the limit of quantification for the method. This indicated that the sucralose present in the sample was primarily in the porewater and not adsorbed to the mineral or organic matter present. This was further examined by plotting the sucralose (mg·kg−1) against the TOC (mg·kg−1) from the sediment samples. The sucralose and TOC were uncorrelated with a Pearson’s correlation coefficient of 0.155, which is not statistically significant correlation (p = 0.36, 36 degrees of freedom). This result indicates that there is no observed association between sucralose and the organic fraction, which agrees with previously published studies [10,24,46] and suggests that any entrainment in the sediment would be a result of diffusion at the sediment water interface.

5. Conclusions

This research reports a longitudinal study of the concentration of sucralose in a tertiary water-treatment wetland, with the two-fold aim of determining if the entry of sucralose into the wastewater is varying over time due to changes in human consumption and second, if the concentration profile of sucralose within the wetlands flow train is changing over time. The novelty of this work is the finding that, within the years 2015–2018, the inflow sucralose did not increase, despite reported increases in consumption of the sweetener during that time period. Although aspartame remains the dominant non-nutritive sweetener, consumed by greater than 50% of U.S. households in 2018, purchases of products containing sucralose increased by more than 30% from 2010–2018 [2]. It is remarkable that influent sucralose concentrations from 2015–2018 did not mirror the reported increase in consumption, and warrants further study. Further, the influent and effluent concentrations were indistinguishable during the sample dates. Given the literature reports of low potential for sucralose bioaccumulation [25], yet the conflicting evidence of sucralose bioaccumulation in lettuce and leek crops [27], we believe the invariant sucralose concentration in the wetland ecosystem to be a relevant finding. Sediment and porewater analysis indicate that sucralose is not physically or chemically adsorbed and are consistent with mass balance data.

Author Contributions

Conceptualization, E.C.H. and M.B.; methodology, E.C.H. and N.Y.; validation, E.C.H. and N.Y.; formal analysis, E.C.H., J.W., T.H. and N.Y.; resources, M.S. and M.B.; writing—original draft preparation, E.C.H.; writing—review and editing, E.C.H., N.Y., M.S., M.B. and T.H.; visualization, M.S., E.C.H. and N.Y.; supervision, E.C.H. and M.B.; project administration, E.C.H.; funding acquisition, E.C.H. and M.B. All authors have read and agreed to the published version of the manuscript.

Funding

This research was partially funded by Beazley Startup Funds from the University of Central Florida and the Orange County Environmental Protection Division.

Data Availability Statement

Not applicable.

Conflicts of Interest

The authors declare no conflict of interest.

References

  1. Johnson, A. How Sweet It Isn’t. The Wall Street Journal. 6 April 2007. Available online: https://www.wsj.com/articles/SB117582405851161797 (accessed on 27 August 2022).
  2. Dunford, E.K.; Miles, D.R.; Ng, S.W.; Popkin, B. Types and Amounts of Nonnutritive Sweeteners Purchased by US Households: A Comparison of 2002 and 2018 Nielsen Homescan Purchases. J. Acad. Nutr. Diet. 2020, 120, 1662–1671. [Google Scholar] [CrossRef]
  3. Piernas, C.; Ng, S.W.; Popkin, B. Trends in purchases and intake of foods and beverages containing caloric and low-calorie sweeteners over the last decade in the United States. Pediatr. Obes. 2013, 8, 294–306. [Google Scholar] [CrossRef]
  4. Sylvetsky, A.C.; Welsh, J.A.; Brown, R.J. Low-calorie sweetener consumption is increasing in the United States. Am. J. Clin. Nutr. 2012, 96, 640–646. [Google Scholar] [CrossRef]
  5. Martyn, D.; Darch, M.; Roberts, A.; Lee, H.Y.; Tian, T.Y.; Kaburagi, N.; Belmar, P. Low-/No-Calorie Sweeteners: A Review of Global Intakes. Nutrients 2018, 10, 357. [Google Scholar] [CrossRef]
  6. Roberts, A.; Renwick, A.G.; Sims, J.; Snodin, D.J. Sucralose Metabolism and Pharmacokinetics in Man. Food Chem. Toxicol. 2000, 38, S31–S41. [Google Scholar] [CrossRef]
  7. Rother, K.I.; Sylvetsky, A.C.; Walter, P.J.; Garraffo, H.M.; Fields, D.A. Pharmacokinetics of Sucralose and Acesulfame-Potassium in Breast Milk Following Ingestion of Diet Soda. J. Pediatr. Gastroenterol. Nutr. 2018, 66, 466–470. [Google Scholar] [CrossRef]
  8. Van Stempvoort, D.R.; Brown, S.J.; Spoelstra, J.; Garda, D.; Robertson, W.D.; Smyth, S.A. Variable persistence of artificial sweeteners during wastewater treatment: Implications for future use as tracers. Water Res. 2020, 184, 116124. [Google Scholar] [CrossRef]
  9. Torres, C.I.; Ramakrishna, S.; Chiu, C.-A.; Nelson, K.G.; Westerhoff, P.; Krajmalnik-Brown, R. Fate of Sucralose During Wastewater Treatment. Environ. Eng. Sci. 2011, 28, 325–331. [Google Scholar] [CrossRef]
  10. Soh, L.; Connors, K.A.; Brooks, B.W.; Zimmerman, J. Fate of Sucralose through Environmental and Water Treatment Processes and Impact on Plant Indicator Species. Environ. Sci. Technol. 2011, 45, 1363–1369. [Google Scholar] [CrossRef]
  11. Li, S.; Geng, J.; Wu, G.; Gao, X.; Fu, Y.; Ren, H. Removal of artificial sweeteners and their effects on microbial communities in sequencing batch reactors. Sci. Rep. 2018, 8, 3399. [Google Scholar] [CrossRef] [Green Version]
  12. Li, S.; Ren, Y.; Fu, Y.; Gao, X.; Jiang, C.; Wu, G.; Ren, H.; Geng, J. Fate of artificial sweeteners through wastewater treatment plants and water treatment processes. PLoS ONE 2018, 13, e0189867. [Google Scholar] [CrossRef]
  13. Scheurer, M.; Storck, F.R.; Graf, C.; Brauch, H.-J.; Ruck, W.; Lev, O.; Lange, F.T. Correlation of six anthropogenic markers in wastewater, surface water, bank filtrate, and soil aquifer treatment. J. Environ. Monitor. 2011, 13, 966–973. [Google Scholar] [CrossRef]
  14. Subedi, B.; Kannan, K. Fate of Artificial Sweeteners in Wastewater Treatment Plants in New York State, U.S.A. Environ. Sci. Technol. 2014, 48, 13668–13674. [Google Scholar] [CrossRef]
  15. Tran, N.H.; Gan, J.; Nguyen, V.T.; Chen, H.; You, L.; Duarah, A.; Zhang, L.; Gin, K.Y.-H. Sorption and biodegradation of artificial sweeteners in activated sludge processes. Bioresour. Technol. 2015, 197, 329–338. [Google Scholar] [CrossRef]
  16. Di Marcantonio, C.; Chiavola, A.; Bains, A.; Singhal, N. Effect of oxic/anoxic conditions on the removal of organic micropollutants in the activated sludge process. Environ. Technol. Innov. 2020, 20, 101161. [Google Scholar] [CrossRef]
  17. Oppenheimer, J.; Eaton, A.; Badruzzaman, M.; Haghani, A.W.; Jacangelo, J.G. Occurrence and Suitability of Sucralose as an Indicator Compound of Wastewater Loading to Surface Waters in Urbanized Regions. Water Res. 2011, 45, 4019–4027. [Google Scholar] [CrossRef]
  18. Loos, R.; Gawlik, B.M.; Boettcher, K.; Locoro, G.; Contini, S.; Bidoglio, G. Sucralose Screening in European Surface Waters Using a Solid-Phase Extraction-Liquid Chromatography Quadrupole Mass Spectrometry Method. J. Chromatogr. A 2009, 1216, 1126–1131. [Google Scholar] [CrossRef]
  19. Mawhinney, D.B.; Young, R.B.; Vanderford, B.J.; Borch, T.; Snyder, S.A. Artificial Sweetener Sucralose in U.S. Drinking Water Systems. Environ. Sci. Technol. 2011, 45, 8716–8722. [Google Scholar] [CrossRef]
  20. Lang, F.T.; Scheurer, M.; Brauch, H.-J. Artificial sweeteners—A recently recognized class of emerging environmental contaminants: A review. Anal. Bioanal. Chem. 2012, 403, 2503–2518. [Google Scholar] [CrossRef]
  21. Robertson, W.D.; Van Stempvoort, D.R.; Spoelstra, J.; Brown, S.J.; Schiff, S.L. Degradation of sucralose in groundwater and implications for age dating contaminated groundwater. Water Res. 2016, 88, 653–660. [Google Scholar] [CrossRef]
  22. Labare, M.P.; Alexander, M. Biodegradation of Sucralose, a Chlorinated Carbohydrate, in Samples of Natural Environments. Environ. Toxicol. Chem. 1993, 12, 797–804. [Google Scholar] [CrossRef]
  23. Amy-Sagers, C.; Reinhardt, K.; Larson, D.M. Ecotoxicological assessments show sucralose and fluoxetine affect the aquatic plant, Lemna minor. Aquat. Toxicol. 2017, 185, 76–85. [Google Scholar] [CrossRef]
  24. Tollefsen, K.E.; Nizzetto, L.; Huggett, D.B. Presence, fate and effects of the intense sweetener sucralose in the aquatic environment. Sci. Total Environ. 2012, 438, 510–516. [Google Scholar] [CrossRef]
  25. Saucedo-Vence, K.; Elizalde-Velázquez, A.; Dublán-García, O.; Galar-Martínez, M.; Islas-Flores, H.; SanJuan-Reyes, N.; García-Medina, S.; Hernandez-Navarro, M.; Gómez-Olivan, L.M. Toxicological hazard induced by sucralose to environmentally relevant concentrations in common carp (Cyprinus carpio). Sci. Total Environ. 2017, 575, 347–357. [Google Scholar] [CrossRef]
  26. Lillicrap, A.; Langford, K.; Tollefsen, K.E. Bioconcentration of the intense sweetener sucralose in a multitrophic battery of aquatic organisms. Environ. Toxicol. Chem. 2011, 30, 673–681. [Google Scholar] [CrossRef]
  27. Manasfi, R.; Brienza, M.; Ait-Mouheb, N.; Montemurro, N.; Perez, S.; Chiron, S. Impact of long-term irrigation with municipal reclaimed wastewater on the uptake and degradation of organic contaminants in lettuce and leek. Sci. Total Environ. 2021, 765, 142742. [Google Scholar] [CrossRef]
  28. Maluly, H.D.B.; Johnston, C.; Giglio, N.D.; Schreiner, L.L.; Robert, A.; Abegaz, E.G. Low-and No-Calorie Sweeteners (LNCS): Critical evaluation of their safety and health risks. Food Sci. Technol. 2021, 40, 1–10. [Google Scholar] [CrossRef]
  29. Suez, J.; Korem, T.; Zeevi, D.; Zilberman-Schapira, G.; Thaiss, C.A.; Maza, O.; Israeli, D.; Zmora, N.; Gilad, S.; Weinberger, A.; et al. Artificial Sweeteners Induce Glucose Intolerance by Altering the Gut Microbiota. Nature 2014, 514, 181–186. [Google Scholar] [CrossRef]
  30. Wiklund, A.-K.E.; Breitholtz, M.; Bengtsson, B.-E.; Adolsson-Erici, M. Sucralose—An ecotoxicological challenger. Chemosphere 2012, 86, 50–55. [Google Scholar] [CrossRef]
  31. Kadlec, R.H.; Wallace, S. Treatment Wetlands, 2nd ed.; CRC Press: Boca Raton, FL, USA, 2009. [Google Scholar]
  32. D’Angelo, E.M.; Reddy, K.R. Regulators of heterotrophic microbial potentials in wetland soils. Soil Biol. Biochem. 1999, 31, 815–830. [Google Scholar] [CrossRef]
  33. Wang, H.; Jawitz, J.W.; White, J.R. Rejuvenating the largest municipal treatment wetland in Florida. Ecol. Eng. 2006, 26, 132–146. [Google Scholar] [CrossRef]
  34. Delaune, R.D.; Pezeshki, S.R. The Role of Soil Organic Carbon in Maintaining Surface Elevation in Rapidly Subsiding U.S. Gulf of Mexico Coastal Marshes. Water Air Soil Pollut. 2003, 3, 167–179. [Google Scholar] [CrossRef]
  35. White, J.R.; Gardner, L.M.; Sees, M.; Corstange, R. The Short-Term Effects of Prescribed Burning on Biomass Removal and the Release of Nitrogen and Phosphorus in a Treatment Wetland. J. Environ. Qual. 2008, 37, 2386–2391. [Google Scholar] [CrossRef]
  36. Kerr, J.G.; Burford, M.; Olley, J.; Udy, J. Phosphorus Sorption in Soils and Sediments: Implications for Phosphate Supply to a Subtropical River in Southeast Queensland, Autralia. Biogeochemistry 2011, 102, 73–85. [Google Scholar] [CrossRef]
  37. Bastian, R.K.; Frederick, B.; Haven, R.C.; Lothrop, T.L.; Skene, E.; Oyler, A.R.; Allman, W.; Alexander, A.; deAguilar, C.R.; Ferraro, C.; et al. Wetland Treatment Systems: A Case History; EPA832-R-93_005; United States Environmental Protection Agency: Winter Park, FL, USA, 1993.
  38. Wang, H.; Jawitz, J.W. Hydralic Analysis of Cell-Network Treatment Wetlands. J. Hydrol. 2006, 330, 721–734. [Google Scholar] [CrossRef]
  39. Welch, J.; Simmons, V.; Meléndez, E.; Sees, M.; Gold, Y.; Heider, E.C. Assessment of Non-Anthropogenic Addition of Uric Acid to a Water Treatment Wetlands. Environments 2020, 7, 60. [Google Scholar] [CrossRef]
  40. Heider, E.C.; Valenti, D.; Long, R.L.; Garbou, A.; Rex, M.; Harper, J.K. Quantifying Sucralose in a Water-Treatment Wetlands: Service-Learning in the Analytical Chemistry Laboratory. J. Chem. Educ. 2018, 95, 535–542. [Google Scholar] [CrossRef]
  41. Altomare, A.J.; Young, N.A.; Beazley, M.J. A preliminary survey of anthropogenic gadolinium in water and sediment of a constructed wetland. J. Environ. Manag. 2020, 255, 109897. [Google Scholar] [CrossRef]
  42. Griffin, B.A.; Jurinak, J.J. Estimation of Acitivity Coefficients from the Electrical Conductivity of Natural Aquatic Systems and Soil Extracts. Soil Sci. 1973, 116, 26–30. [Google Scholar] [CrossRef]
  43. Mead, R.N.; Morgan, J.B.; Avery, G.B., Jr.; Kieber, R.J.; Kirk, A.M.; Skrabal, S.A.; Willey, J.D. Occurrence of the Artificial Sweetener Sucralose in Coastal and Marine Waters of the United States. Mar. Chem. 2009, 116, 13–17. [Google Scholar] [CrossRef]
  44. Sylvetsky, A.C.; Rother, K.I. Trends in the Consuption of Low-Calorie Sweeteners. Physiol. Behav. 2016, 164, 446–450. [Google Scholar] [CrossRef] [PubMed]
  45. Li, X.; Du, Z.; Huang, X.; Yuan, W.; Ying, H. Solubility of Sucralose in Different Solvents from (283.15 to 333.15) K. J. Chem. Eng. Data 2010, 55, 2600–2602. [Google Scholar] [CrossRef]
  46. Ávila, C.; Pelissari, C.; Sezerino, P.H.; Sgroi, M.; Roccaro, P.; García, J. Enhancement of total nitrogen removal through effluent recirculation and fate of PPCPs in a hybrid constructed wetland system treating urban wastewater. Sci. Total Environ. 2017, 584–585, 414–425. [Google Scholar] [CrossRef] [PubMed] [Green Version]
Figure 1. Water at the Orlando Easterly Wetlands (OEW) flows through three paths: the North flow path (shaded light blue), Central flow path (shaded red), and the South flow path (shaded yellow). Arrows indicate the direction of the flow of water. The north flow train is labeled with cell numbers. Asterisks indicate sampling sites.
Environments 09 00111 g001aEnvironments 09 00111 g001b
Figure 2. Concentration of sucralose measured at four sites over three years. The error for each point is 5 ppb, when rounded to one significant digit, and is determined by propagating the standard deviation from a linear least-squares best fit of the calibration curve. Site designations can be found on the map in Figure 1.
Environments 09 00111 g002
Figure 3. (a) Sucralose concentration in the porewater and (b) concentration of extracted sucralose in the sediment. Error bars represent the standard deviation of replicate cores. Limit of detection (LOD) and limit of quantification (LOQ) were calculated from the linear regression of the calibration curve.
Environments 09 00111 g003
Table 1. Sucralose concentrations at sites collected in the Central and South flow train.
Sampling YearCypress Dome (ppb)Rookery (ppb)
September 2017<5<5
December 201724 ± 526 ± 5
March 201827 ± 531 ± 5
Table 2. Mass balance of sucralose (mg·day−1) calculated from the influent and outfall sucralose concentrations and estimating the volume including rainfall data.
Sampling YearInfluent *
mg·day−1
Outfall
mg·day−1
Comparison of Means t *
October 201534 ± 941 ± 120.98
September 201714 ± 92 ± 14 1.52
December 201741 ± 1479 ± 222.93
March 201848 ± 1346 ± 170.23
October 201842 ± 948 ± 150.64
* Critical t-value is 6.965 (p = 0.01).
Publisher’s Note: MDPI stays neutral with regard to jurisdictional claims in published maps and institutional affiliations.

