Abstract
Although the association between air pollution and mortality is well established, less is known about the effects in different age groups. This study analyzes the short-term associations between mortality in different age groups (0–14 years of age, 15–64 years of age, and 65+ years of age) and a number of air pollutants in two relatively clean northern European capitals: Stockholm and Tallinn. The concentrations in PM10 (particles with an aerodynamic diameter smaller than or equal to 10 µm), PM2.5–10 (coarse particles), PM2.5 (particles with an aerodynamic diameter smaller than or equal to 2.5 µm), BC (black carbon), PNC4 (particle number count of particles larger than or equal to 4 nm), NO2 (nitrogen dioxide), and O3 (ozone) were measured during the period of 2000–2016 in Stockholm and 2001–2018 in Tallinn (except for BC and PNC4 which were only measured in Stockholm). The excess risks in daily mortality associated with an interquartile range (IQR) increase in the measured air pollutants were calculated in both single- and multi-pollutant models for lag01 and lag02 (average concentration during the same and the previous day, and the same and the previous two days, respectively) using a quasi-Poisson regression model with a logistic link function. In general, the calculated excess risks per IQR increase were highest in the age group 0–14 years of age in both Stockholm and Tallinn. However, in Stockholm, a statistically significant effect was shown for PM2.5–10, and in Tallinn for O3. In the oldest age group (65+), statistically significant effects were shown for both PM2.5–10, PM10, and O3 in Stockholm, and for O3 in Tallinn.
1. Introduction
Even though air pollution is something that everyone is more or less exposed to, different groups are affected differently depending on individual physiological sensitivities, as well as on the degree of exposure, that depends on a number of behavioral factors [1]. It has been shown that health effects related to exposure to air pollution constitute different degrees of severity depending on life stage (children and older adults are, in general, more sensitive), preexisting cardiovascular or respiratory diseases, genetic polymorphisms, and low socioeconomic status [2,3]. Persons in the age group 65+ years of age are assumed to be more susceptible to air pollution-induced health effects, due to decreased physiological, metabolic, and compensatory processes, and due to a greater incidence of cardiovascular and respiratory diseases [4,5]. Children are assumed to be more vulnerable to air quality, due to their higher breath rate, immature immune system, higher physical activity, spending longer time outdoors, and their continuing lung development during the early post-neonatal period [6]. The purpose of this study was to analyze the mortality effects in different age groups associated with short-term exposure to a number of air pollutants in Stockholm and Tallinn.
The health effects associated with short-term fluctuations in air pollution exposure [7], divided into different age groups, have been analyzed in a number of studies. In the APHEA2 project, conducted in 28 cities across Europe, the excess daily mortality risks due to black smoke (BS) and particulate matter (PM10) were 10–20% larger in the age group 65+ years of age, in comparison with the corresponding excess risks for mortality in all ages [8]. In a number of highly polluted urban centers in Chile, the excess mortality risk for PM10 was up to three times larger in the age group >85 years of age in comparison with the age group <65 years of age, and correspondingly around twice as large for SO2, CO, and O3 [9]. Similarly, the increase in total mortality associated with PM10 was just over three times larger in the age group 65+ years of age, in comparison with the age group 5–64 years of age, based on results from 16 cities in China [10,11]. In a study from Temuco, Chile, which constitutes a highly wood-smoke-polluted urban area, and in Singapore, as well as in China, the relative risks for mortality associated with an increase in PM10 were significantly increased for the age group >65 years of age (China 60+), but not among younger ages [11,12,13]. In the Netherlands, statistically significant relative risks of mortality, associated with short-term exposure to a number of air pollutants, were mostly found among the elderly (age groups 65–74 and ≥75 years of age), while the relative risks in the age group 45–64 years of age tended to be smaller [14].
The associations between mortality and air pollution exposure in different age groups have been analyzed in a number of studies focusing on pooled estimates from several urban areas based on one air pollutant. In a meta-analysis, based on all-cause and specific-cause mortality associated with PM2.5 in 27 U.S. communities between 1997 and 2002, greater effects in the age group ≥75 years of age were shown for both all-cause and specific-cause mortality [15]. In a study conducted in 48 cities in U.S., people aged 65+ years of age had an additional increase in mortality associated with O3 in comparison with younger ages [16].
There are also several studies performed in one city where the associations between mortality and air pollution exposure in different age groups have been analyzed. During an air pollution episode in London in December 1991, the concentrations in NO2 increased to record levels. All-cause mortality was statistically significantly increased in all ages, and cardiovascular mortality was especially pronounced in the age group 65+ years of age. Additionally, the number of hospital admissions for asthma increased during the corresponding period, with increases also in the age group of 0–14 years of age [17]. In studies performed in Bordeaux and Edinburgh, the associations between daily mortality and black smoke were greater in the age group 65+ years of age, while no statistically significant associations were found in the age group <65 years of age [18,19]. In São Paulo, Brazil, statistically significant relative risks in time-series analyses were found for PM10, SO2, and O3 in the age group >65 years of age, while no statistically significant relative risks were found when all ages were considered [20]. In a study from Seoul, South Korea, the short-term relative risk in total mortality associated with PM10 was greatest among post neonates <2 years of age, whereas the second greatest relative risk in total mortality was found for the age group >65 years of age [21].
Most of the studies referenced above show greater mortality effects among the older age groups in comparison with the middle-aged. In contrast, a study performed in Delhi, India, during the period of 1991–1994, where the associations between increases in total suspended particles and daily mortality were analyzed, the greatest impact occurred in the age group of 15–44 years of age [22]. However, in another recent study from Delhi, using data from 2010 to 2016, the increase in mortality due to PM2.5 was greatest among those older than 60 years of age [23]. In a study conducted in Lishui district, China, short-term mortality associated with O3 and PM2.5 was increased among both middle-aged and elderly [24].
A majority of the studies referred to above and meta-analyses [25] indicate that the health risks associated with exposure to air pollutants are greatest among elderly and/or children, However, the majority of the studies have been focusing on relatively highly polluted areas, and there is much less evidence on areas with relatively good air quality [26]. The current study focuses on two northern European capitals, searching for associations between PM10, PM2.5–10, PM2.5, BC, PNC4, NO2, O3 and daily mortality in different age groups. By dividing the daily mortality associated with exposure to air pollution into different age groups, it was possible to get clarity on how the exposure affects health depending on age. The current analysis is a continuation of a previous published study [27], where daily mortality associated with exposure to air pollution was analyzed in Stockholm from 2000 to 2016, but where the effects in different age groups were not taken into account. Tallinn is also included with corresponding analyses during the period from 2001 to 2018. However, data regarding BC and PNC4 are only available in Stockholm.
2. Materials and Methods
2.1. Data Collection
This is a retrospective study including residents of Stockholm, Sweden and Tallinn, Estonia. Both are capital cities located in northern Europe. Stockholm had a population that increased from 0.75 million in 2000 to 0.93 million in 2016, and in Tallinn the population increased from 0.40 million in 2001 to 0.45 million in 2018. Cause of mortality data were, in both cases, obtained from the National Cause of Death Register. Natural cause of mortality is defined on the basis of the underlying cause of death, and these data include the daily number of deaths from non-external causes (ICD−10: A00–R99) occurring among the registered population.
Air pollution exposure was estimated from a central measuring station on the roof-top of a 20 m high building in the central part of Stockholm in 2000–2016, and in a residential area of Tallinn in an air quality monitoring station at a height of 4 m in 2001–2018. The monitoring stations were, in both cases, part of the city’s regulatory air pollution control network, and equipped with reference (or equivalent) instruments for regulated pollutants, according to the EU air quality directive. These air pollutants included PM10 (particles with an aerodynamic diameter smaller than or equal to 10 µm), PM2.5 (particles with an aerodynamic diameter smaller than or equal to 2.5 µm), NO2 (nitrogen dioxide), and O3 (ozone) (Table 1). The O3 measurements were based on daily maximum 8-h mean values, and particles in the coarse fraction (PM2.5–10) were estimated by subtracting PM2.5 from PM10. In Stockholm, BC (black carbon) and PNC4 (particle number count of particles larger than or equal to 4 nm) were also included.

Table 1.
Description of the measurement methods and the instruments that were used to measure the pollutants in Stockholm and Tallinn (NA = not available).
Temperature data were collected from the urban meteorological station Observatorielunden in Stockholm and the urban-background meteorological station Tallinn-Harku in Tallinn. In this study, daily maximum temperature was used as the exposure variable.
2.2. Statistical Analysis
The associations between different air pollutants and daily mortality were modeled using a quasi-Poisson regression model with a logistic link function. The concept “quasi-Poisson” refers to a model that adjusts for over-dispersed data, and a logistic link function defines the relationship of the dependent variables to the mean of the Poisson distributed independent variables. The modeling procedure was replicated from a previous study [27] in order to ensure comparability of the results. The model estimated the effect of an interquartile range (IQR) increase in air pollutants on daily mortality for lag01 and lag02 (average concentration during the same and the previous day, and the same and the previous two days, respectively). Adjustments for other time-varying factors were made by assuming a linear additive effect on a logarithmic scale:
where Yi represents the daily number of deaths from non-external causes, APi represents the concentration of a specific or a combination of air pollutants and lag structures on day i, Wi represents variables controlling for the weather on day i using smooth spline functions for the maximum temperature and snowfall, DOWi represents the day of the week, and the long-time trend is a smooth function varying over time to capture any long-term and seasonal patterns in mortality. Snowfall was included since it is a risk factor for daily mortality, as described in Auger et al. [28]. The smooth function describing the long-term time trend was a penalized regression spline restricted to 5 d.f. (degrees of freedom) per year. All pollutants were modeled by assuming a linear relationship with daily mortality. Air pollutants were modeled in both single- and multi-pollutant models. Temperature effects were adjusted using two different smooth functions corresponding to the different lag-windows of 0–2 and 3–10. The model allowed for the use of 4 d.f. for each function. All analyses were conducted using R statistical software version 3.6.0 (R Foundation for Statistical Computing, Vienna, Austria).
Log(Yi) = Intercept + APi + Wi + DOWi + long-term trend
3. Results
3.1. Descriptive Data
Table 2 presents summary statistics regarding mortality in different age groups, maximum temperature, and the measured air pollutants during the period from 2000 to 2016 in Stockholm, and from 2001 to 2018 in Tallinn. These variables are presented as mean values and IQR values, and the percentage number of days with valid data.
Table 2.
Summary statistics of the daily data from 2000 to 2016 in Stockholm and from 2001 to 2018 in Tallinn.
Correlation coefficients (Pearson) between the measured air pollutants are presented for Stockholm and Tallinn in Table 3. Large variations in the values were shown. In general, high values were shown between combustion-related pollutants (PM2.5, BC, PNC4, and NO2), and low or negative values were shown between O3 and these combustion-related pollutants.
Table 3.
Correlation matrix with R-values (Pearson correlation coefficients) between the different air pollutants measured in Stockholm during the period from 2000 to 2016, and in Tallinn during the period from 2001 to 2018. Correlations for Stockholm are to the left of and below the diagonal from the top left to the bottom right. Correlations for Tallinn are to the right of and above the diagonal from the top left to the bottom right.
3.2. The Excess Risks in Different Age Groups in Stockholm and Tallinn
Figure 1 presents excess risks for different age groups associated with an IQR increase (lag01 and lag02) in the measured air pollutants in Stockholm based on single-pollutant models during the period from 2000–2016. In the age group 0–14 years of age, statistically significant positive excess risks were found for PM2.5–10 for both lag01 and lag02. In the age group 65+ years of age, statistically significant positive excess risks were found for O3 and PM2.5–10 for both lag01 and lag02, and a significant excess risk was also found for PM10, but only for lag02. Statistically significant negative excess risks were found for NO2 for both lag01 and lag02. No statistically significant positive excess risks were found for the age group 15–64 years of age, except for PNC4 with a statistically significant negative excess risk for lag01.
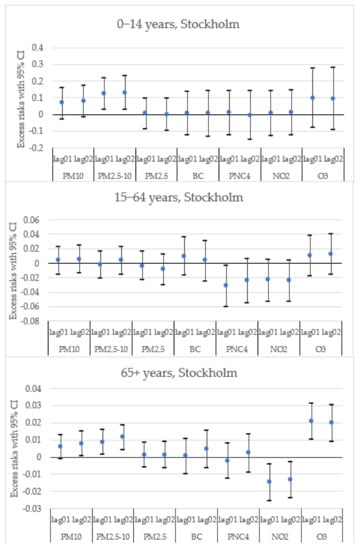
Figure 1.
Single-pollutant models of the estimated change in daily mortality in different age groups (with 95% CI) for an IQR increase in the concentrations (lag01 and lag02) of different air pollutants in Stockholm.
Figure 2 presents excess risks for different age groups associated with an IQR increase (lag01 and lag02) in the measured air pollutants in Tallinn based on single-pollutant models during the period from 2001–2018. In the age group 0–14 years of age, a statistically significant positive excess risk was found for O3 (lag01), and a statistically significant negative excess risk was found for NO2 (lag01). In the age group 65+ years of age, statistically significant positive excess risks were found for O3 for both lag01 and lag02. No statistically significant excess risks were found for the age group 15–64 years of age.
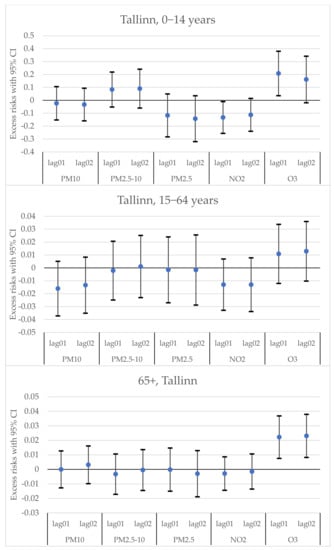
Figure 2.
Single-pollutant models of the estimated change in daily mortality in different age groups (with 95% CI) for an IQR increase in the concentrations (lag01 and lag02) of different air pollutants in Tallinn.
In order to make adjustments for possible interaction effects between different air pollutants, multi-pollutant models were constructed. Figure 3, Figure 4, Figure 5, Figure 6, Figure 7 and Figure 8 present excess risks for different age groups associated with an IQR increase (lag02) in the measured air pollutants, based on multi-pollutant models during the periods from 2000 to 2016 in Stockholm and from 2001 to 2018 in Tallinn. Figure 3 presents multi-pollutant models in Stockholm based on PM2.5–10 with O3, NO2, and NO2 + O3 included. In the age group 0–14 years of age, the excess risks were significant in all multi-pollutant models. In the age group 15–64 years of age, no significant excess risks were shown. In the age group 65+ years of age, the excess risks were significant for NO2 and NO2 + O3 included. Figure 4 presents multi-pollutant models in Tallinn based on PM2.5–10 with O3, NO2, and NO2 + O3 included. In the age group 0–14 years of age, the excess risks were significant in the multi-pollutant models for NO2 and NO2 + O3. No significant excess risks were shown in the age groups 15–64 years of age and 65+ years of age.
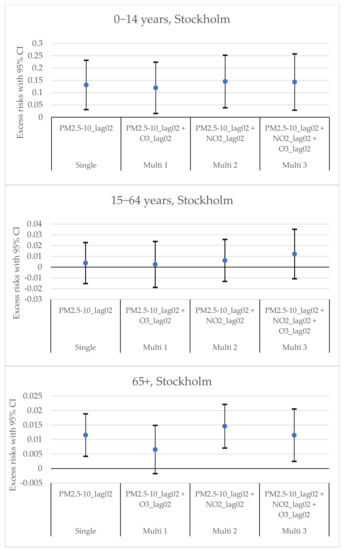
Figure 3.
Multi-pollutant models of the estimated change in daily mortality in different age groups (with 95% CI) for an IQR increase in the concentration of PM2.5–10 (lag02) in Stockholm. From left to right: a single-pollutant estimate of PM2.5–10 (Single), PM2.5–10 adjusted for O3 (Multi 1), PM2.5–10 adjusted for NO2 (Multi 2), and PM2.5–10 adjusted for both NO2 and O3 (Multi 3).
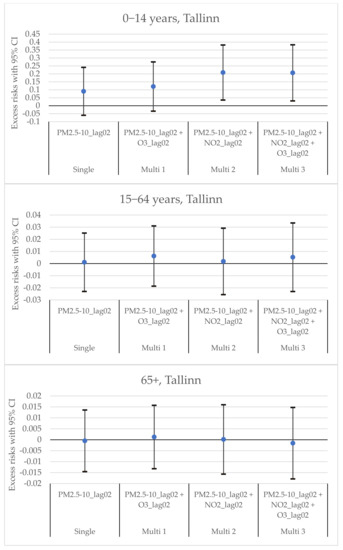
Figure 4.
Multi-pollutant models of the estimated change in daily mortality in different age groups (with 95% CI) for an IQR increase in the concentration of PM2.5–10 (lag02) in Tallinn. From left to right: a single-pollutant estimate of PM2.5–10 (Single), PM2.5–10 adjusted for O3 (Multi 1), PM2.5–10 adjusted for NO2 (Multi 2), and PM2.5–10 adjusted for both NO2 and O3 (Multi 3).
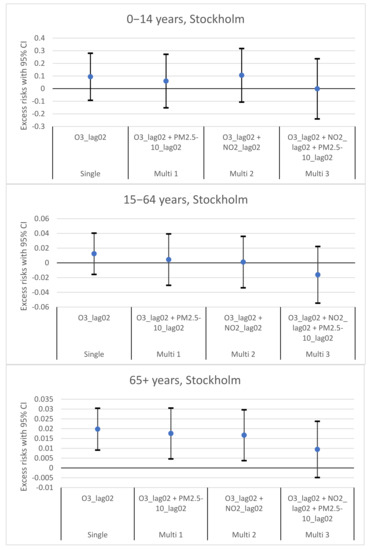
Figure 5.
Multi-pollutant models of the estimated change in daily mortality in different age groups (with 95% CI) for an IQR increase in the concentration of O3 (lag02) in Stockholm. From left to right: a single-pollutant estimate of O3 (Single), O3 adjusted for PM2.5–10 (Multi 1), O3 adjusted for NO2 (Multi 2), and O3 adjusted for both NO2 and PM2.5–10 (Multi 3).
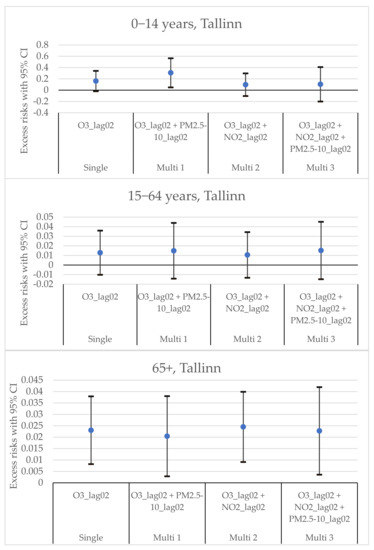
Figure 6.
Multi-pollutant models of the estimated change in daily mortality in different age groups (with 95% CI) for an IQR increase in the concentration of O3 (lag02) in Tallinn. From left to right: a single-pollutant estimate of O3 (Single), O3 adjusted for PM2.5–10 (Multi 1), O3 adjusted for NO2 (Multi 2), and O3 adjusted for both NO2 and PM2.5–10 (Multi 3).
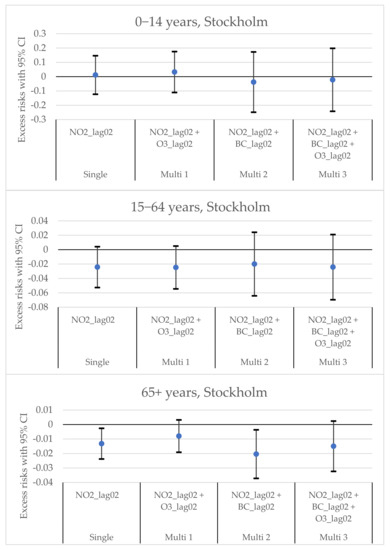
Figure 7.
Multi-pollutant models of the estimated change in daily mortality in different age groups (with 95% CI) for an IQR increase in the concentration of NO2 (lag02) in Stockholm. From left to right: a single-pollutant estimate of NO2 (Single), NO2 adjusted for O3 (Multi 1), NO2 adjusted for BC (Multi 2), and NO2 adjusted for both BC and O3 (Multi 3).
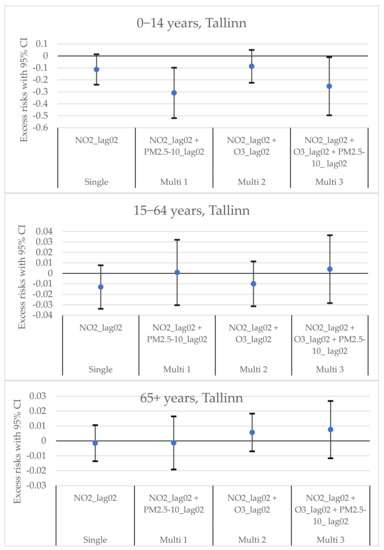
Figure 8.
Multi-pollutant models of the estimated change in daily mortality in different age groups (with 95% CI) for an IQR increase in the concentration of NO2 (lag02) in Tallinn. From left to right: a single-pollutant estimate of NO2 (Single), NO2 adjusted for PM2.5–10 (Multi 1), NO2 adjusted for O3 (Multi 2), and NO2 adjusted for both O3 and PM2.5–10 (Multi 3).
The excess risks for all ages, corresponding to those shown in Figure 1, Figure 2, Figure 3, Figure 4, Figure 5, Figure 6, Figure 7 and Figure 8, are presented in Appendix A, Figure A1, Figure A2, Figure A3, Figure A4, Figure A5, Figure A6, Figure A7 and Figure A8.
Figure 5 presents multi-pollutant models in Stockholm based on O3 with PM2.5–10, NO2, and NO2 + PM2.5–10. In the age group ≥65 years of age, statistically significant excess risks were shown in the multi-pollutant models with PM2.5–10 and with NO2 included. No significant excess risks were shown in the age groups 0–14 years of age and 15–64 years of age.
Figure 6 presents multi-pollutant models in Tallinn based on O3 with PM2.5–10, NO2, and NO2 + PM2.5–10. In the age group 0–14 years of age, a statistically significant excess risk was shown in the multi-pollutant model with PM2.5–10 included. No significant excess risks were shown in the age groups 15–64 years of age, while all excess risks were significant in the age group 65+ years of age.
Figure 7 presents multi-pollutant models in Stockholm, based on NO2 with O3, BC, and BC + O3. In the age group 0–14 years of age and 15–64 years of age, no statistically significant excess risks were shown. In the age group 65+ years of age, one statistically significant negative excess risk was shown with BC included.
Figure 8 presents multi-pollutant models in Tallinn based on NO2 with PM2.5–10, O3, and O3 + PM2.5–10. In the age group 0–14 years of age, two statistically significant negative excess risks were shown with PM2.5–10 and O3 + PM2.5–10. In the age groups 15–64 years of age and 65+ years of age, no statistically significant excess risk were shown.
4. Discussion
4.1. Excess Risks in Different Age Groups
The excess risks presented in Figure 1, Figure 2, Figure 3, Figure 4, Figure 5, Figure 6, Figure 7 and Figure 8 show broadly expected results with the risk increases among children (age groups 0–14) and the elderly (65+). The statistically significant excess risks in the youngest age group of 0–14 years of age for PM2.5–10 in both cities, and for O3 in Tallinn, were somewhat more substantial. Even though the excess deaths in the age group 0−14 years of age were not further specified within the specific age range (0, 1, 2, etc. years of age), in general, almost half of them occurred in both Stockholm and Tallinn during the early postnatal period, or very early in life (0–1 years of age) [29,30].
Exposure to air pollutants during fetal development and early postnatal life has been proven to cause a variety of health problems, including low birth weight, preterm birth, intrauterine growth restriction, intrauterine and infant mortality, congenital defects, decreased lung growth, increased rates of respiratory tract infections, childhood asthma, behavioral problems, and neurocognitive decrements [31]. In a study based on a bibliographical search on the MEDLINE database, an overall conclusion was that a 10 µg m−3 increase in PM10 was associated with an approximately 5% increase in post-neonatal mortality for all causes [32]. The relative risks of total mortality associated with an increase in PM10 also turned out to be the largest among post-neonates, as shown in Seoul by [21].
In our study, we did not see any effects among adults in the age range 15–64 years of age, despite the fact that some studies have shown effects in similar age groups [22,25]. There could be several socio-demographic factors involved, as India and China are different from northern Europe. Nevertheless, in the current study, strong effects appeared among the elderly (65+). This is in line with most of the previous studies that have shown significant effects of short-term exposure on the older age groups [8,9,10,11,12,13,14,15,16,18,19,20,21]. There are several factors that can make older people more susceptible to premature mortality. Most importantly, they have had long lasting exposures due to their longevity that might have resulted in conditions occurring; examples of this include high blood pressure, diabetes, and heart disease, as well as diseases of the central nervous system [33,34]. During short-term air pollution episodes, their conditions could get worse, and consequently, they could die prematurely [35].
4.2. Effects of Different Air Pollutants at Low Concentrations
In the current study, we could see significant effects of coarse particles (PM2.5–10) and near surface ozone, However, no effects were shown for PM2.5, PNC4, or BC. Short-term effects of coarse particles on daily mortality in Stockholm have previously been presented by Meister et al. [36], where data from 2000 to 2008 were applied. In a previous review by Adar et al. [37], associations between ambient coarse particulate matter and human health were presented. The largest effects were shown for respiratory endpoints (possibly due to inflammation), although associations with cardiovascular endpoints could not be excluded [38].
Regarding near surface ozone in this study, significant effects on mortality were found among children and the elderly in Tallinn; however, in Stockholm only among the elderly. Although the mortality effects of O3 are well confirmed in population-wide studies [37,39], a relatively small number of studies have focused on effects in different age groups. Especially for children, there are only a limited number of studies available. Regarding ozone exposure in children, the risks are particularly high, because their lungs are still developing, and the effects can range from initial epithelial damage and neural excitation to neural reprogramming [40]. There are more studies available that focus on the elderly [14,16,41,42,43,44,45], but they are still relatively limited. Ozone is a strong oxidant, being able to induce oxidative damages to cells and the lining fluids of the airways, and can, consequently, induce immune-inflammatory responses within, and beyond, the lungs [46]. Moreover, ozone can also induce platelet activation and increase blood pressure, suggesting a possible mechanism by which ozone may affect cardiovascular health [47].
Regarding NO2, negative excess risks associated with exposure are present in both Stockholm and Tallinn. The negative risks associated with NO2 in Stockholm have also been shown in previous studies [27,48], and the possible explanations, including concentrations below threshold levels, adjustments with temperature lags capturing the effects of exhaust emissions, and exposure misclassifications, are discussed in a previous study by Olstrup et al. [48]. As shown in the current study, negative excess risks associated with NO2 were also present in Tallinn; however, in Tallinn, only among children, whereas in Stockholm, only among the elderly. In the multi-pollutant models, these effects were modified by ozone in Stockholm and by coarse particles in Tallinn. In Stockholm, NO2 was also highly correlated with PNC4, as has been shown in a previous study by Varotsos et al. [49]. However, in most cases, no statistically significant effects were shown for PNC4 in the single-pollutant models.
Regarding the air pollution concentration in this study, the effects can be considered to appear at low concentrations. The average concentrations (µg m−3) during the study periods in Stockholm and Tallinn, respectively, were as follows: PM10: 14.5 and 14.9; PM2.5–10: 8.0 and 6.6; PM2.5: 6.5 and 8.1; NO2: 14.4 and 11.0; O3: 51.2 and 51.3. The average concentrations in PM10 and O3 were, in both cities, well below the new WHO global air quality guideline (AQG) concentrations [50]. However, the effects at low concentrations have previously been demonstrated by Di et al. [51] and Shi et al. [52], where ambient ozone concentrations well below the National Ambient Air Quality Standards were significantly associated with increases in all-cause mortality among the elderly in the U.S. Zhang [26] has discussed that regulations should continue to consider emerging scientific evidence to further lower the standards in order to minimize health risks. A multi-center study in 406 locations (including Tallinn) has indicated that negative effects per one µg m−3 increase in ozone exposure can also be relatively higher in less polluted areas [53].
Currently, PM2.5–10 is regulated through PM10. Despite the fact that PM10 concentrations are below AQG levels, the excess risks in mortality associated with exposure to PM2.5–10 in the age group 0–14 years of age are statistically significant in both Stockholm and Tallinn. From a policy point of view, a special focus on PM2.5–10 is needed in order to protect the youngest in the population from detrimental health effects associated with exposure. More research, focusing on the biological mechanisms that govern larger coarse particles and the importance of specific chemical components, is needed.
4.3. Other Than Mortality Effects
When using excess mortality as a metric of health impact, it can be considered as the top of an iceberg with a lot of health effects that occur prior to death. Other health effects, such as progression of chronic diseases and hospitalizations, associated with air pollution exposure, also have different effects depending on age. For instance, a number of studies have analyzed the associations between air pollutants and hospital admissions [54,55], and some of these studies have looked at different age groups. For instance, the associations between cardiovascular hospital admissions and a number of air pollutants (PM2.5, PM10, NO2, CO, and O3) were calculated for seven cities in Australia and New Zealand. Statistically significant associations between increases in PM2.5, NO2, and CO and total cardiovascular hospital admissions were found for the age group ≥65 years of age, which were larger compared to the corresponding associations found for the age group 15–64 years of age [56]. In two studies conducted in a number of cities in France, the associations between increases in PM10, PM2.5, PM2.5–10, and NO2, and hospitalizations for cardiovascular diseases were analyzed for different age groups, where higher excess risks in the age group 65+ years of age were reported [57,58].
Some studies have also analyzed the associations between air pollutants and respiratory hospital admissions in different age groups. In a study performed in a metropolitan area in West Yorkshire in the northern part of the U.K., the effect of CO was most prominent among the most elderly (≥80 years of age), and statistically significant associations were also found for PM10, SO2, and O3 in the age group 70–79 years of age, while NO2 exhibited the opposite relationship, with lower effects among the elderly [59]. In an analysis of five West European cities, the strongest and most consistent finding was for O3, with statistically significant increases in the number of hospital admissions for respiratory diseases in both age groups (15–64 and 65+), but strongest in the age group 65+ years of age [60]. However, in a study performed in Korea, the associations between different air pollutants (PM10, CO, O3, NO2, and SO2) and hospital admissions for asthma were calculated for the age groups < 15 years of age, 15–64 years of age, and 65+ years of age. No statistically significant associations were found for the age group < 15 years of age, while for the age group 65+ years of age, statistically significant associations were found for all pollutants except for O3, and in the age group 15–64 years of age, statistically significant associations were found for PM10 and CO [61]. Regarding PM2.5–10, a statistically significant excess risk for respiratory hospitalizations in the age group 0–14 years of age has been found in France [58]. To sum up, air pollution exposure also has major effects in terms of hospital admissions, and the greatest effects have been found among children and the elderly.
4.4. Strengths and Limitations of This Study
A strength of this study is that it includes time-series regressions of several air pollutants in both single- and multi-pollutant models in two cities. This means that the results are well substantiated. The air pollutants that have been measured include pollutants that largely reflect exhaust emissions from traffic (NO2, PM2.5, BC, and PNC4), an oxidant (O3), and particles that indicate the role of road dust (PM10 and PM2.5–10). The mortality data also have 100% coverage for each age group during the periods in both Stockholm and Tallinn.
A limitation of this study is that the mortality data in the age group 0–14 years of age were not further specified, which means that it was not possible to determine the specific ages at which the effects occurred. Also, those associations were based on very small numbers of cases, as, on average, 10–15 children in the age group 0–14 years of age die each year in Stockholm and Tallinn, respectively [29,30]. Regarding exposures, some of the pollutants, such as BC and PNC4 had low data coverage, and they were only measured in Stockholm.
5. Conclusions
The excess risks are generally clearest in the age group 65+, and this is especially solid for O3 in both Stockholm and Tallinn. In Stockholm, the excess risks in the single-pollutant model associated with PM2.5–10 were statistically significant for the age group 65+, and they remained significant in the multi-pollutant models when adjusting for NO2 and NO2 + O3. However, in Tallinn, the excess risks associated with PM2.5–10 in the age group 65+ were not statistically significant in any model, and no statistically significant effects in the age group 15–64 years of age were shown, neither in Stockholm nor Tallinn. Novel knowledge was the statistically significant excess risks in the age group 0–14 years of age associated with PM2.5–10 in both Stockholm and Tallinn, and with O3 in Tallinn. From a policy point of view, a special focus on PM2.5–10 is needed in order to protect the youngest in the population from detrimental health effects associated with exposure. Indeed, even stricter policies and emission reductions are needed, as the effects were identified below the new WHO global AQG concentrations.
Author Contributions
Conceptualization: H.O. (Henrik Olstrup) and H.O. (Hans Orru); methodology: H.O. (Henrik Olstrup), C.Å. and H.O. (Hans Orru); data analysis: H.O. (Henrik Olstrup), C.Å. and H.O. (Hans Orru); writing—original draft preparation: H.O. (Henrik Olstrup); writing—review and editing: C.Å. and H.O. (Hans Orru). All authors have read and agreed to the published version of the manuscript.
Funding
This research received no external funding.
Institutional Review Board Statement
The study was conducted in accordance with the Declaration of Helsinki and approved by the Ethics Committee of the University of Tartu for Human Research (protocol number 295/T-17, 26.08.2019).
Informed Consent Statement
Not applicable.
Data Availability Statement
The data presented in this study are available on request from the corresponding author.
Acknowledgments
We would like to thank two anonymous reviewers for reviewing this study.
Conflicts of Interest
The authors declare no conflict of interest.
Appendix A

Figure A1.
A single-pollutant model of the estimated change in daily mortality in all ages (with 95% CI) for an IQR increase in the concentrations (lag01 and lag02) of different air pollutants in Stockholm.
Figure A1.
A single-pollutant model of the estimated change in daily mortality in all ages (with 95% CI) for an IQR increase in the concentrations (lag01 and lag02) of different air pollutants in Stockholm.


Figure A2.
Multi-pollutant models of the estimated change in daily mortality in all ages (with 95% CI) for an IQR increase in the concentration of PM2.5–10 (lag02) in Stockholm. From left to right: a single-pollutant estimate of PM2.5–10 (Single), PM2.5–10 adjusted for O3 (Multi 1), PM2.5–10 adjusted for NO2 (Multi 2), and PM2.5–10 adjusted for both NO2 and O3 (Multi 3).


Figure A3.
Multi-pollutant models of the estimated change in daily mortality in all ages (with 95% CI) for an IQR increase in the concentration of O3 (lag02) in Stockholm. From left to right: a single-pollutant estimate of O3 (Single), O3 adjusted for PM2.5–10 (Multi 1), O3 adjusted for NO2 (Multi 2), and O3 adjusted for both NO2 and PM2.5–10 (Multi 3).


Figure A4.
Multi-pollutant models of the estimated change in daily mortality in all ages (with 95% CI) for an IQR increase in the concentration of NO2 (lag02) in Stockholm. From left to right: a single-pollutant estimate of NO2 (Single), NO2 adjusted for O3 (Multi 1), NO2 adjusted for BC (Multi 2), and NO2 adjusted for both BC and O3 (Multi 3).


Figure A5.
A single-pollutant model of the estimated change in daily mortality in all ages (with 95% CI) for an IQR increase in the concentrations (lag01 and lag02) of different air pollutants in Tallinn.
Figure A5.
A single-pollutant model of the estimated change in daily mortality in all ages (with 95% CI) for an IQR increase in the concentrations (lag01 and lag02) of different air pollutants in Tallinn.


Figure A6.
Multi-pollutant models of the estimated change in daily mortality in all ages (with 95% CI) for an IQR increase in the concentration of PM2.5–10 (lag02) in Tallinn. From left to right: a single-pollutant estimate of PM2.5–10 (Single), PM2.5–10 adjusted for O3 (Multi 1), PM2.5–10 adjusted for NO2 (Multi 2), and PM2.5–10 adjusted for both NO2 and O3 (Multi 3).


Figure A7.
Multi-pollutant models of the estimated change in daily mortality in all ages (with 95% CI) for an IQR increase in the concentration of O3 (lag02) in Tallinn. From left to right: a single-pollutant estimate of O3 (Single), O3 adjusted for PM2.5–10 (Multi 1), O3 adjusted for NO2 (Multi 2), and O3 adjusted for both NO2 and PM2.5–10 (Multi 3).


Figure A8.
Multi-pollutant models of the estimated change in daily mortality in all ages (with 95% CI) for an IQR increase in the concentration of NO2. (lag02) in Tallinn. From left to right: a single-pollutant estimate of NO2 (Single), NO2 adjusted for PM2.5–10 (Multi 1), NO2 adjusted for O3 (Multi 2), and NO2 adjusted for both O3 and PM2.5–10 (Multi 3).

References
- Makri, A.; Stilianakis, N.I. Vulnerability to air pollution health effects. Int. J. Hyg. Environ. Health 2008, 211, 326–336. [Google Scholar] [CrossRef] [PubMed]
- Mead, M.N. Who’s at risk? Gauging susceptibility to air pollutants. Environ. Health Perspect. 2011, 119, A176. [Google Scholar] [CrossRef] [PubMed]
- Sacks, J.D.; Stanek, L.W.; Luben, T.J.; Johns, D.O.; Buckley, B.J.; Brown, J.S.; Ross, M. Particulate matter-induced health effects: Who is susceptible? Environ. Health Perspect. 2011, 119, 446–454. [Google Scholar] [CrossRef] [PubMed]
- Geller, A.M.; Zenick, H. Aging and the environment: A research framework. Environ. Health Perspect. 2005, 113, 1257–1262. [Google Scholar] [CrossRef]
- Shumake, K.L.; Sacks, J.D.; Lee, J.S.; Johns, D.O. Susceptibility of older adults to health effects induced by ambient air pollutants regulated by the European Union and the United States. Aging Clin. Exp. Res. 2013, 25, 3–8. [Google Scholar] [CrossRef]
- Buka, I.; Koranteng, S.; Osornio-Vargas, A.R. The effects of air pollution on the health of children. Paediatr. Child Health 2006, 11, 513–516. [Google Scholar]
- Varotsos, C.; Efstathiou, M.; Tzanis, C.; Deligiorgi, D. On the limits of the air pollution predictability: The case of the surface ozone at Athens, Greece. Environ. Sci. Pollut. Res. 2012, 19, 295–300. [Google Scholar] [CrossRef]
- Aga, E.; Samoli, E.; Touloumi, G.; Anderson, H.R.; Cadum, E.; Forsberg, B.; Goodman, P.; Goren, A.; Kotěšovec, F.; Kříž, B.; et al. Short-term effects of ambient particles on mortality in the elderly: Results from 28 cities in the APHEA2 project. Eur. Respir. J. Suppl. 2003, 40, 28s–33s. [Google Scholar] [CrossRef]
- Cakmak, S.; Dales, R.E.; Vidal, C.B. Air pollution and mortality in Chile: Susceptibility among the elderly. Environ. Health Perspect. 2007, 115, 524–527. [Google Scholar] [CrossRef]
- Chen, R.; Kan, H.; Chen, B.; Huang, W.; Bai, Z.; Song, G.; Pan, G. Association of particulate air pollution with daily mortality: The China Air Pollution and Health Effects Study. Am. J. Epidemiol. 2012, 175, 1173–1181. [Google Scholar] [CrossRef]
- Yin, P.; He, G.; Fan, M.; Chiu, K.Y.; Liu, C.; Xue, A.; Liu, T.; Pan, Y.; Mu, Q.; Zhou, M. Particulate air pollution and mortality in 38 of China’s largest cities: Time series analysis. BMJ 2017, 356, j667. [Google Scholar] [CrossRef]
- Sanhueza, P.A.; Torreblanca, M.A.; Diaz-Robles, L.A.; Schiappacasse, L.N.; Silva, M.P.; Astete, T.D. Particulate air pollution and health effects for cardiovascular and respiratory causes in Temuco, Chile: A wood-smoke-polluted urban area. J. Air Waste Manag. Assoc. 2009, 59, 1481–1488. [Google Scholar] [CrossRef]
- Yap, J.; Ng, Y.; Yeo, K.K.; Sahlén, A.; Lam, C.S.P.; Lee, V.; Ma, S. Particulate air pollution on cardiovascular mortality in the tropics: Impact on the elderly. Environ. Health 2019, 18, 34. [Google Scholar] [CrossRef]
- Fischer, P.; Hoek, G.; Brunekreef, B.; Verhoeff, A.; van Wijnen, J. Air pollution and mortality in The Netherlands: Are the elderly more at risk? Eur. Respir. J. Suppl. 2003, 40, 34s–38s. [Google Scholar] [CrossRef]
- Franklin, M.; Zeka, A.; Schwartz, J. Association between PM2.5 and all-cause and specific-cause mortality in 27 US communities. J. Expo. Sci. Environ. Epidemiol. 2007, 17, 279–287. [Google Scholar] [CrossRef]
- Medina-Ramón, M.; Schwartz, J. Who is more vulnerable to die from ozone air pollution? Epidemiology 2008, 19, 672–679. [Google Scholar] [CrossRef]
- Anderson, H.R.; Limb, E.S.; Bland, J.M.; de Leon, A.P.; Strachan, D.P.; Bower, J.S. Health effects of an air pollution episode in London, December 1991. Thorax 1995, 50, 1188–1193. [Google Scholar] [CrossRef]
- Filleul, L.; Le Tertre, A.; Baldi, I.; Tessier, J.F. Difference in the relation between daily mortality and air pollution among elderly and all-ages populations in southwestern France. Environ. Res. 2004, 94, 249–253. [Google Scholar] [CrossRef]
- Prescott, G.J.; Cohen, G.; Elton, R.; Fowkes, F.; Agius, R. Urban air pollution and cardiopulmonary ill health: A 14.5 year time series study. Occup. Environ. Med. 1998, 55, 697–704. [Google Scholar] [CrossRef]
- Gouveia, N.; Fletcher, T. Time series analysis of air pollution and mortality: Effects by cause, age and socioeconomic status. J. Epidemiol. Community Health 2000, 54, 750–755. [Google Scholar] [CrossRef]
- Ha, E.H.; Lee, J.T.; Kim, H.; Hong, Y.C.; Lee, B.E.; Park, H.S.; Christiani, D.C. Infant susceptibility of mortality to air pollution in Seoul, South Korea. Pediatrics 2003, 111, 284–290. [Google Scholar] [CrossRef]
- Alberini, A.; Cropper, M.; Simon, N.B.; Sharma, P.K. The Health Effects of Air Pollution in Delhi, India; The World Bank: Washington, DC, USA, 1997. [Google Scholar]
- Krishna, B.; Mandal, S.; Madhipatla, K.; Reddy, K.S.; Prabhakaran, D.; Schwartz, J.D. Daily nonaccidental mortality associated with short-term PM(2.5) exposures in Delhi, India. Environ. Epidemiol. 2021, 5, e167. [Google Scholar] [CrossRef]
- Chen, Y.; Jiao, Z.; Chen, P.; Fan, L.; Zhou, X.; Pu, Y.; Du, W.; Yin, L. Short-term effect of fine particulate matter and ozone on non-accidental mortality and respiratory mortality in Lishui district, China. BMC Public Health 2021, 21, 1661. [Google Scholar] [CrossRef]
- Qiu, H.; Yu, H.; Wang, L.; Zhu, X.; Chen, M.; Zhou, L.; Deng, R.; Zhang, Y.; Pu, X.; Pan, J. The burden of overall and cause-specific respiratory morbidity due to ambient air pollution in Sichuan Basin, China: A multi-city time-series analysis. Environ. Res. 2018, 167, 428–436. [Google Scholar] [CrossRef] [PubMed]
- Zhang, J. Low-Level Air Pollution Associated with Death: Policy and Clinical Implications. JAMA 2017, 318, 2431–2432. [Google Scholar] [CrossRef] [PubMed]
- Olstrup, H.; Johansson, C.; Forsberg, B.; Åström, C. Association between mortality and short-term exposure to particles, ozone and nitrogen dioxide in Stockholm, Sweden. Int. J. Environ. Res. Public Health 2019, 16, 1028. [Google Scholar] [CrossRef] [PubMed]
- Auger, N.; Potter, B.J.; Smargiassi, A.; Bilodeau-Bertrand, M.; Paris, C.; Kosatsky, T. Association between quantity and duration of snowfall and risk of myocardial infarction. CMAJ 2017, 189, E235–E242. [Google Scholar] [CrossRef] [PubMed]
- Statistics Estonia. Statistical Database. 2022. Available online: https://www.stat.ee/en (accessed on 4 June 2022).
- Socialstyrelsen. Statistical Databases. 2022. Available online: https://www.socialstyrelsen.se/statistik-och-data/statistik/statistikdatabasen/ (accessed on 4 June 2022).
- Wang, L.; Pinkerton, K.E. Air pollutant effects on fetal and early postnatal development. Birth Defects Res. Part C Embryo Today Rev. 2007, 81, 144–154. [Google Scholar] [CrossRef]
- Lacasana, M.; Esplugues, A.; Ballester, F. Exposure to ambient air pollution and prenatal and early childhood health effects. Eur. J. Epidemiol. 2005, 20, 183–199. [Google Scholar] [CrossRef]
- Kim, H.; Kim, W.-H.; Kim, Y.-Y.; Park, H.-Y. Air Pollution and Central Nervous System Disease: A Review of the Impact of Fine Particulate Matter on Neurological Disorders. Front. Public Health 2020, 8, 575330. [Google Scholar] [CrossRef]
- Raaschou-Nielsen, O.; Andersen, Z.J.; Jensen, S.S.; Ketzel, M.; Sørensen, M.; Hansen, J.; Loft, S.; Tjønneland, A.; Overvad, K. Traffic air pollution and mortality from cardiovascular disease and all causes: A Danish cohort study. Environ. Health 2012, 11, 60. [Google Scholar] [CrossRef]
- Münzel, T.; Hahad, O.; Daiber, A.; Lelieveld, J. Air pollution and cardiovascular diseases. Herz 2021, 46, 120–128. [Google Scholar] [CrossRef]
- Meister, K.; Johansson, C.; Forsberg, B. Estimated short-term effects of coarse particles on daily mortality in Stockholm, Sweden. Environ. Health Perspect. 2012, 120, 431–436. [Google Scholar] [CrossRef]
- Adar, S.D.; Filigrana, P.A.; Clements, N.; Peel, J.L. Ambient Coarse Particulate Matter and Human Health: A Systematic Review and Meta-Analysis. Curr. Environ. Health Rep. 2014, 1, 258–274. [Google Scholar] [CrossRef]
- Schins, R.P.; Lightbody, J.H.; Borm, P.J.; Shi, T.; Donaldson, K.; Stone, V. Inflammatory effects of coarse and fine particulate matter in relation to chemical and biological constituents. Toxicol. Appl. Pharmacol. 2004, 195, 1–11. [Google Scholar] [CrossRef]
- Guo, X.; Su, W.; Wang, H.; Li, N.; Song, Q.; Liang, Q.; Sun, C.; Liang, M.; Zhou, Z.; Song, E.J.; et al. Short-term exposure to ambient ozone and cardiovascular mortality in China: A systematic review and meta-analysis. Int. J. Environ. Health Res. 2022, 1–18. [Google Scholar] [CrossRef]
- Auten, R.L.; Foster, W.M. Biochemical effects of ozone on asthma during postnatal development. Biochim. Biophys. Acta 2011, 1810, 1114–1119. [Google Scholar] [CrossRef][Green Version]
- Bräuner, E.V.; Zanobetti, A.; Schwartz, J. The Effect of Ozone on All Cause Mortality in the Elderly: Modification by Sex, Race, and Previous Heart, Lung, and Diabetes Related Hospital Admissions in a U. S. National Multicity Study. Epidemiology 2008, 19, S325. [Google Scholar] [CrossRef]
- Parodi, S.; Vercelli, M.; Garrone, E.; Fontana, V.; Izzotti, A. Ozone air pollution and daily mortality in Genoa, Italy between 1993 and 1996. Public Health 2005, 119, 844–850. [Google Scholar] [CrossRef]
- Farhat, N.; Ramsay, T.; Jerrett, M.; Krewski, D. Short-term effects of ozone and PM 2.5 on mortality in 12 Canadian cities. J. Environ. Prot. 2013, 4, 18. [Google Scholar]
- Ng, C.F.; Ueda, K.; Nitta, H.; Takeuchi, A. Seasonal variation in the acute effects of ozone on premature mortality among elderly Japanese. Environ. Monit. Assess. 2013, 185, 8767–8776. [Google Scholar] [CrossRef]
- Jung, E.J.; Na, W.; Lee, K.E.; Jang, J.Y. Elderly Mortality and Exposure to Fine Particulate Matter and Ozone. J. Korean Med. Sci. 2019, 34, e311. [Google Scholar] [CrossRef]
- Zhang, J.; Wei, Y.; Fang, Z. Ozone Pollution: A Major Health Hazard Worldwide. Front. Immunol. 2019, 10, 2518. [Google Scholar] [CrossRef]
- Day, D.B.; Xiang, J.; Mo, J.; Li, F.; Chung, M.; Gong, J.; Weschler, C.J.; Ohman-Strickland, P.A.; Sundell, J.; Weng, W.; et al. Association of Ozone Exposure with Cardiorespiratory Pathophysiologic Mechanisms in Healthy Adults. JAMA Intern. Med. 2017, 177, 1344–1353. [Google Scholar] [CrossRef]
- Olstrup, H.; Johansson, C.; Forsberg, B.; Åström, C.; Orru, H. Seasonal Variations in the Daily Mortality Associated with Exposure to Particles, Nitrogen Dioxide, and Ozone in Stockholm, Sweden, from 2000 to 2016. Atmosphere 2021, 12, 1481. [Google Scholar] [CrossRef]
- Varotsos, C.; Ondov, J.; Tzanis, C.; Öztürk, F.; Nelson, M.; Ke, H.; Christodoulakis, J. An observational study of the atmospheric ultra-fine particle dynamics. Atmos. Environ. 2012, 59, 312–319. [Google Scholar] [CrossRef]
- World Health Organization. WHO Global Air Quality Guidelines: Particulate Matter (PM2. 5 and PM10), Ozone, Nitrogen Dioxide, Sulfur Dioxide and Carbon Monoxide; World Health Organization: Geneva, Switzerland, 2021. [Google Scholar]
- Di, Q.; Dai, L.; Wang, Y.; Zanobetti, A.; Choirat, C.; Schwartz, J.D.; Dominici, F. Association of short-term exposure to air pollution with mortality in older adults. JAMA 2017, 318, 2446–2456. [Google Scholar] [CrossRef]
- Shi, L.; Rosenberg, A.; Wang, Y.; Liu, P.; Yazdi, M.D.; Réquia, W.; Steenland, K.; Chang, H.; Sarnat, J.A.; Wang, W.; et al. Low-Concentration Air Pollution and Mortality in American Older Adults: A National Cohort Analysis (2001–2017). Environ. Sci. Technol. 2021, 56, 7194–7202. [Google Scholar] [CrossRef]
- Vicedo-Cabrera, A.M.; Sera, F.; Liu, C.; Armstrong, B.; Milojevic, A.; Guo, Y.; Tong, S.; Lavigne, E.; Kyselý, J.; Urban, A.; et al. Short term association between ozone and mortality: Global two stage time series study in 406 locations in 20 countries. BMJ 2020, 368, m108. [Google Scholar] [CrossRef]
- Yee, J.; Cho, Y.A.; Yoo, H.J.; Yun, H.; Gwak, H.S. Short-term exposure to air pollution and hospital admission for pneumonia: A systematic review and meta-analysis. Environ. Health 2021, 20, 6. [Google Scholar] [CrossRef]
- Farhadi, Z.; Gorgi, H.A.; Shabaninejad, H.; Delavar, M.A.; Torani, S. Association between PM2.5 and risk of hospitalization for myocardial infarction: A systematic review and a meta-analysis. BMC Public Health 2020, 20, 314. [Google Scholar] [CrossRef] [PubMed]
- Barnett, A.G.; Williams, G.M.; Schwartz, J.; Best, T.L.; Neller, A.H.; Petroeschevsky, A.L.; Simpson, R.W. The effects of air pollution on hospitalizations for cardiovascular disease in elderly people in Australian and New Zealand cities. Environ. Health Perspect. 2006, 114, 1018–1023. [Google Scholar] [CrossRef] [PubMed]
- Larrieu, S.; Jusot, J.-F.; Blanchard, M.; Prouvost, H.; Declercq, C.; Fabre, P.; Pascal, L.; Le Tertre, A.; Wagner, V.; Rivière, S. Short term effects of air pollution on hospitalizations for cardiovascular diseases in eight French cities: The PSAS program. Sci. Total Environ. 2007, 387, 105–112. [Google Scholar] [CrossRef] [PubMed]
- Host, S.; Larrieu, S.; Pascal, L.; Blanchard, M.; Declercq, C.; Fabre, P.; Jusot, J.-F.; Chardon, B.; Le Tertre, A.; Wagner, V.; et al. Short-term associations between fine and coarse particles and hospital admissions for cardiorespiratory diseases in six French cities. Occup. Environ. Med. 2008, 65, 544–551. [Google Scholar] [CrossRef]
- Namdeo, A.; Tiwary, A.; Farrow, E. Estimation of age-related vulnerability to air pollution: Assessment of respiratory health at local scale. Environ. Int. 2011, 37, 829–837. [Google Scholar] [CrossRef]
- Spix, C.; Anderson, H.R.; Schwartz, J.; Vigotti, M.A.; Letertre, A.; Vonk, J.M.; Touloumi, G.; Balducci, F.; Piekarski, T.; Bacharova, L.; et al. Short-term effects of air pollution on hospital admissions of respiratory diseases in Europe: A quantitative summary of APHEA study results. Arch. Environ. Health Int. J. 1998, 53, 54–64. [Google Scholar] [CrossRef]
- Park, M.; Luo, S.; Kwon, J.; Stock, T.H.; Delclos, G.; Kim, H.; Yun-Chul, H. Effects of air pollution on asthma hospitalization rates in different age groups in metropolitan cities of Korea. Air Qual. Atmos. Health 2013, 6, 543–551. [Google Scholar] [CrossRef][Green Version]


Publisher’s Note: MDPI stays neutral with regard to jurisdictional claims in published maps and institutional affiliations. |
© 2022 by the authors. Licensee MDPI, Basel, Switzerland. This article is an open access article distributed under the terms and conditions of the Creative Commons Attribution (CC BY) license (https://creativecommons.org/licenses/by/4.0/).