
Assessment of the Role of Nearshore Marine Ecosystems to Mitigate Beach Erosion: The Case of Negril (Jamaica)

 ,
,  ,
, 
Abstract
:1. Introduction
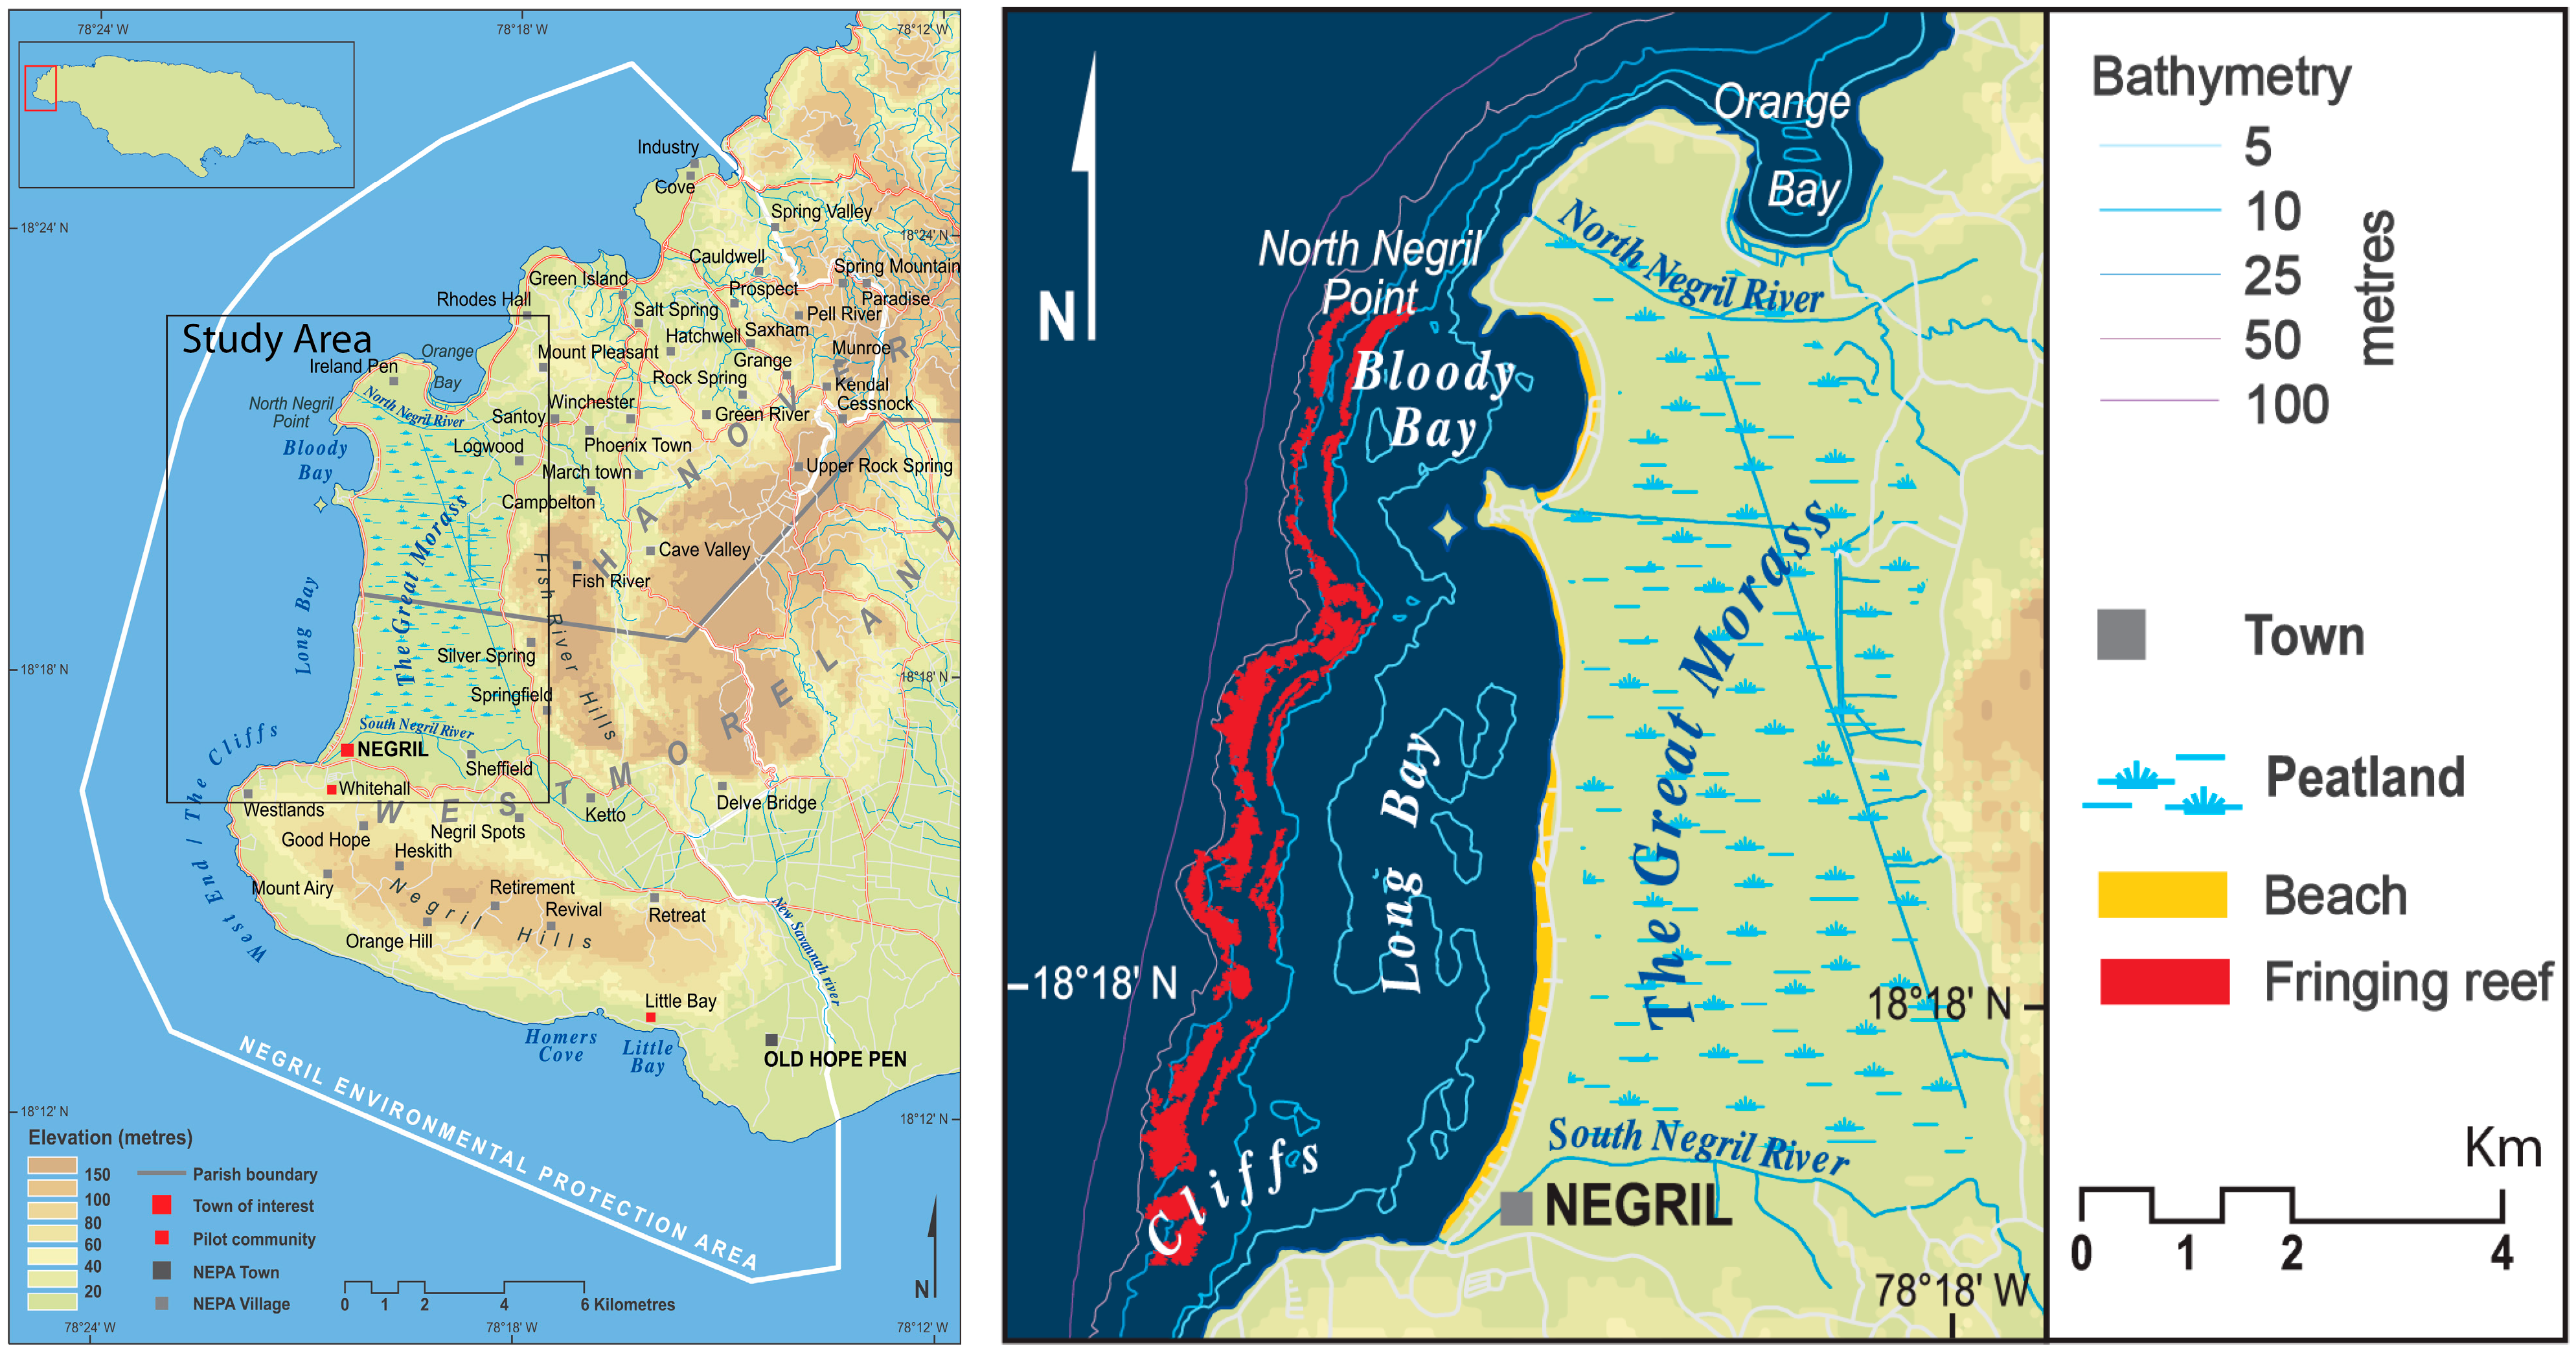
2. Study Area
3. Data and Methods
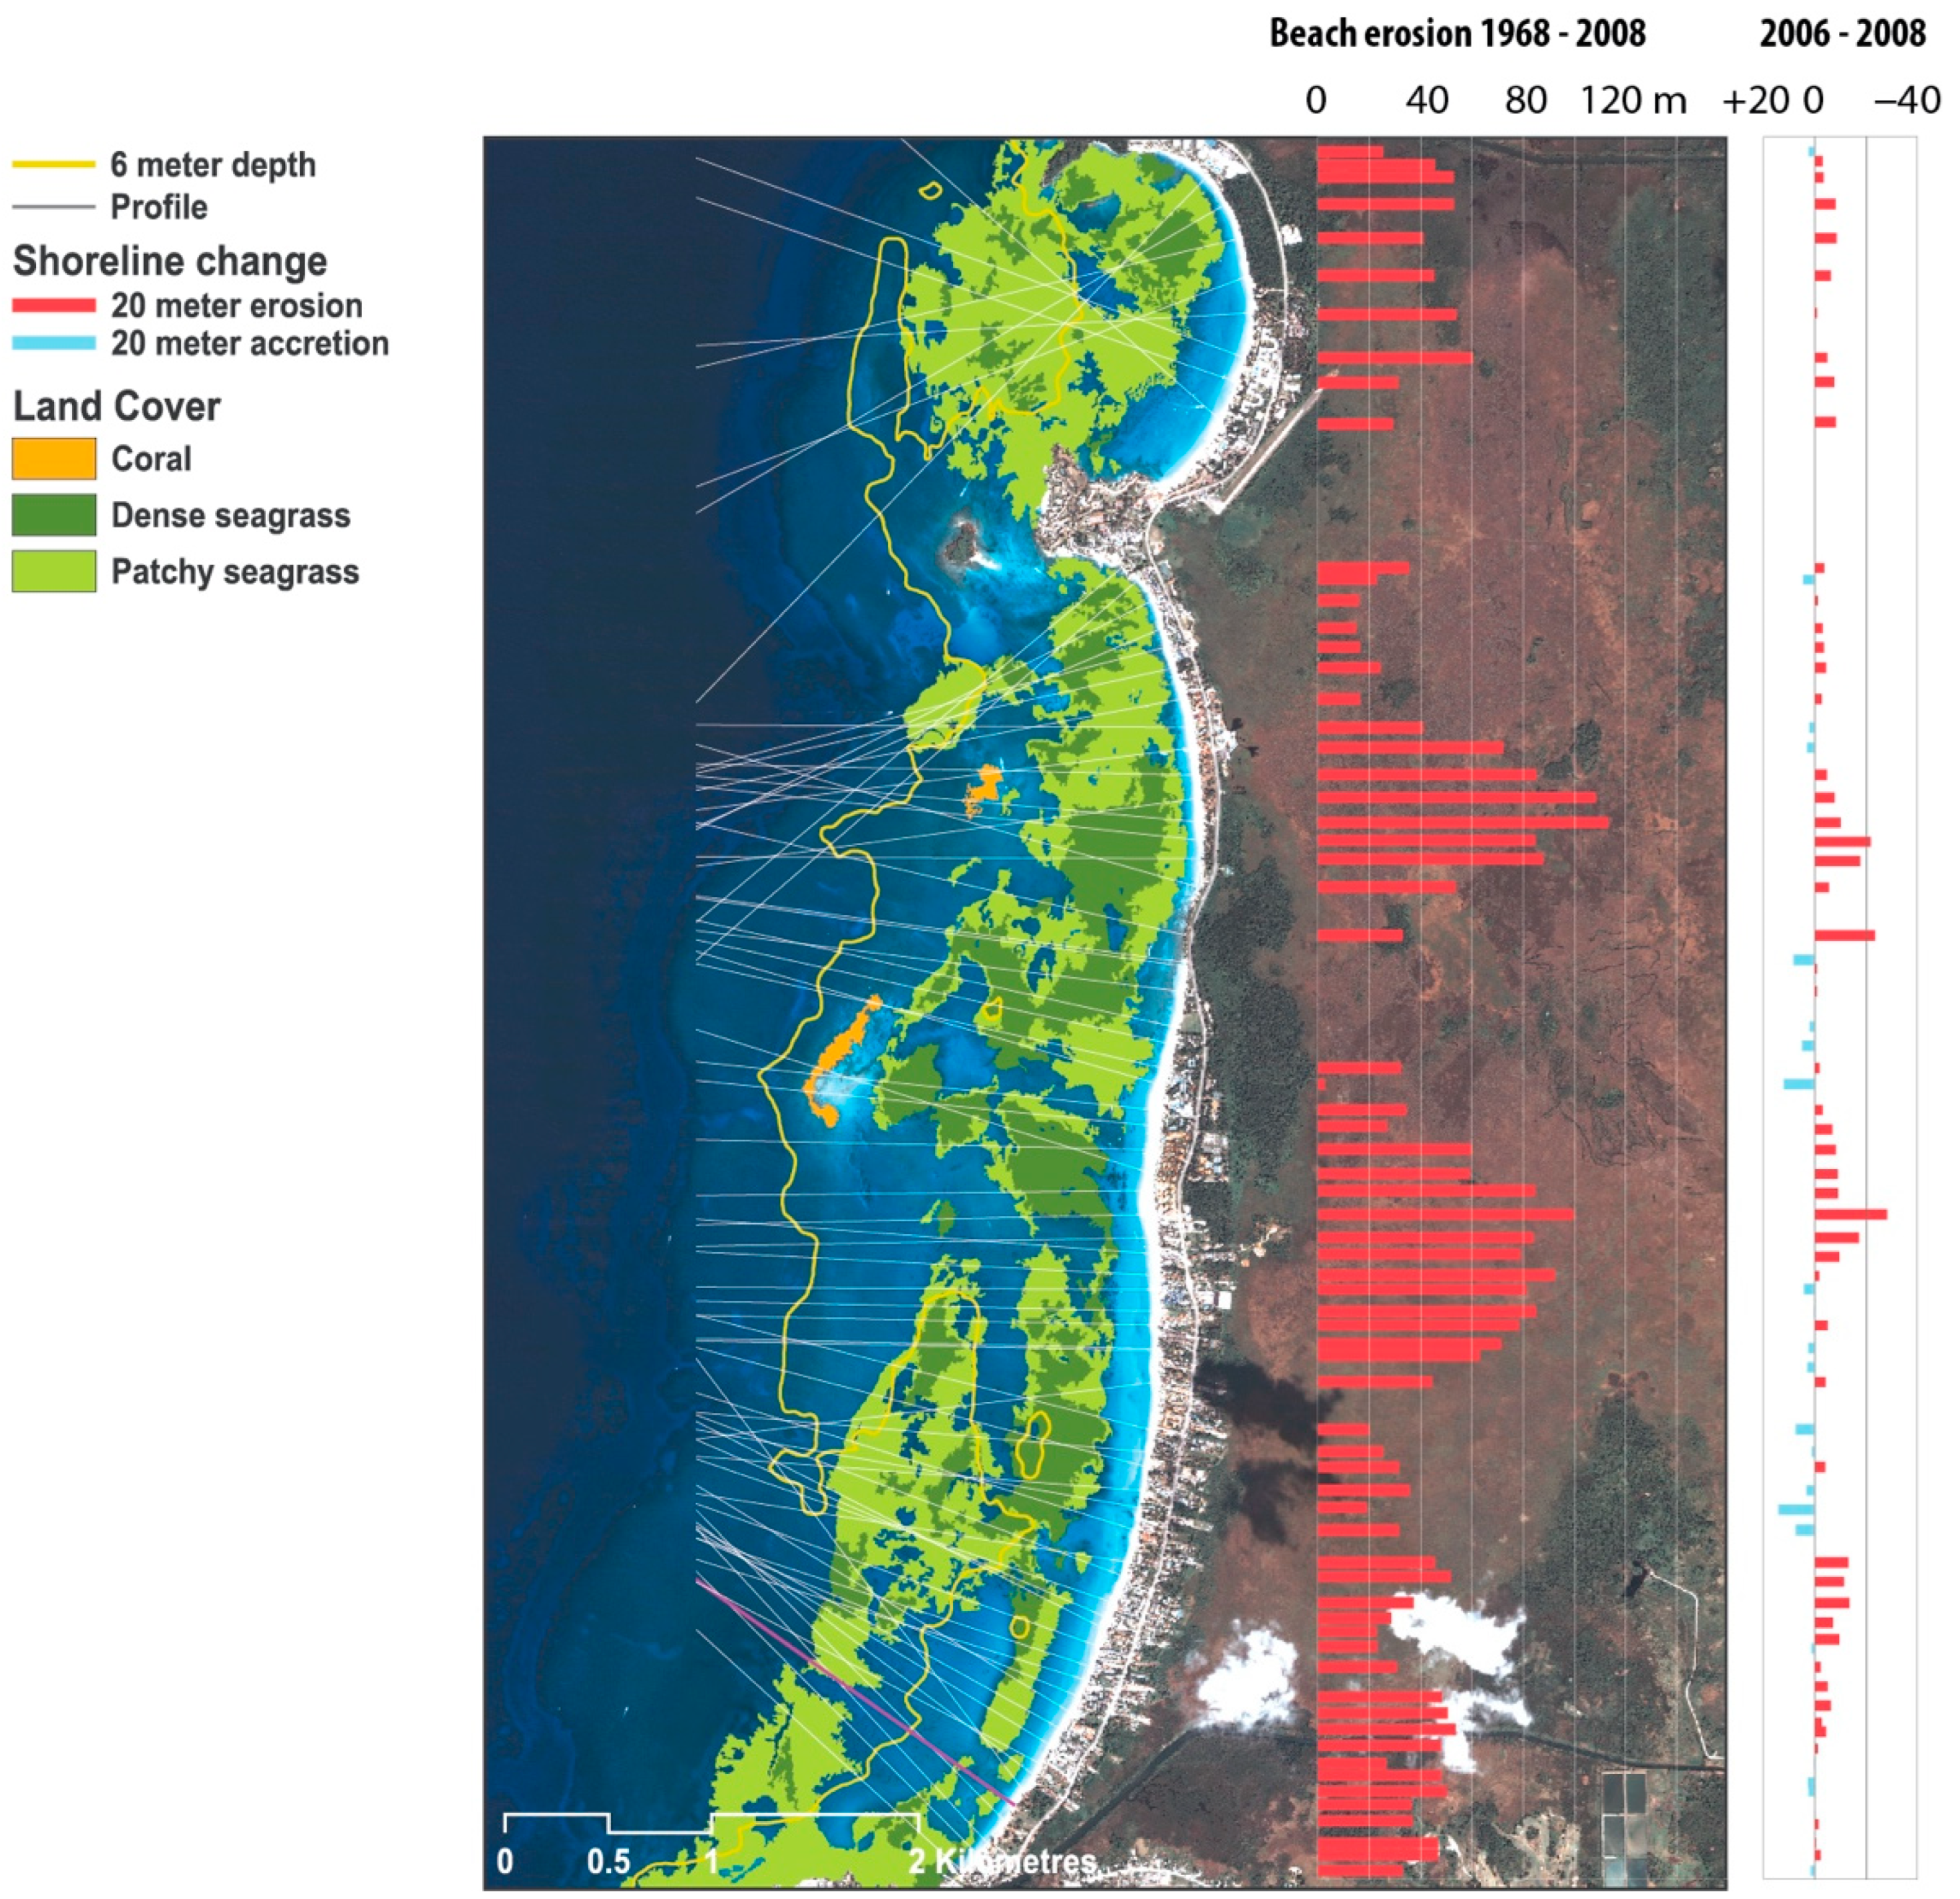
3.1. Seagrass and Coral Distribution and Beach Erosion Trends
3.2. Multiple Regression Analysis
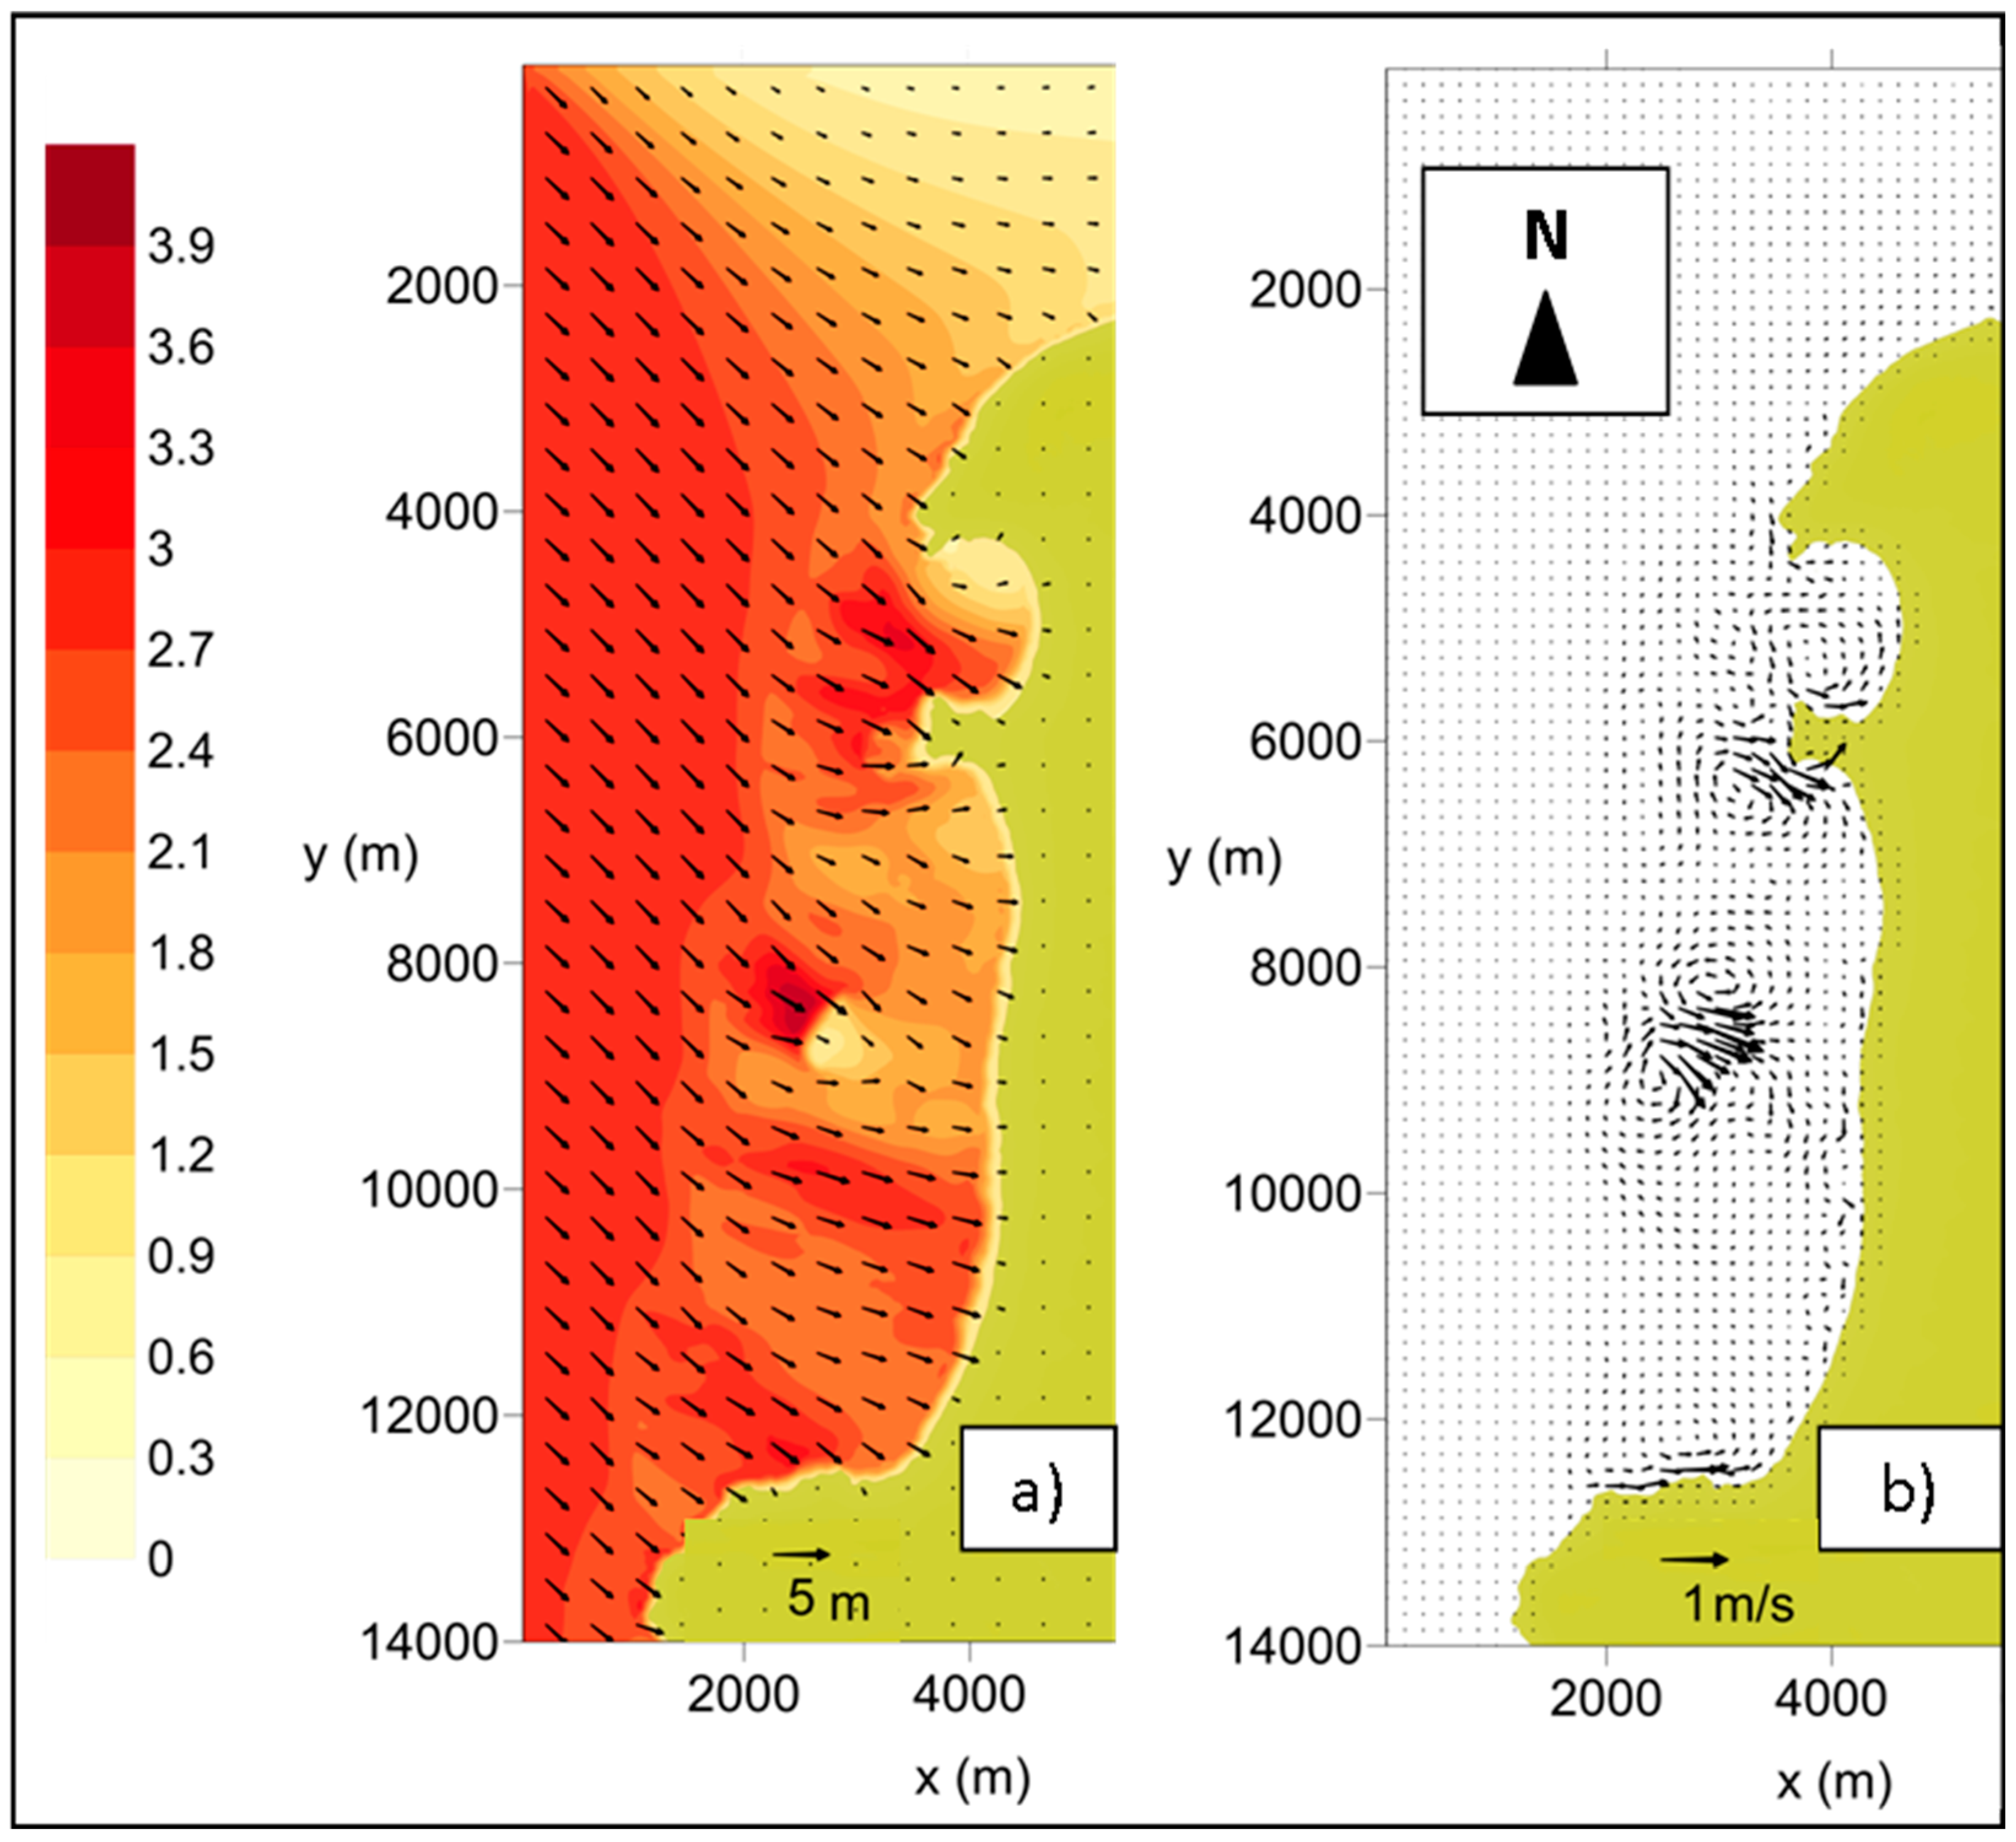
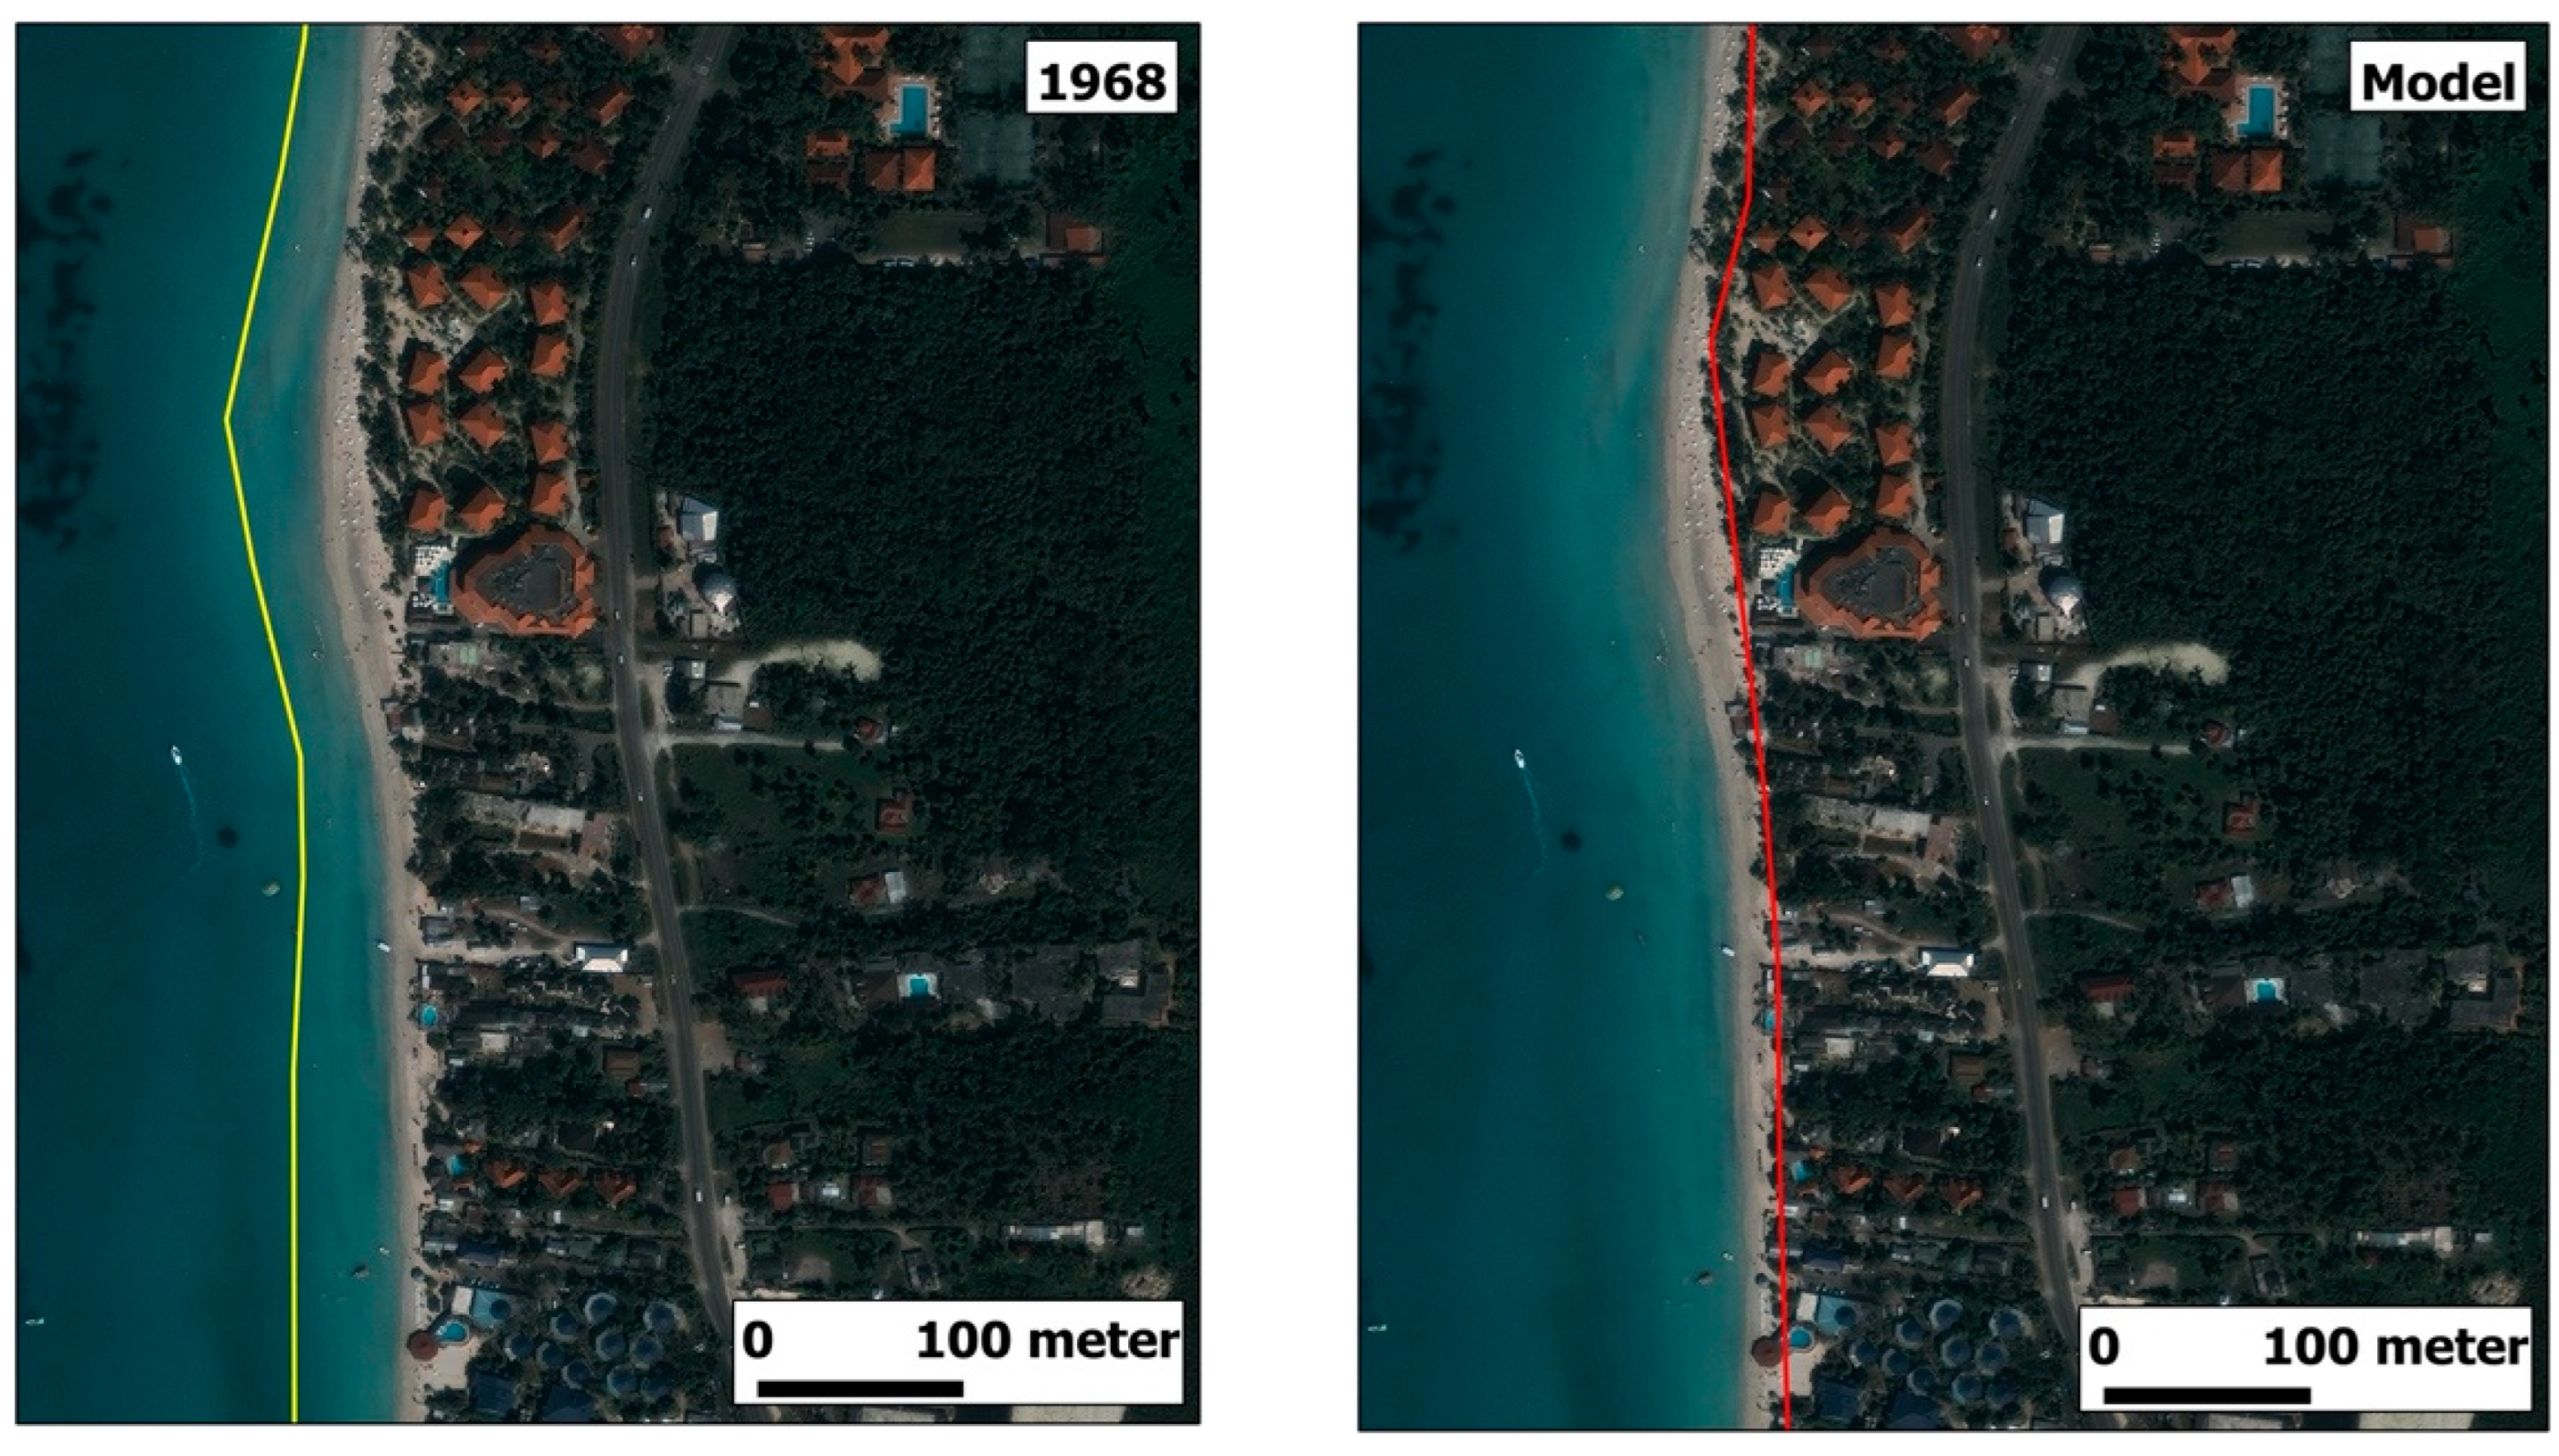
3.3. Wave Modelling
4. Results and Discussion
4.1. Distribution of Nearshore Ecosystems and Beach Erosion
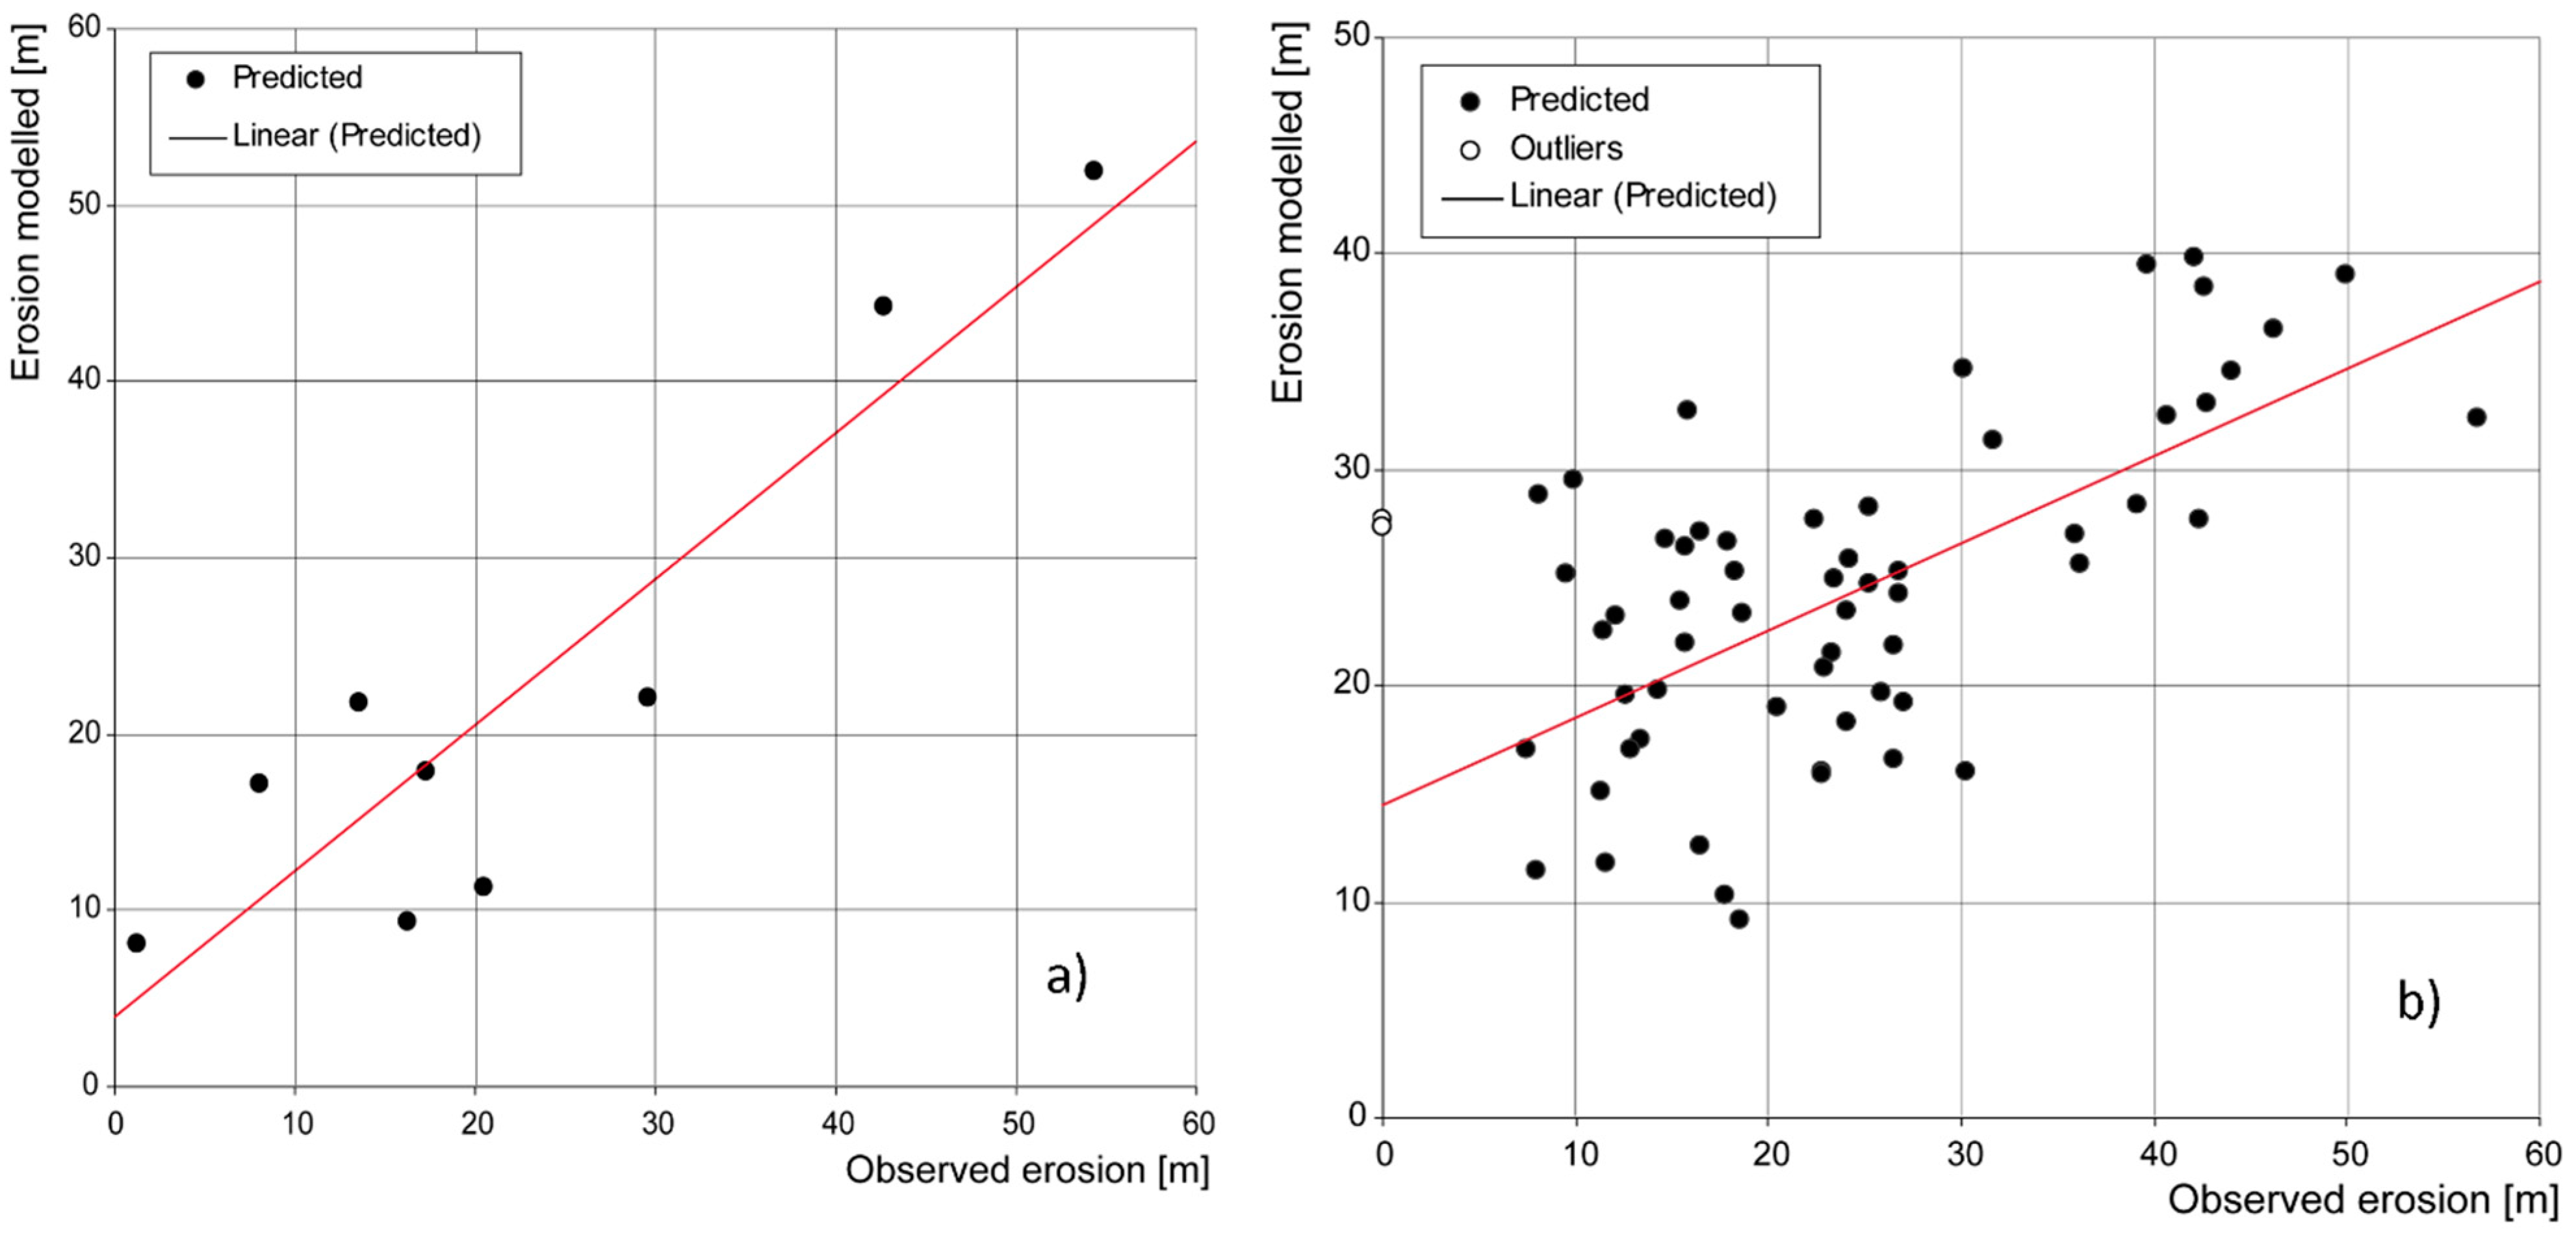
4.2. Multiple Regression Analysis
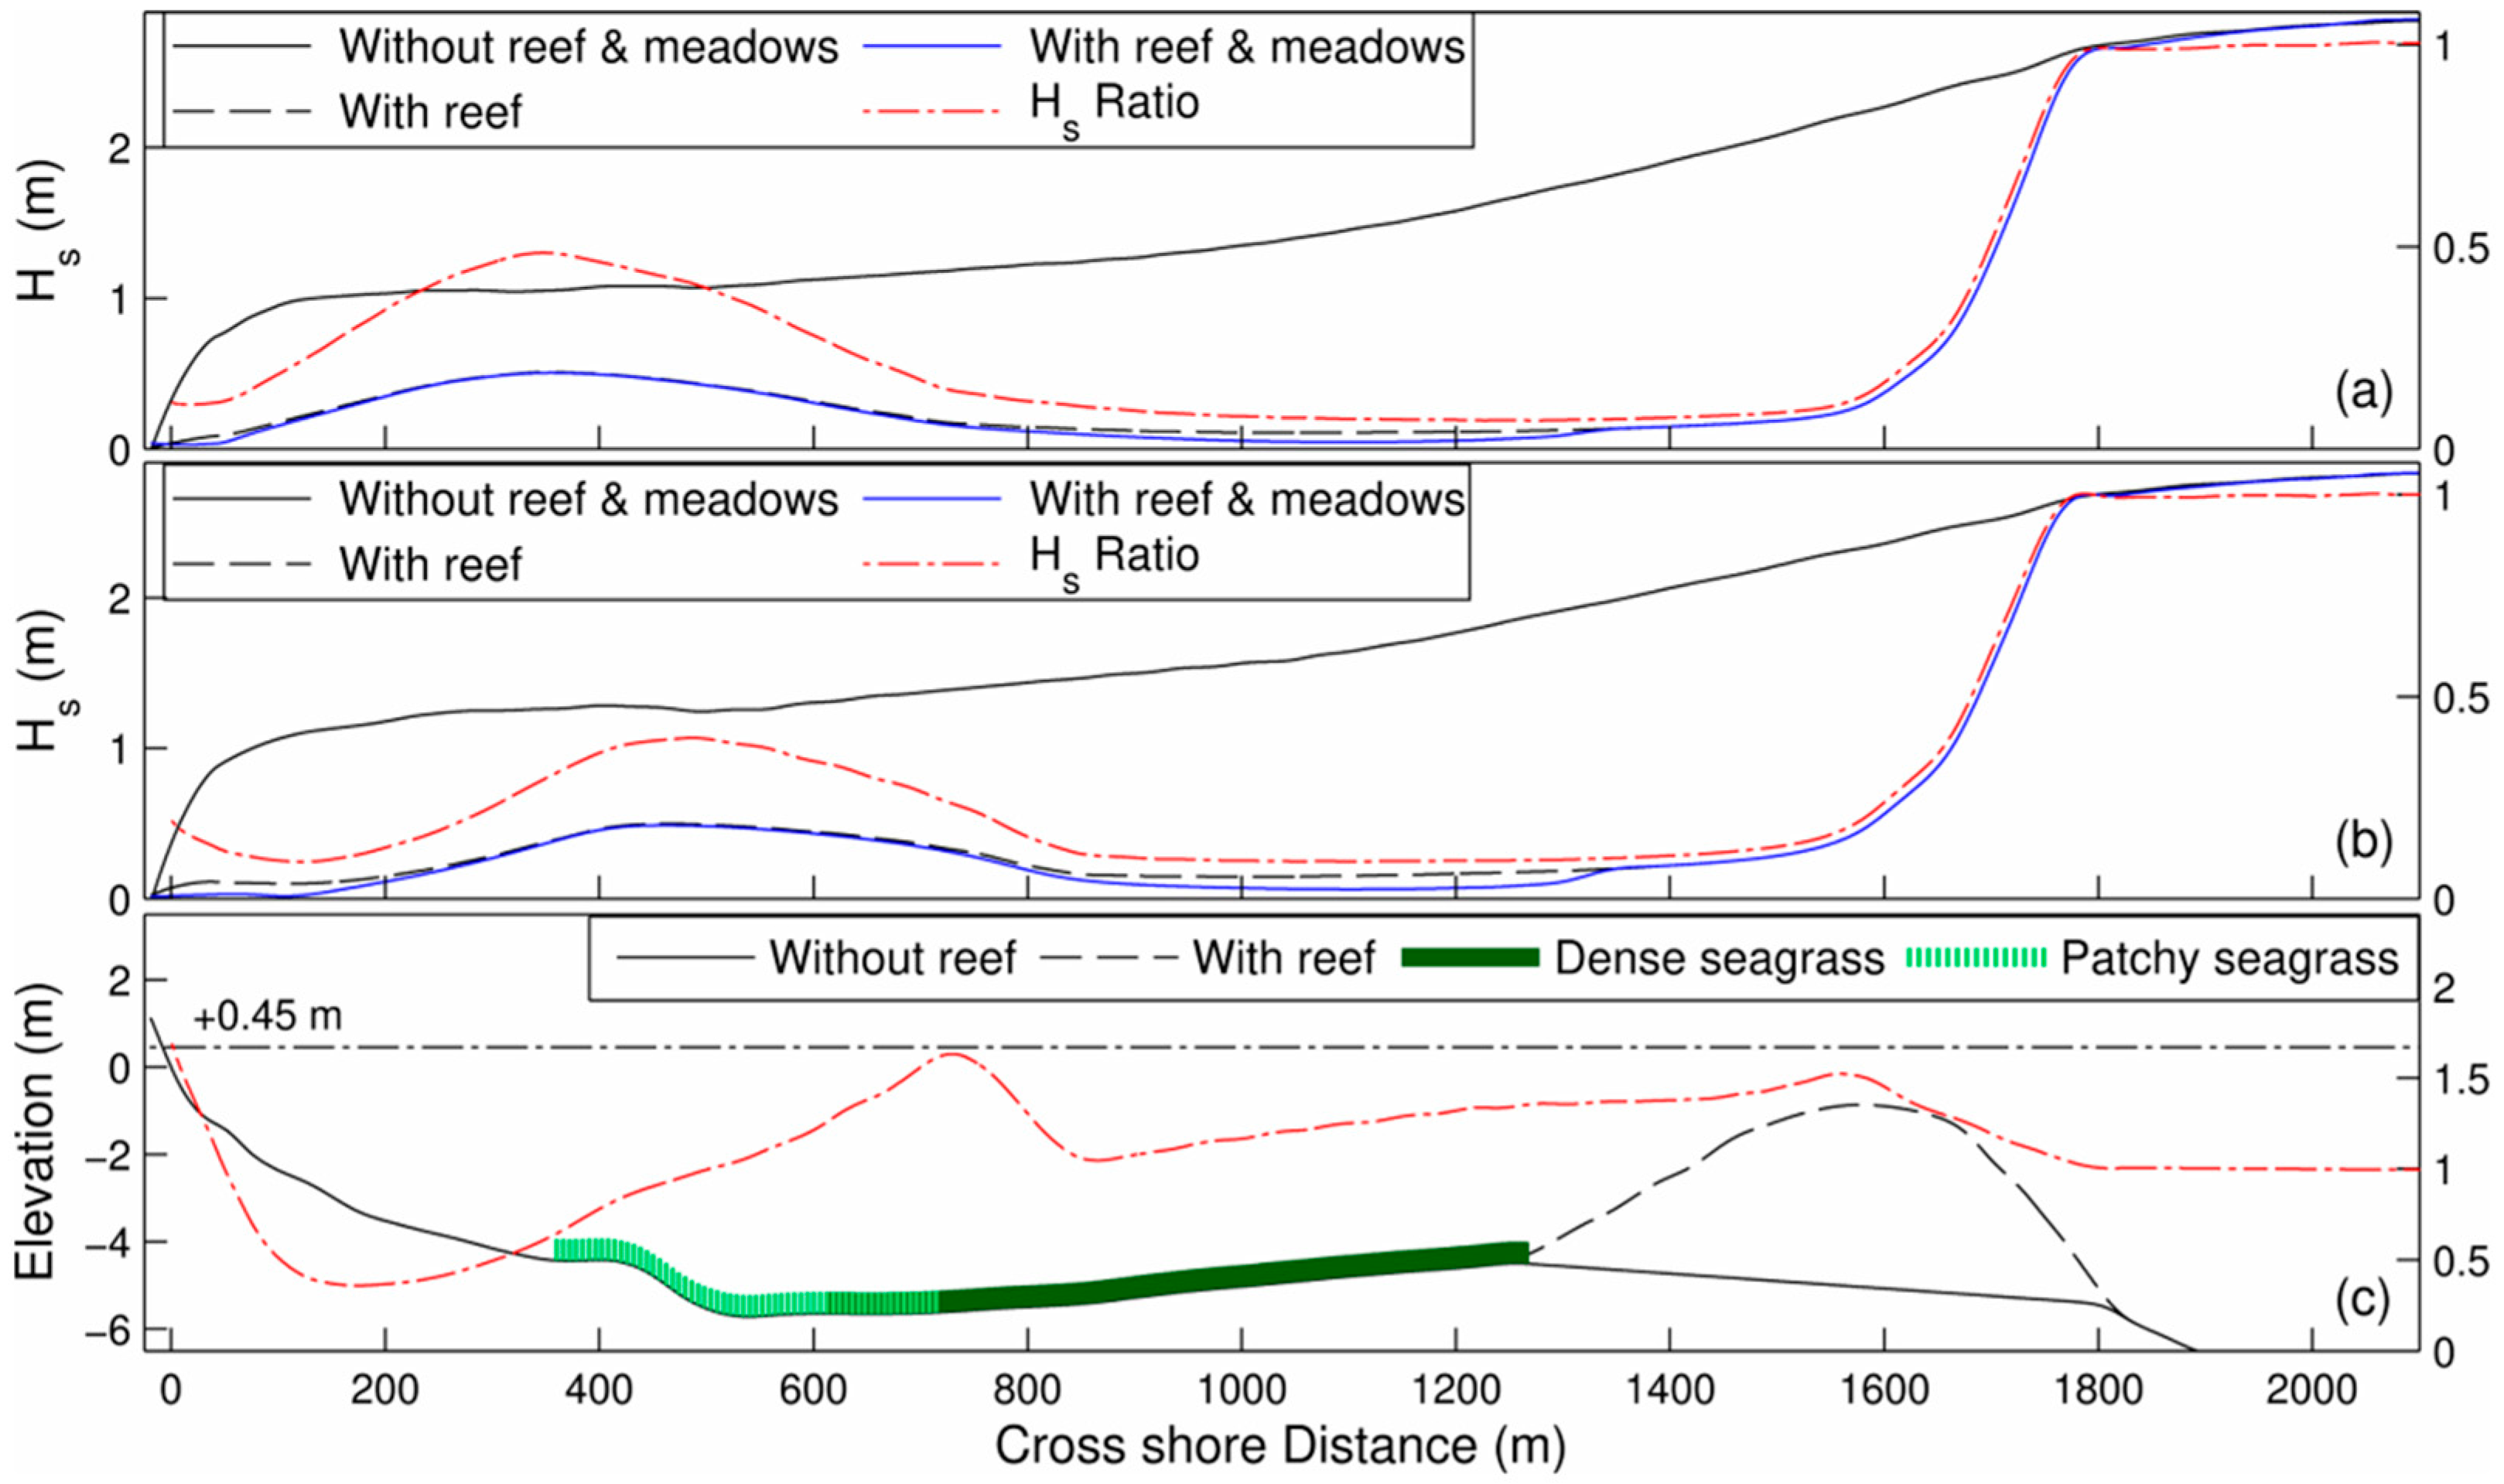
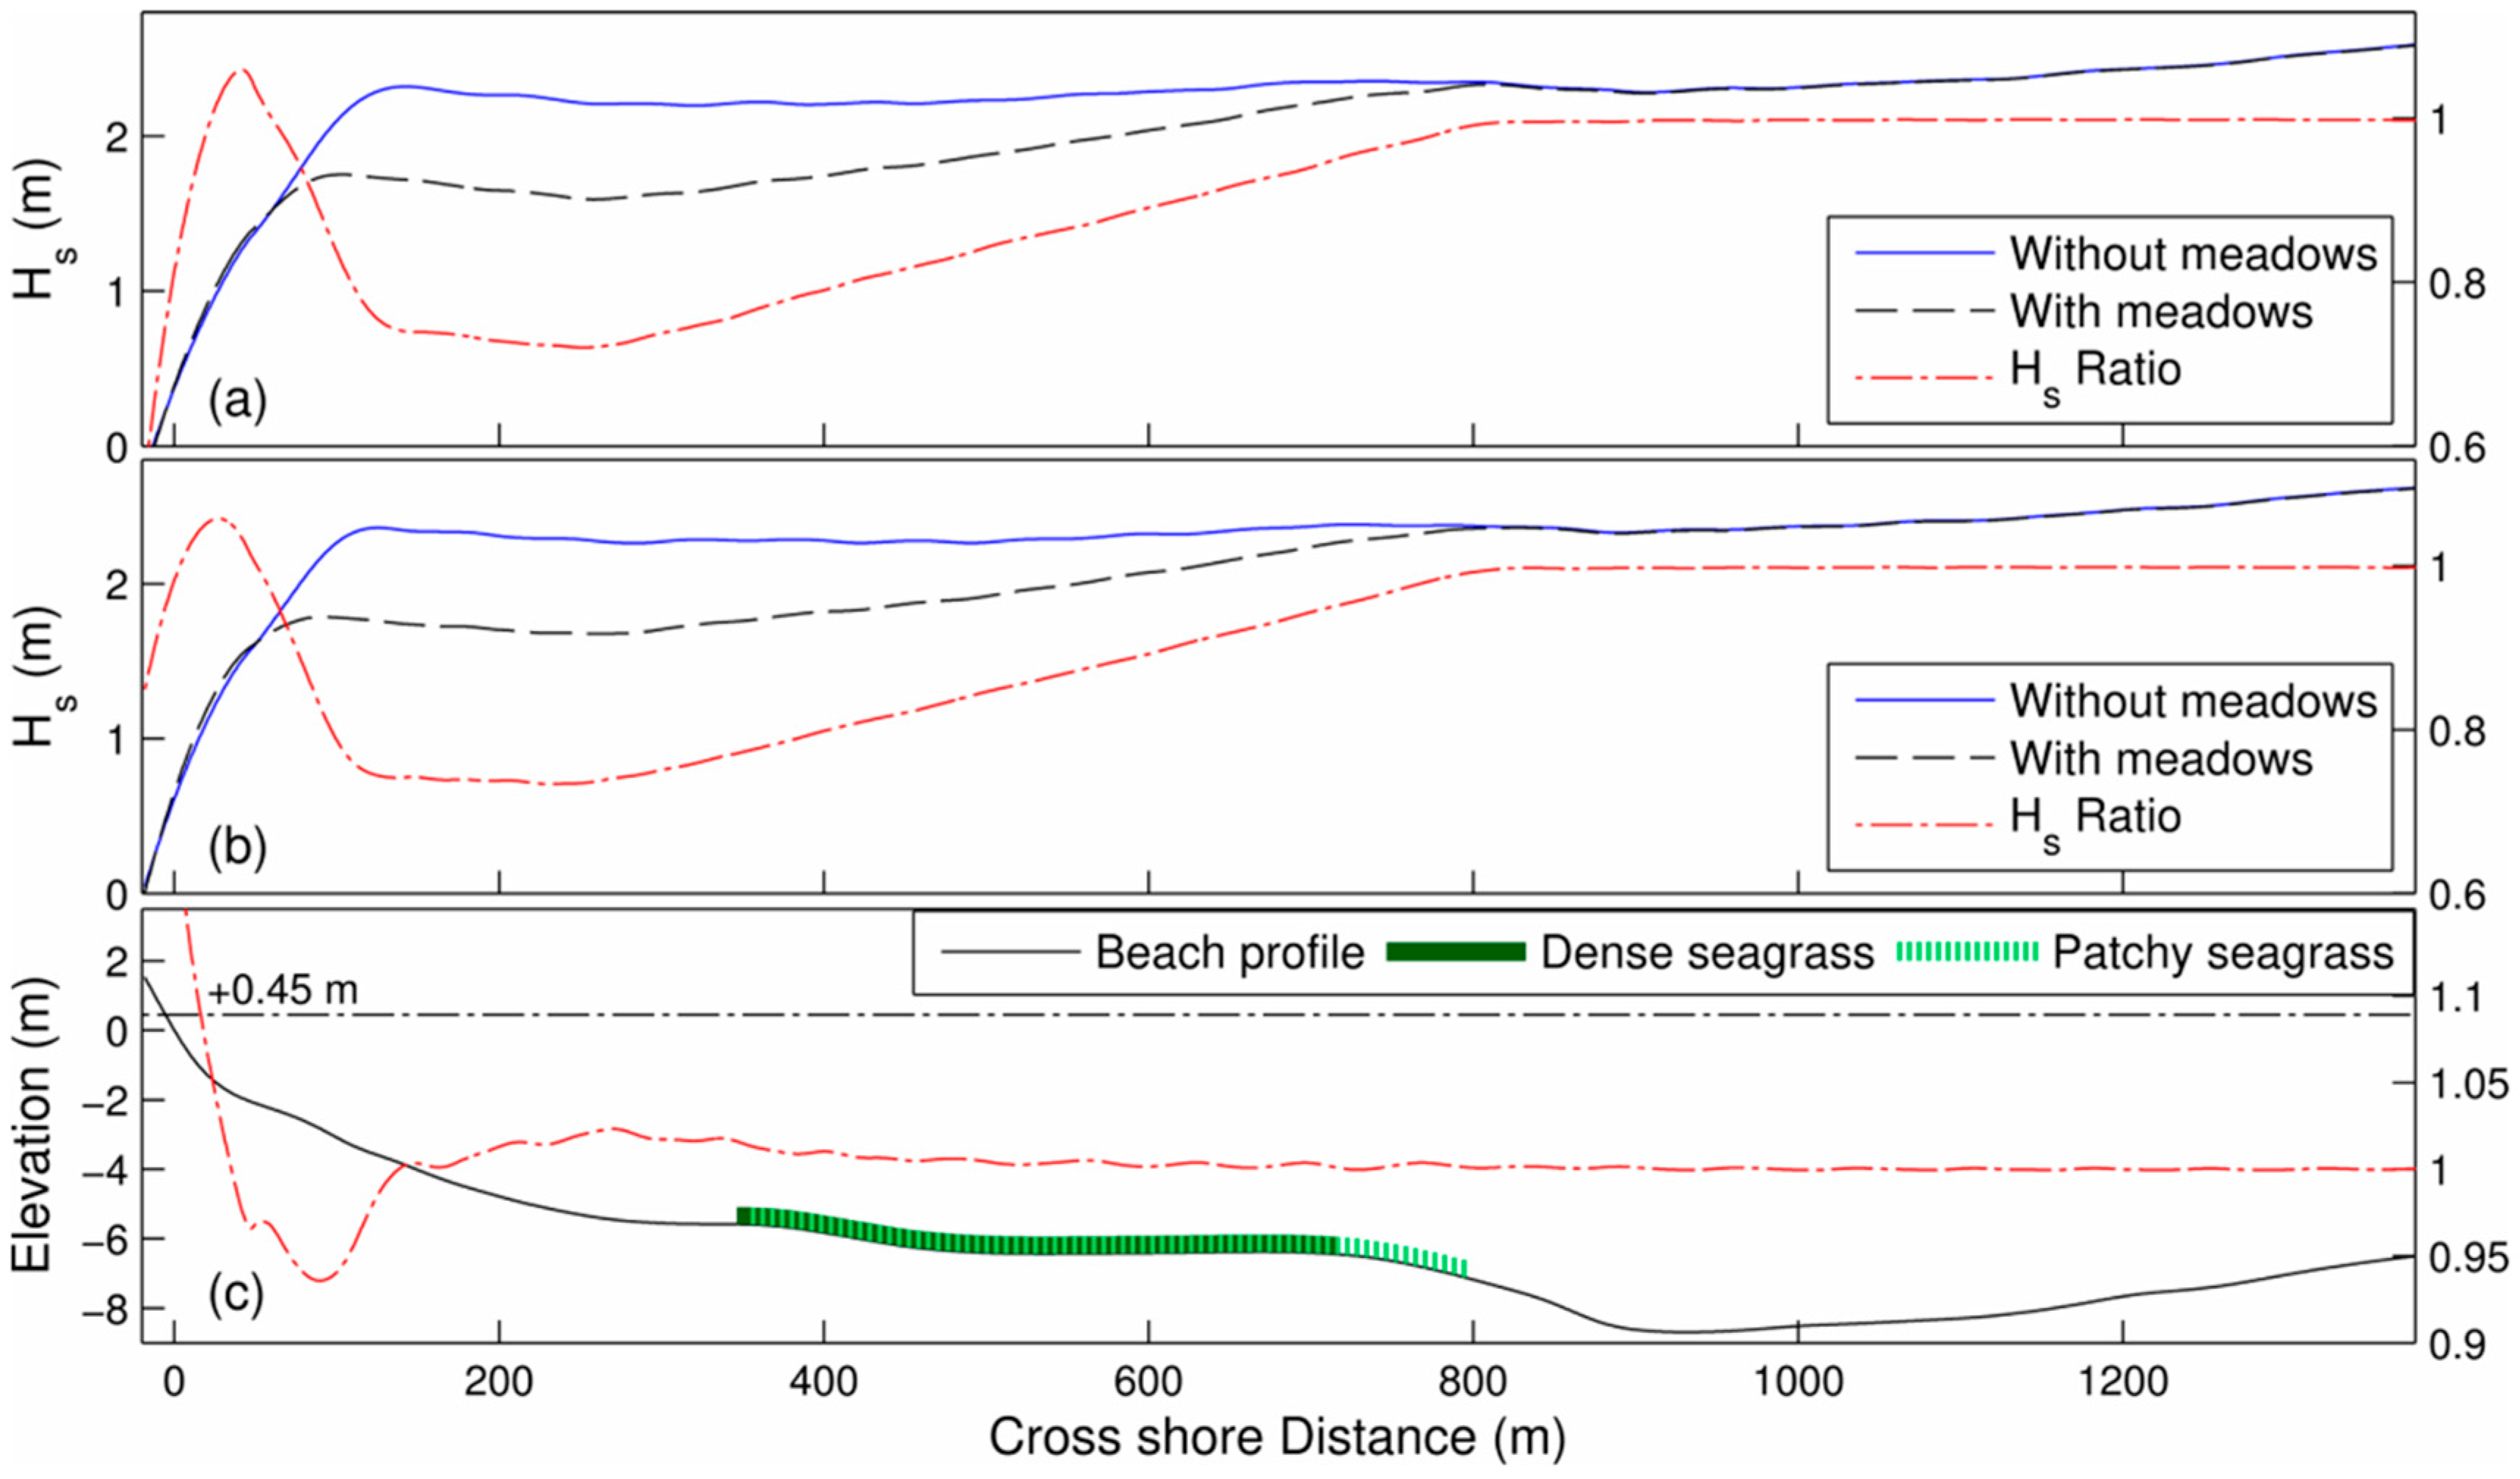
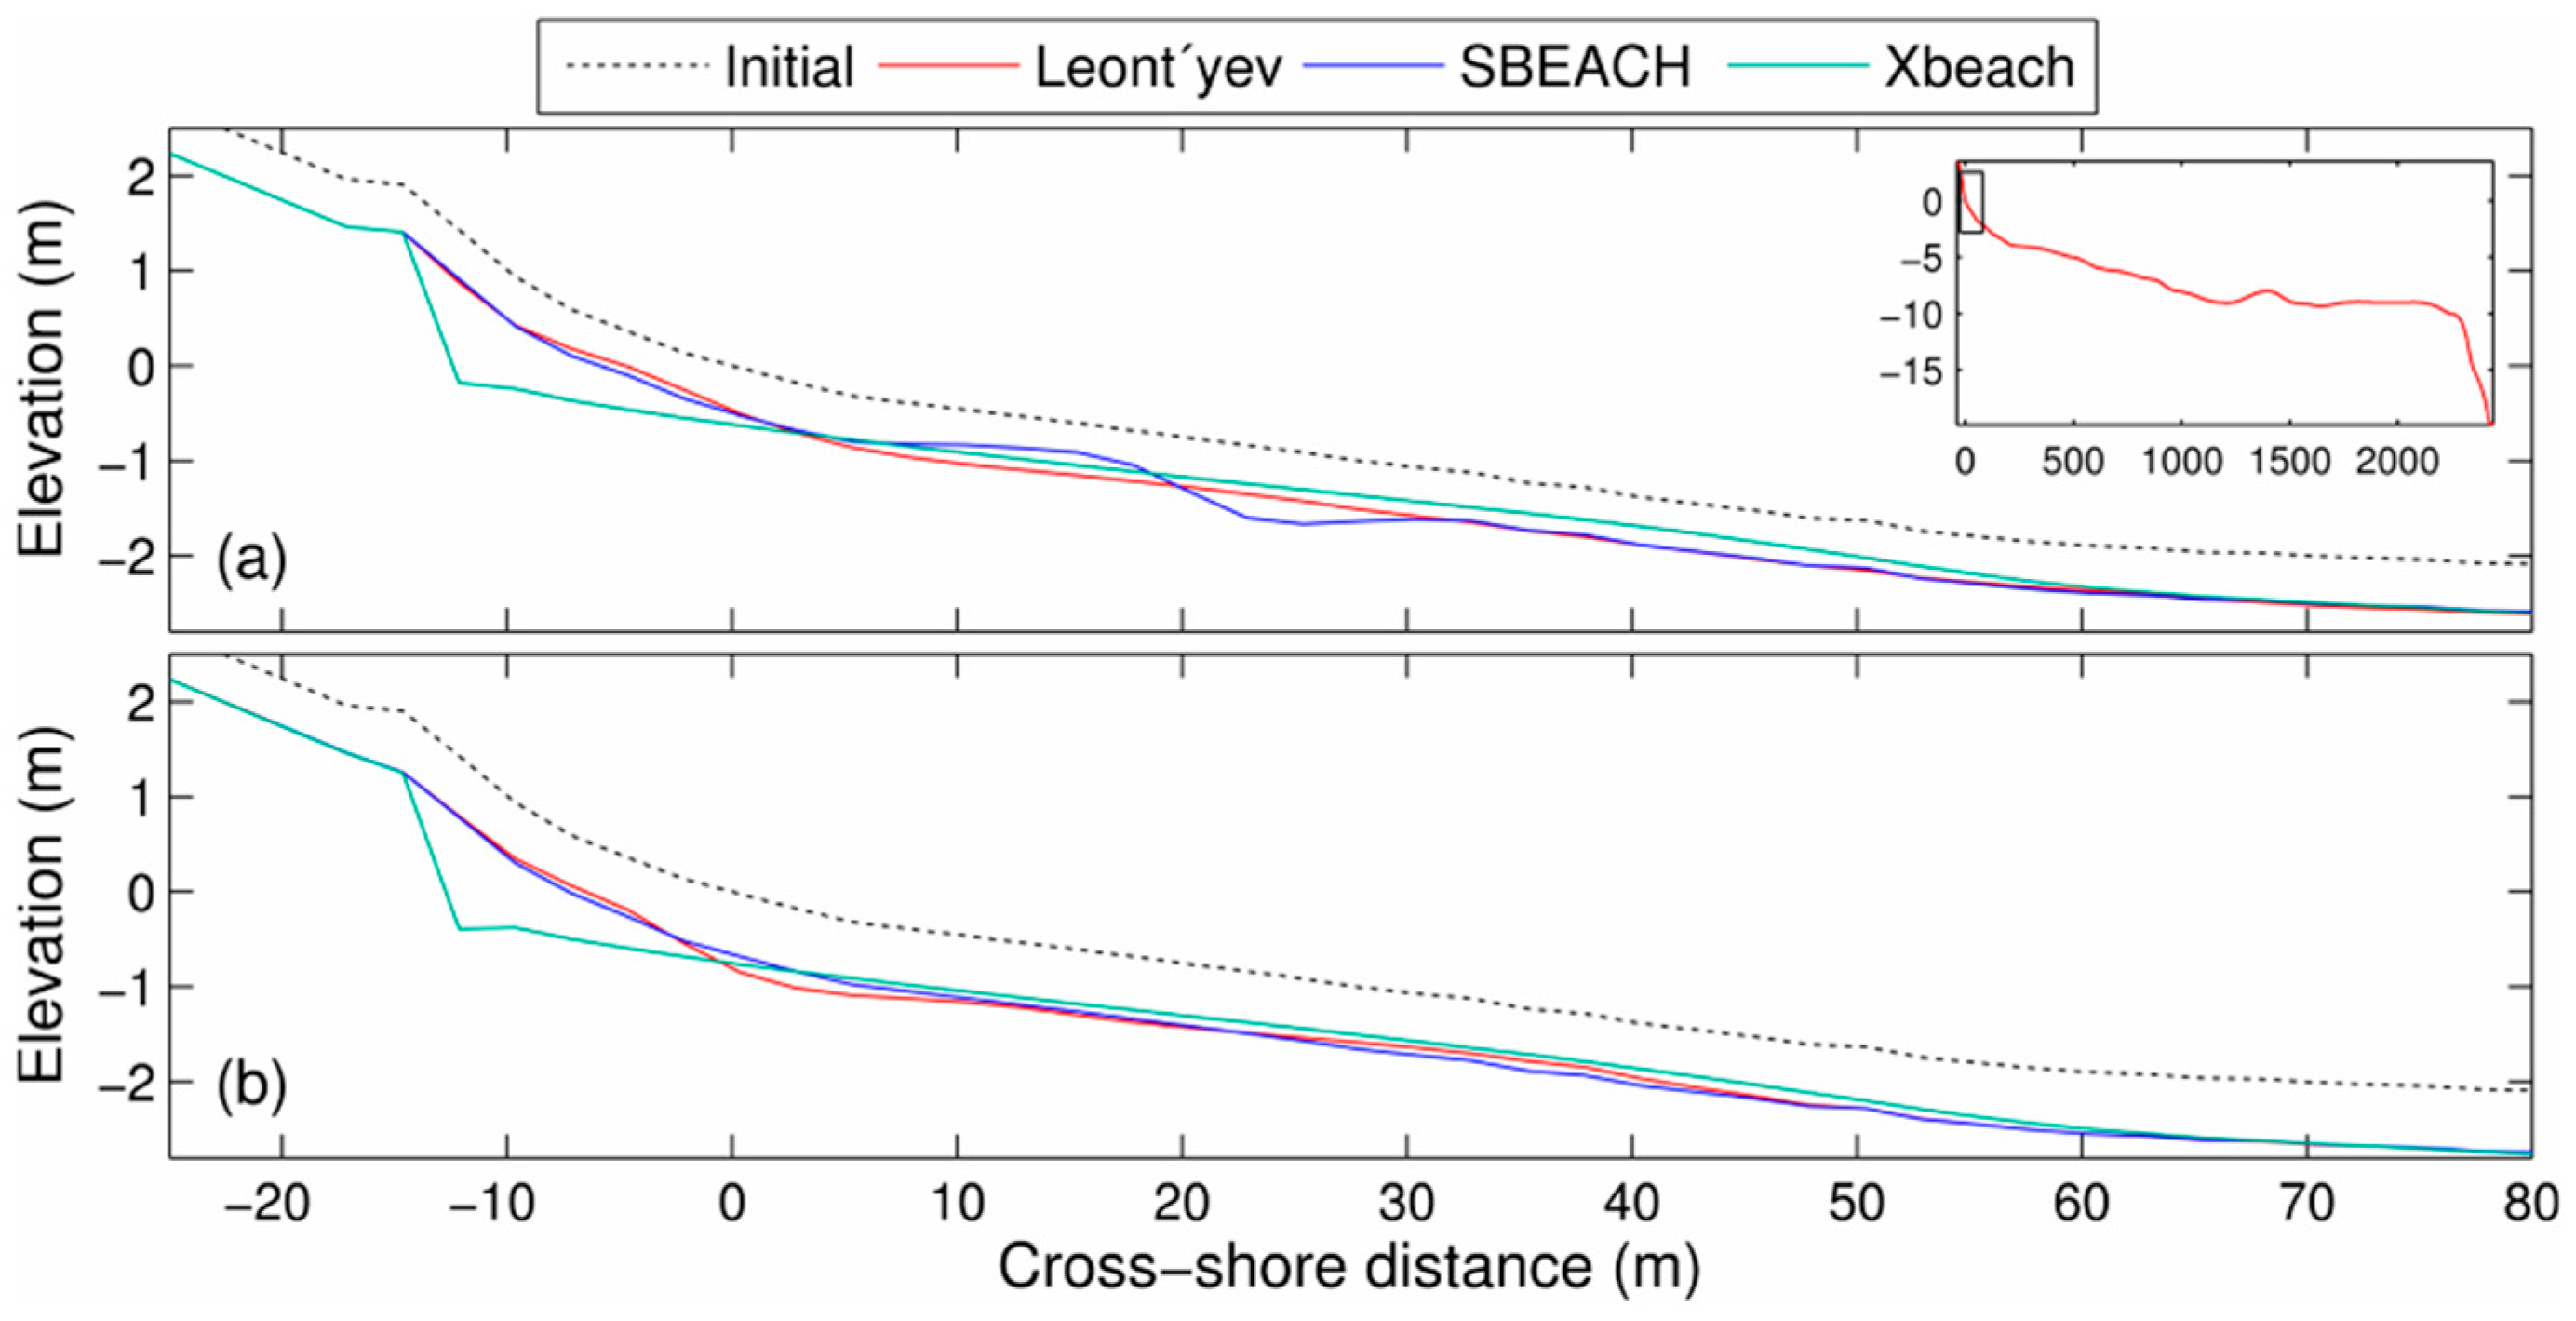
4.3. Wave Modelling
4.4. Discussion
5. Conclusions
- (a)
- the MSLR, which in itself cannot, however, explain the observed rates of erosion;
- (b)
- intensification or changes in the regional storm wave and surge regime, which may have increased offshore beach sediment losses and
- (c)
- reductions in the coastal ecosystem (shallow coral reef and seagrass meadows) areal coverage that has diminished both the natural beach protection and the (biogenic) sediment supply.
Author Contributions
Funding
Institutional Review Board Statement
Informed Consent Statement
Data Availability Statement
Acknowledgments
Conflicts of Interest
References
- Reid, W.V.; Mooney, H.A.; Cropper, A.; Capistrano, D.; Carpenter, S.R.; Chopra, K.; Dasgupta, P.; Dietz, T.; Duraiappah, K.; Hassan, R.; et al. Millenium Ecosystem Assessment. In Ecosystems and Human Well-Being: Synthesis; Island Press: Washington, DC, USA, 2005; 137p. [Google Scholar]
- Costanza, R.; De Groot, R.; Sutton, P.; van der Ploeg, S.; Anderson, S.J.; Kubiszewski, I.; Farber, S.; Turner, R.K. Changes in the global value of ecosystem services. Glob. Environ. Change 2014, 26, 152–158. [Google Scholar] [CrossRef]
- Chatenoux, B.; Peduzzi, P. Impacts from the 2004 Indian Ocean Tsunami: Analysing the potential protecting role of environmental features. Nat. Hazards 2007, 40, 289–304. [Google Scholar] [CrossRef]
- Beck, M.W.; Brumbaugh, R.D.; Airoldi, L.; Carranza, A.; Coen, L.D.; Crawford, C.; Defeo, O.; Edgar, G.J.; Hancock, B.; Kay, M.C.; et al. Oyster Reefs at Risk and Recommendations for Conservation, Restoration, and Management. BioScience 2011, 61, 107–116. [Google Scholar] [CrossRef] [Green Version]
- Duarte, C.M.; Losada, I.J.; Hendriks, I.E.; Mazarrasa, I.; Marbà, N. The role of coastal plant communities for climate change mitigation and adaptation. Nat. Clim. Change 2013, 3, 961–968. [Google Scholar] [CrossRef] [Green Version]
- Munang, R.; Thiaw, I.; Alverson, K.; Mumba, M.; Liu, J.; Rivington, M. Climate Change and Ecosystem-Based Adaptation: A New Pragmatic Approach to Buffering Climate Change Impacts. Curr. Opin. Environ. Sustain. 2013, 5, 67–71. [Google Scholar] [CrossRef]
- Wilkinson, C. Status of Coral Reefs of the World: 2008; Global Coral Reef Monitoring Network and Reef and Rainforest Research Centre: Townsille, Australia, 2008. [Google Scholar]
- Chen, P.-Y.; Chen, C.-C.; Chu, L.; McCarl, B. Evaluating the economic damage of climate change on global coral reefs. Glob. Environ. Change 2015, 30, 12–20. [Google Scholar] [CrossRef]
- Woodroffe, C.D.; Webster, J.M. Coral reefs and sea-level change. Mar. Geol. 2014, 352, 248–267. [Google Scholar] [CrossRef]
- Beetham, E.; Kench, P.S. Predicting wave overtopping thresholds on coral reef-island shorelines with future sea-level rise. Nat. Commun. 2018, 9, 3997. [Google Scholar] [CrossRef]
- Miller, M.W.; Piniak, G.A.; Williams, D.E. Coral mass bleaching and reef temperatures at Navassa Island, 2006. Estuar. Coast. Shelf Sci. 2011, 91, 42–50. [Google Scholar] [CrossRef]
- Williams, G.J.; Knapp, I.S.; Maragos, J.E.; Davy, S.K. Modeling Patterns of Coral Bleaching at a Remote Central Pacific Atoll. Mar. Pollut. Bull. 2010, 60, 1467–1476. [Google Scholar] [CrossRef]
- Harris, P.T.; Heap, A.D. Cyclone-induced net sediment transport pathway on the continental shelf of tropical Australia inferred from reef talus deposits. Cont. Shelf Res. 2009, 29, 2011–2019. [Google Scholar] [CrossRef]
- Woodroffe, C.D. Reef-Island Topography and the Vulnerability of Atolls to Sea-Level Rise. Glob. Planet. Change 2008, 62, 77–96. [Google Scholar] [CrossRef]
- Short, F.T.; Neckles, H.A. The Effects of Global Climate Change on Seagrasses. Aquat. Bot. 1999, 63, 169–196. [Google Scholar] [CrossRef]
- Cabaço, S.; Santos, R.; Duarte, C.M. The impact of sediment burial and erosion on seagrasses: A review. Estuar. Coast. Shelf Sci. 2008, 79, 354–366. [Google Scholar] [CrossRef]
- Daby, D. Effects of seagrass bed removal for tourism purposes in a Mauritian bay. Environ. Pollut. 2003, 125, 313–324. [Google Scholar] [CrossRef]
- Holon, F.; Boissery, P.; Guilbert, A.; Freschet, E.; Deter, J. The impact of 85 years of coastal development on shallow seagrass beds (Posidonia oceanica L. (Delile)) in South Eastern France: A slow but steady loss without recovery. Estuar. Coast. Shelf Sci. 2015, 165, 204–212. [Google Scholar] [CrossRef] [Green Version]
- Manent, P.; Bañolas, G.; Alberto, F.; Curbelo, L.; Espino, F.; Tuya, F. Long-term Seagrass Degradation: Integrating Landscape, Demographic, and Genetic Responses. Aquatic Conserv. Mar. Freshw. Ecosyst. 2020, 30, 1111–1120. [Google Scholar] [CrossRef]
- Luijendijk, A.; Hagenaars, G.; Ranasinghe, R.; Baart, F.; Donchyts, G.; Aarninkhof, S. The State of the World’s Beaches. Sci. Rep. 2018, 8, 6641. [Google Scholar] [CrossRef]
- Ackerman, R.A. The Nest Environment and the Embryonic Development of Sea Turtles. In The Biology of Sea Turtles; Lutz, P.L., Musick, J.A., Eds.; CRC Press: Boca Raton, FL, USA, 1996; pp. 83–106. [Google Scholar]
- Neumann, B.; Vafeidis, A.T.; Zimmerman, J.; Nicholls, R.J. Future Coastal Population Growth and Exposure to Sea-Level Rise and Coastal Flooding—A Global Assessment. PLoS ONE 2015, 10, e0118571. [Google Scholar] [CrossRef] [Green Version]
- Monioudi, I.N.; Karditsa, A.; Chatzipavlis, A.; Alexandrakis, G.; Andreadis, O.P.; Velegrakis, A.F.; Poulos, S.E.; Ghionis, G.; Petrakis, S.; Sifnioti, D.; et al. Assessment of the vulnerability of the eastern Cretan beaches (Greece) to sea level rise. Reg. Dev. Change 2016, 16, 1951–1962. [Google Scholar] [CrossRef]
- International Tourism Highlights, 2019th ed.; United Nations World Tourism Organisation: Madrid, Spain, 2019.
- An Assessment of the Economic Impact of Climate Change on the Transportation Sector in Barbados; Technical Report LC/CAR/L309; Economic Commission for Latin America and the Caribbean (ECLAC): Santiago, Chile, 2011; 44p.
- Tzoraki, O.; Monioudi, I.; Velegrakis, A.; Moutafis, N.; Pavlogeorgatos, G.; Kitsiou, D. Resilience of touristic island beaches under sea level rise: A methodological framework. Coast. Manag. 2018, 46, 78–102. [Google Scholar] [CrossRef]
- Toimil, A.; Díaz-Simal, P.; Losada, I.J.; Camus, P. Estimating the risk of loss of beach recreation value under climate change. Tourism. Manag. 2018, 68, 387–400. [Google Scholar] [CrossRef]
- Hinkel, J.; Nicholls, R.J.; Tol, R.S.J.; Wang, Z.B.; Hamilton, J.M.; Boot, G.; Vafeidis, A.T.; McFadden, L.; Ganopolski, A.; Klein, R.J.T. A global analysis of erosion of sandy beaches and sea-level rise: An application of DIVA. Glob. Planet. Change 2013, 111, 150–158. [Google Scholar] [CrossRef]
- Mentaschi, L.; Vousdoukas, M.; Pekel, J.-F.; Voukouvalas, E.; Feyen, L. Global long-term observations of coastal erosion and accretion. Sci. Rep. 2018, 8, 12876. [Google Scholar] [CrossRef] [Green Version]
- Nicholls, R.J.; Cazenave, A. Sea-Level Rise and Its Impact on Coastal Zones. Science 2010, 328, 1517–1520. [Google Scholar] [CrossRef]
- Smith, A.B.; Katz, R.W. U.S. Billion-dollar Weather and Climate Disasters: Data Sources, Trends, Accuracy and Biases. Nat. Hazards 2013, 67, 387–410. [Google Scholar] [CrossRef]
- Ranasinghe, R. Assessing climate change impacts on open sandy coasts: A review. Earth Sci. Rev. 2016, 160, 320–332. [Google Scholar] [CrossRef] [Green Version]
- Flor-Blanco, G.; Alcántara-Carrió, J.; Jackson, D.W.T.; Flor, G.; Flores-Soriano, C. Coastal erosion in NW Spain: Recent patterns under extreme storm wave events. Geomorphology 2021, 387, 107767. [Google Scholar] [CrossRef]
- Monioudi, I.; Velegrakis, A.; Chatzipavlis, A.; Rigos, A.; Karambas, T.V.; Vousdoukas, M.; Hasiotis, T.; Koukourouvli, N.; Peduzzi, P.; Manoutsoglou, E.; et al. Assessment of island beach erosion due to sea level rise: The case of the Aegean archipelago (Eastern Mediterranean). Nat. Hazards Earth Syst. Sci. 2017, 17, 449–466. [Google Scholar] [CrossRef] [Green Version]
- Peduzzi, P.; Velegrakis, A.F.; Estrella, M.; Chatenoux, B. Integrating the role of ecosystems in disaster risk and vulnerability assessments: Lessons from the Risk and Vulnerability Assessment Methodology Development Project (RiVAMP) in Negril Jamaica. In The Role of Ecosystems in Disaster Risk Reduction; Renaud, F.G., Ed.; United Nations University Press: Tokyo, Japan, 2013; pp. 109–139, ISBN-13: 978-9280812213. [Google Scholar]
- Romine, B.M.; Fletcher, C.H.; Neil Frazer, L.; Anderson, T.R. Beach erosion under rising sea-level modulated by coastal geomorphology and sediment availability on carbonate reef-fringed island coasts. Sedimentology 2016, 63, 1321–1332. [Google Scholar] [CrossRef]
- Asariotis, R. Climate change and adaptation for coastal transport infrastructure: A sustainable development challenge for SIDS in the Caribbean and beyond. In Coastal and Marine Environments. The Handbook of Natural Resources, 2nd ed.; Wang, Y., Ed.; CRC Press: Boca Raton, FL, USA, 2020; pp. 253–264. [Google Scholar]
- Vousdoukas, M.I.; Ranasinghe, R.; Mentaschi LPlomaritis, T.A.; Athanasiou, P.; Luijendijk, A.; Feyen, L. Sandy coastlines under threat of erosion. Nat. Clim. Change 2020, 10, 260–263. [Google Scholar] [CrossRef]
- McArthur, S. Why Carrying Capacity Should be a Last Resort. In Challenges in Tourism Research; Vir Singh, T., Ed.; Channel View Publications: Bristol, UK, 2015; pp. 288–302. [Google Scholar]
- Andreadis, O.; Chatzipavlis, A.; Hasiotis, T.; Monioudi, I.; Manoutsoglou, E.; Velegrakis, A. Assessment of and Adaptation to Beach Erosion in Islands: An Integrated Approach. J. Mar. Sci. Eng. 2021, 9, 859. [Google Scholar] [CrossRef]
- Knutson, T.R.; McBride, J.L.; Chan, J.; Emanuel, K.; Holland, G.; Landsea, C.; Held, I.; Kossin, J.P.; Srivastava, A.K.; Sugi, M. Tropical cyclones and climate change. Nat. Geosci. 2010, 3, 157–163. [Google Scholar] [CrossRef] [Green Version]
- Peduzzi, P.; Chatenoux, B.; Dao, H.; De Bono, A.; Herold, C.; Kossin, J.; Mouton, F.; Nordbeck, O. Global trends in tropical cyclone risk. Nat. Clim. Change 2012, 2, 289–294. [Google Scholar] [CrossRef]
- UNEP. Risk and Vulnerability Assessment Methodology Development Project (RiVAMP): Linking Ecosystems to Risk and Vulnerability Reduction; The Case of Jamaica, Results of the Pilot Assessment; United Nations Environment Programme: Geneva, Switzerland, 2010; 130p. [Google Scholar]
- Rhiney, K. The Negril tourism industry: Growth, challenges and future prospects. Caribb. J. Earth Sci. 2012, 43, 25–34. [Google Scholar]
- Travel & Tourism: Economic Impact 2016, Jamaica; World Travel and Tourism Council: London, UK, 2016; 30p.
- Hughes, T. Catastrophes, Phase Shifts, and Large-Scale Degradatgion of a Caribbean Coral Reef. Science 1994, 265, 1547–1551. [Google Scholar] [CrossRef] [Green Version]
- Bjork, S. Optimurn Utilization Study of the Negril and Black River Lower Morasses, Jamaica; Institute of Limnology: Kingston, Jamaica, 1984; 63p. [Google Scholar]
- Robinson, E.; Hendry, M. Coastal change and evolution at Negril, Jamaica: A geological perspective. Caribb. J. Earth Sci. 2012, 43, 3–9. [Google Scholar]
- Beach Restoration Works at Negril: Preliminary Engineering Report; Smith and Warner International: Kingston, Jamaica, 2007; 68p.
- Beach Sands Resource Assessment, Negril, Jamaica; University of the West Indies, Department of Geology and Geography: Kingston, Jamaica, 2002; 83p.
- Mondon, E.M.; Warner, P.S. Evaluation of a proposed solution to beach erosion at Negril. Caribb. J. Earth Sci. 2012, 43, 11–23. [Google Scholar]
- Edwards, P. Natural Resource Valuation Considerations for Negril Beach Stabilization Project; National Environment and Planning Agency (NEPA): Kingston, Jamaica, 2014; 39p. [Google Scholar]
- Barrett, L. Scrapped -Gov’t Pulls Plug On Controversial $1-Billion Negril Breakwater Project. The Gleaner. 2016. Available online: http://jamaica-gleaner.com/article/lead-stories/20160713/scrapped-govt-pulls-plug-controversial-1-billion-negrilbreakwater (accessed on 3 November 2020).
- Peduzzi, P. The Disaster Risk, Global Change, and Sustainability Nexus. Sustainability 2019, 11, 957. [Google Scholar] [CrossRef] [Green Version]
- McKenzie, A. Beach Responses to Hurricane Impacts: A Case Study of Long Bay Beach, Negril, Jamaica. Caribb. J. Earth Sci. 2012, 43, 51–58. [Google Scholar]
- Alexandris, N.; Chatenoux, B.; Lopez Torres, L.; Peduzzi, P. Monitoring the Restoration of Mangroves Ecosystems from Space; UNEP/GRID-Geneva: Geneva, Switzerland, 2014; 48p. [Google Scholar]
- Rigos, A.; Tsekouras, G.E.; Vousdoukas, M.I.; Chatzipavlis, A.; Velegrakis, A.F. A Chebyshev polynomial RBF neural network for automated shoreline extraction from coastal imagery. Integr. Comput. Aided Eng. 2016, 23, 141–160. [Google Scholar] [CrossRef] [Green Version]
- Schwarzer, S.; Allenbach, K.; Jaquet, J.-M. Cartographie semi-automatisée et multi-sources de la couverture du sol. 1. Périmètre de l’agglomération franco-valdo genevoise (CCSA04, moyenne résolution). Arch. Sci. 2009, 62, 107–124. [Google Scholar]
- Velegrakis, A.F.; Trygonis, V.; Chatzipavlis, A.E.; Karambas, T.; Vousdoukas, M.I.; Ghionis, G.; Monioudi, I.N.; Hasiotis, T.; Andreadis, O.; Psarros, F. Shoreline variability of an urban beach fronted by a beachrock reef from video imagery. Nat. Hazards 2016, 83, 201–222. [Google Scholar] [CrossRef]
- Peduzzi, P. Landslides and vegetation cover in the 2005 North Pakistan earthquake: A GIS and statistical quantitative approach. Nat. Hazards Earth Syst. Sci. 2010, 10, 623–640. [Google Scholar] [CrossRef]
- Iribarren, C.R.; Nogales, C. Protectoin Des Ports; PIANC: Lisbon, Portugal, 1949. [Google Scholar]
- Karambas, T.V.; Koutandos, E.; Kampanis, N. Numerical simulation of wave-induced morphology evolution. J. Marit. Eng. 2013, 166, 13–124. [Google Scholar] [CrossRef]
- Holthuijsen, L.H.; Herman, A.; Booij, N. Phase-decoupled refraction-diffraction for spectral wave models. Coast. Eng. 2003, 49, 291–305. [Google Scholar] [CrossRef]
- Booij, N.; Ris, R.C.; Holthuijsen, L.H. A third-generation wave model for coastal regions: 1. Model description and validation. J. Geophys. Res. 1999, 104, 7649. [Google Scholar] [CrossRef] [Green Version]
- Karambas, T.V.; Koutitas, C. Surf and swash zone morphology evolution induced by nonlinear waves. J. Waterw. Port Coast. Ocean. Eng. 2002, 128, 102–113. [Google Scholar] [CrossRef]
- Karambas, T.V. Modeling of sea-level rise effects on cross-shore coastal erosion. J. Mar. Environ. Eng. 2003, 7, 15–24. [Google Scholar]
- Karambas, T.; Koftis, T.; Prinos, P. Modeling of Nonlinear Wave Attenuation Due to Vegetation. J. Coast. Res. 2015, 32, 142. [Google Scholar] [CrossRef]
- Kushner, B.; Edwards, P.; Burke, L.; Cooper, E. Coastal Capital: Jamaica. Coral Reefs, Beach Erosion and Impacts to Tourism in Jamaica; Working Paper; World Resources Institute: Washington, DC, USA, 2011. [Google Scholar]
- Robinson, E.; Khan, S.; Coutou, R.; Johnson, M. Shoreline changes and sea-level rise at Long Bay, Negril, western Jamaica. Caribb. J. Earth Sci. 2012, 43, 35–49. [Google Scholar]
- Cambers, G. Caribbean Beach Changes and Climate Change Adaptation. Aquat. Ecosyst. Health Manag. 2009, 12, 168–176. [Google Scholar] [CrossRef]
- Rahmstorf, S. A Semi-Empirical Approach to Projecting Future Sea-Level Rise. Science 2007, 315, 368–370. [Google Scholar] [CrossRef] [PubMed] [Green Version]
- Bruun, P. The Bruun Rule of erosion by sea level rise: A discussion on large-scale two- and three-dimensional usages. J. Coast. Res. 1988, 4, 622–648. [Google Scholar]
- Edelman, T. Dune erosion during storm conditions. In Proceedings of the 13th International Conference on Coastal Engineering (ASCE), Vancouver, BC, Canada, 10–14 July 1972; pp. 1305–1312. [Google Scholar]
- Dean, R.G. Equilibrium beach profiles: Characteristics and applications. J. Coast. Res. 1991, 7, 53–84. [Google Scholar]
- Komar, P.D. Beach Processes and Sedimentation, 2nd ed.; Prentice Hall: Hoboken, NJ, USA, 1998. [Google Scholar]
- Nicholls, R.J.; Wong, P.P.; Burkett, V.R.; Codignotto, J.O.; Hay, J.E.; McLean, R.F.; Ragoonaden, S.; Woodroffe, C.D. Coastal Systems and Low-Lying Areas. In Climate Change 2007: Impacts, Adaptation and Vulnerability: Contribution of Working Group II to the Fourth Assessment Report of the Intergovernmental Panel on Climate Change; IPCC; Cambridge University Press: Cambridge, UK, 2007; Volume 4, pp. 315–356. ISBN 0-521-88010-6. [Google Scholar]
- Corbella, S.; Stretch, D.D. Predicting coastal erosion trends using non-stationary statistics and process-based models. Coast. Eng. 2012, 70, 40–49. [Google Scholar] [CrossRef]
- Duke, W.L.; Arnott, R.W.C.; Cheel, R.J. Shelf sandstones and hummocky cross-stratification: New insights on a stormy debate. Geology 1991, 19, 625. [Google Scholar] [CrossRef]
- Webster, P.J. Changes in Tropical Cyclone Number, Duration, and Intensity in a Warming Environment. Science 2005, 309, 1844–1846. [Google Scholar] [CrossRef] [Green Version]
- Pomeroy, A.; Lowe, R.; Symonds, G.; Van Dongeren, A.; Moore, C. The dynamics of infragravity wave transformation over a fringing reef. J. Geophys. Res. 2012, 117, 11022. [Google Scholar] [CrossRef] [Green Version]
- Storlazzi, C.; Elias, E.; Field, M.; Presto, M. Numerical modeling of the impact of sea-level rise on fringing coral reef hydrodynamics and sediment transport. Coral Reefs 2011, 30, 83–96. [Google Scholar] [CrossRef] [Green Version]
- Bradley, K.; Houser, C. Relative velocity of seagrass blades: Implications for wave attenuation in low-energy environments. J. Geophys. Res. 2009, 114, 1–13. [Google Scholar] [CrossRef]
- Paul, M.; Amos, C.L. Spatial and seasonal variation in wave attenuation over Zostera noltii. J. Geophys. Res. 2011, 116. [Google Scholar] [CrossRef]
- Paul, M. The protection of sandy shores—Can we afford to ignore the contribution of seagrass? Mar. Pollut. Bull. 2018, 134, 152–159. [Google Scholar] [CrossRef] [PubMed]
- Harley, M.D.; Turner, I.L.; Short, A.D. New insights into embayed beach rotation: The importance of wave exposure and cross-shore processes. J. Geophys. Res. 2015, 120, 1470–1484. [Google Scholar] [CrossRef] [Green Version]
- Larson, M.; Kraus, N. SBEACH: Numerical Model to Simulate Storm-Induced Beach Change; Technical Report CERC 89-9; US Army Corps of Engineers, Waterway Experiment Station: Vicksburg, MS, USA, 1989. [Google Scholar]
- Leont’yev, I.O. Numerical modelling of beach erosion during storm event. Coast. Eng. 1996, 29, 187–200. [Google Scholar] [CrossRef]
- Roelvink, D.; Reniers, A.; van Dongeren, A.; van Thiel de Vries, J.; Lescinski, J.; McCall, R. Xbeach Model Description and Manual; Unesco-IHE Institute for Water Education; Deltares; Delft University of Technology: Delft, The Netherlands, 2010; 106p. [Google Scholar]
- Abbott, T. Shifting Shorelines and Political Winds–The Complexities of Implementing the Simple Idea of Shoreline Setbacks for Oceanfront Developments in Maui, Hawaii. Ocean Coast Manag. 2013, 73, 13–21. [Google Scholar] [CrossRef]
- Rupp-Armstrong, S.; Nicholls, R.J. Coastal and Estuarine Retreat: A Comparison of the Application of Managed Realignment in England and Germany. J. Coast. Res. 2007, 236, 1418–1430. [Google Scholar] [CrossRef]
- Narayan, S.; Beck, M.W.; Reguero, B.G.; Losada, I.J.; van Wesenbeeck, B.; Pontee, N.; Sanchirico, J.N.; Ingram, J.C.; Lange, J.-M.; Burks-Copes, K.A. The Effectiveness, Costs and Coastal Protection Benefits of Natural and Nature-Based Defences. PLoS ONE 2016, 11, e0154735. [Google Scholar] [CrossRef] [Green Version]
- Bergillos, R.J.; Rodrıguez-Delgado, C.; Ortega-Sanchez, M. Advances in management tools for modeling artificial nourishments in mixed Beaches. J. Mar. Syst. 2017, 172, 1–13. [Google Scholar] [CrossRef]
- Peduzzi, P. Sand, rarer than one thinks. Environ. Dev. 2014, 11, 208–218. [Google Scholar] [CrossRef]
- Arkema, K.K.; Guannel, G.; Verutes, G.; Wood, S.A.; Guerry, A.; Ruckelshaus, M.; Kareiva, P.; Lacayo, M.; Silver, J.M. Coastal habitats shield people and property from sea-level rise and storms. Nat. Clim. Change 2013, 3, 913–918. [Google Scholar] [CrossRef]
- Spalding, M.D.; Ruffo, S.; Lacambra, C.; Meliane, I.; Hale, L.Z.; Shepard, C.C.; Beck, M.W. The role of ecosystems in coastal protection: Adapting to climate change and coastal hazards. Ocean Coast. Manag. 2014, 90, 50–57. [Google Scholar] [CrossRef]


| Data | Notes |
|---|---|
| Quickbird satellite image | 0.6 m resolution, four bands (blue, green, red and near infra-red), Acquisition date: 16 January 2008 |
| Digital Elevation Model | 6 m resolution |
| Offshore bathymetry | 2 m resolution, original data from SWI (2007) |
| Shorelines 1968, 1980, 1991, 2003 and 2006 | Collation of previous information based on aerial photos or field measurements (SWI, 2007; UNEP, 2010) |
| 74 beach profiles (November 2006) | Profiles of the ‘dry’ and ‘wet’ beach (to water depths of 1–1.5 m) perpendicular to the shoreline (SWI, 2007) |
| Data Analysed | Derived Variables | Type of Variables |
|---|---|---|
| Beach erosion 1968–2008 | Length [m] | Beach retreat or accretion (1968–2008 and 2006–2008) |
| Field topographic profiles (2006) | Beach profile | Iribarren number (ξ = β/(Ho/Lo)1/2, where β the beach slope and Ho and Lo the offshore wave heights and lengths, respectively) |
| Bathymetry | Wave run-up | Wave run-up |
| Morphology | Distance [m] | Distance from the shoreline computed for several depths (4, 5, 6, 7, 8, 9, 10, 12, 15, 20 m) |
| Morphology | Depth [m] | Depths computed for fixed distances from the shoreline (500, 1000, 1500, 2000, 2500 and 3000 m) |
| Seagrass meadows | Width [m] | Cross-shore widths of dense, patchy and total seagrass meadows (patchy + dense) |
| Seagrass meadows | Distance [m] | Minimum distance from shoreline to dense, patchy and total seagrass |
| Coral reef | Width [m] | Cross-shore widths of shallow and deep coral reefs |
| Coral reef | Distance [m] | Minimum distance from shoreline to shallow and deep reefs |
| Variables | Beta | % Expl. | B | p-Level |
|---|---|---|---|---|
| Intercept | 77.85 | 0.00051 | ||
| SwRfW | −0.91 | 66.9 | −0.47 | 0.00238 |
| Dpt1000 | −0.64 | 33.1 | −7.95 | 0.01248 |
| N = 59 | Beta | %Expl | Std. Error | B | Std. Error | t(55) | p-Level |
|---|---|---|---|---|---|---|---|
| Intercept | 32.89 | 6.40 | 5.14 | 0.00000 | |||
| TotSgW | −0.58 | 47.3 | 0.11 | −0.02 | 0.00 | −5.21 | 0.00000 |
| Depth6 | 0.39 | 32.0 | 0.11 | 0.01 | 0.00 | 3.42 | 0.00119 |
| Irbn10y | −0.25 | 20.7 | 0.11 | −21.54 | 9.46 | −2.28 | 0.02666 |
Publisher’s Note: MDPI stays neutral with regard to jurisdictional claims in published maps and institutional affiliations. |
© 2022 by the authors. Licensee MDPI, Basel, Switzerland. This article is an open access article distributed under the terms and conditions of the Creative Commons Attribution (CC BY) license (https://creativecommons.org/licenses/by/4.0/).
Share and Cite
Peduzzi, P.; Velegrakis, A.; Chatenoux, B.; Estrella, M.; Karambas, T. Assessment of the Role of Nearshore Marine Ecosystems to Mitigate Beach Erosion: The Case of Negril (Jamaica). Environments 2022, 9, 62. https://doi.org/10.3390/environments9050062
Peduzzi P, Velegrakis A, Chatenoux B, Estrella M, Karambas T. Assessment of the Role of Nearshore Marine Ecosystems to Mitigate Beach Erosion: The Case of Negril (Jamaica). Environments. 2022; 9(5):62. https://doi.org/10.3390/environments9050062
Chicago/Turabian StylePeduzzi, Pascal, Adonis Velegrakis, Bruno Chatenoux, Marisol Estrella, and Theofanis Karambas. 2022. "Assessment of the Role of Nearshore Marine Ecosystems to Mitigate Beach Erosion: The Case of Negril (Jamaica)" Environments 9, no. 5: 62. https://doi.org/10.3390/environments9050062
APA StylePeduzzi, P., Velegrakis, A., Chatenoux, B., Estrella, M., & Karambas, T. (2022). Assessment of the Role of Nearshore Marine Ecosystems to Mitigate Beach Erosion: The Case of Negril (Jamaica). Environments, 9(5), 62. https://doi.org/10.3390/environments9050062