
Quantifying Spatial and Temporal Trends of Microplastic Pollution in Surface Water and in the Eastern Oyster Crassostrea virginica for a Dynamic Florida Estuary

 ,
,  ,
, 
Abstract
1. Introduction
2. Methodology
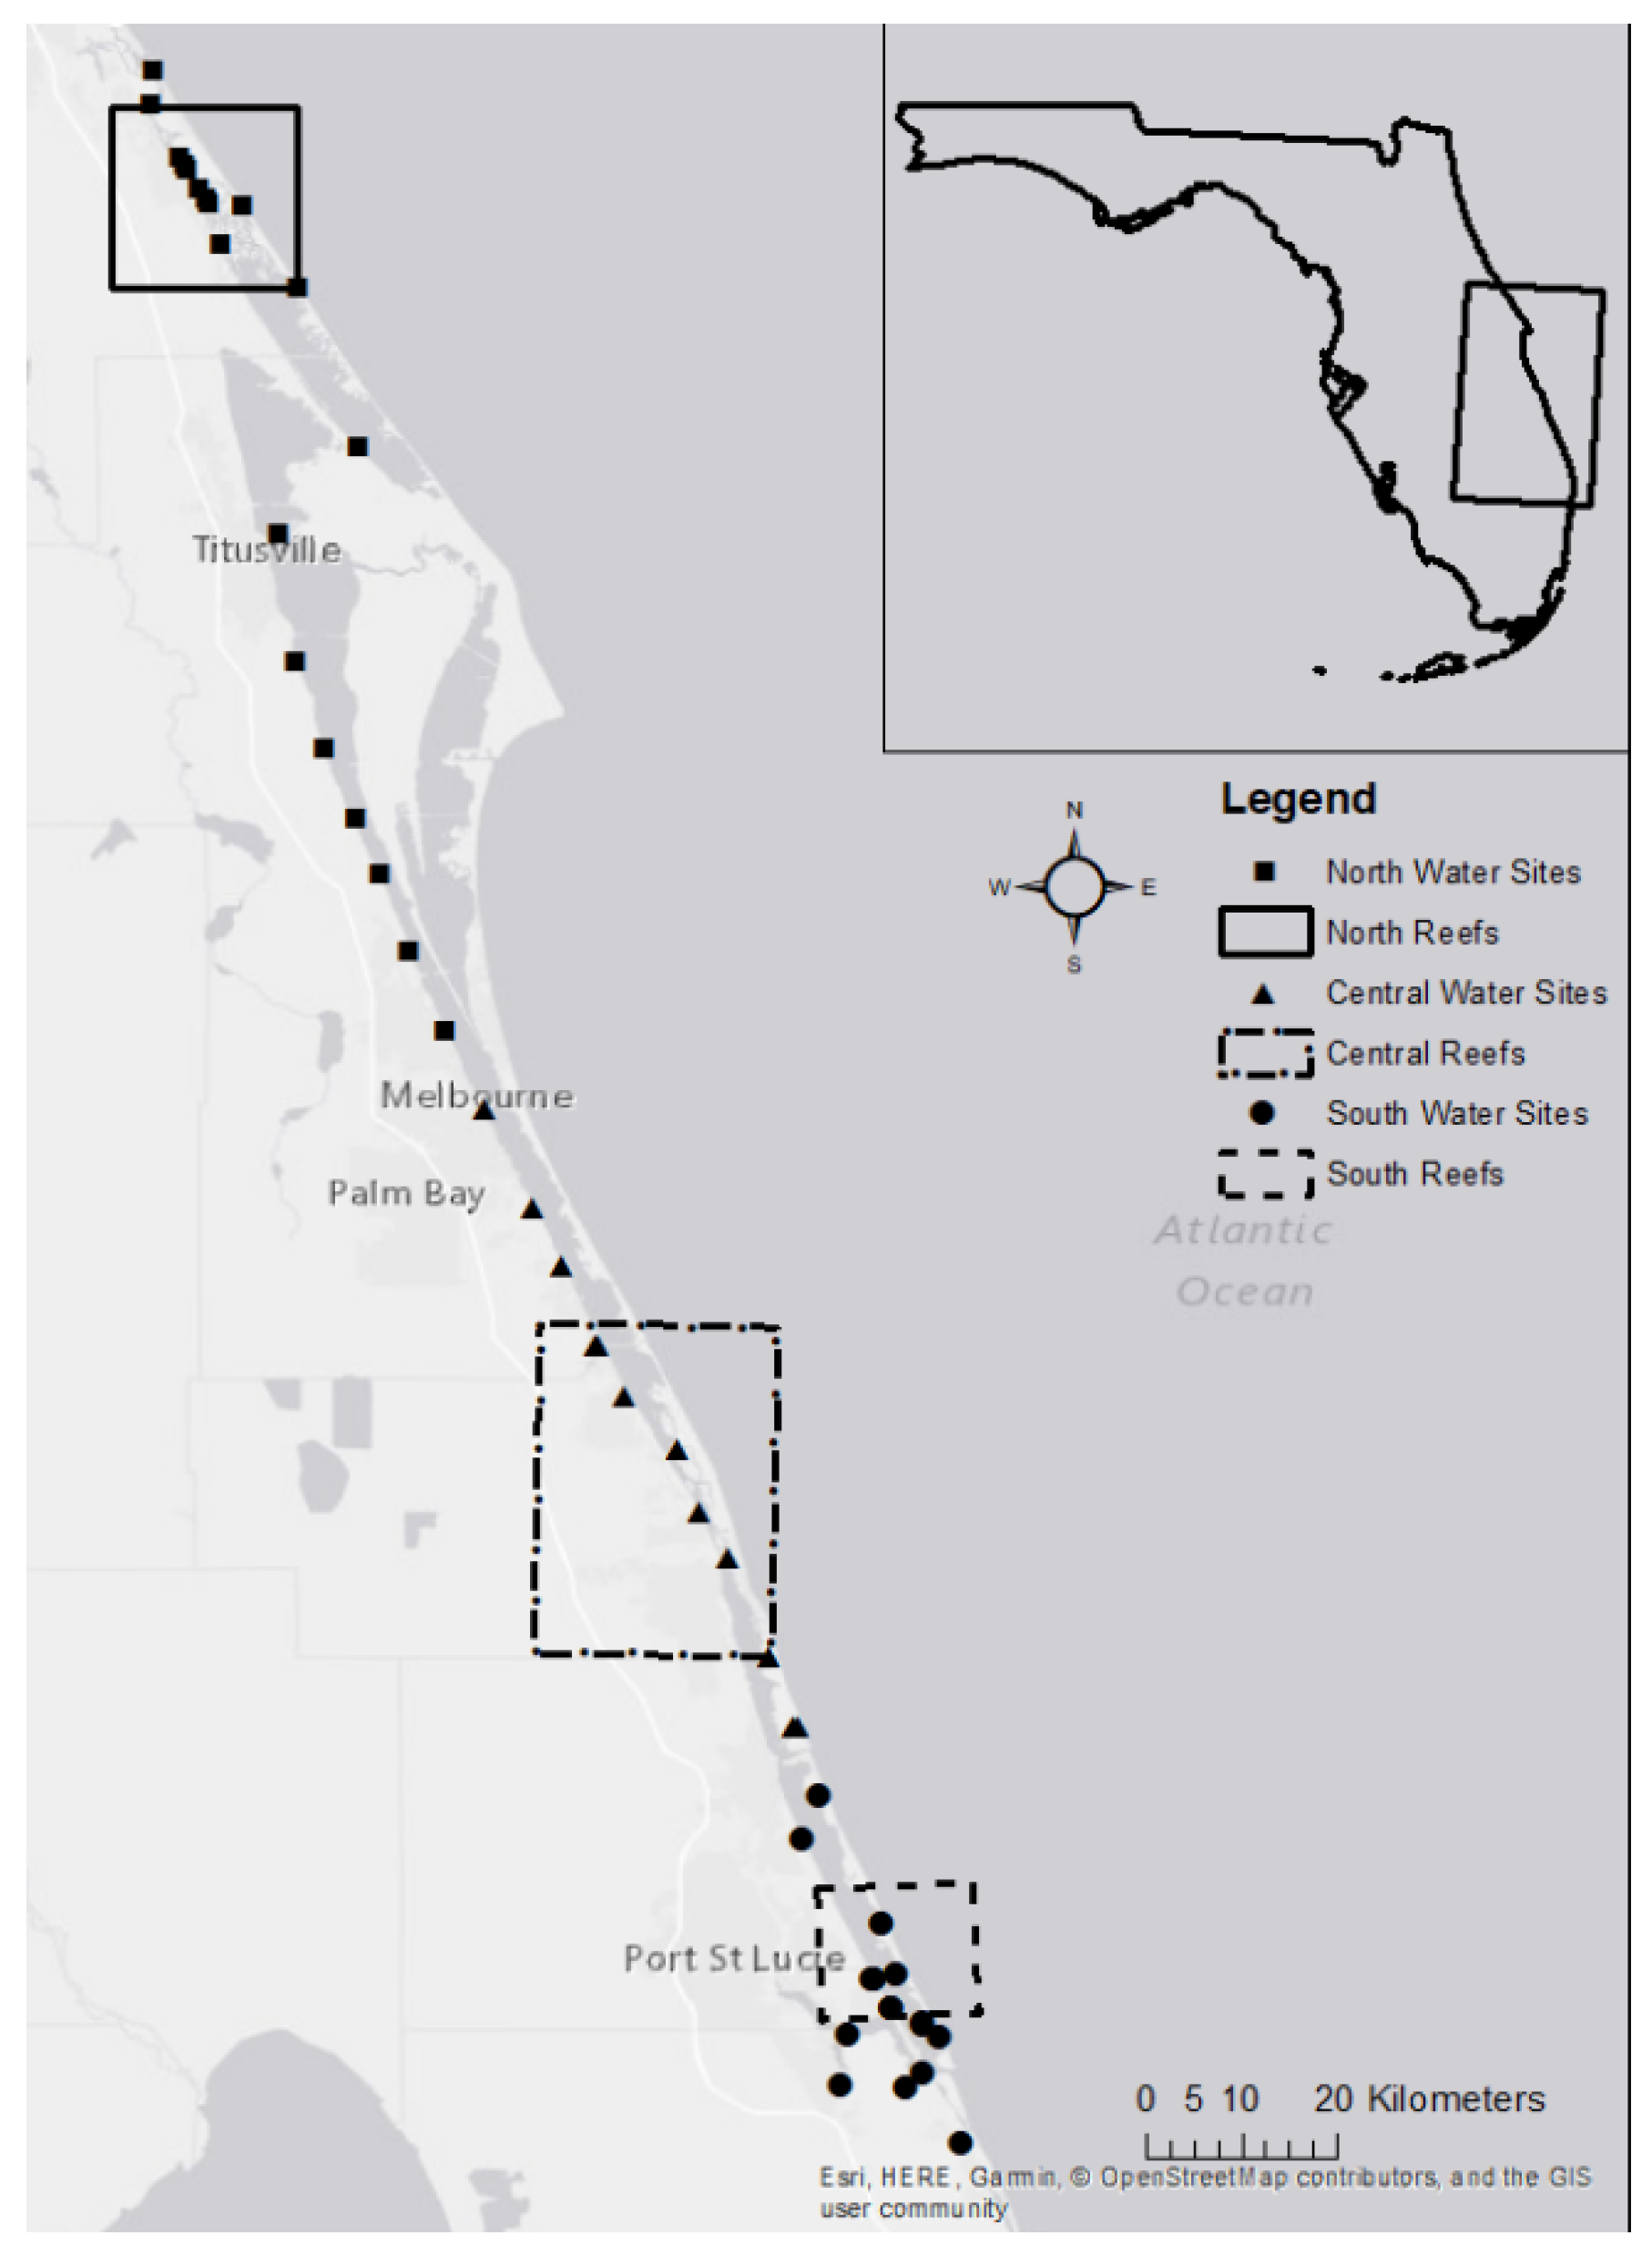
2.1. Study Location
2.2. Sample Collection and Citizen Science
2.3. Sample Processing
2.4. Limiting Polymer Contamination and Degradation
2.5. Fourier-Transform Infrared Spectroscopy
2.6. Statistical Methods
3. Results
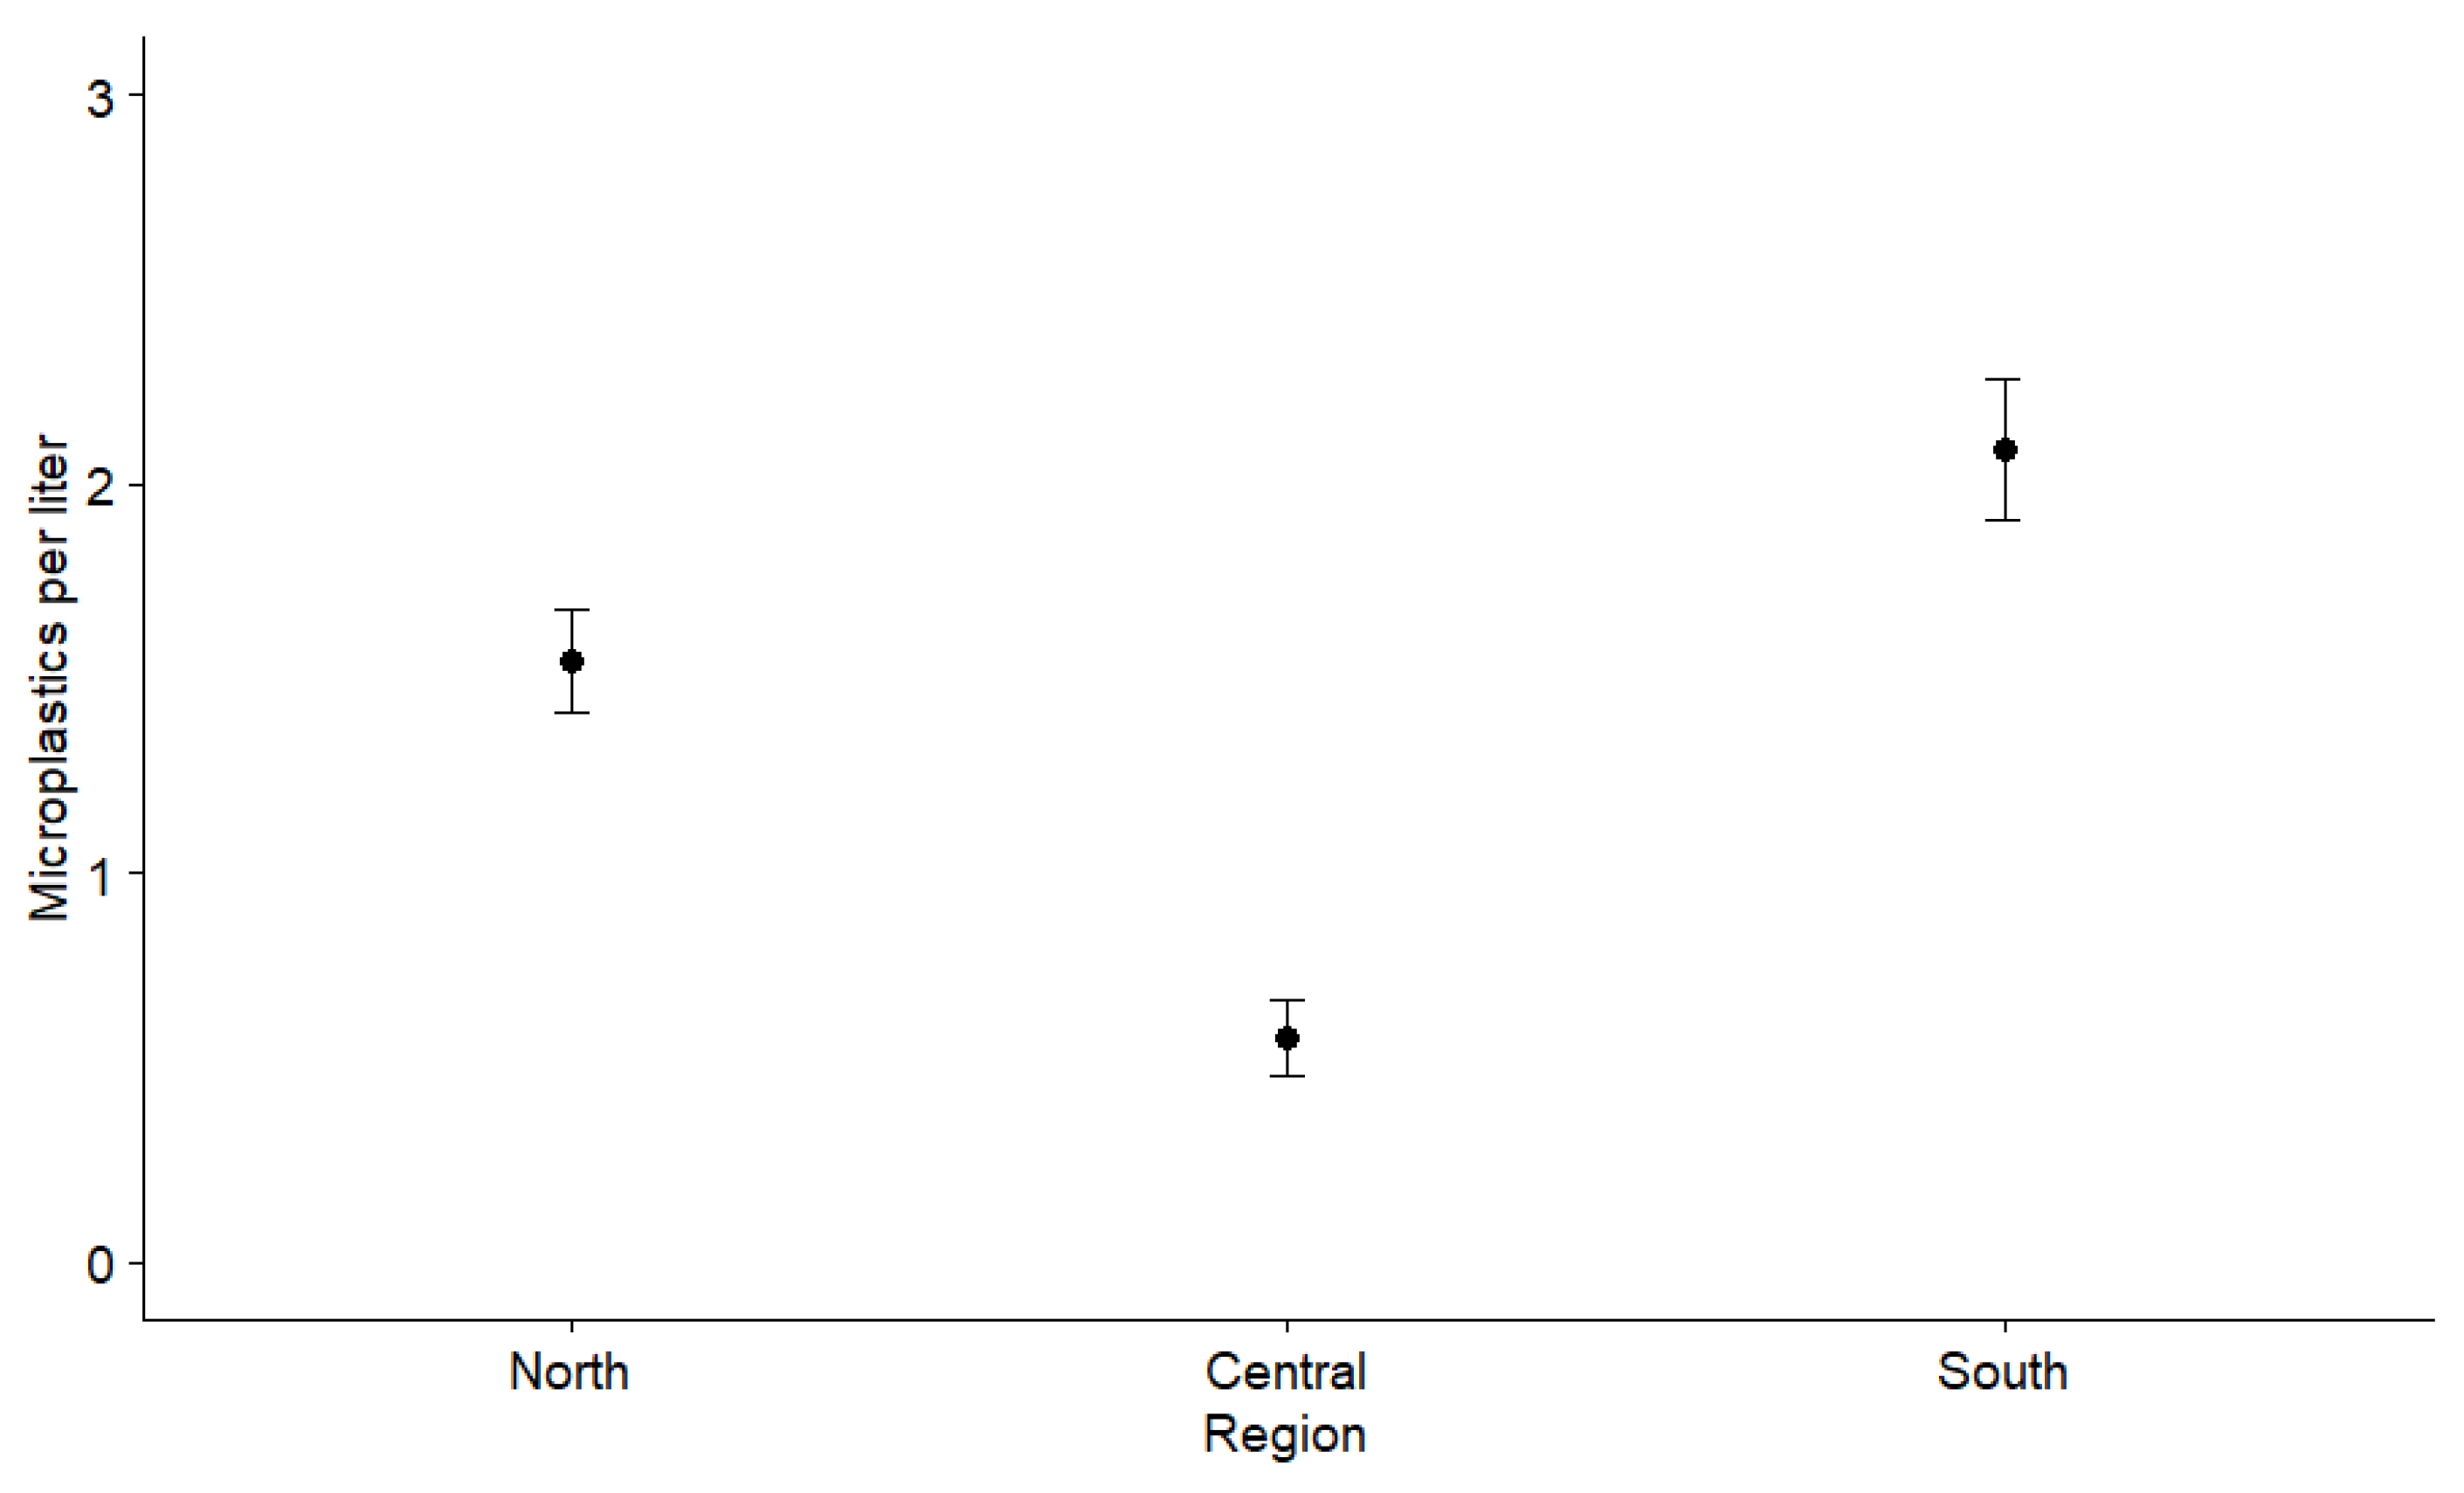
3.1. Microplastics in Lagoon Water
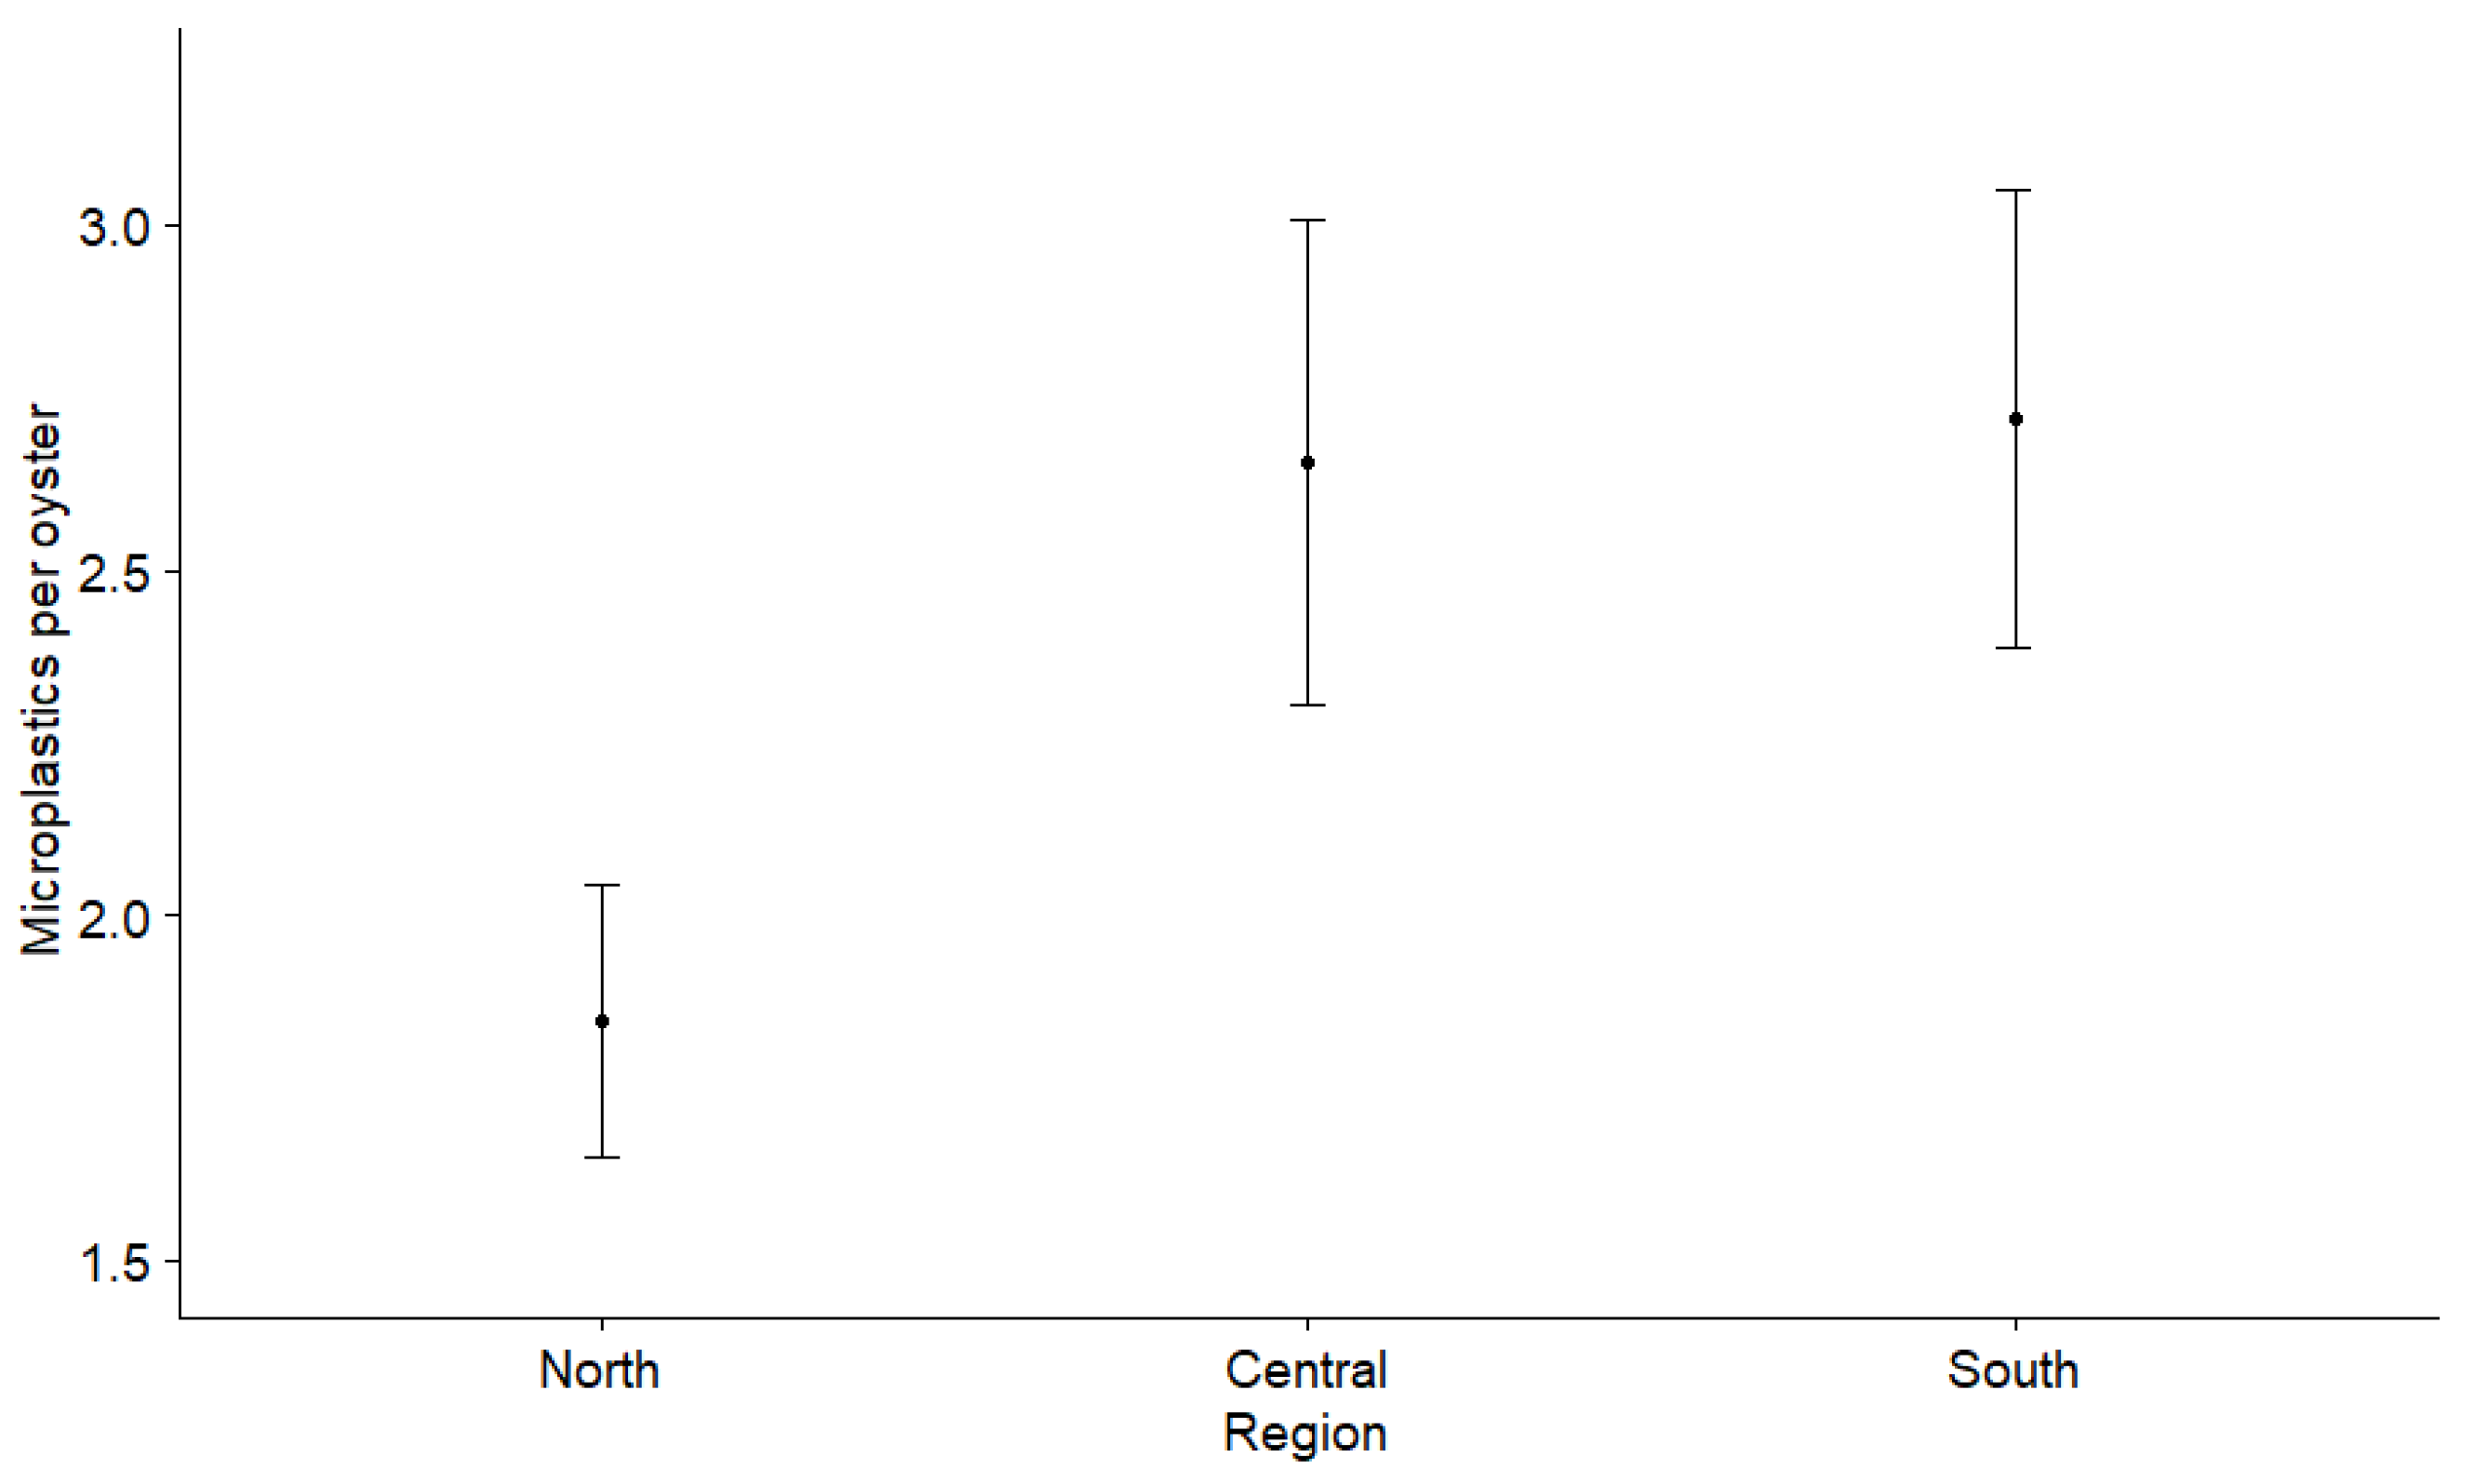
3.2. Microplastics in Oysters
3.3. Abiotic Parameters
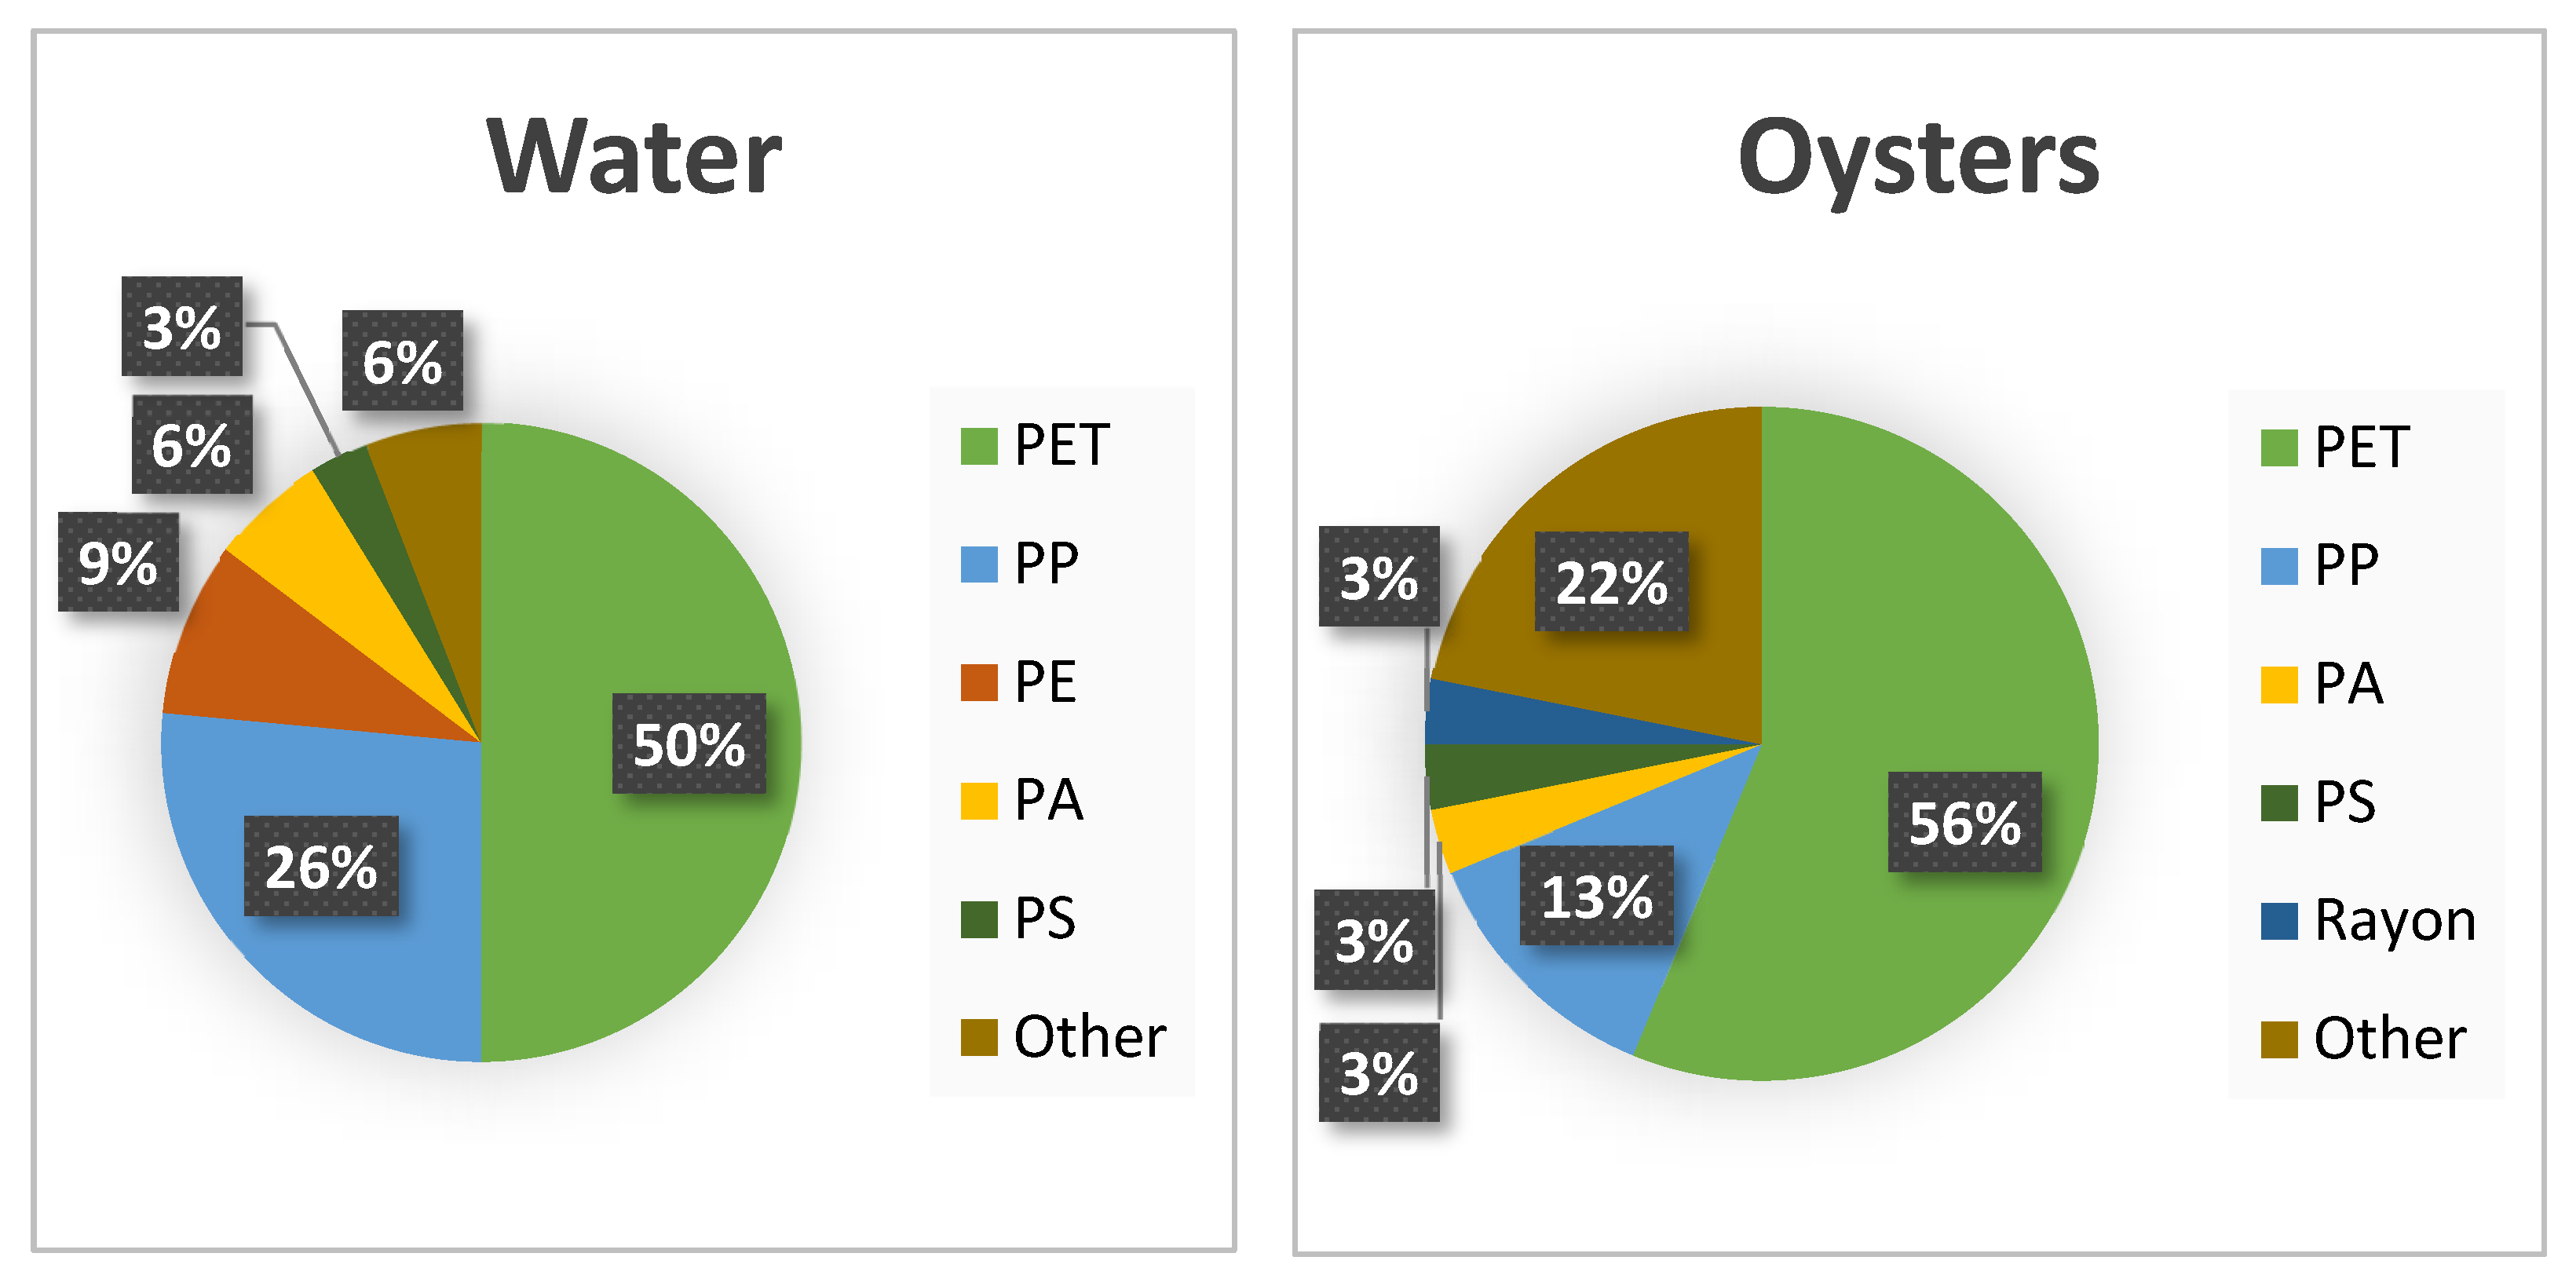
3.4. Polymer Composition and Contamination
4. Discussion
4.1. Spatial Microplastic Fluctuations and Influences
4.2. Temporal Microplastic Fluctuations and Influences
4.3. Polymers and Coastal Restoration
5. Conclusions
Author Contributions
Funding
Data Availability Statement
Acknowledgments
Conflicts of Interest
References
- Sekudewicz, I.; Dabrowska, A.M.; Syczewski, M.D. Microplastic Pollution in Surface Water and Sediments in the Urban Section of the Vistula River (Poland). Sci. Total Environ. 2021, 762, 143111. [Google Scholar] [CrossRef] [PubMed]
- Zhao, J.; Ran, W.; Teng, J.; Liu, Y.; Liu, H.; Yin, X.; Cao, R.; Wang, Q. Microplastic Pollution in Sediments from the Bohai Sea and the Yellow Sea, China. Sci. Total Environ. 2018, 640, 637–645. [Google Scholar] [CrossRef] [PubMed]
- Kalavrouziotis, I.; Karapanagioti, H. Microplastics in Water and Wastewater, 2nd ed.; IWA Publishing: London, UK, 2020. [Google Scholar]
- Baekeland, L.H. The Synthesis, Constitution, and Uses of Bakelite. Ind. Eng. Chem. 1909, 1, 149–161. [Google Scholar] [CrossRef]
- Crespy, D.; Bozonnet, M.; Meier, M. 100 years of Bakelite, the Material of 1000 uses. ChemInform 2008, 39, 3322–3328. [Google Scholar] [CrossRef]
- Geyer, R.; Jambeck, J.R.; Law, K.L. Production, Use, and Fate of All Plastics Ever Made. Sci. Adv. 2017, 3, e1700782. [Google Scholar] [CrossRef]
- Boucher, J.; Friot, D. Primary Microplastics in the Oceans: A Global Evaluation of Sources; IUCN: Gland, Switzerland, 2017; pp. 227–229. [Google Scholar]
- Jambeck, J.R.; Geyer, R.; Wilcox, C.; Siegler, T.R.; Andrady, A.; Narayan, R.; Law, K.L. Plastic Waste Inputs from Land into the Ocean. Science 2015, 347, 768–771. [Google Scholar] [CrossRef]
- Arthur, C.; Baker, J.; Bamford, H. (Eds.) Proceedings of the International Research Workshop on the Occurrence, Effects and Fate of Microplastic Marine Debris. In NOAA Technical Memorandum NOS-OR&R-30; University of Washington Tacoma: Tacoma, Washington, DC, USA, 2009. [Google Scholar]
- Guo, X.; Wang, J. The Chemical Behaviors of Microplastics in Marine Environment: A Review. Mar. Pollut. Bull. 2019, 142, 1–14. [Google Scholar] [CrossRef]
- Barnes, D.K.; Galgani, F.; Thompson, R.C.; Barlaz, M. Accumulation and Fragmentation of Plastic Debris in Global Environments. Phil. Trans. R. Soc. B Biol. Sci. 2009, 364, 1985–1998. [Google Scholar] [CrossRef]
- Auta, H.S.; Emenike, C.U.; Fauziah, S.H. Distribution and Importance of Microplastics in the Marine Environment: A Review of the Sources, Fate, Effects, and Potential Solutions. Environ. Int. 2017, 102, 165–176. [Google Scholar] [CrossRef]
- Ellison, K. The Trouble with Nurdles. Front. Ecol. Environ. 2007, 5, 396. [Google Scholar] [CrossRef]
- Li, H.X.; Ma, L.S.; Lin, L.; Ni, Z.X.; Xu, X.R.; Shi, H.H.; Yan, Y.; Zheng, G.; Rittschof, D. Microplastics in Oyster Saccostrea cucullata Along the Pearl River Estuary, China. Environ. Pollut. 2018, 236, 619–625. [Google Scholar] [CrossRef]
- Simon-Sanchez, L.; Grelaud, M.; Garcia-Orellana, J.; Ziveri, P. River Deltas as Hotspots of Microplastic Accumulation: The Case Study of the Ebro River (NW Mediterranean). Sci. Total Environ. 2019, 687, 1186–1196. [Google Scholar] [CrossRef]
- Luo, W.; Su, L.; Craig, N.J.; Du, F.; Wu, C.; Shi, H. Comparison of Microplastic Pollution in Different Water Bodies from Urban Creeks to Coastal Waters. Environ. Pollut. 2019, 246, 174–182. [Google Scholar] [CrossRef]
- Wang, F.J.; Tan, Z.; Peng, J.; Qiu, Q.; Li, M. The Behaviors of Microplastics in the Marine Environment. Mar. Environ. Res. 2016, 113, 7–17. [Google Scholar] [CrossRef]
- Zhang, F.; Man, Y.B.; Mo, W.Y.; Man, K.Y.; Wong, M.H. Direct and Indirect Effects of Microplastics on Bivalves, with a Focus on Edible Species: A Mini-Review. Crit. Rev. Environ. Sci. Technol. 2020, 50, 2109–2143. [Google Scholar] [CrossRef]
- Cho, Y.; Shim, W.J.; Jang, M.; Han, G.M.; Hong, S.H. Nationwide Monitoring of Microplastics in Bivalves from the Coastal Environment of Korea. Environ. Pollut. 2021, 270, 116175. [Google Scholar] [CrossRef]
- Ward, J.E.; Zhao, S.; Holohan, B.A.; Mladinich, K.M.; Griffin, T.W.; Wozniak, J.; Shumway, S.E. Selective Ingestion and Egestion of Plastic Particles by the Blue Mussel (Mytilus edulis) and Eastern Oyster (Crassostrea virginica): Implications for Using Bivalves as Bioindicators of Microplastic Pollution. Environ. Sci. Technol. 2019, 53, 8776–8784. [Google Scholar] [CrossRef]
- Craig, C.A.; Fox, D.W.; Zhai, L.; Walters, L.J. In-Situ Microplastic Egestion Efficiency of the Eastern Oyster Crassostrea virginica. Mar. Pollut. Bull. 2022, 178, 113653. [Google Scholar] [CrossRef]
- Eierman, L. Multiple Negative Impacts of Polyethylene Terephthalate Plastic (PET) Exposure on Juvenile Eastern Oysters (Crassostrea virginica). In Proceedings of the Coastal & Estuarine Research Federation 25th Biennial Conference, Mobile, AL, USA, 3–7 November 2019. [Google Scholar]
- Newell, R.I.; Jordan, S.J. Preferential Ingestion of Organic Material by the American Oyster Crassostrea virginica. Mar. Ecol. Prog. Ser. 1983, 13, 47–53. [Google Scholar] [CrossRef]
- Sussarellu, R.; Suquet, M.; Thomas, Y.; Lambert, C.; Fabioux, C.; Pernet, M.; Le Goic, N.; Quillien, V.; Mignant, C.; Epelboin, Y.; et al. Oyster Reproduction is Affected by Exposure to Polystyrene Microplastics. Proc. Natl. Acad. Sci. USA 2016, 113, 2430–2435. [Google Scholar] [CrossRef]
- Hitchcock, J.N. Storm Events as Key Moments of Microplastic Contamination in Aquatic Ecosystems. Sci. Total Environ. 2020, 734, 139436. [Google Scholar] [CrossRef]
- Xia, W.; Rao, Q.; Deng, X.; Chen, J.; Xie, P. Rainfall is a Significant Environmental Factor of Microplastic Pollution in Inland Waters. Sci. Total Environ. 2020, 732, 139065. [Google Scholar] [CrossRef]
- Lima, A.R.A.; Barletta, M.; Costa, M.F. Seasonal Distribution and Interactions between Plankton and Microplastics in a Tropical Estuary. Estuar. Coast. Shelf Sci. 2015, 165, 213–225. [Google Scholar] [CrossRef]
- Zhang, Y.L.; Wang, F.X.; Shock, C.C.; Yang, K.J.; Kang, S.Z.; Qin, J.T.; Li, S.E. Effects of Plastic Mulch on the Radiative and Thermal Conditions and Potato Growth under Drip Irrigation in Arid Northwest China. Soil Tillage Res. 2017, 172, 1–11. [Google Scholar] [CrossRef]
- Indian River Lagoon National Estuary Program. 2030 Comprehensive Conservation and Management Plan. 2019. Available online: https://onelagoon.org/management-plan/ (accessed on 19 August 2022).
- Rosario-Llantin, J.A.; Zarillo, G.A. Flushing Rates and Hydrodynamical Characteristics of Mosquito Lagoon (Florida, USA). Environ. Sci. Pollut. Res. 2021, 28, 30019–30034. [Google Scholar] [CrossRef]
- Smith, N.P. Tidal and Nontidal Flushing of Florida’s Indian River Lagoon. Estuaries 1993, 16, 739–746. [Google Scholar] [CrossRef]
- Walters, L.; Sacks, P.; Campbell, D. Boating Impacts and Boat-Wake Resilient Restoration of the Eastern Oyster Crassostrea virginica in Mosquito Lagoon, Florida, USA. Fla. Sci. 2021, 84, 173–199. [Google Scholar]
- Lewis, D.; Durham, K.; Walters, L.; Cook, G. Resident Fishes as Higher Trophic Level Indicators of Oyster Reef Restoration Success. Sustainability 2021, 13, 13004. [Google Scholar] [CrossRef]
- Loch, J.M.H.; Walters, L.J.; Donnelly, M.L.; Cook, G.S. Restored Coastal Habitat Can “Reel In” Juvenile Sportfish: Population and Community Responses in the Indian River Lagoon, Florida, USA. Sustainability 2021, 13, 12832. [Google Scholar] [CrossRef]
- Copertino, J.; Harris, K.; Chute, L.; Walters, L. Impact of Oyster (Crassostrea virginica) Reef Restoration on Benthic Invertebrates and Coastal Birds in a Subtropical Estuary. Sustainability 2022, 14, 2371. [Google Scholar] [CrossRef]
- Barber, A.; Walters, L.; Birch, A. Potential for Restoring Biodiversity of Macroflora and Macrofauna on Oyster Reefs in Mosquito Lagoon, Florida. Fla. Sci. 2010, 73, 47–62. [Google Scholar]
- Searles, A.; Gipson, E.; Walters, L.; Cook, G. Oyster Reef Restoration Facilitates the Recovery of Marine Invertebrate Abundance, Diversity, and Composition in Estuarine Communities. Nat. Sci. Rep. 2022, 12, 8163. [Google Scholar] [CrossRef] [PubMed]
- Cutroneo, L.; Reboa, A.; Besio, G.; Borgogno, F.; Canesi, L.; Canuto, S.; Dara, M.; Enrile, F.; Forioso, I.; Greco, G.; et al. Microplastics in Seawater: Sampling Strategies, Laboratory Methodologies, and Identification Techniques Applied to Port Environment. Environ. Sci. Pollut. Res. 2020, 27, 8938–8952. [Google Scholar] [CrossRef] [PubMed]
- Zhu, J.; Zhang, Q.; Li, Y.; Tan, S.; Kang, Z.; Yu, X.; Lan, W.; Cai, L.; Wang, J.; Shi, H. Microplastic Pollution in the Maowei Sea, a Typical Mariculture Bay of China. Sci. Total Environ. 2019, 658, 62–68. [Google Scholar] [CrossRef]
- Radabaugh, K.R.; Geiger, S.P.; Moyer, R.P. (Eds.) Oyster Integrated Mapping and Monitoring Program Report for the State of Florida; Technical Report 22; Florida Fish and Wildlife Conservation Commission, Fish and Wildlife Research Institute: St. Petersburg, FL, USA, 2019. [Google Scholar]
- Garvis, S.K.; Sacks, P.E.; Walters, L.J. Formation, Movement, and Restoration of Dead Intertidal Oyster Reefs in Canaveral National Seashore and Mosquito Lagoon, Florida. J. Shellfish Res. 2015, 34, 251–258. [Google Scholar] [CrossRef]
- Shaw Institute. Guide to Microplastics Identification, A Comprehensive Methods Guide for Microplastics Identification and Quantification in the Laboratory. Shaw Institute: Blue Hill, ME, USA, 2019. Available online: https://www.shawinstitute.org/ (accessed on 1 September 2019).
- Thiele, C.J.; Hudson, M.D.; Russell, A.E. Evaluation of Existing Methods to Extract Microplastics from Bivalve Tissue: Adapted KOH Digestion Protocol Improves Filtration at Single-Digit Pore Size. Mar. Pollut. Bull. 2019, 142, 384–393. [Google Scholar] [CrossRef]
- Foekema, E.M.; de Gruijter, C.; Mergia, M.T.; van Franeker, J.A.; Murk, A.J.; Koelmans, A.A. Plastic in North Sea Fish. Environ. Sci. Technol. 2013, 47, 8818–8824. [Google Scholar] [CrossRef]
- Granek, E.F.; Brander, S.; Holland, E.B. Microplastics in Aquatic Organisms: Improving Understanding and Identifying Directions for the Next Decade. Limnol. Oceanogr. Lett. 2020, 5, 1–4. [Google Scholar] [CrossRef]
- Gago, J.; Galgani, F.; Maes, T.; Thompson, R.C. Microplastics in Seawater: Recommendations from the Marine Strategy Framework Directive Implementation Process. Front. Mar. Sci. 2016, 3, 219. [Google Scholar] [CrossRef]
- Frias, J.P.G.L.; Gago, J.; Otero, V.; Sobral, P. Microplastics in Coastal Sediments from Southern Portuguese Shelf Waters. Mar. Environ. Res. 2016, 114, 24–30. [Google Scholar] [CrossRef]
- R Core Team. R: A Language and Environment for Statistical Computing; R Foundation for Statistical Computing: Vienna, Austria, 2019; Available online: https://www.R-project.org/ (accessed on 1 December 2018).
- Gwinnett, C.; Miller, R.Z. Are We Contaminating Our Samples? A Preliminary Study to Investigate Procedural Contamination During Field Sampling and Processing for Microplastic and Anthropogenic Microparticles. Mar. Pollut. Bull. 2021, 173, 113095. [Google Scholar] [CrossRef]
- Rota, E.; Bergami, E.; Corsi, I.; Bargagli, R. Macro- and Microplastics in the Antarctic Environment: Ongoing Assessment and Perspectives. Environments 2022, 9, 93. [Google Scholar] [CrossRef]
- Siegfried, M.; Koelmans, A.A.; Besseling, E.; Kroeze, C. Export of Microplastics from Land to Sea. A Modelling Approach. Water Res. 2017, 127, 249–257. [Google Scholar] [CrossRef]
- van Franeker, J.A.; Law, K.L. Seabirds, Gyres and Global Trends in Plastic Pollution. Environ. Pollut. 2015, 203, 89–96. [Google Scholar] [CrossRef]
- Wooddall, L.C.; Sanchez-Vidal, A.; Canals, M.; Paterson, G.L.; Coppock, R.; Sleight, V.; Calafat, A.; Rogers, A.D.; Narayanaswamy, B.E.; Thompson, R.C. The Deep Sea is a Major Sink for Microplastic Debris. R. Soc. Open Sci. 2014, 1, 140317. [Google Scholar] [CrossRef]
- Han, M.; Niu, X.; Tang, M.; Zhang, B.T.; Wang, G.; Yue, W.; Kong, X.; Zhu, J. Distribution of Microplastics in Surface Water of the Lower Yellow River Near Estuary. Sci. Total Environ. 2020, 707, 135601. [Google Scholar] [CrossRef]
- McEachern, K.; Alegria, H.; Kalagher, A.L.; Hanse, C.; Morrison, S.; Hastings, D. Microplastics in Tampa Bay, Florida: Abundance and Variability in Estuarine Waters and Sediments. Mar. Pollut. Bull. 2019, 148, 97–106. [Google Scholar] [CrossRef]
- Waite, H.; Donnelly, M.; Walters, L. Quantity and Types of Microplastics in the Organic Tissues of the Eastern Oyster Crassostrea virginica and Atlantic Mud Crab Panopeus herbstii from a Florida Estuary. Mar. Pollut. Bull. 2018, 129, 179–185. [Google Scholar] [CrossRef]
- Gray, A.D.; Wertz, H.; Leads, R.R.; Weinstein, J.E. Microplastics in Two South Carolina Estuaries: Occurrence, Distribution, and Composition. Mar. Pollut. Bull. 2018, 128, 223–233. [Google Scholar] [CrossRef]
- Baechler, B.R.; Stienbarger, C.D.; Horn, D.A.; Joseph, J.; Taylor, A.R.; Granek, E.F.; Brandre, S.M. Microplastic Occurrence and Effects in Commercially Harvested Finfish and Shellfish: Current Knowledge and Future Directions. Limnol. Oceanogr. Lett. 2020, 5, 113–136. [Google Scholar] [CrossRef]
- Martinelli, J.C.; Phan, S.; Luscombe, C.K.; Padilla-Gamino, J.L. Low Incidence of Microplastic Contaminants in Pacific Oysters (Crassostrea gigas Thunberg) from the Salish Sea, USA. Sci. Total Environ. 2020, 715, 136826. [Google Scholar] [CrossRef]
- Wheat, E.; Ruesink, J.L. Commercially-Cultured Oysters (Crassostrea gigas) Exert Top-Down Control on Intertidal Pelagic Resources in Willapa By, Washington, USA. J. Sea Res. 2013, 81, 33–39. [Google Scholar] [CrossRef]
- Bougrier, S.; Geairon, P.; Deslous-Paoli, J.M.; Bacher, C.; Jonquieres, G. Allometric Relationships and Effects of Temperature on Clearance and Oxygen-Consumption Rates of Crassostrea gigas (Thunberg). Aquaculture 1995, 134, 143–154. [Google Scholar] [CrossRef]
- Coughlan, J. The Estimation of Filtering Rate from the Clearance of Suspensions. Mar. Biol. 1969, 2, 356–358. [Google Scholar] [CrossRef]
- Dupuy, C.; Vaquer, A.; Lam-Hoai, T.; Rougier, C.; Mazouni, N.; Lautier, J.; Collos, Y.; Le Gall, S. Feeding Rate of the Oyster Crassostrea gigas in a Natural Planktonic Community of the Mediterranean Thau Lagoon. Mar. Ecol. Prog. Ser. 2000, 205, 171–184. [Google Scholar] [CrossRef]
- Kobayashi, M.; Hofmann, E.; Powell, E.N.; Klinck, J.; Kusaka, K. A Population Dynamics Model for the Japanese Oyster, Crassostrea gigas. Aquaculture 1997, 149, 285–321. [Google Scholar] [CrossRef]
- Powell, E.; Hofmann, E.; Klinck, J.; Ray, S. Modeling Oyster Populations: I. A Commentary on Filtration Rate: Is Faster Always Better? J. Shellfish Res. 1992, 11, 387–398. [Google Scholar]
- Galimany, E.; Freeman, C.J.; Lunt, J.; Domingos, A.; Sacks, P.; Walters, L. Feeding Competition between the Native Oyster Crassostrea virginica and the Invasive Mussel Mytella charruana. Mar. Ecol. Prog. Ser. 2017, 564, 57–66. [Google Scholar] [CrossRef]
- Grizzle, R.E.; Greene, J.K.; Coen, L.D. Seston Removal by Natural and Constructed Intertidal Eastern Oyster (Crassostrea virginica) Reefs: A Comparison with Previous Laboratory Studies, and the Value of In Situ Methods. Estuar. Coasts 2008, 31, 1208–1220. [Google Scholar] [CrossRef]
- Phuong, N.N.; Poirier, L.; Pham, Q.T.; Lagarde, F.; Zalouk-Vergnoux, A. Factors Influencing the Microplastic Contamination of Bivalves from the French Atlantic Coast: Location, Season and/or Mode of Life? Mar. Pollut. Bull. 2018, 129, 664–674. [Google Scholar] [CrossRef]
- Mak, C.W.; Tsang, Y.Y.; Leung, M.M.L.; Fang, J.K.H.; Chan, K.M. Microplastics from Effluents of Sewage Treatment Works and Stormwater Discharging into the Victoria Harbor, Hong Kong. Mar. Pollut. Bull. 2020, 157, 111181. [Google Scholar] [CrossRef] [PubMed]
- Bergman, M.J.; Donnangelo, L.J. Simulation of Freshwater Discharges from Ungauged Areas to the Sebastian River, Florida. J. Amer. Water Res. Assoc. 2000, 36, 1121–1132. [Google Scholar] [CrossRef]
- Kim, Y.T. Water Balance and Flushing Time in the Restricted Indian River Lagoon (IRL), Florida USA. Ocean Polar Res. 2003, 25, 75–87. [Google Scholar] [CrossRef][Green Version]
- USGS Surface Water Data for the Nation. Available online: https://waterdata.usgs.gov/nwis/sw (accessed on 21 August 2022).
- Law, K.L.; Morét-Ferguson, S.; Maximenko, N.A.; Proskurowski, G.; Peacock, E.E.; Hafner, J.; Reddy, C.M. Plastic Accumulation in the North Atlantic Subtropical Gyre. Science 2010, 329, 1185–1188. [Google Scholar] [CrossRef]
- Ji, Z.G.; Hu, G.; Shen, J.; Wan, Y. Three-Dimensional Modeling of Hydrodynamic Processes in the St. Lucie Estuary. Estuar. Coast Shelf Sci. 2007, 73, 188200. [Google Scholar] [CrossRef]
- Loosanoff, V.L. Some Aspects of Behavior of Oysters at Different Temperatures. Biol. Bull. 1958, 114, 57–70. [Google Scholar] [CrossRef]
- Walters, L.; Phlips, E.; Badylak, S.; McClenachan, G.; Sacks, P.; Donnelly, M. Field Observations of the Negative Association between Recruitment of the Eastern Oyster Crassostrea virginica and the Brown Tide Aureoumbra lagunensis in Mosquito Lagoon, FL. Fla. Sci. 2021, 84, 81–91. [Google Scholar]
- Walters, L.; Roddenberry, A.; Crandall, C.; Wayles, J.; Donnelly, M.; Barry, S.; Clark, M.; Escandell, O.; Hansen, J.C.; Laakkonen, K.; et al. The Use of Non-Plastic Materials for Oyster Reef and Shoreline Restoration: Understanding What is Needed and Where the Field is Headed. Sustainability 2022, 14, 8055. [Google Scholar] [CrossRef]
- Morris, R.; Bilkovic, D.; Boswell, M.; Bushek, D.; Cebrian, J.; Goff, J.; Kibler, K.; La Peyre, M.; McClenachan, G.; Moody, J.; et al. The Application of Oyster Reefs in Shoreline Protection: Are We Over-Engineering for an Ecosystem Engineer? J. Appl. Ecol. 2019, 56, 1703–1711. [Google Scholar] [CrossRef]
- Morris, R.; Bilkovic, D.; Boswell, M.; Bushek, D.; Cebrian, J.; Goff, J.; Kibler, K.; Le Peyre, M.; McClenachan, G.; Moody, J.; et al. Large-Scale Variation in Wave Attenuation of Oyster Reef Living Shorelines and the Influence of Inundation Duration. Ecol. Appl. 2021, 31, e02382. [Google Scholar] [CrossRef]
- Beck, R.W. National Post-Consumer Plastics Recycling Report; American Plastics Council, Division of American Chemistry Council: Arlington, VI, USA, 2004. [Google Scholar]
- Delle Chiaie, K.R.; McMahon, F.R.; Williams, E.J.; Price, M.J.; Dove, A.P. Dual-Catalytic Depolymerization of Polyethylene Terephthalate. Polym. Chem. 2020, 11, 1450–1453. [Google Scholar] [CrossRef]
- Moore, C.J. Synthetic Polymers in the Marine Environment: A Rapidly Increasing, Long-Term Threat. Environ. Res. 2008, 108, 131–139. [Google Scholar] [CrossRef]
- Jaffe, M.; Easts, A.J.; Feng, X. Polyester Fibers. In Thermal Analysis of Textiles and Fibers. The Textile Institute Book Series; Woodhead Publishing: Sawston, UK, 2020; pp. 133–149. [Google Scholar]
- Koh, L.D.; Cheng, Y.; Teng, C.P.; Khin, Y.W.; Loh, X.J.; Tee, S.Y.; Low, M.; Ye, E.; Yu, H.D.; Zhang, Y.W.; et al. Structures, Mechanical Properties and Applications of Silk Fibroin Materials. Prog. Polym. Sci. 2015, 46, 86–110. [Google Scholar] [CrossRef]
- Smith, N. The Intertidal Volume of Florida’s Indian River Lagoon. Fla. Sci. 1992, 55, 209–218. [Google Scholar]


| Site No. | Site Name | Abbreviation | Region | Latitude | Longitude |
|---|---|---|---|---|---|
| 1 | Smyrna Dunes Park | SDP | N | 29.063822 | −80.915744 |
| 2 | Marine Discovery Center | MDC | N | 29.030158 | −80.917641 |
| 3 | River Breeze Park | RBP | N | 28.898601 | −80.85174 |
| 4 | CANA Boat Ramp | CANAB | N | 28.934251 | −80.829475 |
| 5 | CANA Parking Lot #5 | CANA5 | N | 28.857672 | −80.777248 |
| 6 | Haulover Canal | HOC | N | 28.706285 | −80.720657 |
| 7 | Parrish Park | PPK | N | 28.623625 | −80.794767 |
| 8 | Campground | CAMP | N | 28.504 | −80.7801 |
| 9 | Briarwood | BW | N | 28.42123 | −80.75245 |
| 10 | Lee Wenner Boat Ramp | LWBR | N | 28.355086 | −80.722994 |
| 11 | Rockledge | ROCK | N | 28.3014 | −80.7005 |
| 12 | Rotary Park | RPK | N | 28.2295 | −80.6714 |
| 13 | Pineapple | PINE | C | 28.154 | −80.6382 |
| 14 | Front Street | FS | C | 28.079558 | −80.599847 |
| 15 | Malabar | MAL | C | 27.9862 | −80.5532 |
| 16 | Christensen | CHR | C | 27.93112 | −80.526022 |
| 17 | Outriggers | OUT | C | 27.855367 | −80.492992 |
| 18 | Sebastian | SEB | C | 27.80892 | −80.466215 |
| 19 | Environmental Learning Center | ELC | C | 27.758069 | −80.415706 |
| 20 | Vero | VERO | C | 27.654303 | −80.368983 |
| 21 | Round Island | RI | C | 27.561131 | −80.328635 |
| 22 | Wildcat | WC | C | 27.495292 | −80.303114 |
| 23 | Bear Point | BP | S | 27.429391 | −80.281382 |
| 24 | Midway | MID | S | 27.38723 | −80.297868 |
| 25 | Jensen Beach | JEN | S | 27.308302 | −80.22226 |
| 26 | Palm City Bridge | PCB | S | 27.155333 | −80.261 |
| 27 | Riverwalk | RW | S | 27.20225 | −80.253883 |
| 28 | Fish House | FH | S | 27.151083 | −80.199867 |
| 29 | Twin Rivers | TR | S | 27.164933 | −80.18215 |
| 30 | Driftwood | DW | S | 27.255533 | −80.23085 |
| 31 | Jensen Beach Impound | JBI | S | 27.260117 | −80.209233 |
| 32 | River Cove | RC | S | 27.21435 | −80.183983 |
| 33 | House of Refuge | HOR | S | 27.199617 | −80.166283 |
| 34 | Indian Riverside Park | IRP | S | 27.228535 | −80.212716 |
| 35 | Jimmy Graham Boat Ramp | JGBR | S | 27.09958 | −80.145616 |
| Indian River Lagoon Water | AIC | ΔAIC | df | AIC Weight |
|---|---|---|---|---|
| Site + season | 6283.6 | 0 | 77 | 1 |
| Site | 6306.6 | 23 | 71 | <0.001 |
| Tributary + region + season | 6569.9 | 286.3 | 15 | <0.001 |
| Tributary + region | 6584.1 | 300.5 | 9 | <0.001 |
| Region + season | 6644.6 | 361 | 13 | <0.001 |
| Region | 6660.2 | 376.6 | 7 | <0.001 |
| Season | 6938.3 | 654.8 | 9 | <0.001 |
| Inlet | 6946.8 | 663.2 | 7 | <0.001 |
| Tributary | 6951.4 | 667.8 | 5 | <0.001 |
| North Lagoon | AIC | ΔAIC | df | AIC Weight |
| Season | 2422.9 | 0 | 9 | 0.8221 |
| Site + season | 2426.0 | 3.1 | 31 | 0.1748 |
| Site | 2434.1 | 11.2 | 25 | 0.0031 |
| Central Lagoon | AIC | ΔAIC | df | AIC Weight |
| Site + season | 1131.2 | 0 | 27 | 0.7207 |
| Site | 1133.1 | 1.9 | 21 | 0.2771 |
| Inlet + season | 1143.6 | 12.4 | 11 | 0.0015 |
| Inlet | 1145.0 | 13.8 | 5 | <0.001 |
| Tributary | 1179.1 | 47,9 | 5 | <0.001 |
| Season | 1209.9 | 78,7 | 9 | <0.001 |
| South Lagoon | AIC | ΔAIC | df | AIC Weight |
| Site + season | 2710.5 | 0 | 33 | 1 |
| Site | 2742.7 | 32.2 | 27 | <0.001 |
| Tributary + season | 2912.9 | 202.5 | 11 | <0.001 |
| Tributary | 2920.5 | 210 | 5 | <0.001 |
| Season | 3003.5 | 293 | 9 | <0.001 |
| Indian River Lagoon Oysters | AIC | ΔAIC | df | AIC Weight |
|---|---|---|---|---|
| Site + season + shell height | 4984.0 | 0.0 | 35 | 1 |
| Season + shell height | 5020.6 | 32.6 | 13 | <0.001 |
| Site + shell height | 5053.1 | 69.1 | 29 | <0.001 |
| Shell height | 5088.2 | 104.2 | 7 | <0.001 |
| Site + season | 5158.6 | 174.6 | 35 | <0.001 |
| Season | 5208.4 | 224.4 | 13 | <0.001 |
| Site | 5248.5 | 264.5 | 29 | <0.001 |
| Tributary | 5277.0 | 293.0 | 9 | <0.001 |
| Region | 5289.1 | 305.1 | 11 | <0.001 |
| North Lagoon | AIC | ΔAIC | df | AIC Weight |
| Site + season | 2376.0 | 0.0 | 23 | 0.63 |
| Site + season + shell height | 2377.1 | 1.0 | 23 | 0.37 |
| Season + shell height | 2404.2 | 28.2 | 13 | <0.001 |
| Season | 2407.2 | 31.2 | 13 | <0.001 |
| Site | 2411.0 | 34.9 | 17 | <0.001 |
| Site + shell height | 2413.5 | 36.5 | 17 | <0.001 |
| Tributary | 2435.6 | 59.6 | 9 | <0.001 |
| Inlet | 2435.6 | 59.6 | 9 | <0.001 |
| Shell height | 2436.5 | 60.5 | 7 | <0.001 |
| Central Lagoon | AIC | ΔAIC | df | AIC Weight |
| Season + shell height | 1203.5 | 0.0 | 13 | 1 |
| Shell height | 1263.2 | 59.7 | 7 | <0.001 |
| Site + season | 1289.7 | 86.2 | 15 | <0.001 |
| Season | 1310.2 | 106.7 | 13 | <0.001 |
| Site | 1364.5 | 161.0 | 9 | <0.001 |
| Tributary | 1371.7 | 168.2 | 9 | <0.001 |
| South Lagoon | AIC | ΔAIC | df | AIC Weight |
| Season + shell height | 1335.8 | 0.0 | 13 | 1 |
| Shell height | 1372.0 | 36.2 | 7 | <0.001 |
| Season | 1408.7 | 72.9 | 13 | <0.001 |
| Water | Location | Abundance ± S.E. | Reference | |
|---|---|---|---|---|
| Indian River Lagoon, FL | 1.46 ± 0.05 | Present study | ||
| Mosquito Lagoon, FL | 23.1 | [56] | ||
| Tampa Bay Estuary, FL | 0.94 ± 0.52 | [55] | ||
| Charleston Harbor, SC | 6.6 ± 1.3 | [57] | ||
| Winyah Bay, SC | 30.8 ± 12.1 | [57] | ||
| Oysters | Location | Abundance ± S.E. | Reference | Species |
| Indian River Lagoon, FL | 2.26 ± 0.08 | Present study | Crassostrea virginica | |
| Mosquito Lagoon, FL | 16.5 | [56] | Crassostrea virginica | |
| Salish Sea, WA | 1.75 | [59] | Crassostrea gigas | |
| Oregon Coast | 10.95 ± 0.77 | [58] | Crassostrea gigas |
Publisher’s Note: MDPI stays neutral with regard to jurisdictional claims in published maps and institutional affiliations. |
© 2022 by the authors. Licensee MDPI, Basel, Switzerland. This article is an open access article distributed under the terms and conditions of the Creative Commons Attribution (CC BY) license (https://creativecommons.org/licenses/by/4.0/).
Share and Cite
Walters, L.J.; Craig, C.A.; Dark, E.; Wayles, J.; Encomio, V.; Coldren, G.; Sailor-Tynes, T.; Fox, D.W.; Zhai, L. Quantifying Spatial and Temporal Trends of Microplastic Pollution in Surface Water and in the Eastern Oyster Crassostrea virginica for a Dynamic Florida Estuary. Environments 2022, 9, 131. https://doi.org/10.3390/environments9100131
Walters LJ, Craig CA, Dark E, Wayles J, Encomio V, Coldren G, Sailor-Tynes T, Fox DW, Zhai L. Quantifying Spatial and Temporal Trends of Microplastic Pollution in Surface Water and in the Eastern Oyster Crassostrea virginica for a Dynamic Florida Estuary. Environments. 2022; 9(10):131. https://doi.org/10.3390/environments9100131
Chicago/Turabian StyleWalters, Linda J., Casey A. Craig, Emily Dark, Jessy Wayles, Vincent Encomio, Glenn Coldren, Tess Sailor-Tynes, David W. Fox, and Lei Zhai. 2022. "Quantifying Spatial and Temporal Trends of Microplastic Pollution in Surface Water and in the Eastern Oyster Crassostrea virginica for a Dynamic Florida Estuary" Environments 9, no. 10: 131. https://doi.org/10.3390/environments9100131
APA StyleWalters, L. J., Craig, C. A., Dark, E., Wayles, J., Encomio, V., Coldren, G., Sailor-Tynes, T., Fox, D. W., & Zhai, L. (2022). Quantifying Spatial and Temporal Trends of Microplastic Pollution in Surface Water and in the Eastern Oyster Crassostrea virginica for a Dynamic Florida Estuary. Environments, 9(10), 131. https://doi.org/10.3390/environments9100131