Article

Comparison of the Timber Management Expenses of Non-Industrial Private Forest Landowners in Mississippi, United States: Results from 1995–1997 and 2015

1
Warnell School of Forestry and Natural Resources, University of Georgia, 180 E. Green St, Athens, GA 30602, USA
2
Department of Forestry, College of Forest Resources, Mississippi State University, PO Box 9681, MS 39762, USA
3
Coastal Research and Extension Center, Mississippi State University, 1815 Popps Ferry Rd. Biloxi, MS 39532, USA
*
Author to whom correspondence should be addressed.
Environments 2019, 6(9), 107; https://doi.org/10.3390/environments6090107
Submission received: 28 June 2019 / Revised: 16 September 2019 / Accepted: 18 September 2019 / Published: 19 September 2019

Abstract

:
Forest landowner activities change over the lifespan of the forest and ownership cycle. Patterns of change emerge which suggest the evolving nature of forest landownership and Non-industrial Private Forest (NIPF) landowners’ interest in their land. The objective of this study was to examine trends in NIPF landowners’ distribution of forestry expenses in their management activities over time. First, 2010 Mississippi NIPF landowners were randomly selected from a property tax roll list. Our analysis compared study results of Arano et al. (2002) with a 2016 survey that was conducted by the authors of this paper. Both studies drew on assessments of timber management expenditures that were conducted on behalf of a state government department of revenue to determine ad valorem taxes for forest land. As such, both studies contained similar survey questions with 12 forestry-related activities grouped into four major categories: (1) Fees for Professional Services (e.g., consulting foresters, surveyors), (2) Timber Management Expenditures (e.g., site preparation, planting), (3) Other Management Expenditures (e.g., road construction), and (4) Property Taxes. Like the 2002 article, results here are presented as descriptive statistics. In both survey cycles, Timber Management Expenditures represented the largest component of annual expenditures in both the 1990s and 2015. The largest decrease in reported expenditures occurred for Other Management Expenditures. By broadly describing differences in expenditures over time, this study provides insights into the involvement of NIPF landowners in management activities on forest land such as reforestation after final harvest, thinning, and timber stand improvement, which can impact forest products’ supply over time.

1. Introduction

Non-industrial Private Forest (NIPF) landowners comprise 47% of the nation’s total timberland area [1]. As such, these owners’ management decisions and behaviors are particularly important regarding the net benefits that are provided by the nation’s forests [2]. In particular, the U.S. South, commonly termed the wood basket of the United States, performs a critical role in satisfying the nation’s demand for timber, paper products, forest-based biofuels, and recreation. In turn, Mississippi is one of the most heavily forested states in the nation by percentage of area. Hardwood and mixed stands occupy 10.5 million acres and pine forests cover 6.62 million acres of forested land in the state with forested acreage increasing over the past four decades [3]. While natural stands have decreased since 2006, planted loblolly pine has increased [4].
Regardless of forest type, the U.S. Forest Service’s National Woodland Owner Survey (NWOS) notes that the most common objectives of owning forest land are for beauty, wildlife habitat, and nature protection [5]. Timber production was one of the least frequently cited reasons for owning forest land. By comparison, Mutandwa et al. [6] found that the most important reason for forest landownership in Mississippi was to provide a legacy to heirs, followed by long-term investment and personal recreation [6]. Timber production was the fourth most important reason for owning forests followed by fee-based recreational services (e.g., hunting leases, ecotourism, and horseback riding). The diversity of landowner objectives is important to keep in mind when seeking to understand the relationship between management behavior and the maximization of forest land benefits.
This study is guided by the notion that decisions regarding forest management activities depend on the landowner’s utility maximizing behavior, regardless of management objectives [7]. According to the economic theory of utility-maximization, landowners that are considered utility-maximizers take non-monetary benefits such as biodiversity, aesthetics, and recreation into consideration along with timber and non-timber benefits produced from their forest lands [8]. This is important because landowners with multiple objectives have tended to be interested in a wide range of forest related benefits [9]. However, despite the importance of non-timber benefits, this study focuses solely on timber management activities due to their broad-ranging local and extra-local market impacts. To maximize utility, a landowner should invest his or her money such that each dollar spent per product or service purchased have the marginal utility. This utility can be gained by maximizing the profits and optimizing the efficiency of a forested property [10,11]. NIPF management activities include, for example, site preparation, planting, prescribed burning, property line maintenance, protection against fire and insects, and timber stand improvement. Landowners’ expenditures on these forest management activities can be observed as a function of their utility maximizing behavior. Further, expenditure information is an indicator of landowners’ willingness to invest in forest management to improve their land and resources. As well, information about expenditures demonstrates how investments on private forest lands are distributed among various management or silvicultural activities. Expenditure analysis requires NIPF landowners to keep detailed records of their management activities, which they should do anyway for tax considerations, risk mitigation, and for management decisions [12].
Although forest management expenditures can vary greatly depending on the level and nature of the management activity, as well as the size of the property [13], demonstrating statistical relationships between such characteristics and expenditure trends or testing relationships between the characteristics of forest landowners and the amount of utility is beyond the scope of this study. However, we do consider potential linkages between them for future research, with Figure 1 illustrating the conceptual model of forest landowners, forest management expenditure, returns to landowners, and utility. The idea is that any expenditure made by landowners is related to the production of either products or services. Landowners invest money to carry out various forestry practices in their forest land. In exchange, they receive returns in use values (e.g., timber, non-timber forest products) and non-use values (e.g., biodiversity, aesthetics). Thus, these landowners execute forest management activities in order to maximize the utility of their property.
There is a fairly large body of work that has addressed management costs (e.g., [14,15,16,17,18,19]), although comparisons between time periods are rare. In addition, previous studies have not included fees for professional services used by landowners to manage forest land. Information on professional services, for example, foresters’ fees, attorney fees, and surveyor fees, is crucial to fully accounting for forest management expenditures and costs. Still, landowner activities and costs published in journals serve as benchmarks for other landowners’ management decisions. A well-known report published in Forest Landowner (e.g., Maggard and Barlow [20]) provides bi-annual estimates of the costs of forestry-related activities in the South [20]. For example, in the most recent report, the average cost for mechanical site preparation was $140.99 per acre, machine planting cost was $80.30 per acre, prescribed burning was $26.63, and chemical application cost was $69.53 per acre in 2016 [20]. The 2017 report noted that prices increased steadily from 2008 to 2012, but dropped in 2014 [20]. These cost fluctuations were likely related to a faltering U.S. forest products industry following the collapse of the housing market and the subsequent recession [21]. Service providers exited the market during the recession, thereby driving up prices, and then returned with the improving economy.
As noted by Arano et al. [19], annual expenditures over time reflect changes in management intensity and, therefore, NIPF landowners in Mississippi were not managing forest land intensively. Intensive management implies the use of forest management practices, including silvicultural tools to regulate stand density and increase the volume or value of the land and timber. To measure intensity, the authors listed expenses related to silvicultural practices including prescribed burning, timber stand improvement, and fertilization. They found that expenditures were strongly related to forest parcel size, with landowners holding larger tracts tending to manage more intensively than those with smaller tracts. Conner and Hartsell [22] noted that landowners with small holdings may have limited capital which in turn limits management options or prevents them from participating in what they consider to be activities that are more appropriate for larger scale operations. Underscoring the benefits of economies of scale, the Alabama Cooperative Extension Service [23] stated that “a good rule of thumb is treating larger areas generally costs slightly less on a per acre basis than the same treatment on smaller acreages.” Similarly, cost sharing and technical assistance programs, such as the Conservation Reserve Program (CRP), have been found to be more appealing to those who either owned large forest acreages or were actively managing their land for timber production (although we acknowledge that the CRP may have acreage of dollar limits that would preclude very large landowners) [24,25].
Our research objective was to examine trends in Mississippi NIPF landowner management activity over time by comparing expenditures from 2015 with expenditures averaged from 1995 to 1997 (hereafter referred to as the 1990s). Major contributions of this work to the literature are: (1) the inclusion of fees for professional services in the analysis and (2) a comparison of expenditures observed over nearly two decades. This paper presents descriptive information regarding the timber management of Mississippi rather than establishing relationships between variables and forest management intensity. Nonetheless, context is important to note. Forest products markets had slowed due to mill closures and imported products with Mississippi timber prices averaging $25 per ton for pine sawtimber and $8 per ton for pine pulpwood by the fourth quarter of 2015. Results from this study can benefit the decisions of landowners, foresters, policymakers, and timber supply modelers. NIPF landowners can use expenditure analysis to help plan their forest management activities based on cost trends over time. In addition, such analysis paints a broad picture of the activeness of NIPF landowners and future timber availability. Timber supply analysts could use this information to improve predictions of future timber availability [26], and cost and expenditure data can be used to develop appropriate policies and/or legislation [27]. For example, policies might include developing and implementing cost-share and conservation programs that ensure investment in forest management activities while also providing property tax incentives, tax credits, assurance of markets for forest products, and timber insurance. The following sections describe the study’s methods and present the results. The article concludes with a discussion and implications for future research.

2. Materials and Methods

2.1. Survey and Data

This study extends and partially replicates the Arano et al. [19] study. To compare expenditures across two points in time, we analyzed NIPF landowner responses drawn from multiple surveys that were conducted over several decades. The 1990s expenses were found in Arano et al.’s [19] published article based on surveys they conducted in 1996, 1997, and 1998. The Arano et al. [19] data consisted of annual costs averaged over the period 1995 to 1997. We were unable to employ the raw data because the records had been destroyed. These results were compared with results from a survey conducted in 2016 by the authors of this article. Both the Arano et al. [19] surveys and the 2016 survey collected tax information from the year prior to the year that the respective survey was conducted (for example, the 2016 survey collected 2015 tax year data).
The sample frame was generated from a property tax mailing list maintained by Mississippi State University. Lists were obtained in 1996, 1997, and 1998 (for the Arano et al. [19] publication) and 2016. Each survey employed a unique sampling frame and respondents were selected randomly from approximately 300,000 forest landowners with at least 20 acres of forest land. Due to budgetary limitations, the 2016 sampling frame decreased since the 1990s surveys. Each 1990s survey was mailed to 5000 landowners, while the 2016 survey was mailed to 2010 landowners. Four mail contacts were used (modified from [28]): a cover letter and questionnaire, reminder post card, replacement survey and cover letter, and reminder postcard or a thank you letter.
Questionnaires were divided into four sections with activities considered by capital expenditures (site preparation, fertilization, regeneration, and road construction), expensed expenditures (pre-commercial thinning, pruning, chemical release costs, supervision and administration, and animal damage), professional services (expenditures related to consulting forester fees, attorney fees, accountant fees, and surveyor fees), and timber harvests (final harvest cost). Section I addressed landowners’ forest ownership by forest stand type with a primary question asking, “How many acres of forest land did you own in Mississippi in 2015?” (open-ended response). Other key questions related to this article were: “How much were your total 2015 county property taxes on your forest land?” (open-ended response) and “Did you incur any expenses for management activities on your forest land in 2015?” (no = 0, yes = 1).
Section II elicited forest management costs for activities divided into the following categories: site preparation, planting, prescribed burning, fertilization, routine expenses for timber management, fees for consulting forester services, attorney fees, and surveyors’ fees. If respondents had incurred expenses, as expressed in Section I, they indicated their incurred costs for various management activities (e.g., mechanical site preparation, chemical site preparation, planting loblolly pine, road construction) listed in each category. All responses in Section II were open-ended.
Section III asked for timber harvesting information, including acres harvested and any expenses related to harvesting. Respondents indicated any expenses and revenues associated with hunting and wildlife management. The last section solicited respondents’ demographic characteristics. These last two sections were not taken into consideration for this paper due to high non-response rates.

2.2. Data Analysis

For simplification of the data analysis, expenditures were compared across the following categories: (a) Fees for Professional Services; (b) Timber Management Expenditures; (c) Other Management Expenditures; and (d) Property Taxes. Comparable to Arano et al. [19], we compared the percentage of all survey respondents who incurred (NIPF landowners in the 1990s and 2016 who did not spend money on timber management activities during the preceding tax year) expenditures for each category during 2015 (“Mean Expenditures of Entire Sample”) with only those respondents who incurred each expense in 2015 (“Mean Expenditures of Landowners Who Incurred Expenses”). Thus, if only 4 out of 10 respondents incurred expenses, the average expenditure was divided by four to obtain the Mean Expenditures of Landowners Who Incurred Expenses or was divided by 10 to obtain the entire sample’s average. Comparison between the two categories of respondents was then observed over time from the 1990s data found in Arano et al. [19] to the 2016 survey data. To compare per acre costs, each dollar value of the 1990s was compounded to 2015 dollars based on an inflation rate of 2.2% determined from the Consumer Price Index 1997 to 2015 [29]. To be consistent with Arano et al. [19], this study compares nominal costs rather than real costs. Arano et al. [19] used nominal values because they are easy to understand by economists as well as laypersons. Nominal costs evaluate the variation in the cost of a forest management activity without any adjustment.
Expenditures were compared on the basis of frequency of occurrence as well as magnitude. To compute magnitude, we calculated the means for the reported expenditures of each forest management activity on a per-acre basis. For example, a landowner who owned 500 acres of forest land and spent $100 planting 50 acres and $200 for site preparation on 5 acres had a per acre expenditure of $2 per acre (100/50) for planting and $40 per acre (200/5) for site preparation. Total Management Expenditures for this case would then be calculated at $42 per acre (40 + 2). Next, we computed the average for all respondents. If a survey participant had multiple expenses in a category, the expenses were added within the category before calculating the mean expenditure per acre. Then, we computed the overall average for the sample and subgroup. Unlike Arano et al. [19], we were unable to test for statistically significant differences between the two time periods due to unavailability of the 1990s survey data (again, we used the data presented in their article, not the raw data). However, standard errors and 95% confidence intervals for the 2015 data were computed based on the four major expenditures categories.

3. Results

3.1. Response Rates

Results were organized according to responses regarding the four expenditure categories. The 2016 survey had a 23% adjusted response rate, while the 1990s surveys reported in Arano et al. [19] averaged 21%. A similar response rate was reported by Khanal et al. [30] and Pokharel et al. [31,32] for the state and region, respectively. As suggested by Armstrong and Overton [33], a non-response bias test was conducted using t-tests to compare the responses between the first 30 and last 30 respondents. Additionally, our survey had comparable sample estimates compared to the National Woodland Owners Survey (NWOS) (Table 1).
Similar to Arano et. al [19], we compared the reported landowner demographics to those reported in the NWOS [34]. Among the three categories of ownership size, the smallest ownership class (10–100) is slightly under-represented in our sample, while the other two classes are well-represented (Figure 2). In order to avoid response bias, we also regressed ownership size on per acre expenditures on each of the forest management activities and found no significant relationship [17].

3.2. Parcel Size and Overall Participation and Expenditures for Forest Management

The average forest parcel size was 231 acres in the 1990s. This compares to an average parcel size of 157 acres reported in the 2016 survey data (Table 2) and 100 to 499 acres reported by the NWOS. The median parcel size reported was 75 acres in 2015 and 80 acres in the 1990s. In both survey cycles (1990s and 2016), some parcels were less than 20 acres, probably due to parcelization, although this was not accounted for in the surveys.
Since Arano et al.’s [17] analysis of expenditures from the mid-1990s, fewer landowners have reported expenditures for all major categories of forest management, including Property Tax payments (Table 3). The largest decrease in reported expenditures occurred for Other Management Expenditures (19%). This was followed by Professional Services (11.1%) and Timber Management Expenditures (10.9%). Property Taxes had the least amount of decrease (4.1%), which makes sense given that taxes should be a fairly inflexible expense.
Table 4 shows the overall expenditures of the four major categories with their standard errors and confidence intervals for the 2015 costs. Other than Property Taxes, the mean expenditures for all the categories dropped between the two time periods for the entire sample. The largest decrease was in Fees for Professional Services (55%; $2.89 to $1.30), while Other Management Expenditures decreased the least (38%; $1.91 to $1.18). By contrast, expenditures for landowners who incurred expenses during the surveyed tax year increased dramatically in all categories. The largest increase was in Timber Management Expenditures (900%; $24.11 to $246.32), while the smallest increase was in Fees for Professional Services (34%; $16.05 to $21.55).

3.3. Fees for Professional Services

In addition to management activities overall, changes in participation and expenditures were observed within each of the four categories. The most commonly reported Fee for Professional Services in the 1990s was for accounting professionals (8.4%), while respondents were most likely to report fees paid to consulting foresters and surveyors in 2015 (2.5% for both). The greatest decrease in reported fees was for accounting services, which dropped by 6.6%. Surveyor fees were associated with the lowest decrease between the two time periods (2.4%).
Reported fees for consulting foresters were highest of the four professional fees categories; however, consulting fees decreased over a dollar per acre between the 1990s and 2015, representing the greatest decrease (Figure 3). Only surveyor fees increased by $0.10 per acre from $0.28 per acre in the 1990s to $0.38 per acre in 2015. Besides consulting fees, attorney fees saw the largest decrease in expenditures ($0.43/ac). Besides consultants, landowners tended to pay most for attorney fees ($0.51/ac.) in the 1990s and least for accountants ($0.27/ac.). By contrast, landowners paid more for surveyors ($0.38/ac.) than attorneys ($0.08/ac.) in 2015.
The subgroup of landowners who incurred expenses differed markedly from respondents as a whole with an overall increase in expenditures observed between the 1990s and 2015 of $5.50 per acre owned ($16.05 to $21.55) (Figure 4). The highest increase in reported fees was for surveyors ($3.04/ac.), while only attorney fees decreased slightly ($0.36/ac). Consistent with the aggregate group, the subgroup spent most on consultants, followed by surveyors, attorneys, and accountants in both time periods.

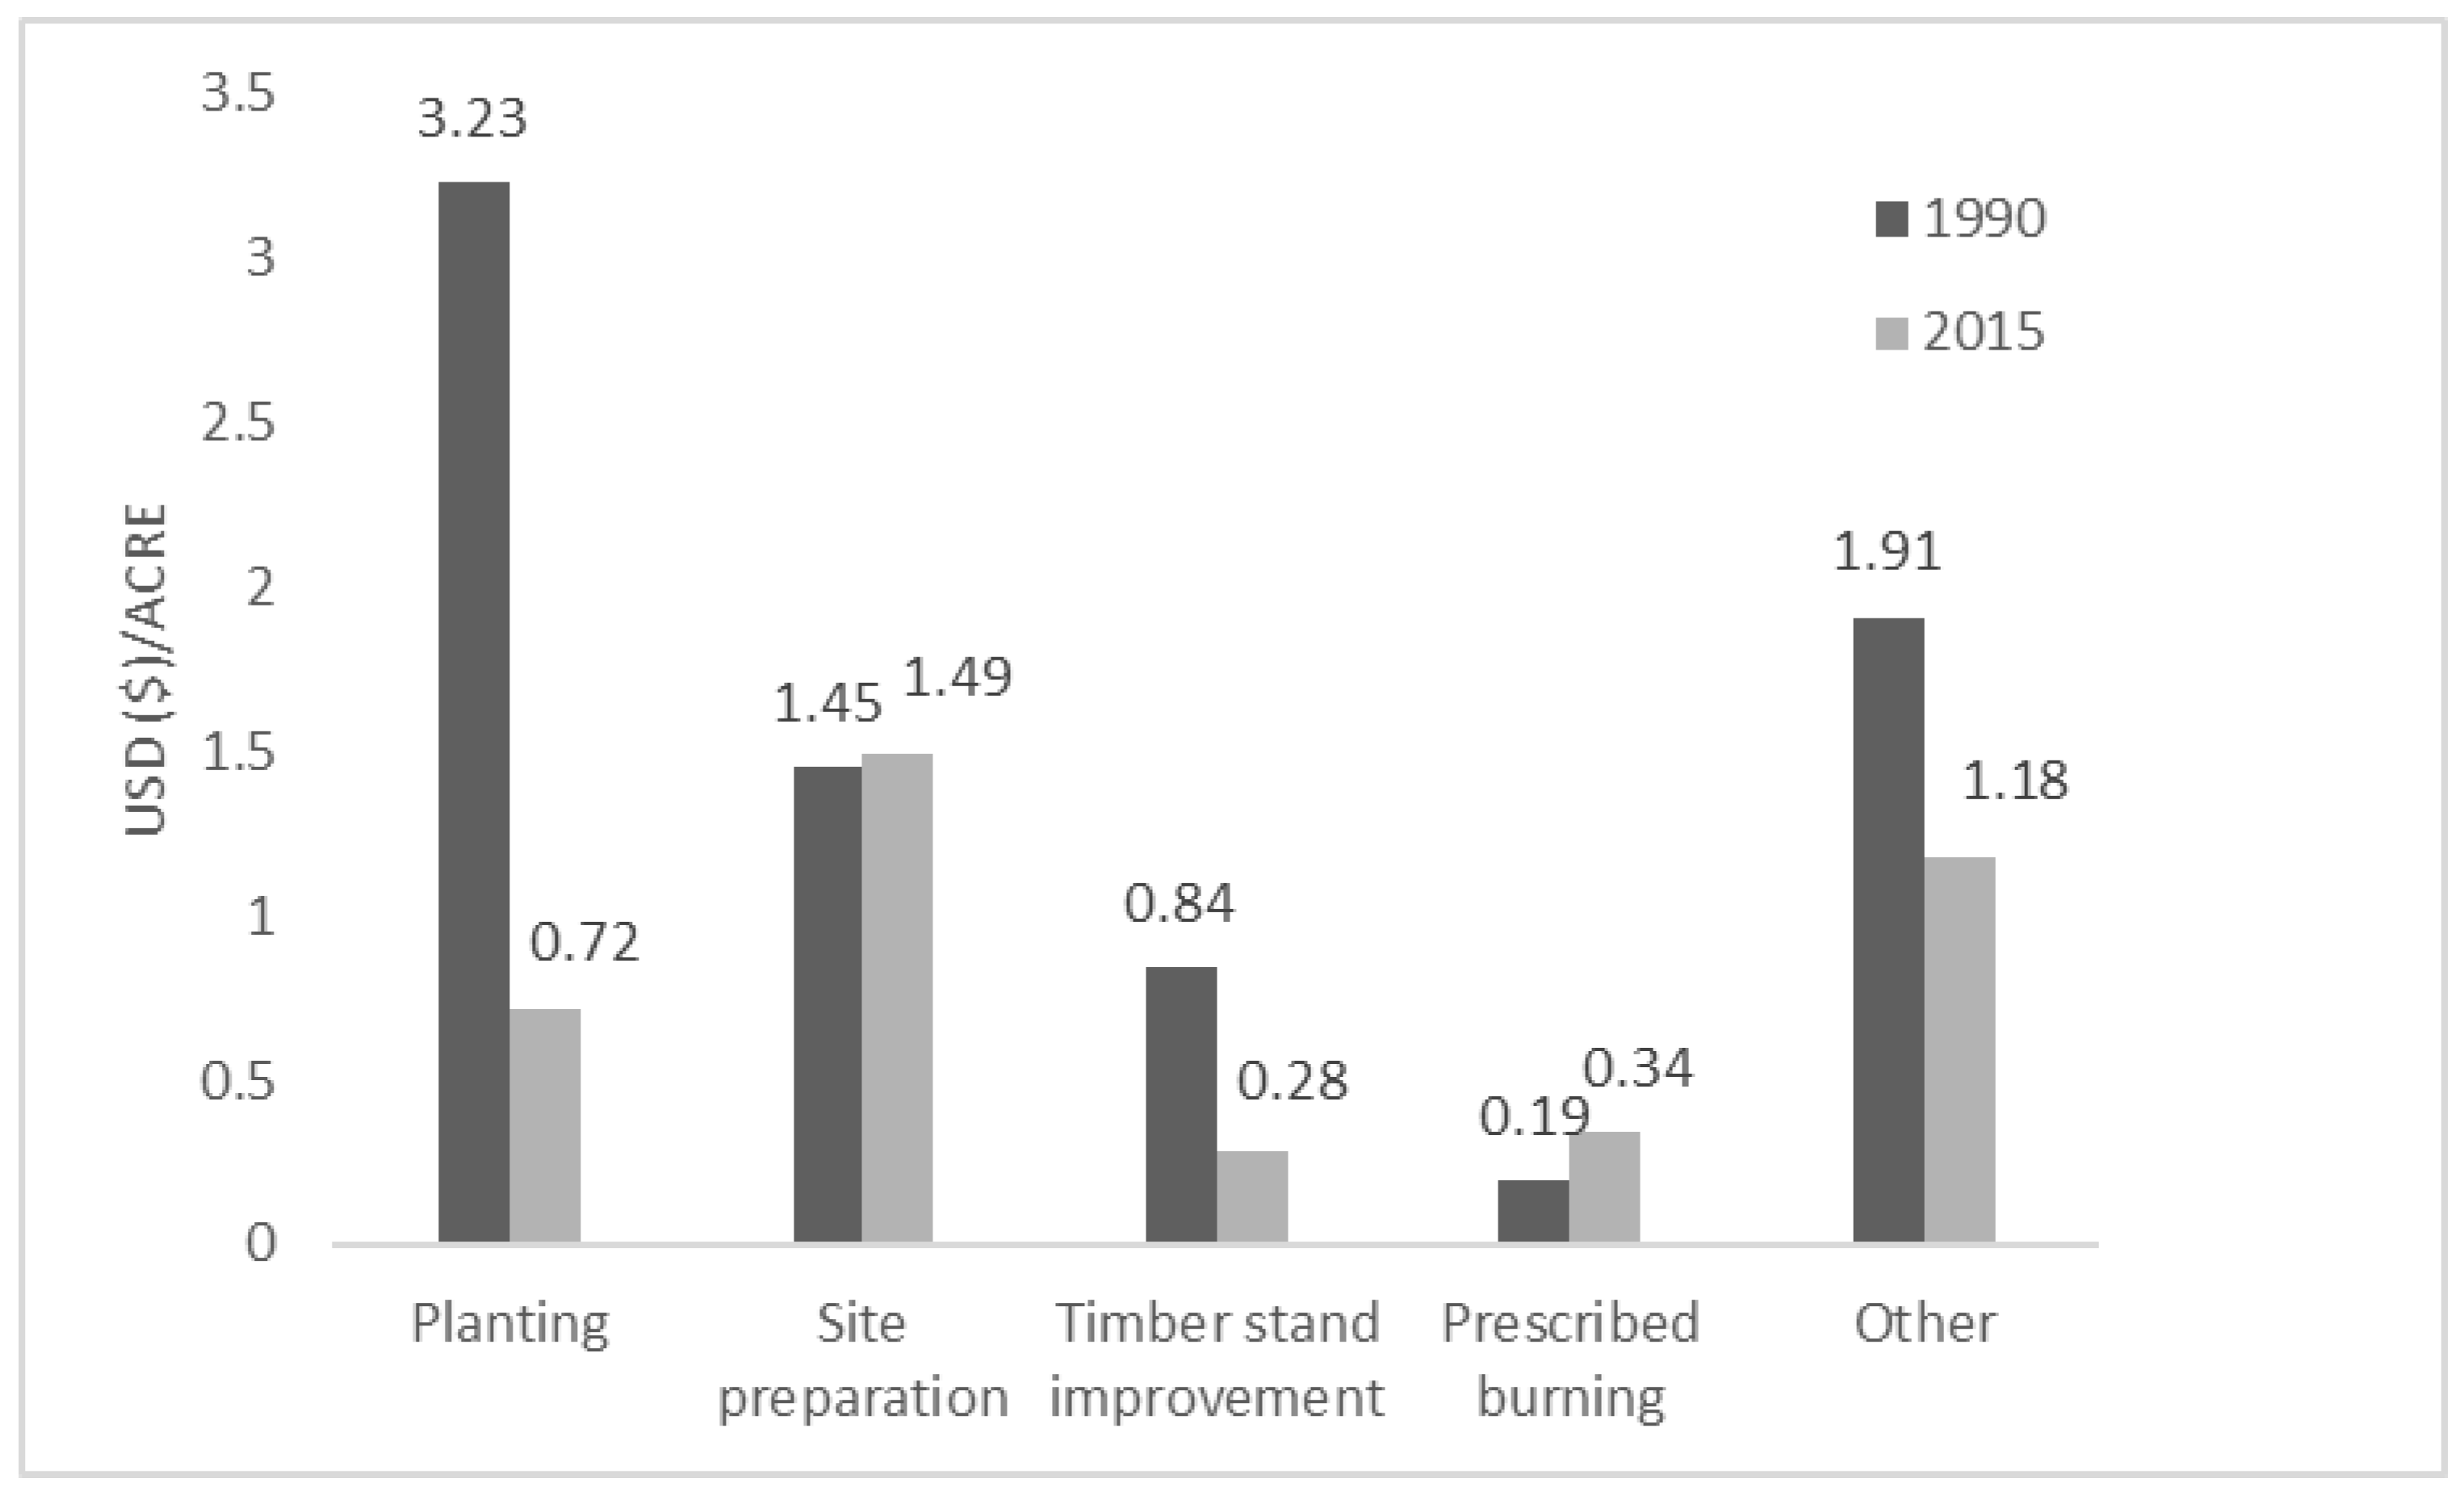
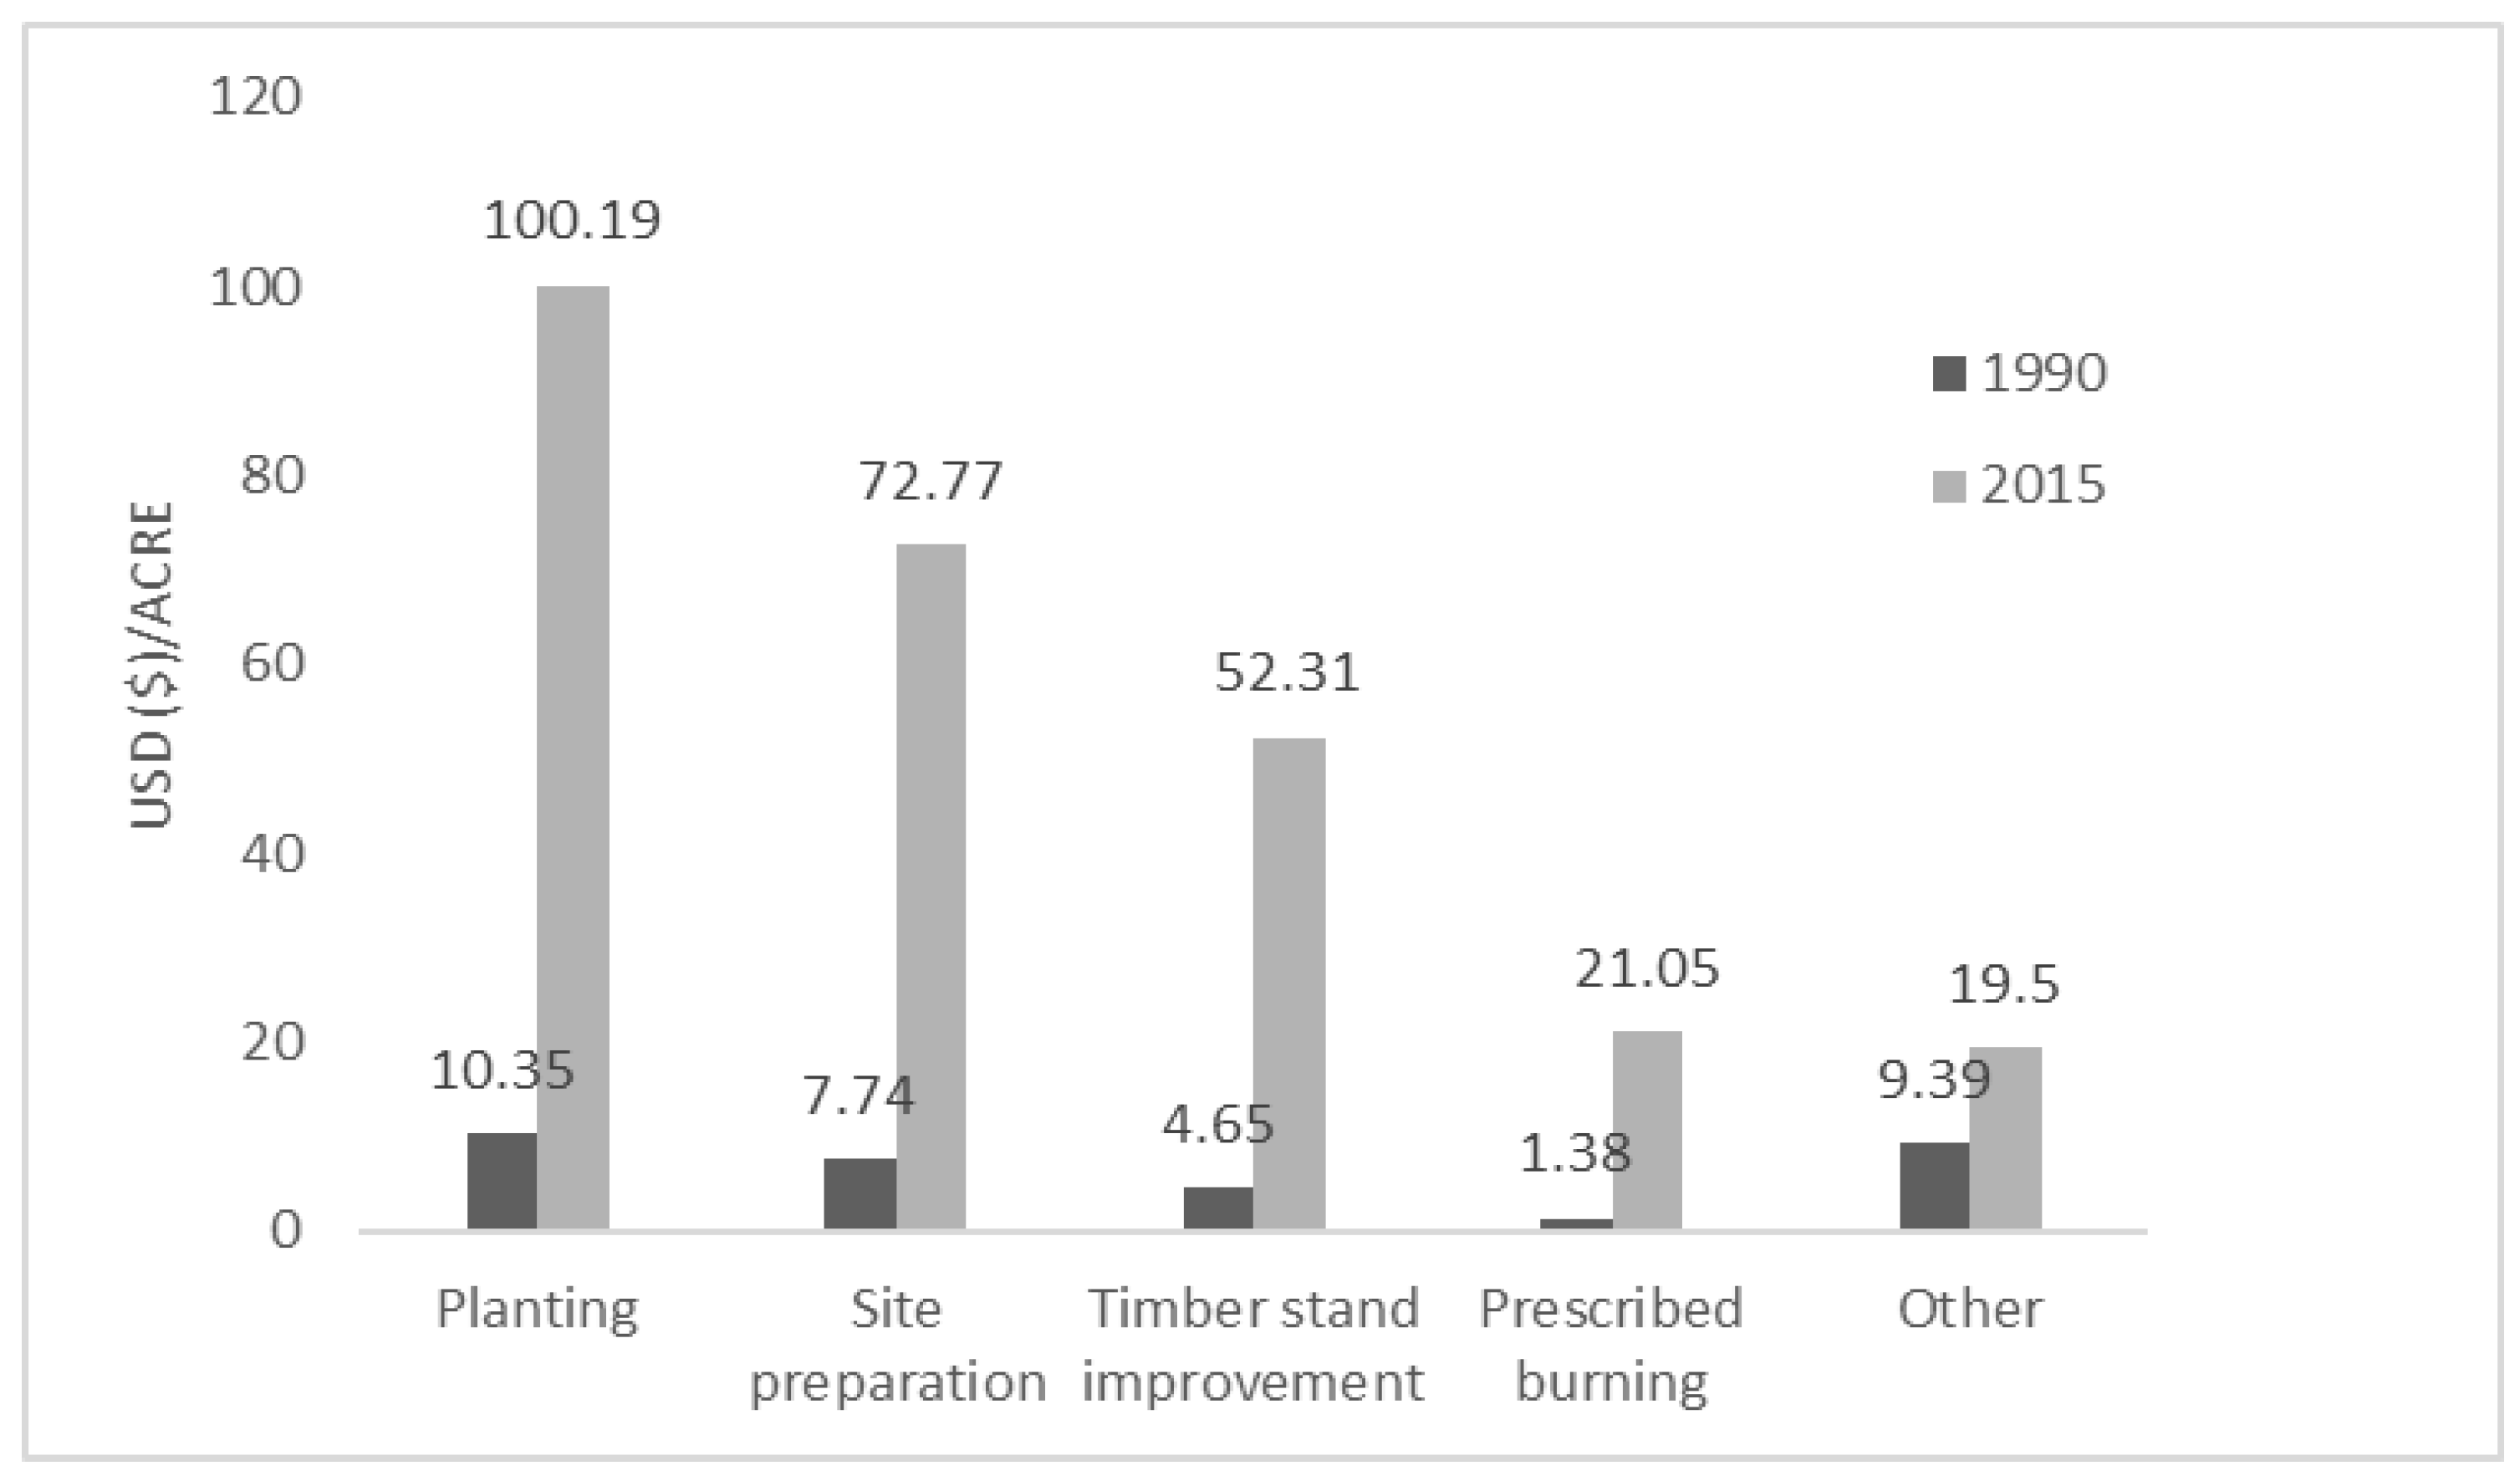
3.4. Timber Management Expenditures

After Property Taxes, Timber Management Expenditures represented the second highest category of the four expense categories in the 1990s study and the highest in the 2015 study. Planting was the highest reported (12.1%) Timber Management Expenditure in the 1990s, while site preparation was most often reported in 2015 (6.2%). The largest decrease in reporting between the two time periods was planting (8%), while site preparation increased only slightly (0.6%). Timber stand improvement, prescribed burning, and other timber management activities fell in the middle.
Mean expenditures reflected these decreasing reporting trends, with planting having the highest expenditures in the 1990s at $3.23 per acre and decreasing by $2.51 per acre in 2015 (Figure 5). By contrast, site preparation expenses increased by $0.04 per acre from the 1990s to 2015. With the exception of prescribed burning, which increased by $0.15 per acre, all other activities decreased in reported expenditures. The mean Timber Management Expenditures for landowners who incurred expenses in the survey year were dramatically higher than for the aggregate and change between both time periods was positive (Figure 6). Planting was the highest expenditure in the 1990s ($10.35/ac.), increasing to $100.19 per acre in 2015. Prescribed burning was the lowest reported expenditure in the 1990s ($1.38/ac.), increasing to $21.05 per acre in 2015. Other timber management activities had the lowest increase in expense ($10.11/ac.) between the time periods.

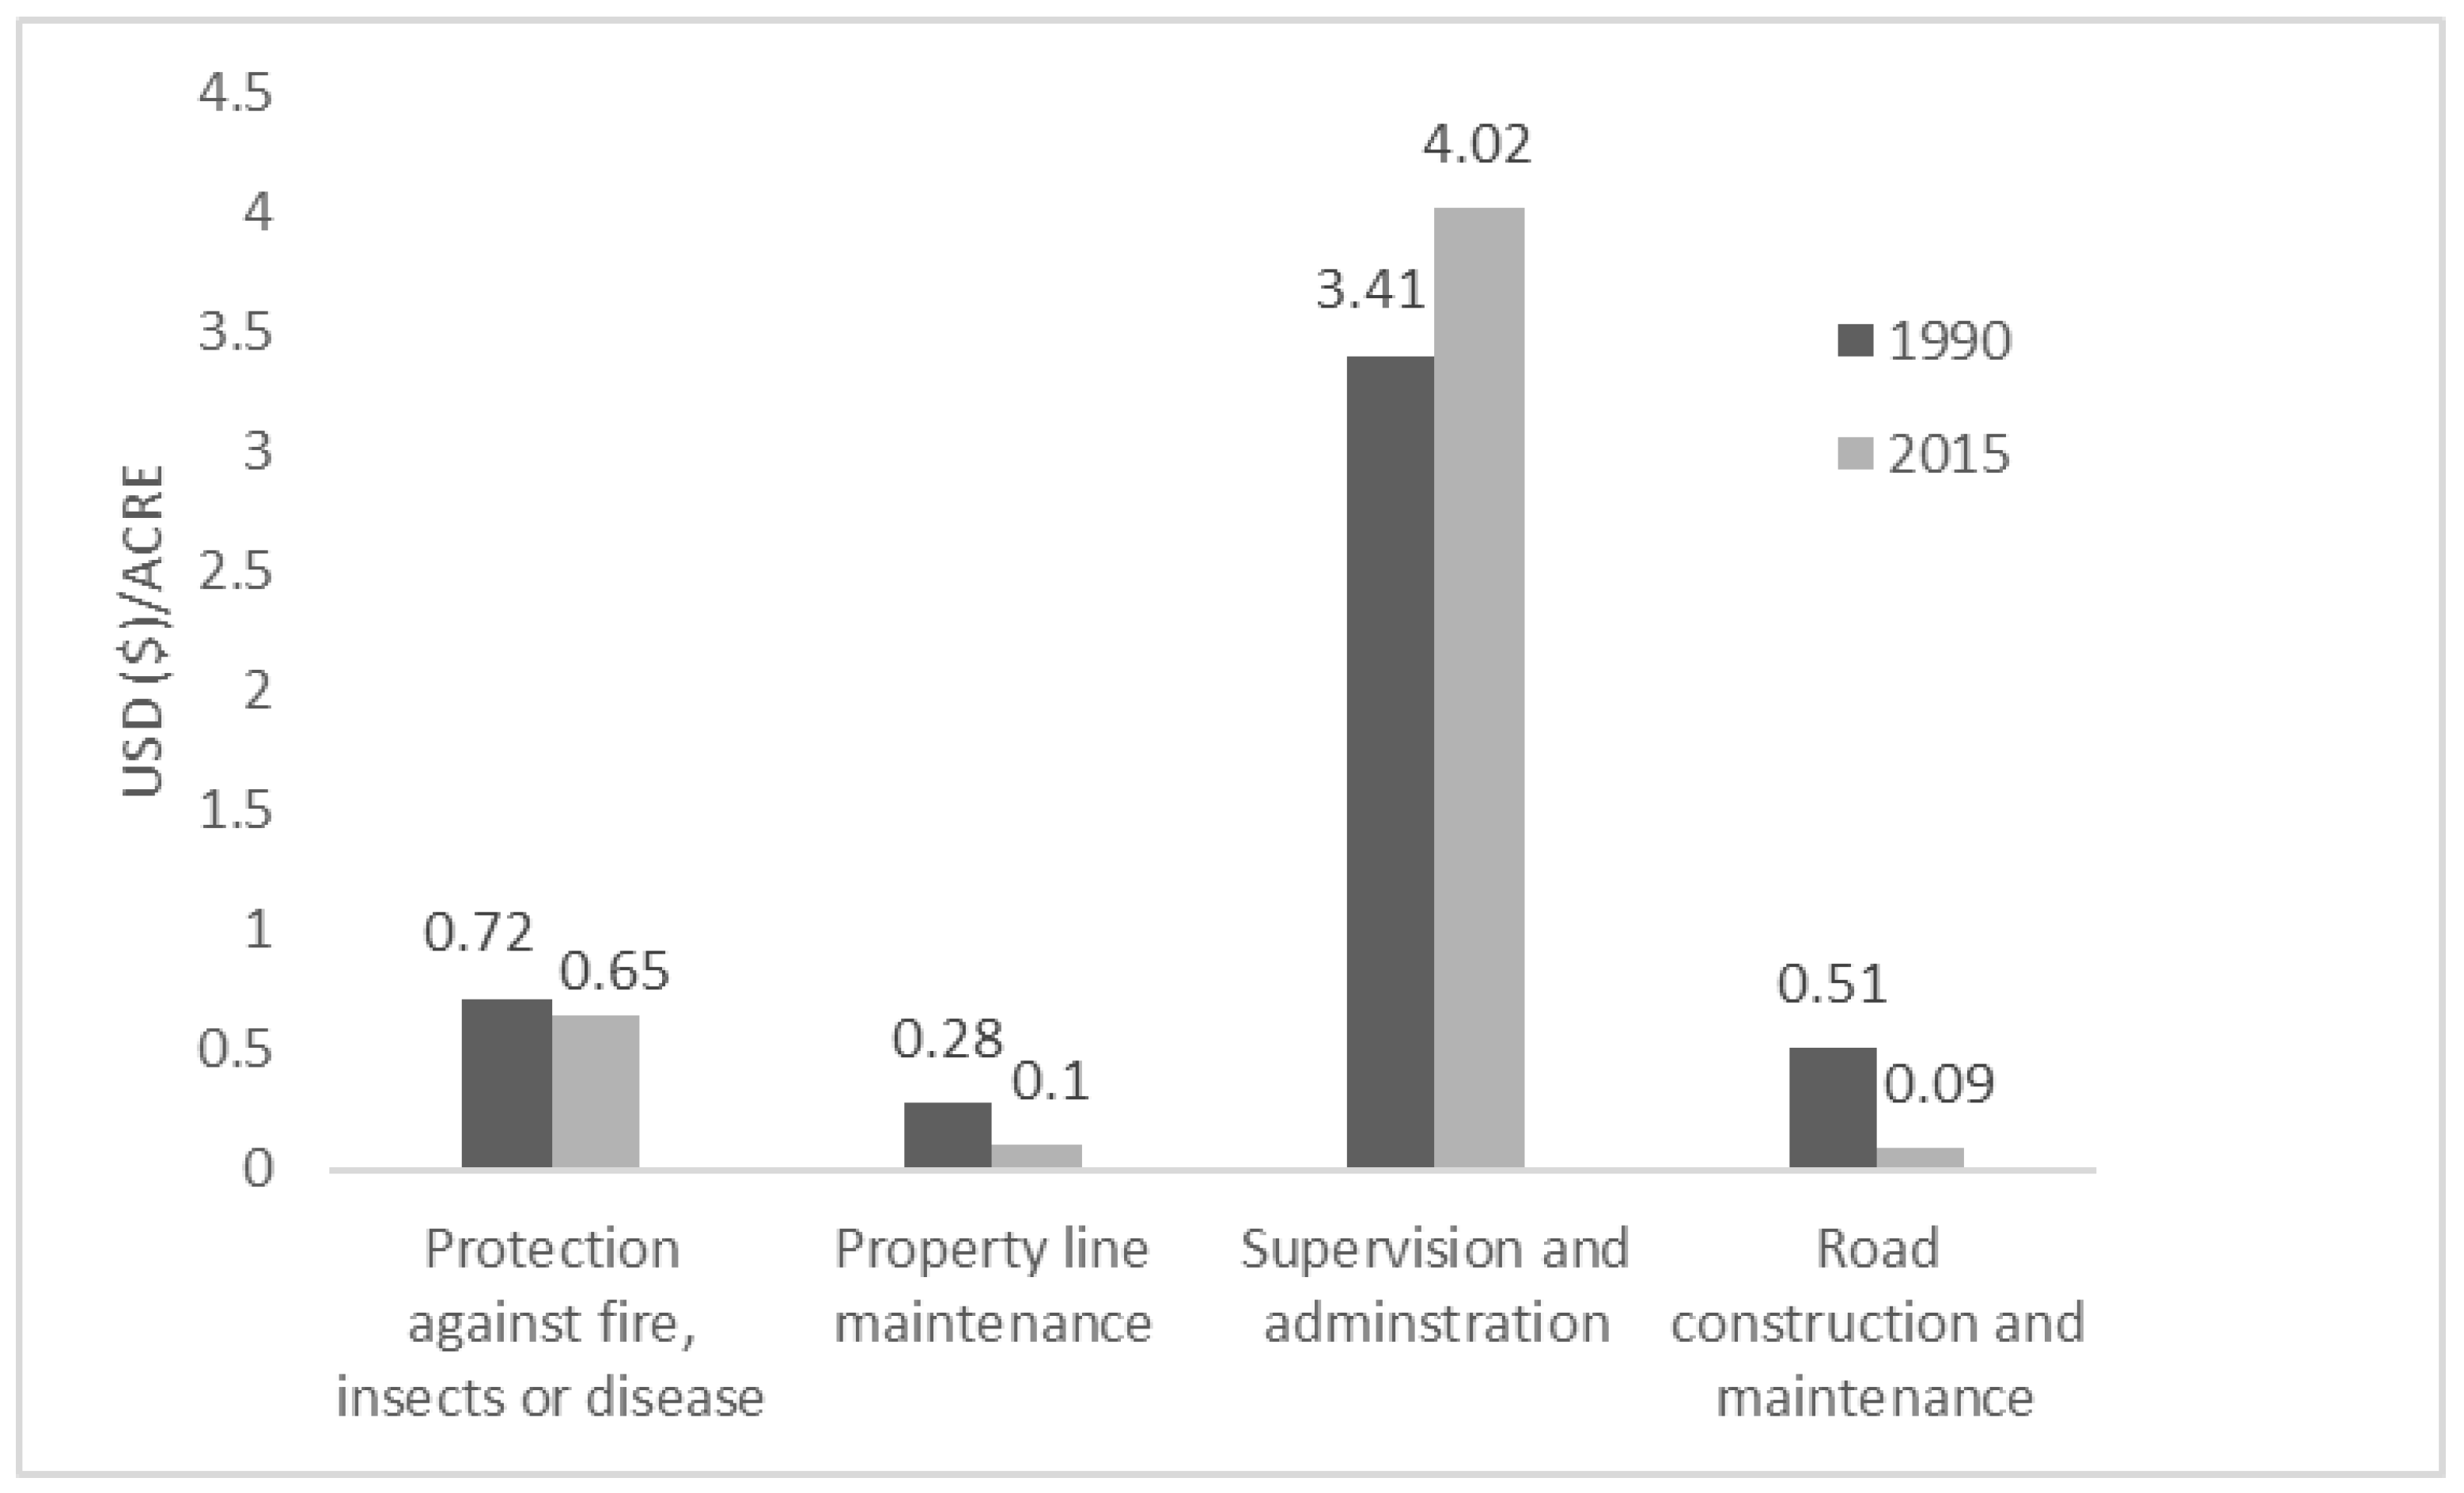
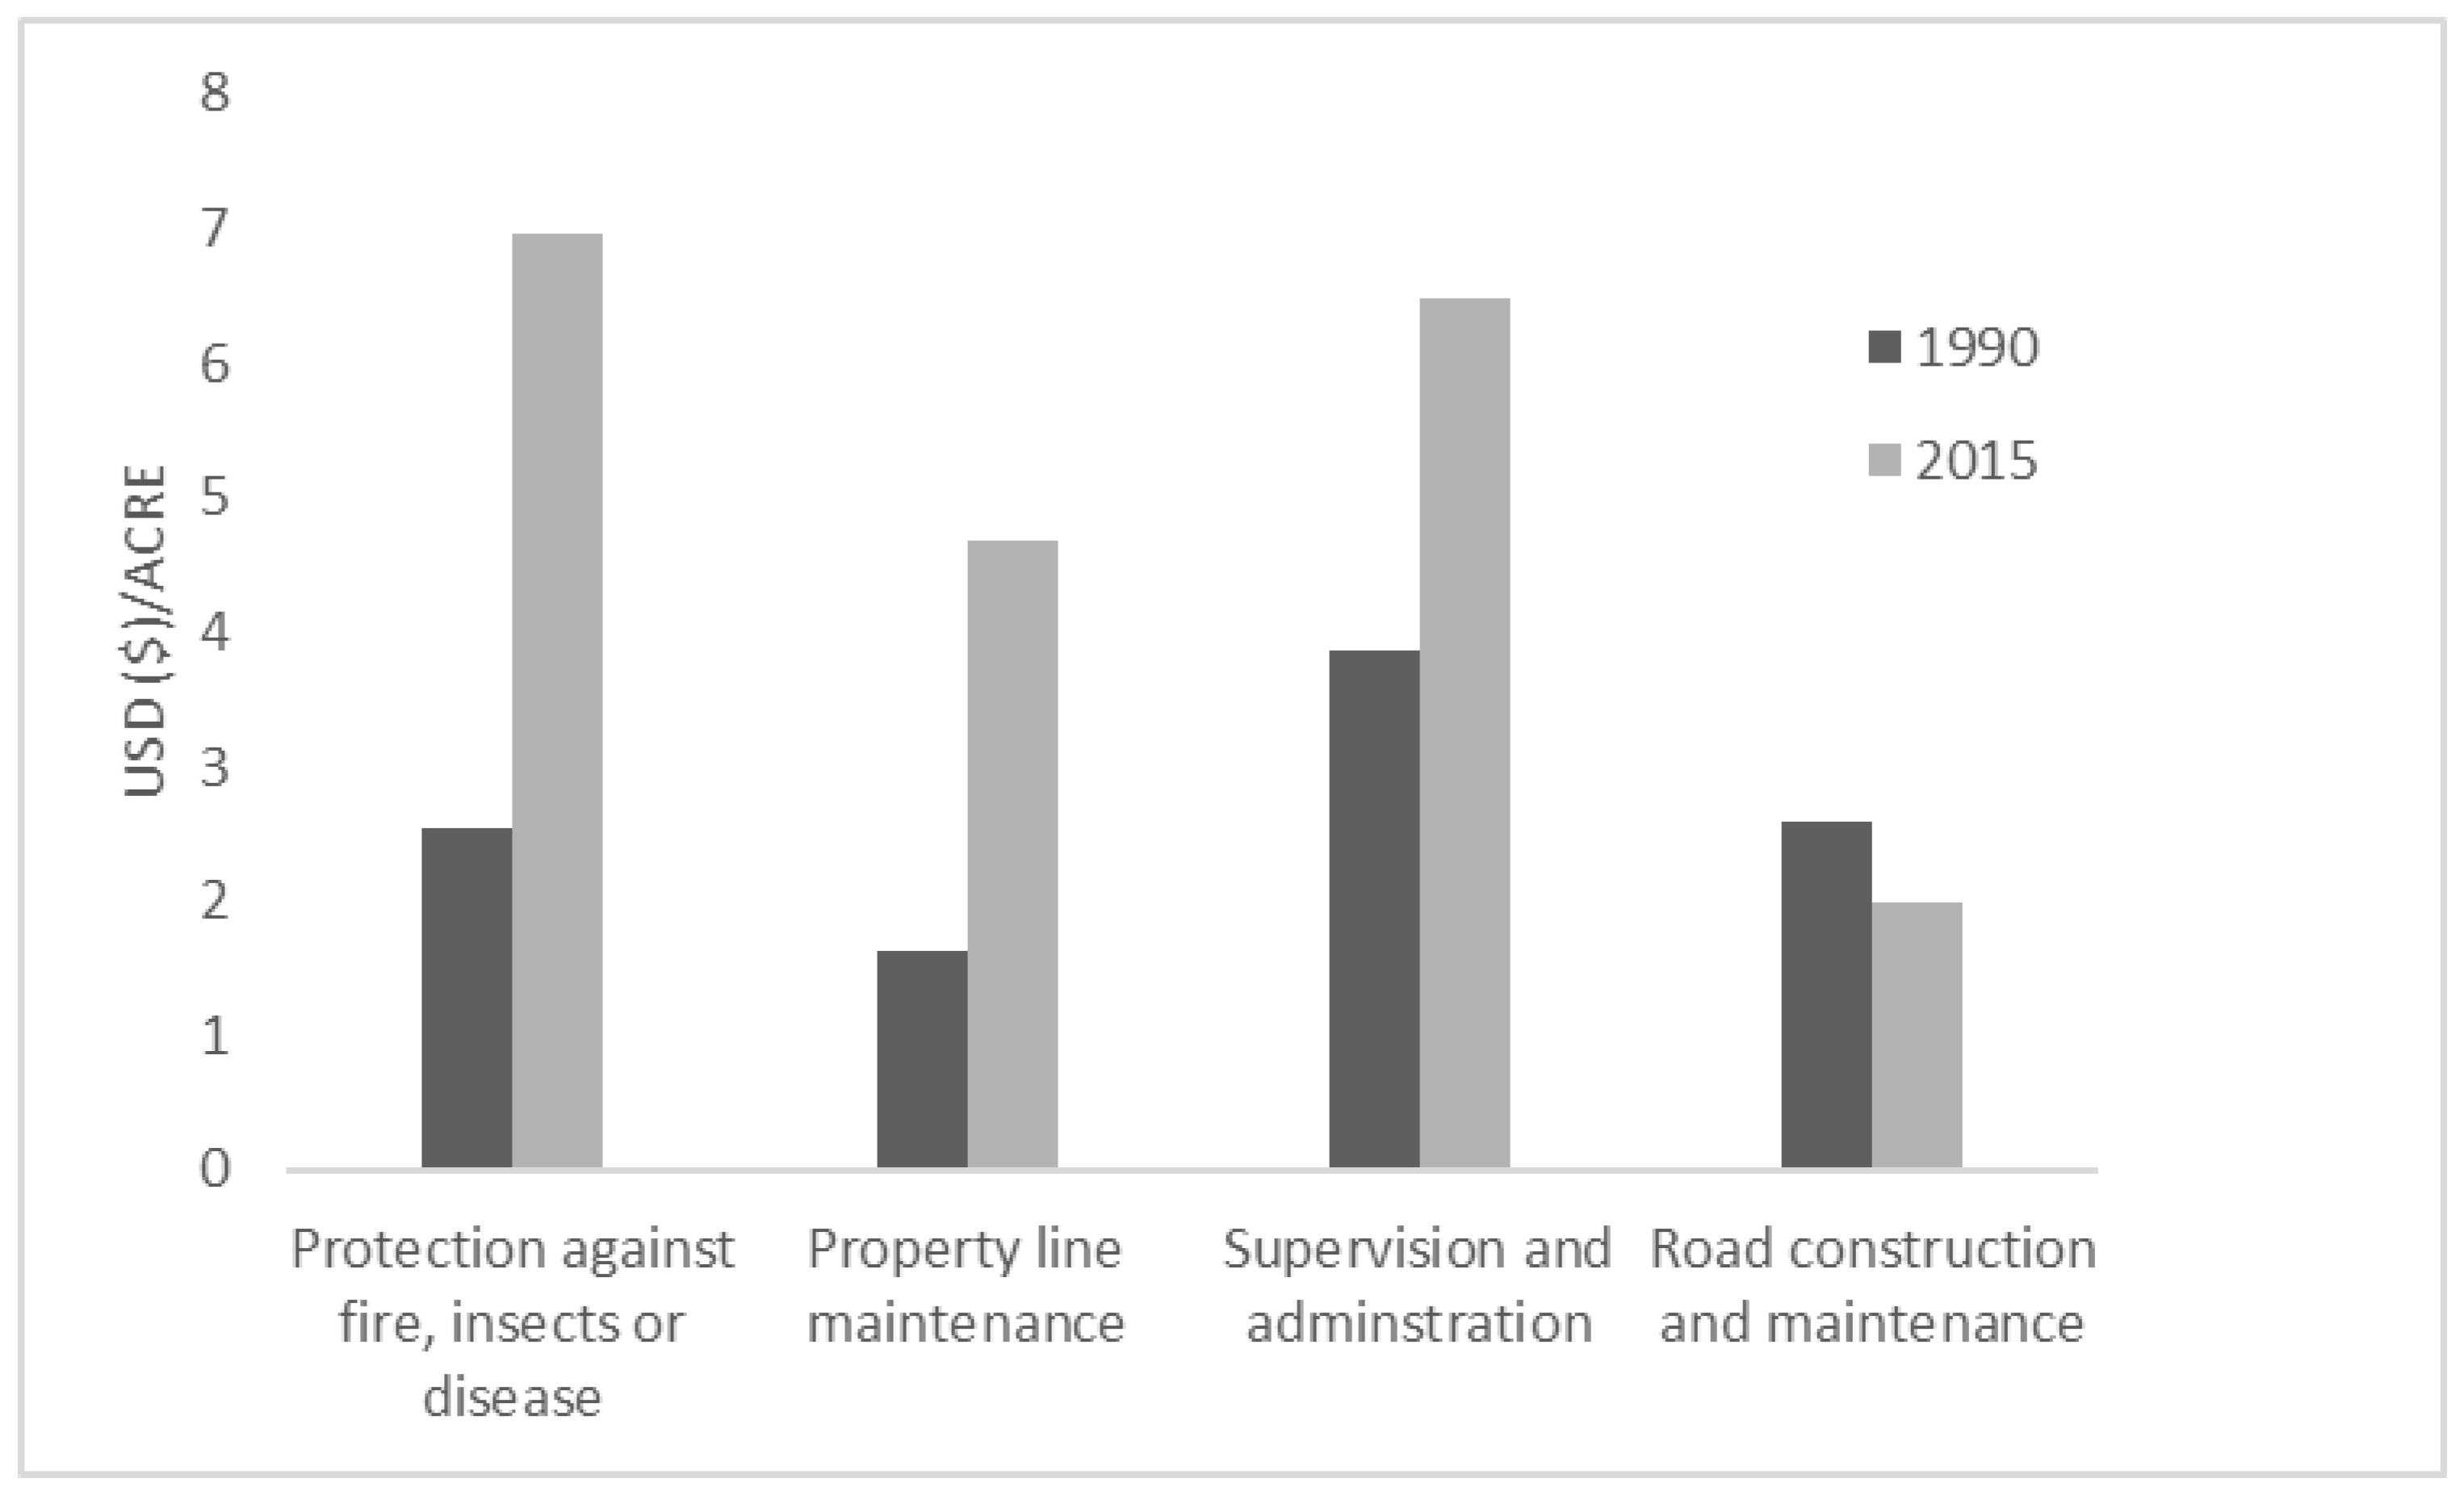
3.5. Other Management Expenditures

Overall, all activities in this category showed a steep drop in reporting between the two time periods. Supervision and administration were most often reported in the 1990s (12.3%), but fell to 6.3% in 2015, behind road construction and maintenance. While protection against fire, insects, or disease was least often reported for both time periods (7.9% in the 1990s and 2.3% in 2015), property line maintenance had the largest decrease in reported expenditures (12.1% to 5.4%).
In both periods (Figure 7), landowners tended to spend most on supervision and administration ($3.41/ac.), followed by protection against fire, insects, or disease ($0.72/ac.), property line maintenance ($0.28/ac.), and road construction and maintenance ($0.51/ac.). Road construction and maintenance had the greatest decrease of $0.42 per acre, while supervision and administration increased by $0.61 per acre. Other Management Expenditures demonstrated a more balanced response than Timber Management Expenditures with regards to mean expenditures only for landowners who incurred expenses in the survey year (Figure 8). Protection against fire, insects, or disease increased the most from $2.54 per acre in the 1990s to $6.96 per acre in 2015. Supervision and administration increased $2.63 per acre from $3.86 per acre. Meanwhile, road construction and maintenance were the only categories to decrease: $0.61 per acre in 2015 from $2.60 per acre in the 1990s.

4. Discussion and Conclusions

This study presented NIPF landowners’ management costs from the 1990s and 2015. The expenditure information provides an indication of the degree to which landowners were managing their forest land. Expenditure analysis is a descriptive approach to understanding forest landowner behavior because cost is a fundamental consideration in utility maximization of forest management decisions. In addition to timber management, expenditures are associated with maximizing benefits of wildlife management, aesthetics, and environmental stewardship, among other landowner objectives. We recognize the variety of influences on NIPF landowner behaviors (for example, emotionally based decisions), with decisions often involving a mix of individual and social drivers [35]. Further, landowners’ decision and behaviors of forest land management are also highly influenced by their motivations [36]. However, landowners allocating funds to enjoy their land to its maximum potential is an important consideration that should not be ignored.
Although this study did not analyze non-timber management, we found that a substantial portion of landowners were not involved in any timber management activities involving expenditures during either survey cycle. With the exception of Property Taxes, Fees for Professional Services, Timber Management Expenditures, and Other Management Expenditures were less frequently reported for 2015 than in the 1990s. This overall finding suggests low levels of purposive management during those tax years. A primary reason for this may be the decrease in timber prices over the last two decades, causing landowners who were once active in growing timber to exit the market. Prices have decreased due to changes in the forest industry as well as the housing crisis of the early 2000’s, which lowered the demand for wood [37].
Another explanation, and a future research direction examining causal factors, may be linked to decreasing parcel size between the data collection periods [38,39]. Decreasing parcel size results from parcelization of forest land due to urbanization and passing land to multiple heirs. Landowners holding smaller and fragmented pieces of land have limited management options due to lost economies of scale as per unit costs increase as parcel size decreases [22,40,41]. Further, their ownership interests may change with parcel size limitations. There is a direct positive relationship between parcel size and willingness to harvest, with landowners who have large parcels being more willing to harvest and engage in active timber management than those with smaller parcels [40]. Much research has shown that owners of small tracts tend to be less interested in timber management and more interested in recreation, aesthetics, and other non-timber objectives as their primary objectives than owners of large tracts [42,43,44].
Decreasing costs, as presented here, point to NIPF landowners’ forest management practices changing over time. Maggard and Barlow [20] reported similar expenditure trends. However, Maggard and Barlow’s [20] study aggregated data across Southern states and analyzed only the direct forest management expenditures. By contrast, this study was conducted only in Mississippi and examined additional factors such as costs associated with consulting fees, surveyor fees, and attorney fees. While the overall trend in decreasing costs can be interpreted as landowners not managing their forest land as intensively as in the past, Timber Management Expenditures increased over the study’s time period for those who were engaging in management activities. Increased expenditures for this group could be explained by landowners using costlier genetically superior tree seedlings for plantings or rising costs for prescribed burning. Also, the choice of planting methods varies depending upon the selection of bare root versus containerized seedlings and hand planting versus machine planting. The cost for the plantation of genetically superior seedlings coupled with the machine planting technique is higher than their counterparts. Finally, the large difference in Timber Management Expenditures may be related to increases in labor costs in real terms across the Southern region [45].
Another possible explanation for the overall decreasing trend in expenditures is likely related to timber prices. Demand for forest products have changed in the South during the timeframe of this study. Annual removals of forest products increased from 1953 to 1996 and remained high throughout the 1990s, however due to the recession starting in 2007, demand declined and has not reached pre-recession levels [46]. However, according to the American community survey (ACS), the median income of Mississippians increased from $29,120 to $43,441 during 1998–2015. By contrast, findings here demonstrate that investment in forest management activities has decreased, with many of the private, nonindustrial forest acres having little or no professional management. Basic practices such as regeneration after a harvest often become lacking [47]. Future studies should examine the relationship between income and expenditures on forest management. Besides the housing collapse and increasing income, more efficient supply lines and technological improvements have made it economically feasible to procure and utilize distant and low-cost forest products [32,48], which has at least partially resulted in the closure of pulp and paper mills in the state [49]. Decreasing demand for forest products has lowered prices which, in turn, may have an effect on landowner interest in forest land investment.
Results contribute to an understanding of how landowners are likely to invest. The per acre costs for prescribed burning, site preparation, and planting were $21.05, $72.77, and $100.19, respectively in 2015. By comparison, Maggard and Barlow’s [20] study found prescribed burning was $26.63 per acre, site preparation was $140.99 per acre, and planting ranged from $52 to $89 per acre, depending upon the planting method. This accounts for over half the investment spent on timber management and suggests that many landowners viewed planting and site preparation as the most important (or most necessary) management activities for investment. Again, due to the unavailability of raw data from the 1990s, tests for reliability could not be performed. Nonetheless, the qualitative benefits of the study are evident as an exploratory examination of timber expense trends which, in the future, could motivate a more rigorous procedure to observe statistical differences over time. Here, all categories, except Timber Management Expenditures, have some reliability because they fall between the range data (Table 4). Timber Management Expenditures in 2015 is drastically higher when compared to the 1990s, which may indicate sampling and/or measurement errors. Still, it provides descriptive information about the management activities.
A recent study conducted by Callaghan et al. [50] found that the annual percent cost for forestry practices of the southern U.S. from 1982 through 2016 has increased the most for prescribed burning, followed by timber cruising, precommercial thinning, and planting activities. Similarly, the cost of fire management across Canada has risen steadily since 1970 [51], while reforestation costs have increased substantially in European countries [52]. Further, Whiteman et al. [53] showed that forestry expenditures are influenced by the health of the national economy, with higher-income countries having higher expenditures than their counterparts. Notably, these expenses are directly related to timber production, either through enhancing timber growth or returns on timber sales, while other management activities accounted for a lower percentage of expenditures. Given that most of Mississippi’s forest land was owned by NIPF landowners, changes in parcel size and monetary transactions for forest land could have a profound effect on markets for management activities and the supply of forest products. For instance, Cubbage [54] notes that landowners owning small parcel sizes often utilize their forest land for benefits other than timber production because of economies of scale. As such, these landowners reduce the monetary transaction to manage the forest land [55]. As forest tract size harvested decreases, the cost per acre of treatment increases, especially for capital intensive mechanized harvesting methods [55,56,57]. The cost of production is increased due to diminished economies of scale and decreased investment in and completion of forest management activities by NIPF [58,59]. The impacts of the relationship between parcel size and monetary transactions on markets and management, and associated landowner adaptations to new economic conditions, is a topic for future research. In any case, periodically monitoring forest management related expenditures might be a reasonable indicator of future timber supply trends; for example, continuously increasing expenditures is indicative of a growing timber supply in the future. While this study is not an economic impact analysis, it illuminates trends in which landowner expenditures contribute directly and indirectly to economic activities and employment in the forestry sector.
Understanding the extent to which landowners incur expenses provides a general indication of forest management activity to inform forestry policy and programs. For example, a landowner typology based on expenditure data can be employed to target education and policies to different landowner groups across a gradient of activeness. In addition, such information—on an annual or biennial basis—can help decision makers develop legislation and conservation programs to encourage investment in reforestation and site preparation as well as participation in low-interest loans, tax incentives, and forest insurance programs. A tax incentive, for example, may entail active NIPFs (possibly even those managing for personal use) deducting some amount of taxable reforestation costs in addition to normally deductible investment expenses. Such policy might target less active managers to motivate them towards a higher level of activity.
Another example of a policy implication addresses casualty loss in the context of increasingly variable climates. The southern U.S. is prone to destructive winds, flooding, wildfire, and pest outbreaks. A landowner typology, based on regularly collected expenditure and income data, can identify groups of landowners at the margin of active and less active management. Assuming that some landowners are less active due to perceptions of weather and financial risks, a refigured casualty loss formula can help move those landowners at the margin into the more active part of the spectrum. As with current policy, a reformulated policy can mitigate risk, encourage investment, and promote active engagement, but for a larger number of deserving landowners so that they continue to provide forest benefits for society.
This article leads to additional future research possibilities. First, future surveys might include questions about forest composition, location of forest land, management objectives, and age class distributions in order to assess potential causes for differences in management intensity and expenditures (however, this would dramatically change the purpose of the survey when the sponsor is only interested in calculating ad valorem taxes). Similarly, future surveys should ask landowners to detail each parcel they own so that parcelization could be examined. Second, future research should collect both cost and revenue data for each management activity. This research was limited to cost per acre of timber management activities. Also, this research does not include a comparison of real price increases. Future studies should consist of a comprehensive comparison of forest management activities’ expenditure by accounting real rates of change. Third, this information would be interesting when compared with NIPF landowner expenditures throughout the Southeast, as well as other parts of the United States. In addition, besides timber management activities, non-timber forest management activities should be included in future research. This data could be compared with other sources, such as cost-share program participation, timber sales statistics (e.g., quantity and value of harvested timber), reported forest ad-valorem taxes, involvement with consulting foresters (e.g., time, fees, and forest area coverage by the consultant), seedlings supplies (e.g., number and type of seedling planted in forest land), timber harvesting (e.g., quantity of thinning and timber cut), and landowners’ participation in forestry association meetings. Together, these data could be used to better analyze the active involvement of landowners in forest management practices.
With periodic landowner expenditure surveys across the region or nation, such comparative research would provide timber supply modelers with key information for the prediction of future timber supply. Finally, future assessments should incorporate measures for management activities in addition to activities characterized by a financial investment. Such activities may involve little to no costs and include small scale do-it-yourself stand management (e.g., chainsaw thinning) or recreation-based prescriptions (e.g., food plots). Inclusion of these activities would improve understanding about the association between expenditures and management intensity.
Although this study’s response rate reflects that of similar forest landowner research in the southern U.S. [19,30,31,32], future research must address the issue of low response rates. A large number of responses are important for an accurate representation of forest management expenditures. The sample frame must be updated with corrected addresses and at least some of the research could be validated by collecting input at forest landowner meetings (which are common throughout the state). A telephone interview survey could be considered as an approach to increasing response rates, although such an approach is not without drawbacks. Costs of accessing cell phones as well as landlines have decreased, making telephone surveys more practical than in the past; however, telephone surveys also suffer from lack of completion because contacts are overwhelmed with marketing calls and often do not answer unknown numbers. Survey administrators would have to ask respondents to access forest records that may not be easily available. A multi-modal approach incorporating mail, telephone, and online surveys might also improve response rates. The success of a survey is also dependent on the sampling frame. The public list that was used in this study is the best list available; however, it could potentially be supplemented with the private membership list of the statewide forest landowner organization. Besides this, potential participants could be selected based on lists maintained by private firms, although such lists can also have an excessive amount of bad addresses.
As well, monetary or gift card lotteries have been shown to increase response rates [60]. The project sponsor, a state agency, would have to approve of the use of an incentive, which is unlikely because the original objective of the survey is not research, but to determine a tax function. Regardless of the approach, response rate also depends on the types and nature of the questions in the survey. For example, the questionnaire could be further improved by incorporating more closed-ended rather than open-ended questions. Respondents may find it easier to complete closed-ended questions [61]. As well, qualitative input could help improve the survey design and wording employed in the questions. Finally, it is important to remember that timber prices also likely play an important role in survey response, which could be measured using a follow-up telephone non-response bias survey if funds were available.

5. Study Limitations

Two major constraints limit this study’s findings. First, the lack of raw data for the 1990s studies meant that we were unable to statistically compare the means between the time periods. We attempted to partially compensate for this by providing standard errors, ranges, and confidence intervals for the 2015 data. Timber Management Expenditures (e.g., planting and site preparation costs) might have been overestimated; however, costs vary based on selection of seed and planting techniques and site preparation approaches, including the use of genetically superior seedling and chemical or mechanical site preparation, which might overestimate the planting costs. Therefore, specific questions about prescriptions must be asked in future surveys. Second, the low response rates limit the generalizability of the findings, although a low response is also an indicator of management inactivity. Future surveys must be designed to encourage better participation and may include modifications to the written survey or the addition of telephone and/or online surveys. Surveys should consist of short and precise questions, sending reminders/follow up survey questionnaires, and providing incentives to the respondents. Some evidence exists to suggest that the color of a mail questionnaire influences response rates [62]. Despite the drawbacks discussed above, telephone surveys have been cited as leading to higher response rates compared to mail surveys [63]. A telephone survey can relatively quickly cover a wide geographic area and produce good data quality. The online survey is also cost-effective and can be more convenient for some respondents (this has changed over time, with most landowners comfortable with computer applications) [64].

Author Contributions

Conceptualization, I.M.; Data curation, S.G.C.; Formal analysis, S.G.C.; Funding acquisition, I.M.; Methodology, J.H.; Project administration, I.M.; Supervision, J.G. and J.H.; Visualization, J.G.; Writing—original draft, S.G.C.; Writing—review & editing, J.G., I.M., and J.H.

Funding

This research was funded by the Mississippi Department of Revenue.

Acknowledgments

The authors are grateful to the Forest and Wildlife Research Center, Mississippi State University, and the Mississippi Department of Revenue for providing necessary funding for this research. The authors would like to express sincere thanks to all Mississippi landowners who provided their valuable time to respond to the survey.

Conflicts of Interest

The authors declare no conflict of interest.

References

  1. Oswalt, S.N.; Miles, P.D.; Pugh, S.A.; Smith, W.B. Forest Resources of the United States, 2017: A Technical Document Supporting the Forest Service 2020 Update of the RPA Assessment; General Technical Report; USDA Forest Service: Washington, DC, USA, 2018.
  2. Moffat, S.O.; Cubbage, F.W.; Cascio, A.J.; Sheffield, R.M. The future of forest management on NIPF lands in the South: Results of an expert opinion survey. In Proceedings of the 1998 Southern Forest Economics Workshop; Abt, K., Abt, R.C., Eds.; Southern Research Station: Research Triangle Park, NC, USA, 1998; pp. 17–24. [Google Scholar]
  3. Mississippi Forestry Commission. Mississippi’s Assessment of Forest Resources and Forest Resource Strategy. 2010; 10p. Available online: https://www.mfc.ms.gov/sites/default/files/MS_Assessment_Resource_Strategy_2010.pdf (accessed on 16 February 2019).
  4. Oswalt, S.N. Mississippi’s Forests, 2013; Research Bulletin RB-SRS-204, Southern Research Station; USDA Forest Service: Asheville, NC, USA, 2015; 81p.
  5. Butler, B.J.; Hewes, J.H.; Dickinson, B.J.; Andrejczyk, K.; Butler, S.M.; Markowski-Lindsay, M. Family forest ownerships of the United States, 2013: Findings from the USDA forest service’s National Woodland Owner Survey. J. For. 2016, 114, 638–647. [Google Scholar] [CrossRef]
  6. Mutandwa, E.; Grala, R.K.; Grado, S.C.; Munn, I.A. Family forest owners’ familiarity with conservation programs in Mississippi, USA. Small Scale For. 2016, 15, 303–319. [Google Scholar] [CrossRef]
  7. Amacher, G.S.; Conway, M.C.; Sullivan, J. Econometric analyses of non-industrial forest landowners: Is there anything left to study? J. For. Econ. 2003, 9, 137–164. [Google Scholar] [CrossRef]
  8. Finley, A.O.; Kittredge, D.B., Jr.; Stevens, T.H.; Schweik, C.M.; Dennis, D.C. Interest in cross-boundary cooperation: Identification of distinct types of private forest owners. For. Sci. 2006, 52, 10–22. [Google Scholar]
  9. Kluender, R.A.; Walkingstick, T.L. Rethinking how non-industrial landowners view their lands. South. J. Appl. For. 2000, 24, 150–158. [Google Scholar] [CrossRef]
  10. Nakajima, T.; Shiraishi, N.; Hidesato, K.; Matsumoto, M. A method to maximize forest profitability through optimal rotation period selection under various economic, site and silvicultural conditions. N. Z. J. For. Sci. 2017, 47, 4. [Google Scholar] [CrossRef]
  11. Upadhaya, S.; Dwivedi, P. The role and potential of blueberry in increasing deforestation in southern Georgia, United States. Agric. Syst. 2019, 173, 39–48. [Google Scholar] [CrossRef]
  12. Jacobson, M. Keeping Records of Forest Management Activities. Penn State Cooperative Extension; The Pennsylvania State University: University Park, PA, USA, 2009; p. 10. [Google Scholar]
  13. Arano, K.G.; Munn, I.A. Non-Industrial Private Forest Landowners’ Forest Management Activities and Expenditures in Mississippi, 1998–2000 Data; Bulletin FO-249 Mississippi State University; Forest and Wildlife Research Center: Starkville, MS, USA, 2004; p. 13. [Google Scholar]
  14. Moak, J.E. Forest practices cost trends in the south. South. J. Appl. For. 1982, 6, 130–132. [Google Scholar] [CrossRef]
  15. Kuhn, J.F., III. Cost Trends of Selected Forest Management Activities in the Southern United States from 1961–1982. Master’s Thesis, Mississippi State University, Starkville, MS, USA, 1984; 48p. [Google Scholar]
  16. Dubois, M.R.; Watson, W.F.; Straka, T.J.; Belli, K.L. Costs and cost trends for forestry practices in the South. For. Farmer. 1991, 50, 26–32. [Google Scholar]
  17. Dubois, M.R.; McNabb, K.; Straka, T.J.; Watson, W.F. Costs and cost trends for forestry practices in the South. For. Landowner 1999, 58, 3–8. [Google Scholar]
  18. Belli, M.L.; Straka, T.J.; Dubois, M.R.; Watson, W.F. Costs and cost trends for forestry practices in the South. For. Farmer. 1993, 52, 25–31. [Google Scholar]
  19. Arano, K.G.; Cushing, T.L.; Munn, I.A. Forest management expenses of Mississippi’s non-industrial private forest landowners. South. J. Appl. For. 2002, 26, 93–98. [Google Scholar] [CrossRef]
  20. Maggard, A.; Barlow, R. 2016 costs and trends for southern forestry practices. For. Landowner 2017, 76, 31–39. [Google Scholar]
  21. Oswalt, S.N.; Smith, W.B. U.S. Forest Resource Facts and Historical Trends. FS-1035; USDA Forest Service: Washington, DC, USA, 2014.
  22. Conner, R.C.; Hartsell, A.J. Forest area and conditions. In Southern Forest Resource Assessment; General Technical Report GTR-SRS-53, Southern Research Station; Wear, D.N., Greis, J.G., Eds.; USDA Forest Service: Asheville, NC, USA, 2002; 635p. [Google Scholar]
  23. Alabama Cooperative Extension System. Cost for Common Forestry Practices in the South. 2018. Available online: www.aces.edu/natural-resources/forestry/economics-management/forestrypractice.php (accessed on 21 October 2018).
  24. Kingsley, N.P.; Birch, T.W. The Forest-Land Owners of New Hampshire and Vermont; Research Bulletin RB-NE- 51, Northeastern Forest Experiment Station; USDA Forest Service: Upper Darby, PA, USA, 1977; 47p.
  25. Thompson, M.T. A Forested Tract-Size Profile of Florida’s NIPF Landowners; Res. Pap. RP-SRS-15, Southern Research Station; USDA Forest Service: Asheville, NC, USA, 1999; 10p.
  26. Adams, D.M.; Hayes, R.W.; Dutrow, G.F.; Barber, R.F.; Vasievich, J.M. Private investment in forest management and the long-term supply of timber. Am. J. Agric. Econ. 1982, 64, 232–241. [Google Scholar] [CrossRef]
  27. Rogers, W.R.; Munn, I.A. Forest management intensity: A comparison of timber investment management organizations and industrial landowners in Mississippi. For. Policy Econ. 2003, 27, 83–91. [Google Scholar] [CrossRef]
  28. Dillman, D.A.; Smyth, J.D.; Christina, L.M. Internet, Mail, and Mixed-Mode Surveys: The Tailored Design Method, 3rd ed.; John Wiley and Sons: Hoboken, NJ, USA, 2009; 499p. [Google Scholar]
  29. Nagubadi, R.V.; Zhang, D. Determinants of timberland use by ownership and forest type in Alabama and Georgia. J. Agric. Appl. Econ. 2005, 37, 173–186. [Google Scholar] [CrossRef]
  30. Khanal, P.N.; Grebner, D.L.; Munn, I.A.; Grado, S.C.; Grala, R.K.; Henderson, J.E.; Measells, M.K. Nonindustrial private forest landowner beliefs toward climate change and carbon sequestration in the Southern United States. J. For. 2016, 114, 524–531. [Google Scholar] [CrossRef]
  31. Pokharel, R.; Grala, R.K.; Grebner, D.L. Woody residue utilization for bioenergy by primary forest products manufacturers: An exploratory analysis. For. Policy Econ. 2017, 85, 161–171. [Google Scholar] [CrossRef]
  32. Pokharel, R.; Grala, R.K.; Grebner, D.L.; Grado, S.C. Factors affecting utilization of woody residues to produce bioenergy in the southern United States. Biomass Bioenergy 2017, 105, 278–287. [Google Scholar] [CrossRef]
  33. Armstrong, J.S.; Overton, T.S. Estimating nonresponse bias in mail surveys. J. Mark. Res. 1977, 14, 396–402. [Google Scholar] [CrossRef]
  34. Butler, B.J. Family Forest Owners of the United States, 2006; General Technical Report GTR-NRS-27, Northern Research Station; USDA Forest Services: Newtown Square, PA, USA, 2008; 72p.
  35. Sanfey, A.G. Social decision-making: insights from game theory and neuroscience. Science 2007, 318, 598–602. [Google Scholar] [CrossRef] [PubMed]
  36. Upadhaya, S.; Dwivedi, P. Blue over green? Defining typologies of rural landowners growing blueberry in place of forests in Georgia, United States. Hum. Ecol 2019, 1–11. [Google Scholar] [CrossRef]
  37. Hodges, D.G.; Hartsell, A.J.; Brandeis, C.; Brandeis, T.J.; Bentley, J.W. Recession effects on the forests and forest products industries of the South. For. Prod. J. 2012, 61, 614–624. [Google Scholar] [CrossRef]
  38. Mundell, J.; Taff, S.; Kilgore, M.; Snyder, S. Assessing Trends in Forest Parcelization and Development in Minnesota: An Itasca County Case Study; University of Minnesota: St. Paul, MN, USA, 2007. [Google Scholar]
  39. Hatcher, J.E., Jr.; Straka, T.J.; Greene, J.L. The size of forest holding/parcelization problem in forestry: A literature review. Resources 2013, 2, 39–57. [Google Scholar] [CrossRef]
  40. Mundell, J.; Taff, S.; Kilgore, M.; Snyder, S. Using real estate records to assess forest land parcelization and development: A Minnesota case study. Landsc. Urban Plann. 2010, 94, 71–76. [Google Scholar] [CrossRef]
  41. Kilgore, M.A.; Snyder, S.A. Exploring the relationship between parcelization metrics and natural resource managers’ perceptions of forest land parcelization intensity. Landsc. Urban Plann. 2016, 149, 43–48. [Google Scholar] [CrossRef]
  42. Butler, B.J.; Leatherberry, E.C. America’s family forest owners. J. For. 2004, 102, 4–9. [Google Scholar] [CrossRef]
  43. Londo, A.M.; Grebner, D.L. Economies of scale and forest management in Mississippi. In Proceedings of the 12th Biennial Southern Silvicultural Research Conference; Connor, K.F., Ed.; General Technical Report GTR-SRS-71, Southern Research Station; USDA Forest Service: Asheville, NC, USA, 2004; 594p. [Google Scholar]
  44. Wear, D.N.; Greis, J.G. Southern Forest Resource Assessment; General Technical Report, Southern Research Station-053; USDA Forest Service: Asheville, NC, USA, 2013; 635p.
  45. Bair, L.S.; Alig, R.J. Regional Cost Information for Private Timberland Conversion and Management; General Technical Report GTR-PNW-684, Pacific Northwest Research Station; USDA Forest Service: Portland, OR, USA, 2006; 26p.
  46. Hannah, M.J.; Leslie, T. Historical Perspective on the Relationship between Demand and Forest Productivity in the US South; Forest2market, Inc.: Charlotte, NC, USA, 2017. [Google Scholar]
  47. Mississippi Forestry Commission. 2009–2013 Forest Stewardship Program; Mississippi Forestry Commission: Jackson, MI, USA, 2008; p. 27.
  48. Pokharel, R.; Grala, R.K.; Grebner, D.L.; Cooke, W.H. Mill willingness to utilize logging residues to produce electricity: a spatial logistic regression approach. For. Sci. 2019, 65, 277–288. [Google Scholar] [CrossRef]
  49. Parajuli, R.; Tanger, S.; Henderson, J.E. Timber prices: Supply, Demand and Extenuating Circumstances. For. Landowner 2018, 78, 36–38. [Google Scholar]
  50. Callaghan, D.W.; Khanal, P.N.; Straka, T.J. An analysis of costs and cost trends for southern forestry practices. J. For. 2018, 117, 21–29. [Google Scholar] [CrossRef]
  51. Natural Resource Canada. The State of Canada’s Forests; Annual Report; Natural Resource Canada: Ottawa, ON, Canada, 2017.
  52. European Forest Institute. Best Practices of Fire Use-Prescribed Burning and Suppression Fire Programmes in Selected Case-Study Regions in Europe; European Forest Institute Research Report; European Forest Institute: Joensuu, Finland, 2010; 169p. [Google Scholar]
  53. Whiteman, A.; Wickramasinghe, A.; Pina, L. Global trends in forest ownership, public income and expenditure on forestry and forestry employment. For. Ecol. Manag. 2015, 352, 99–108. [Google Scholar] [CrossRef] [Green Version]
  54. Cubbage, F.W. Economics of Forest Tract Size: Theory and Literature; General Technical Report SO-GTR-41; USDA Forest Service: Asheville, NC, USA, 1983.
  55. Row, C. Economics of trace size and growing timber. J. For. 1978, 76, 576–582. [Google Scholar]
  56. Greene, W.D.; Harris, T.G., Jr.; DeForest, C.E.; Wang, J. Harvesting cost implications of changes in the size of timber sales in Georgia. South. J. Appl. For. 1997, 21, 193–198. [Google Scholar] [CrossRef]
  57. Cubbage, F.W.; Davis, J.W. Historical and regional stumpage price trends in Georgia. For. Prod. J. 1986, 36, 33–39. [Google Scholar]
  58. Straka, T.J.; Wisdom, H.W.; Moak, J.E. Size of forest holding and investment behavior of nonindustrial private owners. J. For. 1984, 82, 495–496. [Google Scholar] [CrossRef]
  59. Romm, J.; Tuazon, R.; Washburn, C. Relating forestry investment to the characteristics of nonindustrial private forestland owners in northern California. For. Sci. 1987, 33, 197–209. [Google Scholar] [CrossRef]
  60. Liu, S.T.; Geidenberger, C. Comparing Incentives to Increase Response Rates Among African Americans in the Ohio Pregnancy Risk Assessment Monitoring System. Matern. Child Health J. 2010, 15, 527–533. [Google Scholar] [CrossRef] [PubMed]
  61. Biemer, P.P.; Groves, R.M.; Lyberg, L.E.; Mathiowetz, N.A.; Sudman, S. Measurement Errors in Surveys; Wiley: New York, NY, USA, 1991. [Google Scholar]
  62. Fox, R.J.; Crask, M.R.; Kim, J. Mail survey response rate: A meta-analysis of selected techniques for inducing response. Pub. Opin. Quart. 1988, 52, 467–491. [Google Scholar] [CrossRef]
  63. Sinclair, M.; O’Toole, J.; Malawaraarachchi, M.; Karin, L. Comparison of response rates and cost-effectiveness for a community-based survey: postal, internet and telephone modes with generic or personalised recruitment approaches. BMC Med. Res. Methodol. 2012, 12, 132. [Google Scholar] [CrossRef] [PubMed]
  64. Vanderford, E.F.; Gordon, J.S.; Londo, A.J.; Munn, I.A. Using focus groups to assess educational programming needs in forestry. J. Ext. 2014, 52, 3EFA9. [Google Scholar]
Figure 1. Conceptual model of landowners’ expenditure to maximize utility.
Environments 06 00107 g001
Figure 2. NIPF landowner distribution by ownership size class in Mississippi.
Environments 06 00107 g002
Figure 3. Mean expenditures Fees for Professional Services of the entire sample.
Environments 06 00107 g003
Figure 4. Mean expenditures for Fees for Professional Services of landowners who incurred expenses.
Environments 06 00107 g004
Figure 5. Mean expenditures for Timber Management Activities of the entire sample.
Environments 06 00107 g005
Figure 6. Mean expenditures for Timber Management Activities of landowners who incurred expenses.
Environments 06 00107 g006
Figure 7. Mean expenditures for Other Management Activities of the entire sample.
Environments 06 00107 g007
Figure 8. Mean expenditures for Other Management Activities of landowners who incurred expenses.
Environments 06 00107 g008
Table 1. Comparison of Mississippi’s Non-industrial Private Forest (NIPFs) sample estimates obtained via a mail survey with estimates reported in the National Woodland Owners Survey.
Demographic CharacteristicsSurvey SampleNational Woodland Owner Survey *
Age (mean years)6865–74 years
Predominant genderMale Male
Income (mean per annum)$60,000–$79,999$50,000–$99,999
Education (majority)Bachelor’s degreeBachelor’s degree
Total land size (mean)157 acres100 acres–499 acres
* Source: Butler, [34].
Table 2. Comparison of the sample estimates obtained from mail surveys conducted in the 1990s and 2015.
StatisticForest Acres (1990s)Forest Acres (2015)
Mean231157
Median8075
Minimum12
Maximum44,6172500
Table 3. Percentage of respondents who incurred forest management expenses, Mississippi, 1995–1997 and 2015.
Expense Category1995–1997 (Percent)
(N = 1075)
2015 (Percent)
(N = 386)
Fees for Professional Services17.46.27
Consulting forester6.92.5
Attorney5.71.5
Accountant8.41.8
Surveyor4.92.5
Timber Management Expenditures20.39.4
Timber stand improvement3.61.1
Prescribed burning3.42.8
Site preparation5.66.2
Planting12.14.1
Other3.72.8
Other Management Expenditures27.28.2
Property line maintenance12.15.4
Protection against fire, insects, or disease7.92.3
Road construction and maintenance10.96.6
Supervision and administration12.36.3
Property Taxes73.068.9
Table 4. Overall Expenditures in forest management activities by landowners in the 1990s and 2015 *.
Mean Expenditure of the Entire Sample ($/ac.)Mean Expenditures of Landowners Who Incurred Expenses ($/ac.)
1990s20151990s2015
Fees for Professional Services2.891.3016.0521.55
Range 6.51–28.39
Standard Error 0.17 2.06
Confidence Interval (95%) 0.57 6.55
Timber Management Expenditures5.712.8324.11246.32
Range 41.66–1235
Standard Error 0.28 16.69
Confidence Interval (95%) 0.88 53.13
Other Management Expenditures1.911.189.3919.50
Range 0.85–100.00
Standard Error 0.29 6.26
Confidence Interval (95%) 0.42 13.44
Property Taxes3.414.023.866.49
Range 0.03–40.00
Standard Error 0.41 0.42
95% Confidence Interval (95%) 0.81 0.83
* Standard errors, confidence intervals, and range for the 1990s are not available.

