Article

Ammonia, Hydrogen Sulfide, and Greenhouse Gas Emissions from Lab-Scaled Manure Bedpacks with and without Aluminum Sulfate Additions

1
USDA Agricultural Research Service, Meat Animal Research Center, Spur 18D, Clay Center, NE 68933, USA
2
USDA Agricultural Research Service, Conservations and Production Research Laboratory, Bushland, TX 79012, USA
*
Author to whom correspondence should be addressed.
Environments 2019, 6(10), 108; https://doi.org/10.3390/environments6100108
Submission received: 26 July 2019 / Revised: 17 September 2019 / Accepted: 18 September 2019 / Published: 20 September 2019

Abstract

:
The poultry industry has successfully used aluminum sulfate (alum) as a litter amendment to reduce NH3 emissions from poultry barns, but alum has not been evaluated for similar uses in cattle facilities. A study was conducted to measure ammonia (NH3), greenhouse gases (GHG), and hydrogen sulfide (H2S) emissions from lab-scaled bedded manure packs over a 42-day period. Two frequencies of application (once or weekly) and four concentrations of alum (0, 2.5, 5, and 10% by mass) were evaluated. Frequency of alum application was either the entire treatment of alum applied on Day 0 (once) or 16.6% of the total alum mass applied each week for six weeks. Ammonia emissions were reduced when 10% alum was used, but H2S emissions increased as the concentration of alum increased in the bedded packs. Nitrous oxide emissions were not affected by alum treatment. Methane emissions increased as the concentration of alum increased in the bedded packs. Carbon dioxide emissions were highest when 5% alum was applied and lowest when 0% alum was used. Results of this study indicate that 10% alum is needed to effectively reduce NH3 emissions, but H2S and methane emissions may increase when this concentration of alum is used.

1. Introduction

Ammonia (NH3) is one of many common by-products of livestock production. The nitrogen (N) content in animal feeds is often fed in excess of the animals’ nutrient requirements, resulting in surplus N that is excreted in the urine and feces of the animal. Stowell reported that only an estimated 10–30% of N that is consumed by cattle is utilized by the animal for growth, reproduction, milk production, and maintenance needs, with the remainder being excreted [1]. Nitrogen is an essential nutrient for plants, and the N retained in animal waste or on the feedlot surface can be used to fertilize cropland. Unfortunately, N losses as NH3 from beef cattle feedlots can be quite high. Research conducted at Texas feedlots found 68% N loss as NH3 in summer and 36% during winter months [2]. Similar research conducted in Nebraska feedlots found 51–63% N loss as NH3 during summer months and 35–41% during winter months [3,4,5]. Nitrogen is primarily excreted through urine, with upward of 97% of urinary N in the form of urea [6,7]. When urine and feces are exposed to each other, the urea in urine is rapidly converted to NH3 via the enzyme urease, which is found in feces [8]. This reaction is modulated by pH and temperature, with greater volatilization during the summer months compared to winter months [3,4,5]. The ideal pH for NH3 volatilization is 7 to 10 [9], whereas pH ≤ 6.5 will result in little NH3 volatilization [10]. This is a function of the pKa, with ammonium (NH4) being less volatile than NH3. Consequently, amendments that lower the pH of the beef feedlot surface material may reduce N volatilization and retain N in the manure to be used for fertilizer. This would be especially beneficial during the warm summer months.
Aluminum sulfate (alum) has been used successfully in the poultry industry to lower NH3 emissions for the past decade [11,12]. Alum lowers the pH of the litter to bind N as NH4 and prevent volatilization. The typical application rate is 5–10% of the weight of the litter [13,14,15]. Ammonia fluxes from alum-treated litter have been reported to be 70% lower than untreated litter [11]. Litter treated with alum also has a higher N content than untreated litter, which increases the fertilizer value of the litter [12]. Phosphorus (P) leaching is also reduced when the litter is land applied, due to a lower soluble P content in the alum-treated litter compared to untreated litter. We hypothesized that NH3 volatilization would be lower from a manure and bedding mixture treated with alum compared to an untreated mixture of manure and bedding. However, we were unsure if alum would affect greenhouse gas and hydrogen sulfide (H2S) volatilization from the bedpacks treated with alum.

2. Materials and Methods

A two × four factorial study with repeated measures over time was conducted to examine the effects of alum addition on gas emissions from manure bedded packs. Two dose frequencies (once or weekly) and four concentrations of alum (0, 2.5, 5, or 10% alum by mass) were examined. Thirty-two laboratory-scaled simulated bedded packs were constructed and maintained for 42 days, as previously described [16,17,18,19,20,21]. The study was conducted twice (Period 1 and Period 2) for a total of 64 experimental units. Briefly, bedded packs were constructed using plastic containers that were 0.5 m high and had a diameter of 0.38 m. Each container had six 1 cm holes equally spaced around the circumference of the container, approximately 5 cm from the top of the container, to serve as air inlets [21]. Corn stover was used as the bedding material. Three times per week, urine and feces were added to the bedded packs. The bedded packs were stirred slightly at each addition to represent hoof action on the bedded packs. The bedded packs were housed in four environmental chambers [22] that were maintained at an ambient temperature of 18 °C with a dew point of 12 °C throughout the study. This temperature and dew point were selected to represent conditions during a moderate season in a barn [23], like spring or fall, and have been used in previous studies [16,17,18,19,20,21]. There were eight bedded packs per chamber.
Once weekly, air samples were collected for 18 minutes per bedded pack using dynamic flux chambers. The flux chambers were stainless steel hemispherical flux chambers that were 7 L with a surface area of 640 cm2 [24,25]. Inside the headspace of the chamber was a 40 mm, 12 V axial-flow fan moving approximately 130 L min−1. The fan was suspended in the center of the headspace approximately 70 mm above the bedded pack surface. The fan airflow direction was from the surface to the top of the chamber. Rubber skirts that were 61 cm square and made of soft, elastic rubber with 22.9 cm diameter holes cut in the center were fit over each flux chamber to form a seal on the top of the plastic container when the flux chamber was placed on the plastic container for air sampling [21]. A 0.64 cm inert tubing was attached to the flux chambers using inert compression fittings [21]. The inert tubing was attached to the gas sampling manifold that fed into the air sampling equipment [21]. The gas sampling system was controlled by a 24 V Programmable Logic Relay, which signaled multi-positional three-way solenoids to open and close one of eight air inlet lines on the gas sampling manifold [21]. One line was opened at a time to allow for individual air sampling from each bedded pack [21]. Ambient air from the room was flushed through the tubing at a rate of 5 L min−1 for 30 min [21]. After the 30 min flush period, sampling was conducted for 18 minutes per bedded pack. Air samples were analyzed for H2S using a Thermo Fisher 450i Hydrogen Sulfide/Sulfur Dioxide/Combined Sulfur Pulsed Fluorence gas analyzer (Thermo Fisher Scientist, Waltham, MA, USA). A Thermo Fisher 17i Ammonia Chemiluminescent gas analyzer was used to measure NH3 (Thermo Fisher Scientist, Waltham, MA, USA). Methane was measured using a Thermo Fisher 55i Direct Methane and Non-methane Hydrocarbon Backflush Gas Chromatograph gas analyzer (Thermo Fisher Scientific, Waltham, MA, USA). Nitrous oxide (N2O) and carbon dioxide (CO2) were measured using an Innova 1412 Photoacoustic gas monitor (LumaSense Technologies, Santa Clara, CA, USA).
The temperature and pH of each bedded pack were measured at each sampling date. A grab sample of approximately 10–15 g was collected from each bedded pack and placed in a 50 mL plastic conical. Samples were diluted 1:2 on a mass basis with distilled water. A pH/mV/temperature meter (IQ150, Spectrum Technologies, Inc., Plainsfield, IL, USA), calibrated with buffers pH 4 and 7, was then used to determine pH. Pack temperature was measured approximately 7.6 cm below the surface of the simulated bedded pack using the same meter. At the beginning and end of the study, a sample of each simulated bedded pack was collected and analyzed for dry matter (DM), total N, total phosphorus (P), total potassium (K), and total sulfur (S). Dry matter was determined by weighing samples before and after drying at 100 °C in a forced-air oven for 24 h. Samples collected from the simulated bedded packs were dried, ground through a 1 mm screen, and sent to a commercial laboratory (Ward Laboratory, Inc., Kearney, NE) for N [26], P, S [27] analysis.
Treatments were applied on Day 0 and measurements were recorded once weekly for the following six weeks (Day 42). The treatments included 0, 2.5, 5, and 10% alum applied as either a whole treatment on Day 0 or 16.6% of the total alum volume applied each week for six weeks. The quantity of alum added was based on the expected total mass of the bedded packs at the end of the 42-day study. Treatments were selected based on previous research in the poultry industry, which indicated 5–10% alum by mass was adequate to reduce NH3 volatilization [13,14,15]. As reported by Moore and co-workers [13], a series of studies has consistently demonstrated that pH begins to rise and NH3 emissions begin to increase about four weeks post application when used in poultry facilities. This study was designed to slightly exceed that four-week threshold, to determine the maximum length of time NH3 emissions could be suppressed from cattle bedded packs.
For all measurements, Day 0 samples were collected prior to any urine, feces, or alum being added to the bedding material. The reason for doing this was to determine baseline emissions from the corn stover bedding independently of urine, feces, or alum. Previous studies with alum had all been conducted in poultry barns that use wood-based bedding material. We wanted to make sure that corn stover alone was not contributing to high gaseous emissions. In most cases, these measurements were essentially zero.
Data were analyzed as a 4 × 2 factorial with repeated measures in time using the MIXED procedure of SAS (SAS Institute, Cary, NC, USA). The model included the effects of period, alum concentration, dose frequency, day, and all interactions. Covariate structure was modeled to get lowest Akaike information criteria (AIC) value. Several structures were tested and the compound symmetry covariate structure provided the lowest AIC value. When significant differences were detected, the least square means were calculated using Fisher’s least significant differences. The nutrient data was analyzed as a 4 × 2 factorial using the MIXED procedure of SAS (SAS Institute, Cary, NC, USA) to test the effects of alum concentration, dose frequency, and the interaction of the two variables. Bedded pack was the experimental unit in all analyses, and differences were considered significant when p < 0.05.

3. Results and Discussion

3.1. Temperature and pH
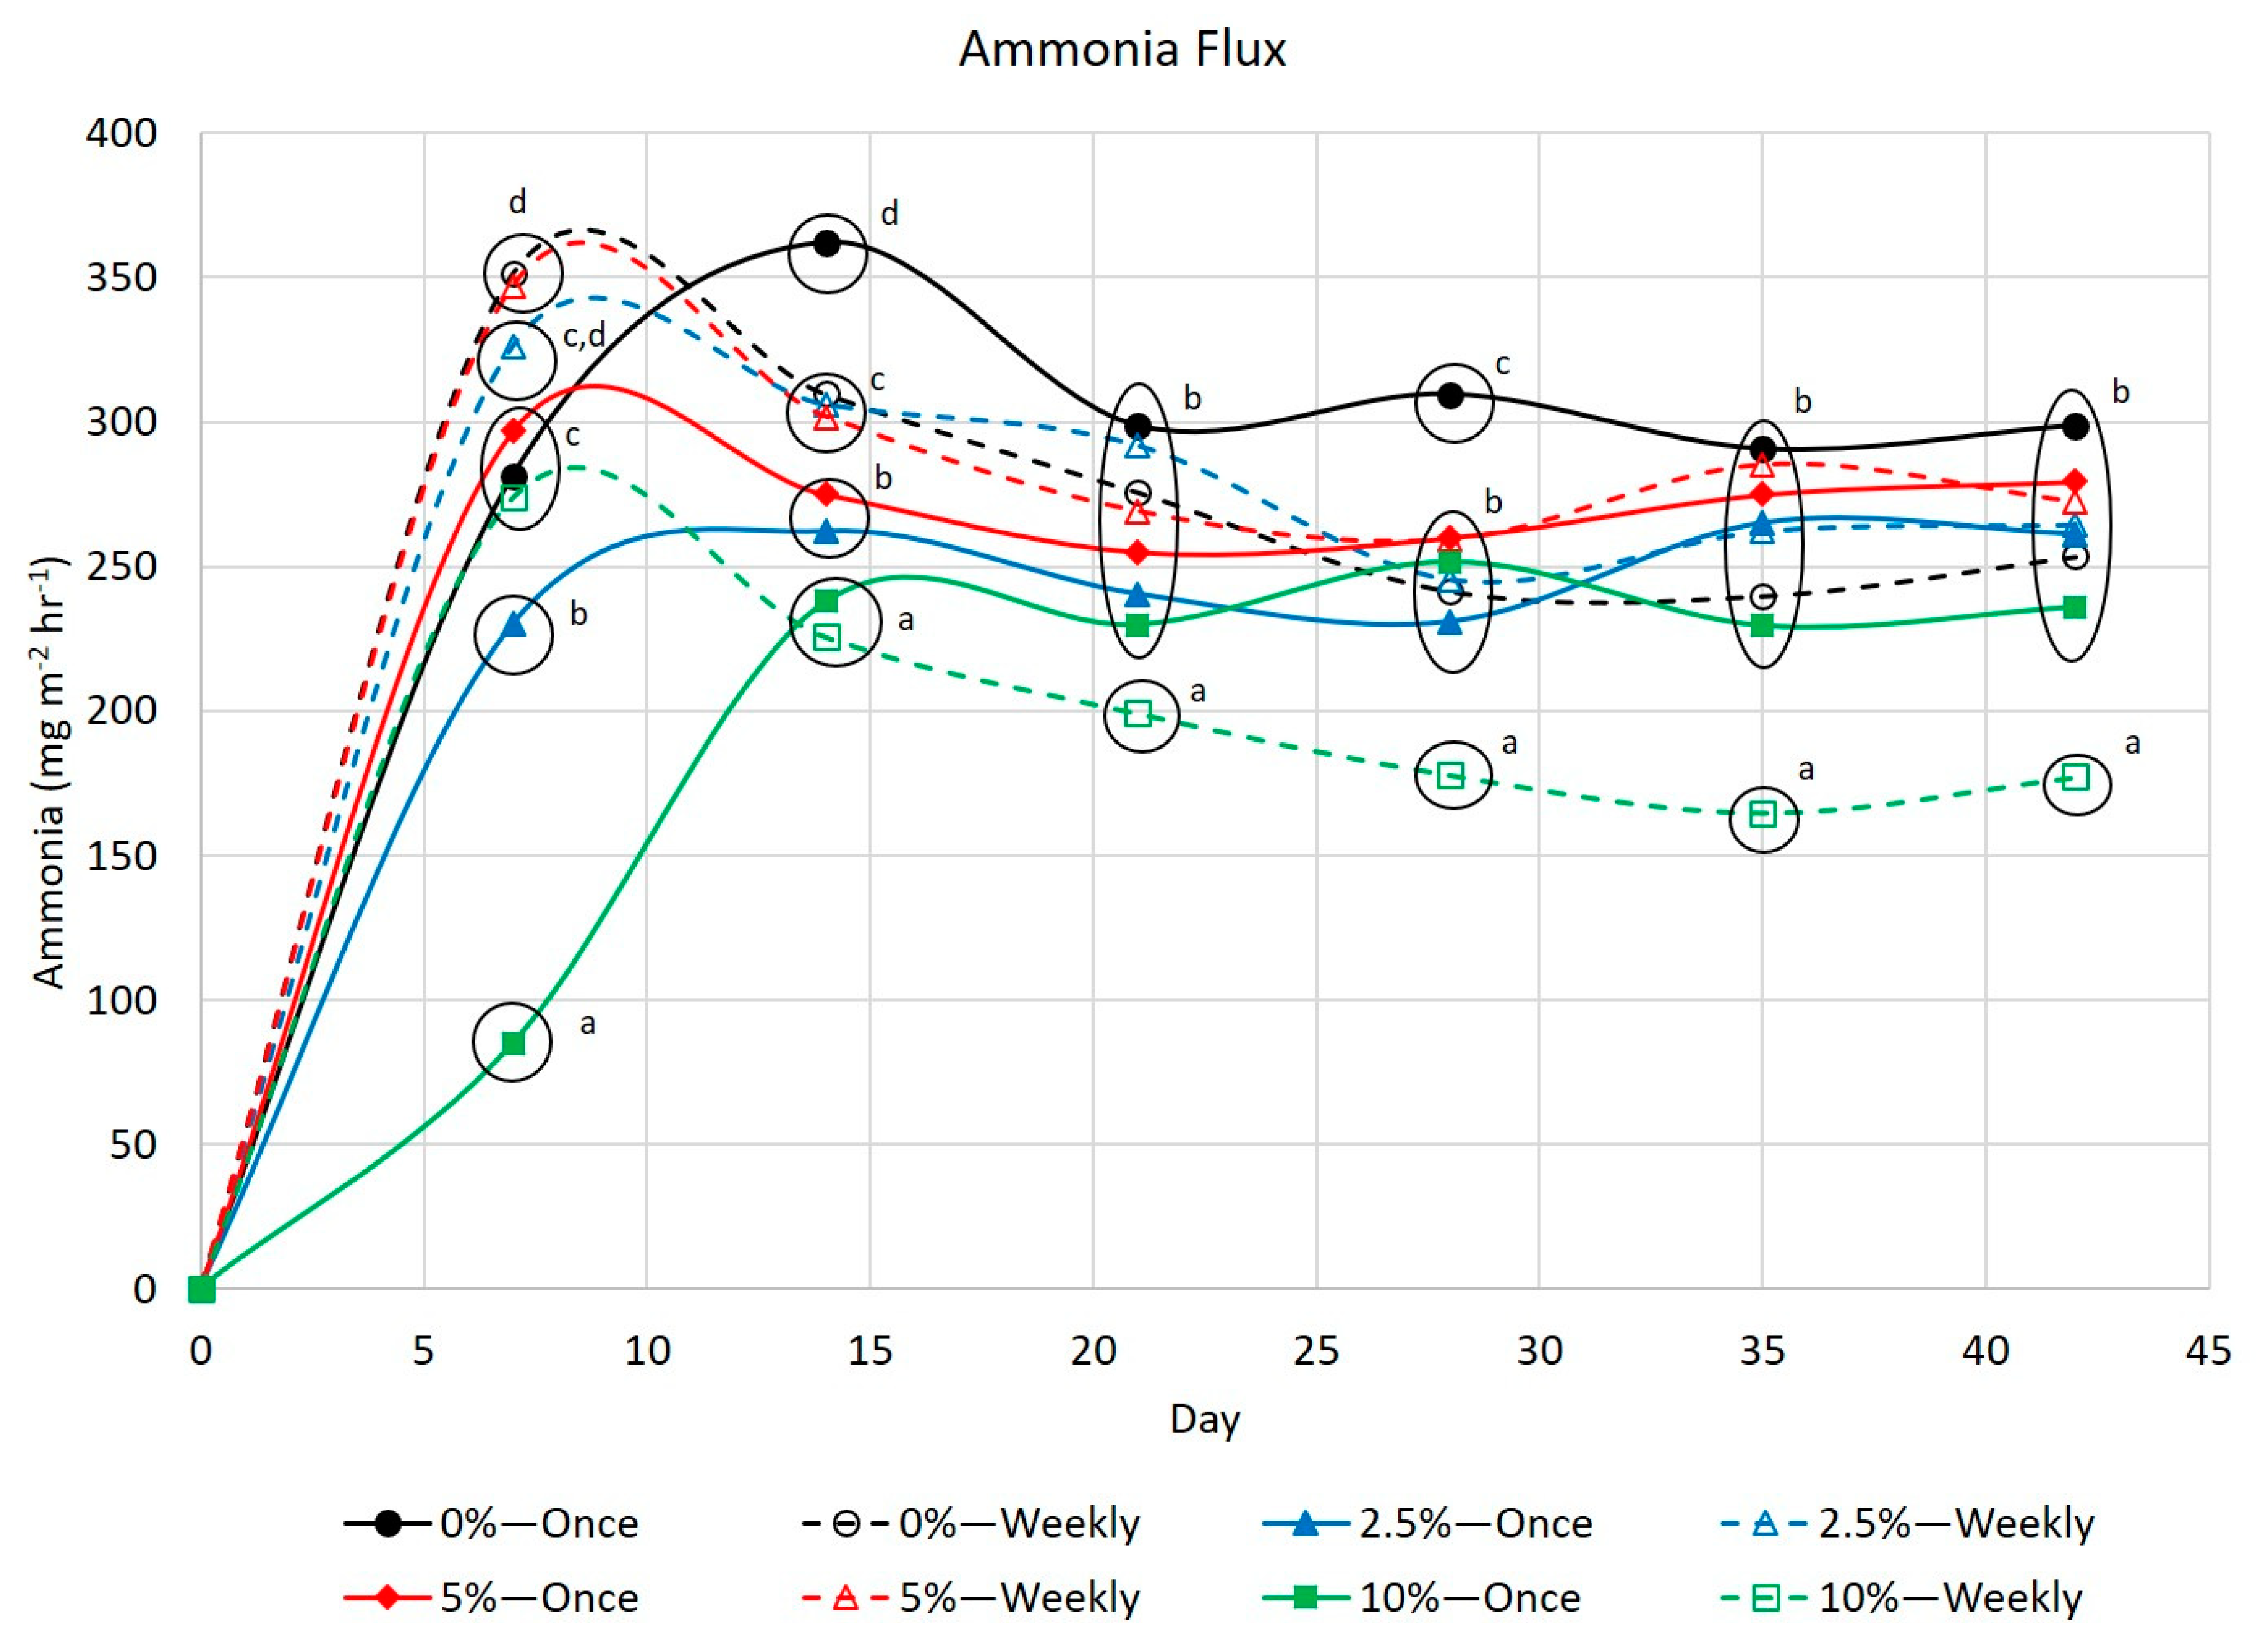
The temperature of the bedded packs ranged from 19.1 to 21.7 °C and did not differ amongst bedding packs at any point during the 42-day study (Table 1). These temperatures were within the range of previous studies using a similar lab-scaled design [16,20], but less than pack temperatures measured by Ayadi [28] when using environmental chambers set at 40 °C. The average temperature of the bedded pack in four commercial facilities was 25.7 °C but ranged from 15 to 29 °C depending on the season [23]. Although no lab-scale system can perfectly simulate the environment in a commercial facility, the lab-scale simulated bedded packs have consistently produced physical characteristics within the ranges measured in commercial facilities and allow researchers a small-scaled tool that can be used for initial evaluation of multiple treatments.
The pH of the bedded packs was also within the range of previous lab-scaled studies (6.2 to 9.0; [16,20,28]) and data collected from commercial facilities (7.5–8.0; [23]). Previous studies using 10% alum in poultry litter reported a litter pH ranging from approximately 7.5 to 8.0 in untreated litter to approximately 5.75 immediately after a 10% alum treatment [13]. The pH began to gradually increase and reached approximately 7.5 four weeks after application [13]. In the current study, the pH of the untreated bedded packs was similar to untreated litter, but 10% alum was able to lower the pH of poultry litter to 5.75, while the 10% treatment applied in one dose only lowered the pH of the bedded pack to 6.92. Further studies will be warranted to determine if a higher dosage of alum may be necessary to sufficiently lower pH. As expected, the pH of the bedded packs changed when alum was added. Initial measurements from the bedded pack taken on Day 0 were collected immediately before adding the alum and did not show any significant differences between the treatments. On Day 7, the pH of the bedded packs that received the 10% alum treatment in one dose was lower (p < 0.01) than the pH of bedded packs that received all other treatments. The bedded packs that received the 5% alum treatment in one dose had the second lowest pH, followed by the 10% weekly treatment, 5% weekly treatment, and 2.5% dose administered at once. Expectedly, the largest concentration of alum administered in one dose was the most effective in lowering the initial pH. This low pH was sustained through Day 14, but by Day 21, only the bedded packs receiving the 10% weekly alum treatment maintained a lower pH. Alum applied to poultry litter prior to a six-week grow-out was particularly effective at lowering pH during the first three to four weeks [11]. Therefore, it was not surprising that the alum would begin to lose efficacy around Day 21.
Beginning on Day 28, an overall decrease in pH of all bedded packs was observed, with the bedded packs containing the 10% alum treatment having significantly lower pH than those that did not receive alum. This decrease in bedded pack pH has been observed in previous studies using this experimental design, although the decrease did not happen until Day 35 in previous studies [17,19]. It is likely caused by an increase in volatile fatty acid (VFA) production as the manure mixture ages, as demonstrated by other researchers [16,29,30]. On Day 35, only the bedded packs receiving the 10% alum weekly dose had a significantly lower pH. At the end of the study, the bedded packs with the 10% weekly alum treatment had the lowest pH, which did not differ statistically from the pH of the bedded packs receiving the 10% once treatment and the 2.5% weekly treatment, with all other bedded packs having a higher pH. It is unclear why the bedded pack with the 2.5% weekly treatment had such a significant drop in pH between Day 35 and Day 42.

3.2. Ammonia

Ammonia flux was significantly lower for bedded packs that received the 10% treatment in one dose compared to any other treatment at Day 7 (Figure 1). The bedded packs that received 2.5% alum had significantly higher NH3 flux than those with 10% alum administered in one dose, but significantly lower than all other treatments on Day 7. At Day 14, the NH3 fluxes from bedded packs that received both 10% alum treatments were not different from one another, but were significantly lower than other treatments, with those receiving the 2.5% and 5% alum in one dose having significantly higher NH3 fluxes than the 10% treatments, but significantly lower NH3 fluxes than the other treatments. From Day 21 until the end of the study, only the bedded packs with the 10% alum administered in weekly doses consistently maintained a significantly lower NH3 flux than the bedded packs that were not treated with alum.
Ammonia flux followed the pack pH. On Day 7, the bedded packs that received the single dose of 10% alum had statistically lower NH3 emission than all other bedded packs (Figure 1). This corresponded to the low Day 7 pH for the bedded pack that received a single dose of 10% alum. At Day 14, the pH of both 10% alum treatments, the 2.5% alum treatment that was administered once, and the 5% alum treatment that was administered once had the lowest pH values. The NH3 emissions from these four treatments were also lowest on Day 14. By Day 21 and throughout the remainder of the study, the pHs of the bedded packs that were administered a weekly dose of 10% alum were lowest, which corresponded to the low NH3 emissions for bedded packs that received weekly doses with the 10% alum concentration. Bedded packs that received weekly allotments of the 10% alum treatment had 73% of the NH3 emissions of the bedded packs that did not receive an alum treatment.

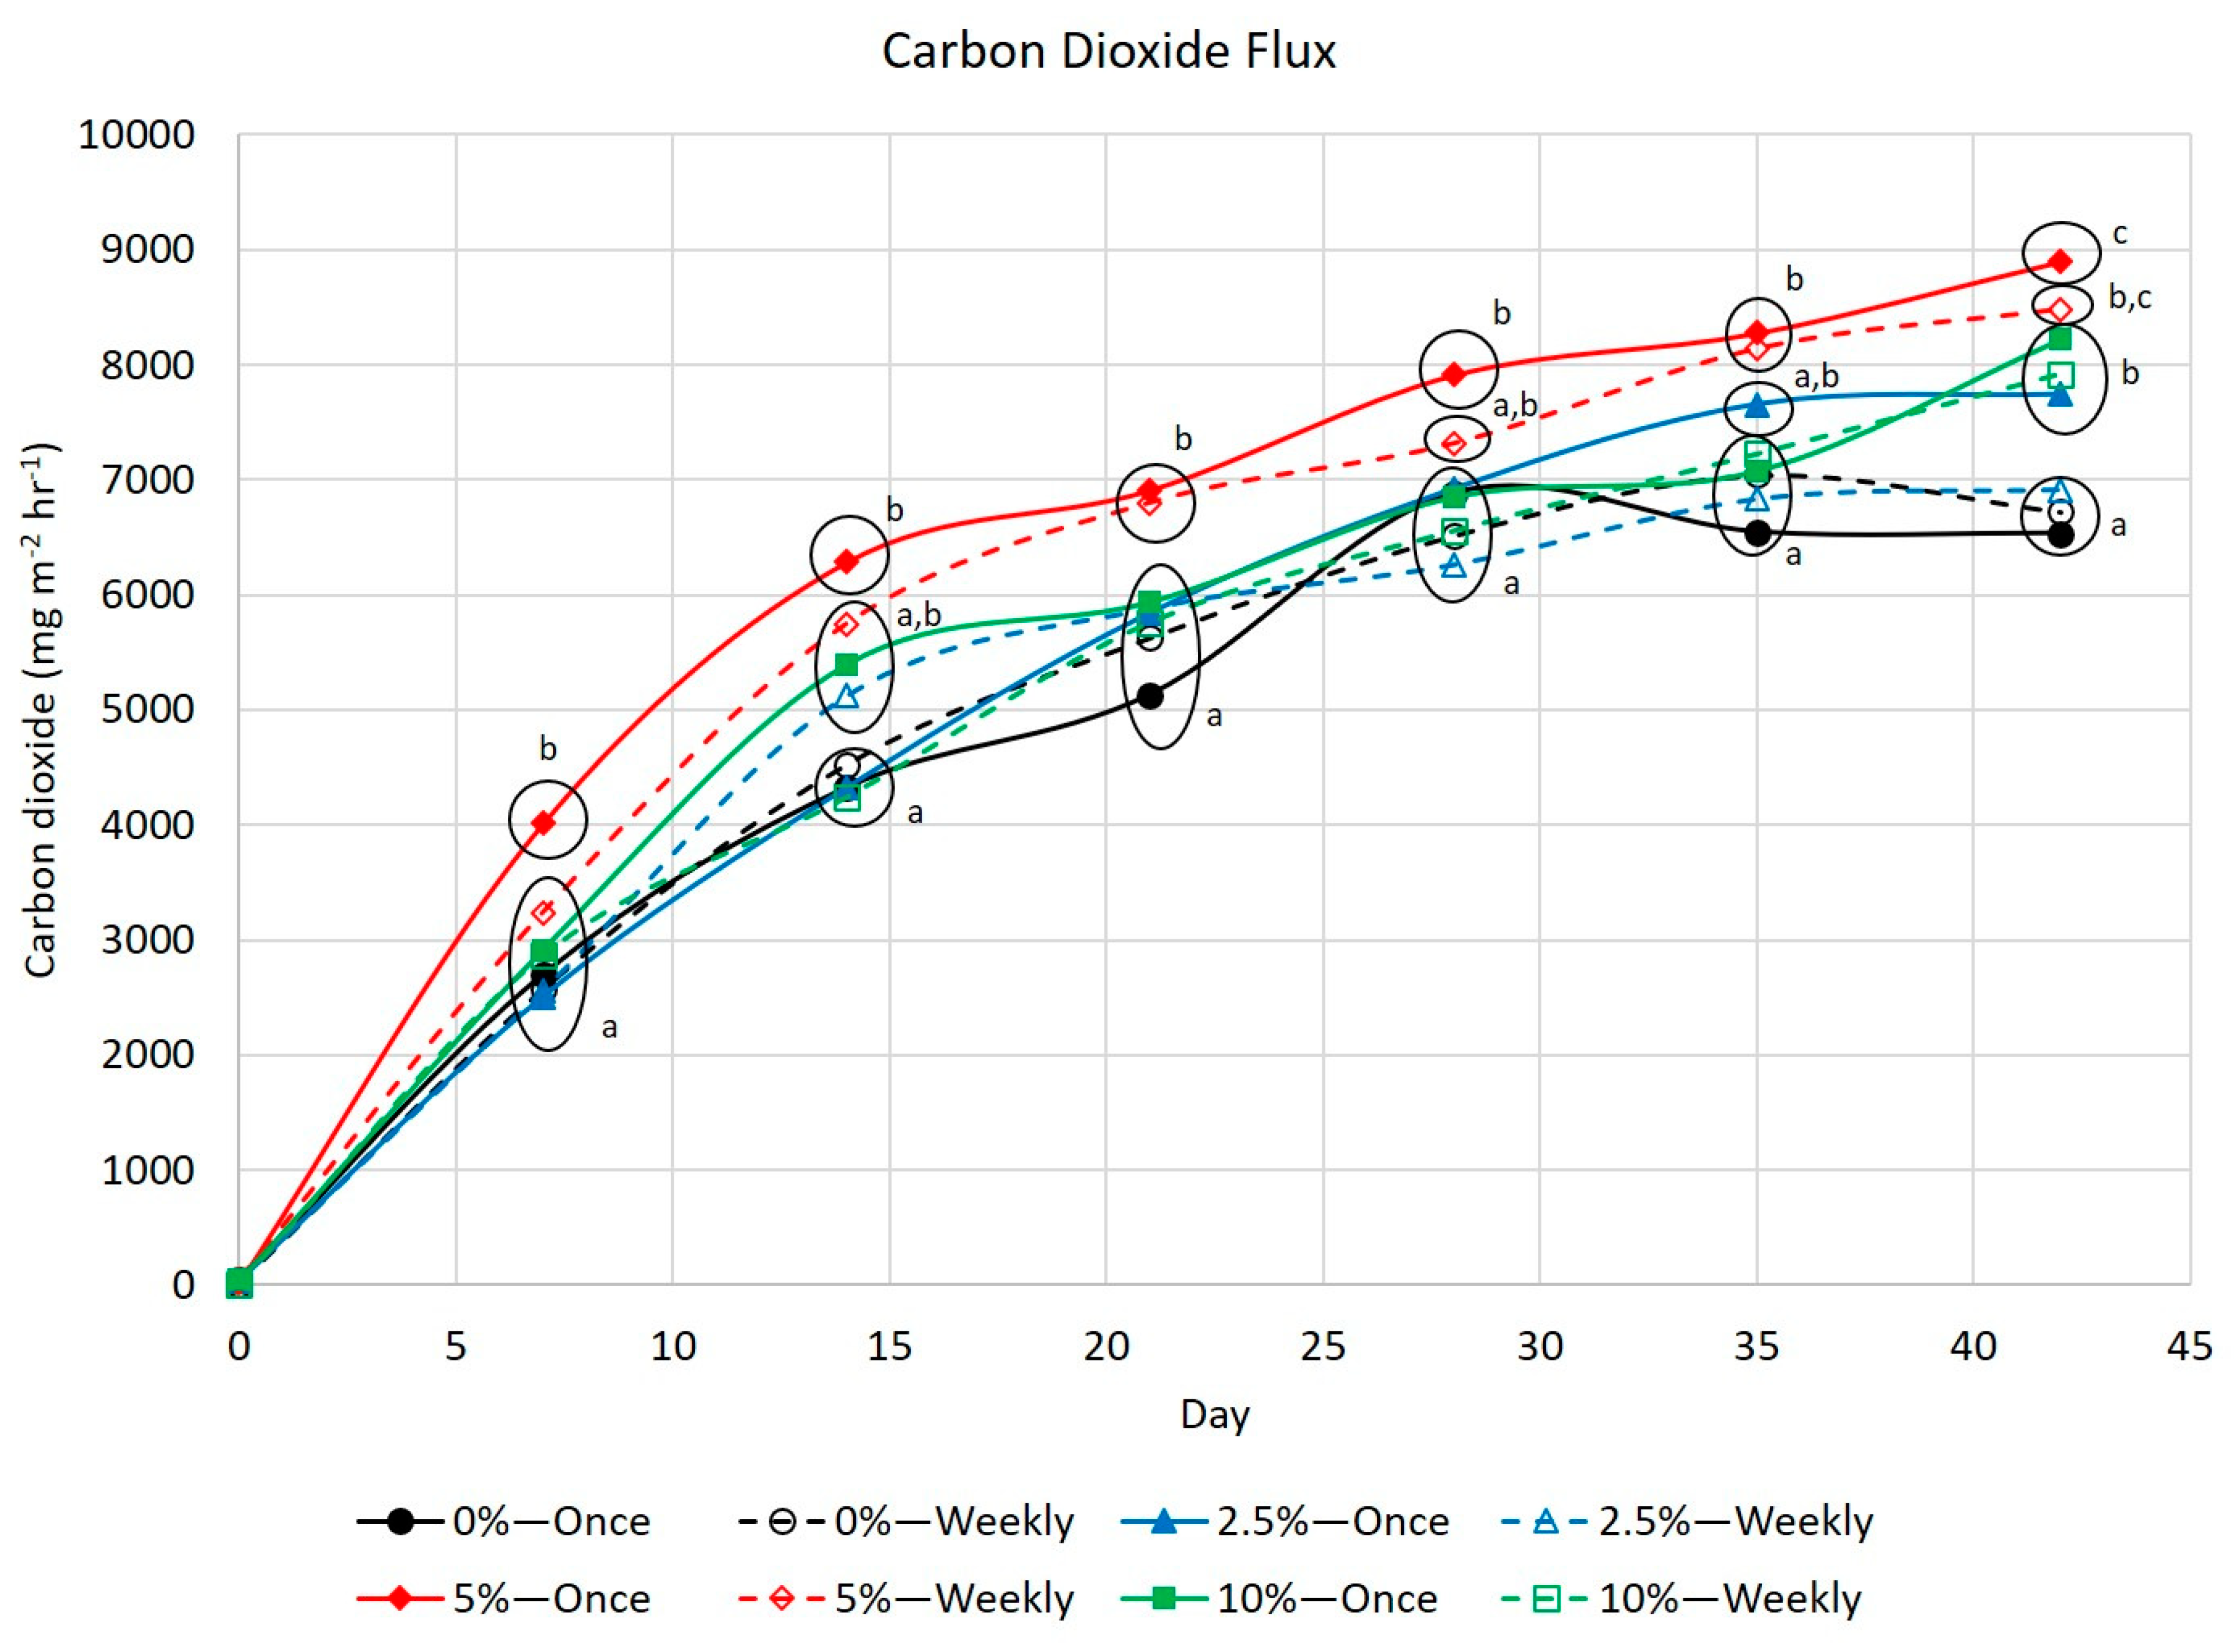
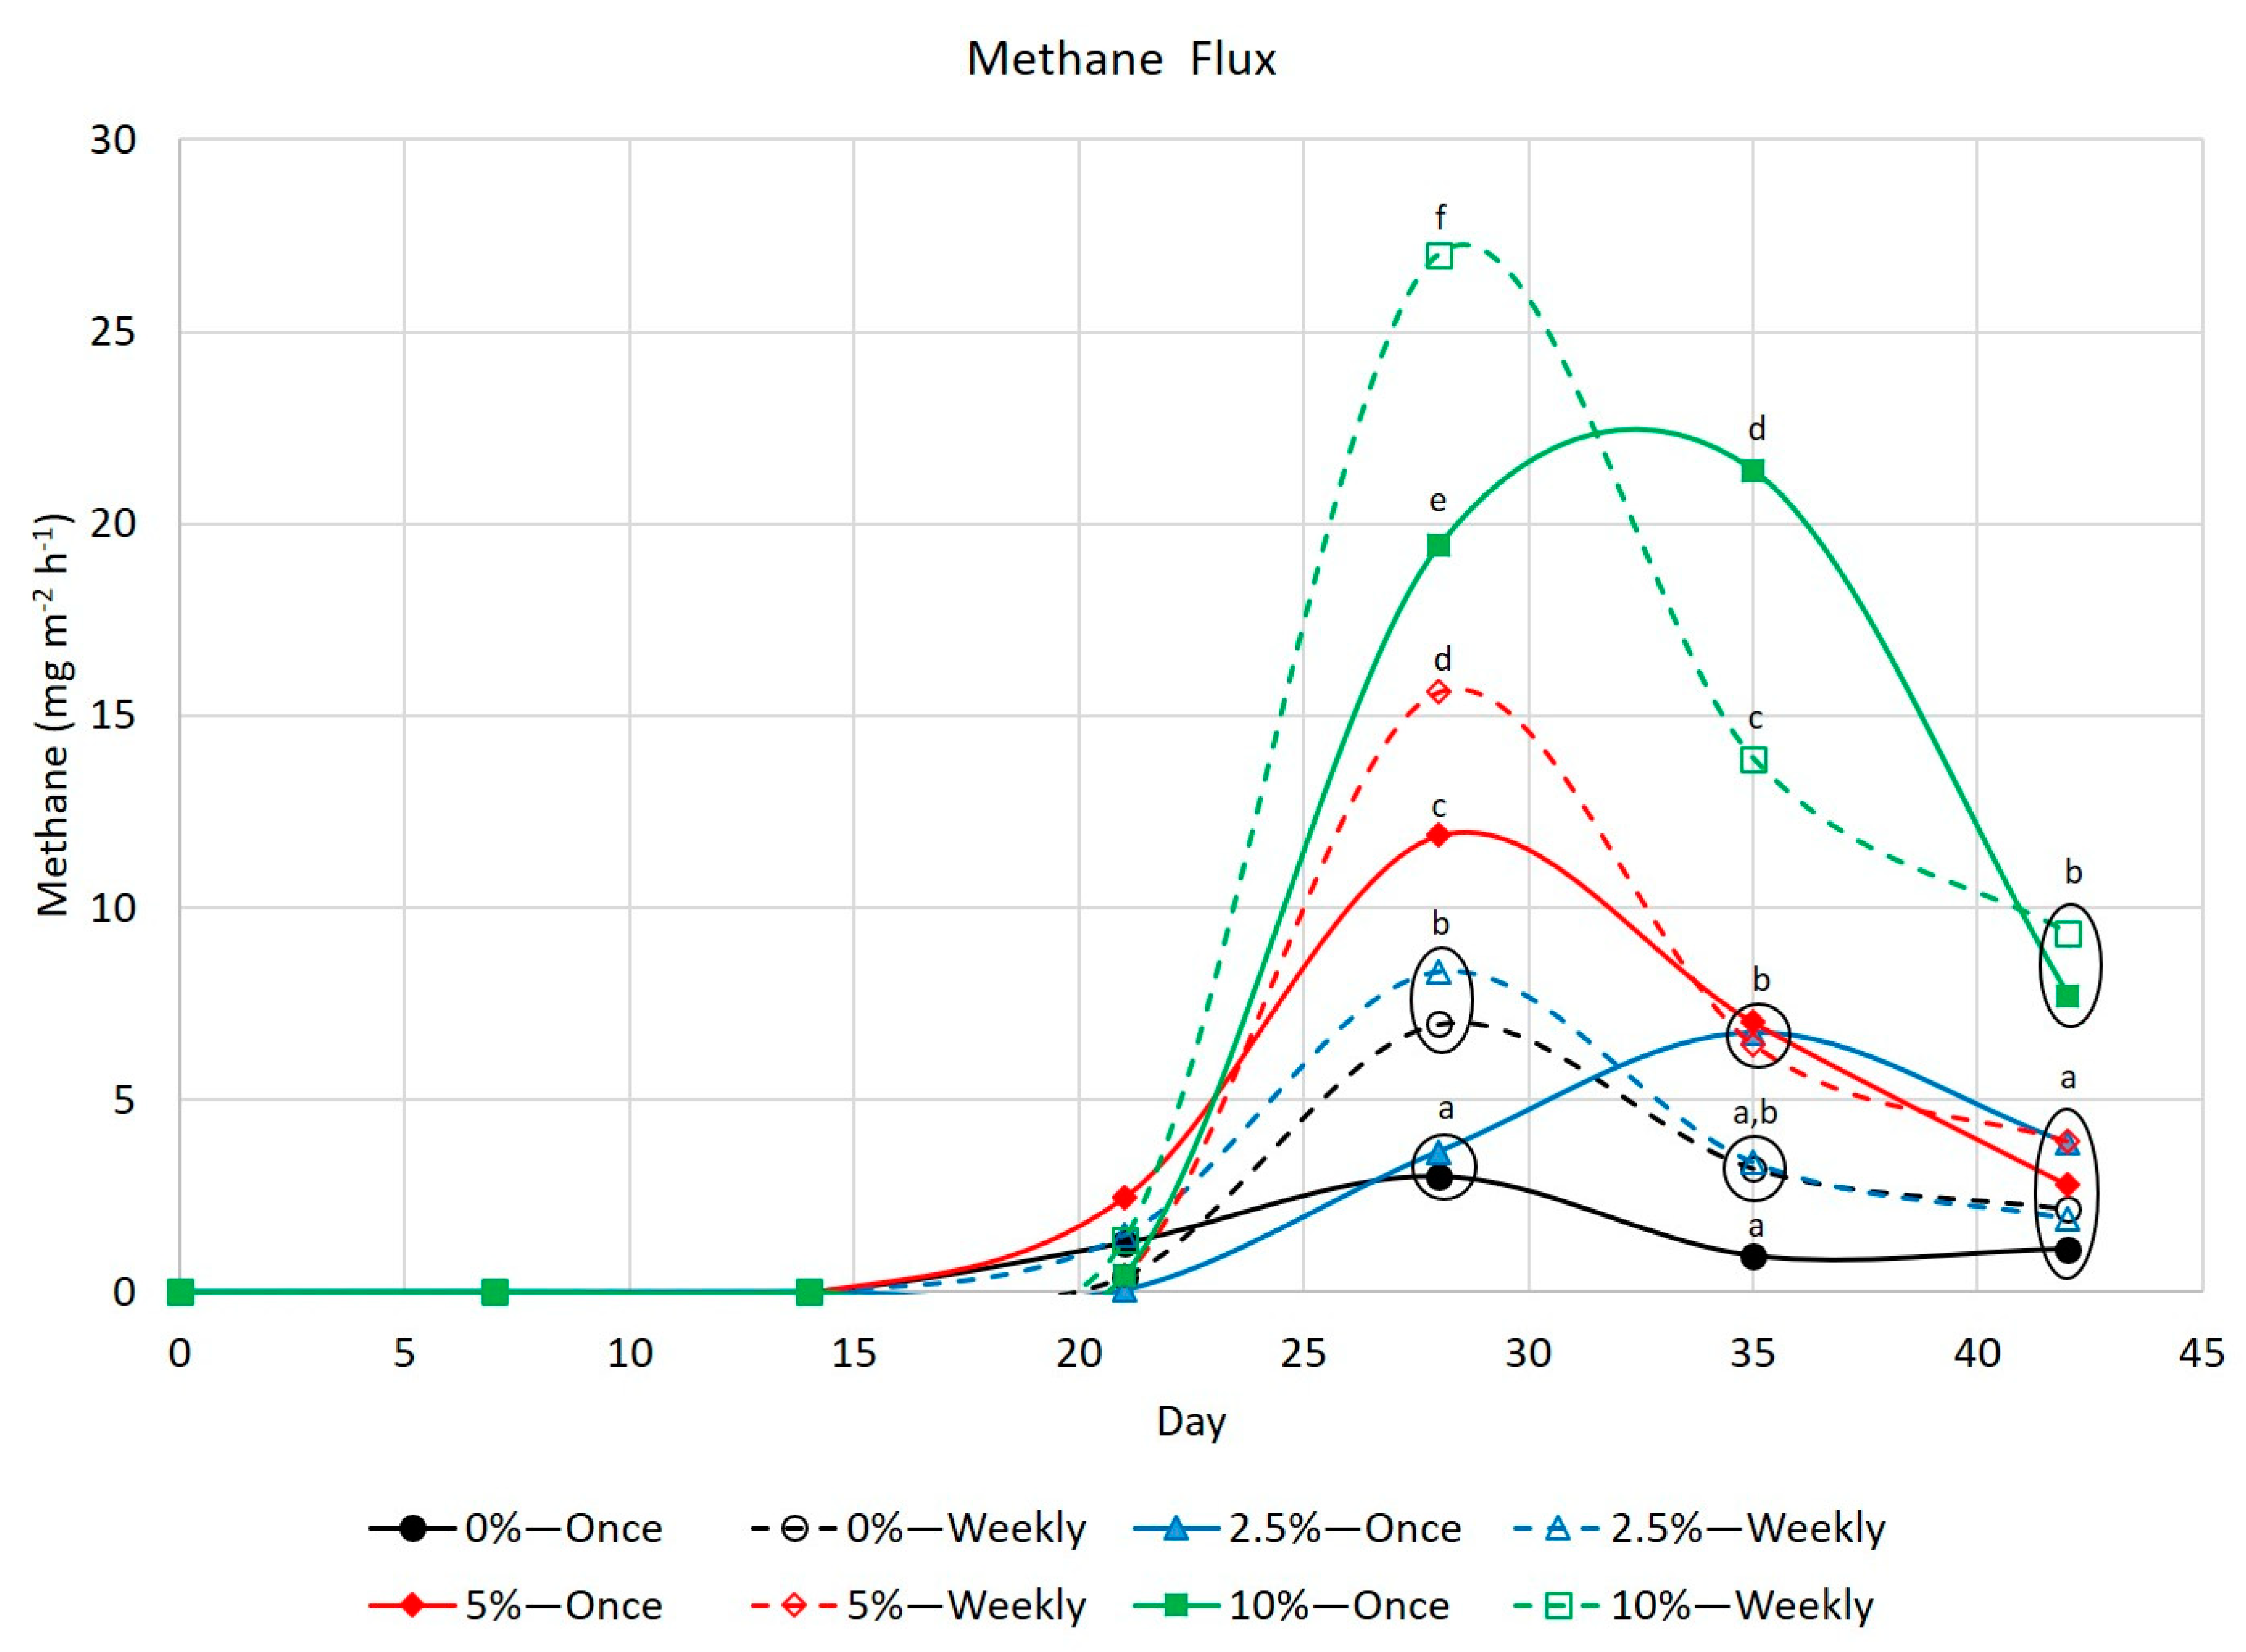
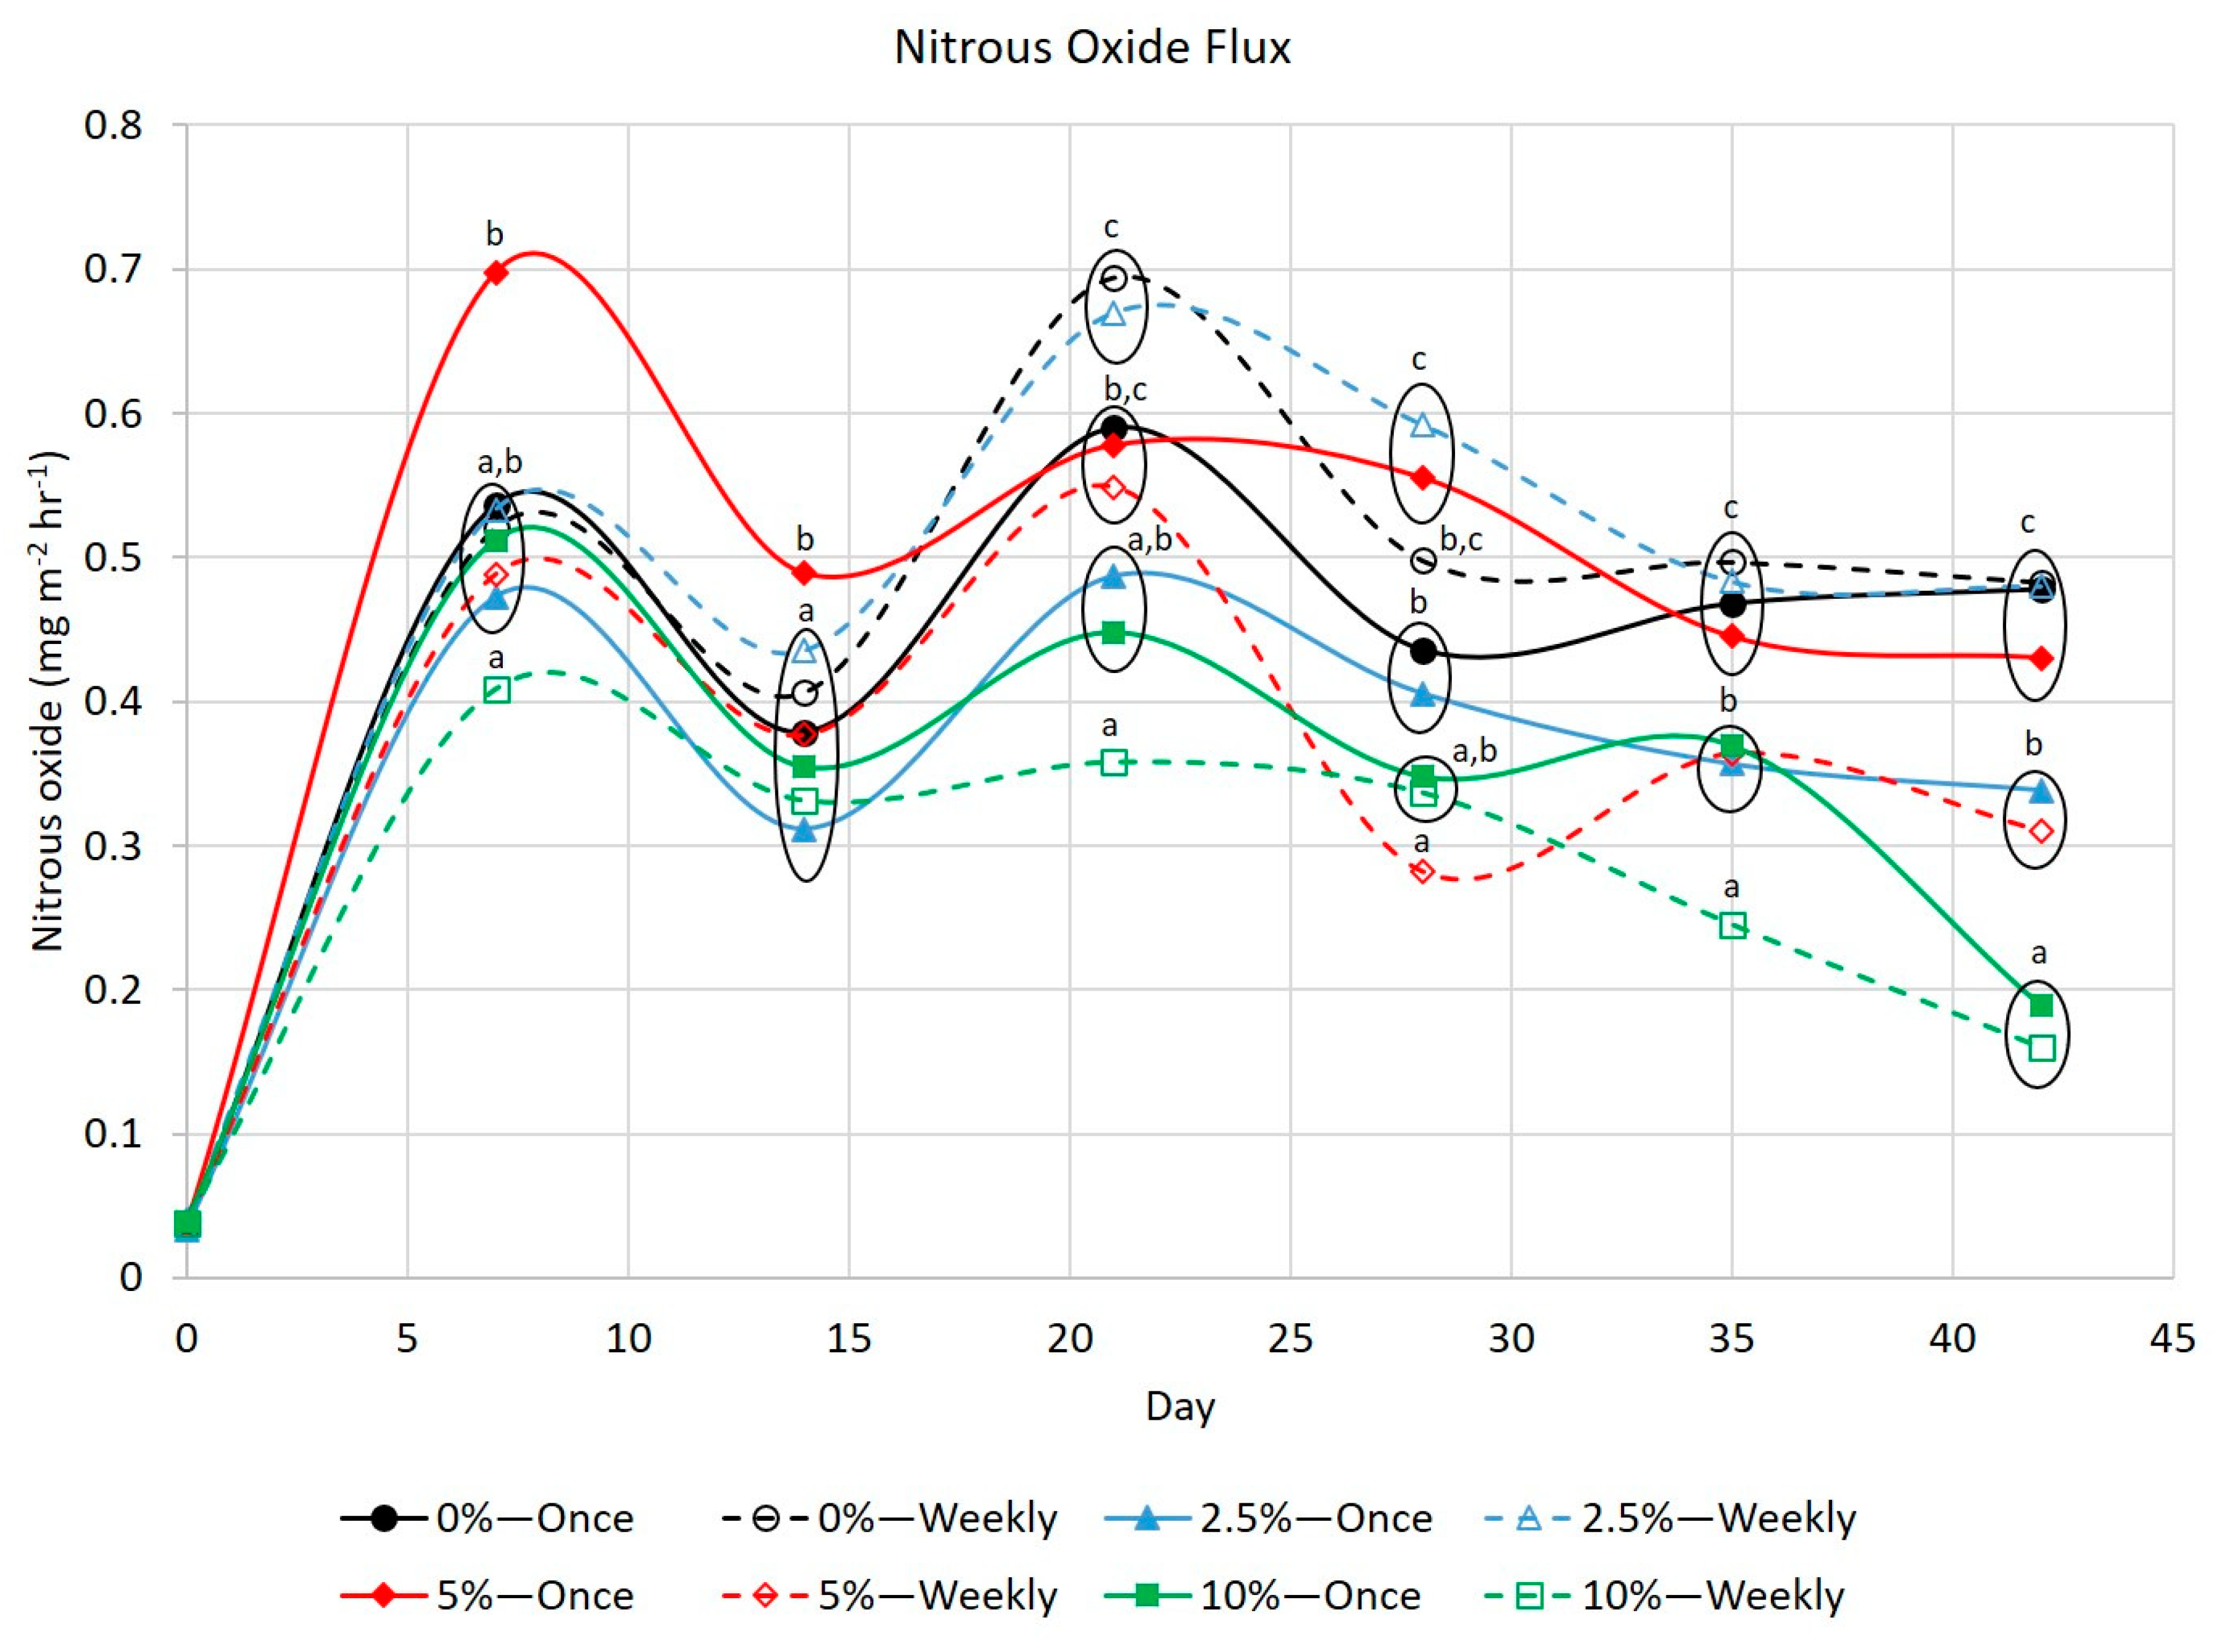
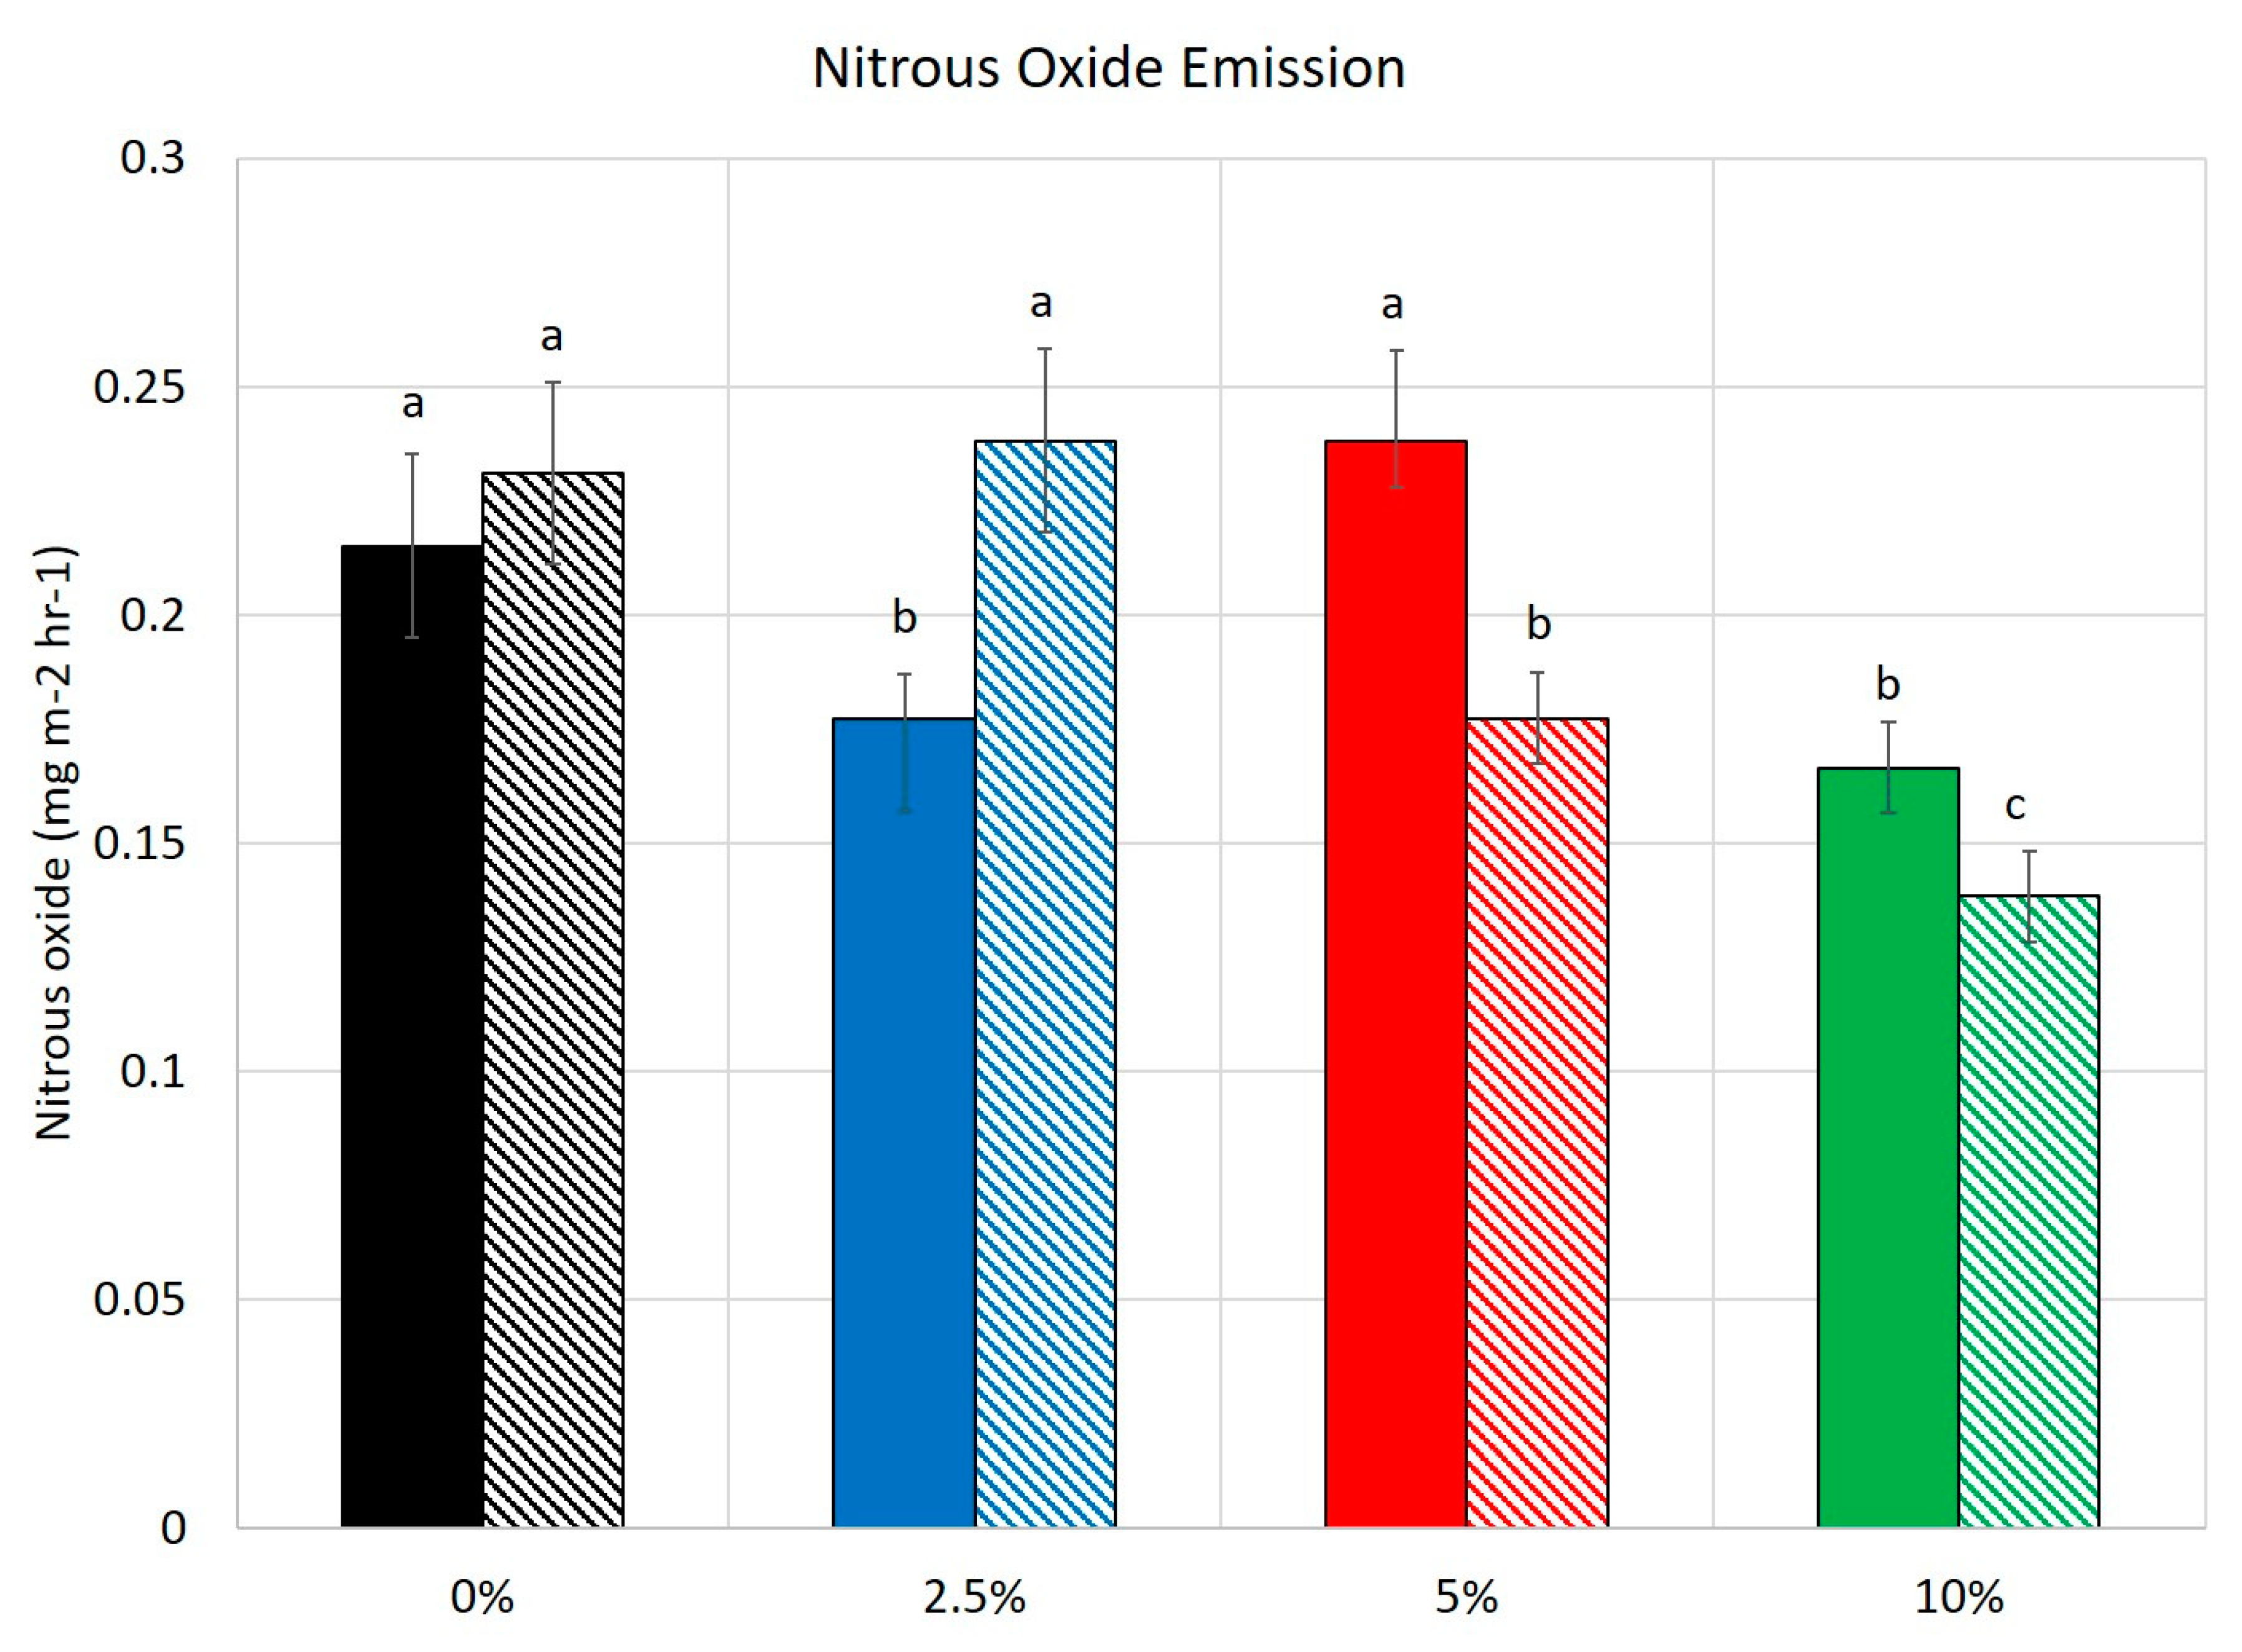
3.3. Greenhouse Gases

There was a significant alum concentration × dose frequency × day effect for CO2 flux (Figure 2). However, in general, the CO2 flux from bedded packs receiving the 5% alum dose, regardless of whether it was administered weekly or in one dose, had the highest CO2 flux, with the bedded packs that received no alum having the lowest CO2 flux. It is unclear why the bedded packs receiving the 5% alum treatments produced the highest CO2 flux. A reduction in pH could affect the concentration of gases near the surface of the bedded pack and would favor the emission of weak acid forming gases, such as CO2 [31]. However, if the increase in CO2 was purely pH-dependent, it would be expected that the bedded packs receiving the 10% alum treatment would have the highest CO2 emission, not the bedded packs receiving the 5% alum treatments. The carbon dioxide flux of the bedded packs receiving the 10% alum in weekly allotments was 104% that of the untreated bedded packs, but did not differ statistically. Over the course of the 42-day experiment, the CO2 flux increased for all bedded packs, regardless of treatments. This gradual increase in CO2 flux is consistent with previous studies [17,19,28]. Carbon dioxide is produced during aerobic respiration and indicates biological activity in the bedded packs. As the packs matured, the decomposition of feces and bedding material began, which likely contributed to the increase in CO2 emissions as the packs aged.
Methane is produced during anaerobic decomposition of organic matter [32,33,34,35]. Methane-producing bacteria can survive in temperatures ranging from 15 to 60 °C, with an ideal temperature of 35–37 °C [36]. An ideal pH is between 6.7 and 7.5 [37,38]. Methane production was largely nonexistent until Day 21 of the study (Figure 3), which is consistent with previous studies conducted using simulated bedded packs [17,19]. While ideal conditions for CH4 production were never achieved during this study, the weekly increases in bedded pack height as urine, feces, and bedding were added each week can be assumed to have made a more anaerobic environment towards the bottom of the bedded packs as the study progressed. Beginning at Day 28, the bedded packs that received the 10% alum treatments had the greatest CH4 production, followed by those receiving both 5% alum treatments. This was likely due to the fact that the pH of the bedded packs containing 10% alum maintained a pH of 7.62–7.97 compared to higher pH values for the bedded packs that received all other treatments, particularly on Day 28, when CH4 production peaked. The lower pH, while not ideal for methanogens, is certainly more conducive to the production of CH4. For each concentration of alum applied to bedded packs, peak CH4 production was significantly greater when the alum was applied in weekly allotments compared to one dose. Methane fluxes from the bedded packs that received the weekly dose of 10% alum were 274% of the flux from bedded packs that were not treated with alum. Methane production peaked at Day 28 and began to decline by Day 35.
Nitrous oxide emissions from livestock facilities are of increasing concern for producers due to the global warming potential of N2O being 296 times greater than that of CO2 [39]. Nitrous oxide concentrations ranged from 0.01 to 0.69 mg m−2 h−1 and were highly variable across treatments throughout the study (Figure 4), which was similar to previous studies [17,19]. This variability over time may be attributed to the micro-environments on the surface of the bedded packs being disrupted with periodic stirring of the pack. When the pack is stirred, the anaerobic layer is disrupted and nitrifying and denitrifying processes may be altered as a result. Two peaks appeared, at Day 7 and Day 21, which is slightly different from previous studies, which had peaks at Day 14 and Day 42 [17,18,19]. At Day 7, bedded packs that received the 5% alum in one dose had significantly higher N2O emissions and those that received the 10% weekly dose had significantly lower N2O emissions, with all other treatments being similar. During the Day 21 peak, bedded packs that received the 2.5% weekly alum and 0% weekly dose had the highest N2O emissions, with those receiving the 10% weekly dose once again having lower emissions. Overall, for the 42-day study, bedded packs treated with the 10% alum weekly treatment had lower N2O emissions (Figure 5). Those given either 0% alum treatment, the 2.5% treatment in weekly increments, or the 5% alum in one dose had the highest N2O loss, with the packs receiving the 10% alum treatment in one dose, the 5% alum treatment in weekly increments, and 2.5% alum treatment in one dose had intermediate N2O emissions. Treating the bedded packs with weekly doses of 10% alum resulted in a flux 64% of that for the untreated bedded packs.

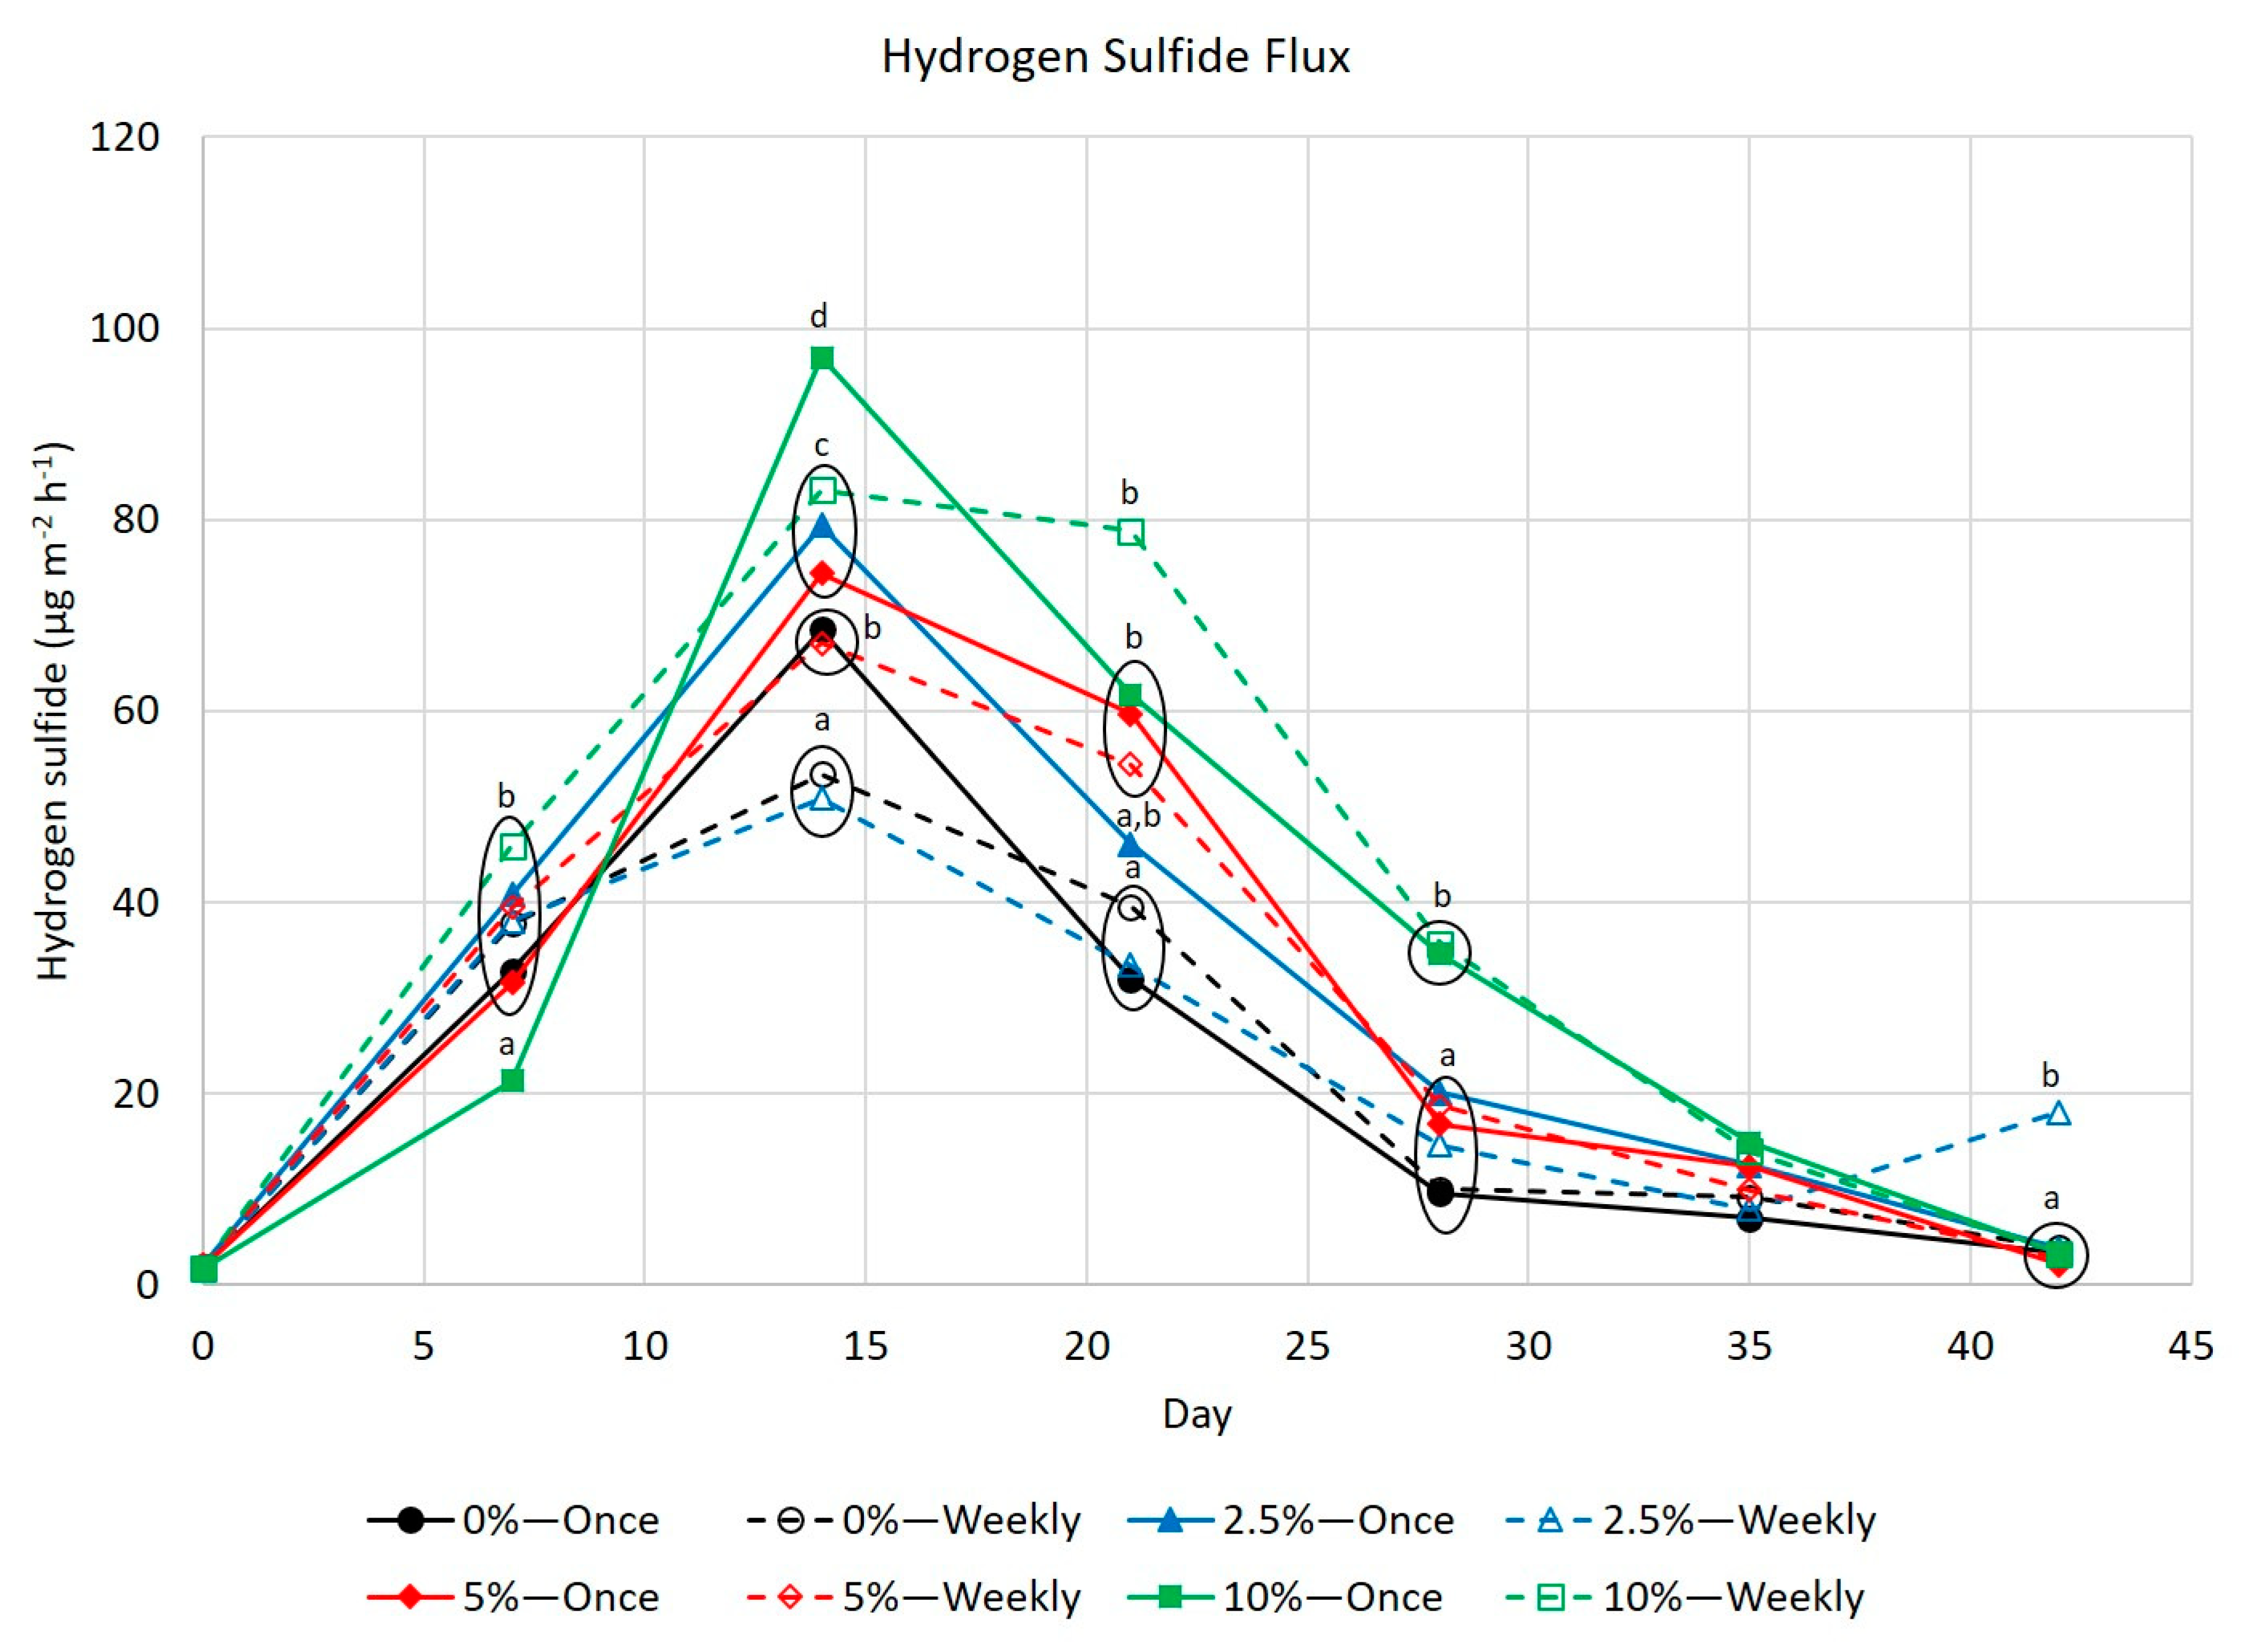
3.4. Hydrogen Sulfide

Hydrogen sulfide flux was initially very low, peaked at Day 14 and then declined throughout the study (Figure 6). In a previous study, hydrogen sulfide was not measured directly, but total reduced sulfides peaked at Day 14, declined, and then began to increase again at 42 days [16]. In a second study, H2S continued to increase until the end of the study, at Day 42 [14]. Both of the previous studies included wood products which produced a secondary peak of H2S, while the current study used only corn stover [17,19]. Sulfate-reducing bacteria are obligate anaerobes [40]. As the bedded packs aged, the material became more and more compacted, presumably creating an anaerobic environment under the surface of the bedded pack, which was conducive to the production of H2S. At peak H2S flux, the bedded packs that were treated with 10% alum in one dose had a significantly higher H2S flux than any other bedded packs. The bedded packs that received the 10% alum in weekly doses had a H2S flux not different to the bedded packs that received the 5% or 2.5% alum in one dose. From Day 14 to Day 28, bedded packs that received 10% alum treatments had the highest H2S flux, but overall H2S flux decreased as the packs aged. The hydrogen sulfide flux from the bedded packs treated with weekly doses of 10% alum was 168% of the flux from untreated bedded packs. The increase in H2S emission from bedded packs that received the 10% weekly alum dose could be related to two factors: increase in available sulfate due to the addition of sulfur as alum or a change in pH. Bedded packs receiving 10% alum had the highest concentration of sulfur in the bedded pack material, and thus more available substrate for H2S production. The release of gases from the bedded pack is also a function of the concentration of the gases near the surface in a non-ionized form, which can be easily affected by surface pH. A reduction in pH typically favors the emission of weak acid forming gases, such as CO2 and H2S [31]. While the H2S flux did decrease over time, the higher flux observed when alum was used is a concern for producers using alum to control NH3 emissions, as H2S emissions may increase.

3.5. Nutrient Composition

The average dry matter content of the bedded packs at the end of the study was 22.7% ± 1.3, which was similar to the dry matter content of corn stover bedded packs in previous studies conducted similarly [16,18,20] and slightly higher than the range of 16.9 ± 0.45 to 18.0 ± 0.33 measured over an 18-month period in commercial barns [23]. There was little difference in the nutrient composition of the bedded packs treated with the four concentrations of alum (Table 2). Because there were no interactions or differences due to the frequency of application, the table only includes nutrient concentrations for the main treatment effect of alum concentration. Phosphorus, potassium, and nitrogen content did not differ between all alum treatments. All bedded packs, regardless of treatment, had bedding, urine, and feces from a common source. Therefore, N input for all bedded packs was similar. With decreased NH3 emission, it was expected that the bedded packs treated with 10% alum would have a higher total N concentration than the untreated bedded packs, due to decreased N volatilization as ammonia. However, this was not the case. Either N was emitted in another form, such as N2 gas, that was not measured in this study, or N was retained in the pack but not detected using our analytical methods for total N detection. Perhaps some of the retained N was lost when the bedded pack material was dried prior to nutrient analysis. Another possibility for this anomaly is that the differences in cumulative N losses between the control and 10% alum treatments were small enough that they did not affect the total N concentration of the bedded pack materials. Sulfur increased with increasing levels of alum application. This was expected, as alum contains sulfur. This likely contributed to the increase in H2S emissions from the bedded packs that received the 10% alum application.

4. Conclusions

When alum was applied to a corn stover and manure mixture, it was necessary to use the 10% alum mixture to successfully lower NH3 emissions compared to the corn stover manure bedpack that was not treated with alum. A one-time dose of 10% alum was only able to sustain the lowered NH3 emissions for 14 days, but a total dose of 10% alum spread out in six equal weekly additions could maintain the reduced NH3 emissions for up to 42 days. Nitrous oxide emissions were also reduced when 10% alum was administered weekly. However, CH4 and H2S emissions increased when the bedded packs were treated with 10% alum compared to bedded packs that did not receive an alum treatment. Producers need to be aware of the trade-offs of lowering one emission at the risk of increasing another and consider the benefits of lowering one emission relative to another. While effective, weekly additions of alum also present practical issues for livestock producers. It may be more effective to target areas of the pen most likely to emit NH3. Producers may also consider less frequent applications, such as once every two or three weeks, but additional research is needed to determine the efficacy of this approach.

Author Contributions

Conceptualization, M.J.S., B.L.W., D.B.P.; Methodology, M.J.S.; Software, M.J.S.; Validation, M.J.S.; Formal Analysis, M.J.S.; Investigation, M.J.S., B.L.W.; Data Curation, M.J.S.; Writing–Original Draft Preparation, M.J.S.; Writing–Review & Editing, B.L.W., D.B.P.; Visualization, M.J.S..; Supervision, D.B.P.; Project Administration, M.J.S.; Funding Acquisition, M.J.S., B.L.W., D.B.P.

Funding

This project was funded by appropriated funds from the USDA. USDA is an equal opportunity provider and employer.

Acknowledgments

The author wishes to thank Alan Kruger, technician at USMARC, for help with data collection and lab analysis. The mention of trade names of commercial products in this article is solely for the purpose of providing specific information and does not imply recommendation or endorsement by the USDA.

Conflicts of Interest

The authors declare no conflict of interest.

References

  1. Stowell, R. Ammonia loss and emission reporting: Considerations for cattle operations. UNL BeefWatch. 1 February 2018. Available online: http://newsroom.unl.edu/announce/beef/7498/42942 (accessed on 13 June 2018).
  2. Todd, R.W.; Cole, N.A.; Clark, R.N.; Flesch, T.K. Ammonia emissions from a beef cattle feedyard on the Southern High Plains. Atmos. Environ. 2008, 42, 6797–6805. [Google Scholar] [CrossRef]
  3. Bierman, S.; Erickson, G.E.; Klopfenstein, T.J.; Stock, R.A.; Shain, D.H. Evaluation of nitrogen and organic matter balance in the feedlot as affected by level and source of dietary fiber. J. Anim. Sci. 1999, 77, 1645–1653. [Google Scholar] [CrossRef] [PubMed]
  4. Erickson, G.E.; Milton, C.T.; Klopfenstein, T.J. Dietary protein effects on nitrogen excretion and volatilization in open-dirt feedlots. In Proceedings, Eighth International Symposium on Animal, Agricultural, and Food Processing Waste (ISAAF); American Society of Agricultural Engineers: St. Joseph, MI, USA, 2000. [Google Scholar]
  5. Koelsch, R.; Erickson, G.; Homolka, M.; Luebbe, M. Predicting Manure Nitrogen, Phosphorus, and Carbon Characteristics of Open Lot Systems; ASABE Paper No. 1800946; ASABE: St. Joseph, MI, USA, 2018. [Google Scholar]
  6. Bierman, S.; Klopfenstein, T.J.; Stock, R.; Shain, D. Evaluation of Nitrogen, Phosphorus, and Organic Matter Balance in the Feedlot as Affected by Nutrition; Beef Cattle Report MP66-A; University of Nebraska: Lincoln, NE, USA, 1996; pp. 74–76. [Google Scholar]
  7. Van Horn, H.H.; Newton, G.L.; Kunkle, W.E. Ruminant nutrition from an environmental perspective: Factors affecting whole-farm nutrient balance. J. Anim. Sci. 1996, 74, 3082–3102. [Google Scholar] [CrossRef] [PubMed]
  8. Hausinger, R.P. Metabolic versatility of prokaryotes for urea deposition. J. Bacteriol. 2004, 186, 2520–2522. [Google Scholar] [CrossRef] [PubMed]
  9. Hartung, J.; Phillips, V.R. Control of gaseous emissions from livestock buildings and manure stores. J. Agric. Eng. Res. 1994, 57, 173–189. [Google Scholar] [CrossRef]
  10. Rhoades, M.B.; Parker, D.B.; Cole, N.A.; Todd, R.W.; Caraway, E.A.; Auvermann, B.W.; Topliff, D.R.; Schuster, G.L. Continuous ammonia emission measurements from a commercial beef feedyard in Texas. Trans. ASABE 2010, 53, 1823–1831. [Google Scholar] [CrossRef]
  11. Moore, P.A., Jr.; Daniels, T.C.; Edwards, D.R. Reducing phosphorus runoff and inhibiting ammonia loss from poultry manure with aluminum sulfate. J. Environ. Qual. 2000, 29, 37–49. [Google Scholar] [CrossRef]
  12. Moore, P.A.; Edwards, D.R. Long-term effects of poultry litter, alum-treated litter, and ammonium nitrate on phosphorus availability in soils. J. Environ. Qual. 2007, 36, 163–174. [Google Scholar] [CrossRef]
  13. Moore, P.A., Jr.; Daniels, T.C.; Edwards, D.R. Reducing phosphorus and improving poultry production with alum. Poult. Sci. 1999, 78, 692–698. [Google Scholar] [CrossRef]
  14. Sims, J.T.; Luka-McCafferty, N.J. On-farm evaluation of aluminum sulfate (alum) as a poultry litter amendment: Effects on litter properties. J. Environ. Qual. 2002, 31, 2066–2073. [Google Scholar] [CrossRef]
  15. Penn, C.; Zhang, H. Alum-Treated Poultry Litter as a Fertilizer Source. Oklahoma Cooperative Extension Service PSS-2254. 2017. Available online: http://pods.dasnr.okstate.edu/docushare/dsweb/Get/Document-5180/PSS-2254web13.pdf (accessed on 11 September 2019).
  16. Spiehs, M.J.; Brown-Brandl, T.M.; Parker, D.B.; Miller, D.N.; Berry, E.D.; Wells, J.E. Effect of bedding materials on concentration of odorous compounds and Escherichia coli in beef cattle bedded manure packs. J. Environ. Qual. 2013, 42, 65–75. [Google Scholar] [CrossRef] [PubMed]
  17. Spiehs, M.J.; Brown-Brandl, T.M.; Parker, D.B.; Miller, D.N.; Jaderborg, J.P.; DiCostanzo, A.; Berry, E.D.; Wells, J.E. Use of wood-based materials in beef bedded manure packs: 1. Effect on ammonia, total reduced sulfide, and greenhouse gas concentrations. J. Environ. Qual. 2014, 43, 1187–1194. [Google Scholar] [CrossRef] [PubMed]
  18. Spiehs, M.J.; Brown-Brandl, T.M.; Berry, E.D.; Wells, J.E.; Parker, D.B.; Miller, D.N.; Jaderborg, J.P.; DiCostanzo, A. Use of wood-based materials in beef bedded manure packs: 2. Effect on odorous volatile organic compounds, odor activity value, Escherichia coli, and nutrient concentrations. J. Environ. Qual. 2014, 43, 1195–1206. [Google Scholar] [CrossRef] [PubMed]
  19. Spiehs, M.J.; Brown-Brandl, T.M.; Parker, D.B.; Miller, D.N.; Berry, E.D.; Wells, J.E. Ammonia, total reduced sulfides, and greenhouse gases of pine chip and corn stover bedding packs. J. Environ. Qual. 2016, 45, 630–637. [Google Scholar] [CrossRef] [PubMed]
  20. Spiehs, M.J.; Berry, E.D.; Wells, J.; Parker, D.B.; Brown-Brandl, T.M. Odorous volatile organic compounds, Escherichia coli, and nutrient composition when kiln-dried pine chips and corn stover bedding are used in beef bedded manure packs. J. Environ. Qual. 2017, 46, 722–732. [Google Scholar] [CrossRef] [PubMed]
  21. Spiehs, M.J. Lab-scale model to evaluate odor and gas concentrations emitted by deep bedded pack manure. J. Vis. Exp. 2018, 137, e57332. [Google Scholar] [CrossRef]
  22. Brown-Brandl, T.M.; Nienaber, J.A.; Eigenberg, R.A. Temperature and humidity control in indirect calorimeter chambers. Trans. ASABE 2011, 54, 685–692. [Google Scholar] [CrossRef]
  23. Spiehs, M.J.; Woodbury, B.L.; Doran, B.E.; Eigenberg, R.A.; Kohl, K.D.; Varel, V.H.; Berry, E.D.; Wells, J. Environmental conditions in beef deep-bedded mono-slope facilities: A descriptive study. Trans. ASABE 2011, 54, 663–673. [Google Scholar] [CrossRef]
  24. Miller, D.N.; Woodbury, B.L. A solid-phase microextraction chamber method for analysis of manure volatiles. J. Environ. Qual. 2006, 35, 2383–2394. [Google Scholar] [CrossRef]
  25. Woodbury, B.L.; Miller, D.N.; Eigenberg, R.A.; Nienaber, J.A. An inexpensive laboratory and field chamber for manure volatile gas flux analysis. Trans. ASABE 2006, 49, 767–772. [Google Scholar] [CrossRef]
  26. Watson, M.; Wolf, A.; Wolf, N. Total nitrogen. In Recommended Methods of Manure Analysis; Publication No. A3769; University of Wisconsin Cooperative Extension: Madison, WI, USA, 2003; pp. 18–24. [Google Scholar]
  27. Wolf, A.; Watson, M.; Wolf, N. Digestion and dissolution methods for P, K, Ca, Mg, and trace elements. In Recommended Methods of Manure Analysis; Publication No. A3769; University of Wisconsin Cooperative Extension: Madison, WI, USA, 2003; pp. 30–38. [Google Scholar]
  28. Ayadi, F.Y.; Cortus, E.L.; Spiehs, M.J.; Miller, D.N.; Dijira, G.D. Ammonia and greenhouse gas concentration at surfaces of simulated beef cattle bedded manure packs. Trans. ASABE 2015, 58, 783–795. [Google Scholar]
  29. Miller, D.N.; Varel, V.H. In vitro study of the biochemical origin and production limits of odorous compounds in cattle feedlots. J. Anim. Sci. 2001, 79, 2949–2956. [Google Scholar] [CrossRef] [PubMed]
  30. Miller, D.N.; Varel, V.H. An in vitro study of manure composition on the biochemical origins, composition, and accumulation of odorous compounds in cattle feedlots. J. Anim. Sci. 2002, 80, 2214–2222. [Google Scholar] [CrossRef] [PubMed]
  31. Dai, X.R.; Blanes-Vidal, V. Emissions of ammonia, carbon dioxide, and hydrogen sulfide from swine wastewater during and after acidification treatment: Effect of pH, mixing, and aeration. J. Environ. Manag. 2013, 115, 147–154. [Google Scholar] [CrossRef] [PubMed]
  32. Hellman, B.; Zelles, L.; Palojarvi, A.; Bai, Q. Emission of climate-relevant trace gases and succession of microbial communities during open-windrow composting. Appl. Environ. Microbiol. 1997, 63, 1011–1018. [Google Scholar]
  33. Mackie, R.I.; Stroot, P.G.; Varel, V.H. Biochemical identification and biological origin of key odor components in livestock waste. J. Anim. Sci. 1998, 76, 1331–1342. [Google Scholar] [CrossRef]
  34. Batstone, D.J.; Keller, J.; Angelidaki, I.; Kalyuzhnyi, S.V.; Pavlostathis, S.G.; Rozzi, A.; Sanders, W.T.M.; Siegrist, H.; Vavilin, V.A. The IWA anaertobic digestion model no. 1 (ADM1). Water Sci. Technol. 2002, 45, 65–73. [Google Scholar] [CrossRef]
  35. Batstone, D.J.; Keller, J. Industrial applications of the IWA anaerobic digestions model no. 1 (ADM1). Water Sci. Technol. 2003, 47, 199–206. [Google Scholar] [CrossRef]
  36. Arikan, O. Effect of temperature on methane production from field-scale anaerobic digesters treating dairy manure. In Waste to Worth: Spreading Science and Solutions; Livestock Poultry Environmental Learning Center: Seattle, WA, USA, 2015. [Google Scholar]
  37. Chandra, R.; Takeuchi, H.; Hasegawa, T. Methane production from lignocellulosic agricultural crop wastes; A review in context to second generation of biofuel production. Renew. Sustain. Energy Rev. 2012, 16, 1462–1476. [Google Scholar] [CrossRef]
  38. Tauseef, S.M.; Premalatha, M.; Abbasi, T.; Abbasi, S.A. Methane capture from livestock manure. J. Environ. Manag. 2013, 117, 187–207. [Google Scholar] [CrossRef]
  39. Environmental Protection Agency. Inventory of U.S. Greenhouse Gas Emissions and Sinks 1990–2015. 2017. Available online: https://www.c2es.org/content/internation-emissions (accessed on 18 June 2018).
  40. Reis, M.A.M.; Almeida, J.S.; Lemos, P.C.; Carrondo, M.J.T. Effect of hydrogen sulfide on growth of sulfate reducing bacteria. Biotechnol. Bioeng. 1992, 40, 593–600. [Google Scholar] [CrossRef] [PubMed]
Figure 1. Average ammonia flux (mg m−2 h−1) for weekly measurements taken over 42 days for bedded packs treated with 0, 2.5, 5, and 10% alum, either in one dose or in weekly doses. Alum × Dose × Day interaction p < 0.01, Pooled standard error of the mean = 8.19. Clusters with different letters indicate significant differences p < 0.05.
Environments 06 00108 g001
Figure 2. Average carbon dioxide flux (mg m−2 h−1) for weekly measurements taken over 42 days for bedded packs treated with 0, 2.5, 5, and 10% alum, either in one dose or in weekly doses. Alum × Dose × Day interaction p < 0.01, Pooled standard error of the mean = 154.3. Clusters with different letters indicate significant differences p < 0.05.
Environments 06 00108 g002
Figure 3. Average methane flux (mg m−2 h−1) for weekly measurements taken over 42 days for bedded packs treated with 0, 2.5, 5, and 10% alum, either in one dose or in weekly doses. Alum × Dose × Day interaction p < 0.01, Pooled standard error of the mean = 0.76. Clusters with different letters indicate significant differences p < 0.05.
Environments 06 00108 g003
Figure 4. Average nitrous oxide flux (mg m−2 h−1) for weekly measurements taken over 42 days for bedded packs treated with 0, 2.5, 5, and 10% alum either in one dose or in weekly doses. Alum × Dose × Day interaction p < 0.01, pooled standard error of the mean = 0.05. Clusters with different letters indicate significant differences p < 0.05.
Environments 06 00108 g004
Figure 5. Nitrous oxide emission (mg m−2 h−1) over 42 days for bedded packs treated with 0, 2.5, 5, and 10% alum either in one dose or in weekly doses. All treatments given in one dose are shown in solid colored bars and weekly increments are shown in striped bars for each treatment. Alum × Dose p < 0.01.
Environments 06 00108 g005
Figure 6. Average hydrogen sulfide flux (µg m−2 h−1) for weekly measurements taken over 42 days for bedded packs treated with 0, 2.5, 5, and 10% alum either in one dose or in weekly doses. Alum × Dose × Day interaction p < 0.01, pooled standard error of the mean = 4.62. Clusters with different letters indicate significant differences p < 0.05.
Environments 06 00108 g006
Table 1. Mean pH and temperature (°C) of bedded pack material on Day 0–42 following the addition of alum.
pH
Dose FrequencyAlumDay
071421283542
Once0%7.068.49 a8.18 a8.03 a7.97 a7.81 a7.79 b
Weekly0%7.048.51 a8.27 a8.10 a7.76 a,b7.91 a7.82 b
Once2.5%7.058.43 a,b8.16 a,b8.14 a7.84 a,b7.98 a7.96 a
Weekly2.5%6.958.44 a8.19 a8.04 a7.77 a,b7.85 a7.66 b,c
Once5%7.008.03 c8.14 a8.00 a7.75 a,b7.85 a7.77 b
Weekly5%7.208.29 a,b8.08 a,b8.03 a7.75 a,b7.83 a7.83 b
Once10%7.006.92 d7.93 b7.97 a,b7.68 b7.84 a7.70 b,c
Weekly10%7.178.21 a,b8.17 a,b7.62 b7.64 b7.65 b7.60 c
Temperature
Dose FrequencyAlumDay
071421283542
Once0%20.019.120.221.221.721.121.6
Weekly0%20.019.120.021.421.321.121.6
Once2.5%20.019.120.021.321.420.921.6
Weekly2.5%20.019.220.121.121.420.921.6
Once5%20.019.119.921.021.120.921.5
Weekly5%20.019.219.721.121.120.721.5
Once10%20.019.320.021.021.120.821.7
Weekly10%20.019.420.421.221.421.121.7
Within a column, different superscripts indicate significant differences between treatments (p < 0.05).
Table 2. Average nutrient composition of the bedded packs at Day 42, following the addition of alum.
AlumPhosphorusPotassiumSulfurNitrogen
g kg−1 (DM)
0%0.903.405.0926.76
2.5%0.913.636.5625.84
5%0.933.558.0126.28
10%0.913.4710.7326.31
p-values
Alum0.91970.436<0.010.5036
Frequency0.42740.54310.53380.8204
Alum × Frequency0.42690.59660.62040.6662

