Article

Nano Silver-Iron-Reduced Graphene Oxide Modified Titanium Dioxide Photocatalytic Remediation System for Organic Dye

by
Danielle Thandi Sass
1,
Emile Salomon Massima Mouele
2 and
Natasha Ross
1,*
1
SensorLab, Department of Chemistry, University of Western Cape, Private Bag X17, Bellville, Cape Town 7535, South Africa
2
Environmental Nano Science Research Group, Department of Chemistry, University of Western Cape, Private Bag X17, Bellville, Cape Town 7535, South Africa
*
Author to whom correspondence should be addressed.
Environments 2019, 6(9), 106; https://doi.org/10.3390/environments6090106
Submission received: 2 July 2019 / Revised: 12 August 2019 / Accepted: 20 August 2019 / Published: 9 September 2019

Abstract

:
The organic water contaminant, methyl orange contaminant (M.O), has shown a hazardous increase in our water systems over the past few years due to its increasing demand in industrial processes. The photocatalytic degradation of the commercial dye was studied through the application of modified TiO2 composite catalysts in aqueous solution under artificial irradiation. The improvement of photocatalytic activity is strongly affected by the various functional groups emerging in the organic substances. In this work, the effect of both silver-iron and silver-iron-reduced graphene oxide-modified titanium dioxide towards M.O remediation as a cost-effective photocatalyst was investigated. We confirmed that the novel AgFe functionalized TiO2 catalyst (AgFe-TiO2) showed more superior remediation activity than the reduced graphene oxide (rGO)-modified TiO2 due to the decreased band gap from 3.02 eV–2.5 eV with increased photocatalysis. Based on the spectroscopic and microscopic results, the enhanced photocatalytic degradation of M.O dye was induced by its enhanced surface area, electron diffusion, and the reduction of photo-generated electron-hole pairs’ recombination.

1. Introduction

The growth in agricultural and industrial activities has brought about the devastating deterioration of our rivers and groundwater quality due to pollution by hazardous textile contaminant effluents [1]. These pollutants include organic industrial dyes, phenol derivatives, and halocarbons [2]. One of the most harmful dyes, in particular, is methyl orange (M.O) azo dye/orange II (C14H14N3NaO3S) [3]; even the slightest quantity (1 ppm) can be detrimental to human health [4]. The reductive cleavage of azo linkages is responsible for the formation of amines, which are classified as toxic and carcinogenic [5]. Hence, methyl orange is regarded as a model pollutant, which is the object of strict environmental regulations on discharging industrial effluents [6,7]. According to environmental standards, the direct discharge of M.O in concentrations higher than 5 mg/L, treated or not, could be detrimental to human health and the aquatic environment [8,9]. A significant amount of the total world production of these dyes is estimated to be released into waterways without complete decontamination.
Various technologies have been developed for the removal of azo dyes from water and wastewater to reduce their environmental impact [10]. The common technologies include physical methods (membrane filtration processes and sorption techniques), chemical methods (coagulation or flocculation and advanced oxidation processes (AOPs)), and biological methods (microbial and enzymatic degradation); each technology having its own merits and demerits [11,12,13].
Amongst these, AOPs are considered economical and simpler alternatives. These processes are based on the generation of highly-reactive and oxidizing hydroxyl radicals (OH.) in the presence of an irradiated semiconductor metal oxide photocatalyst for the degradation of toxic pollutants or used as pretreatment to produce biodegradable pollutants [14]. To date, the most used photocatalyst is TiO2 due to its photo-stability, low cost, and biological and chemical inertness [15]. Unfortunately, the wide band gap of TiO2 (Eg = 3.2 eV) [16] results in poor absorption of visible light and rapid recombination of the photo-generated electron-hole pairs. However, by increasing the surface area, i.e., the population of active sites for catalytic reaction, and by reducing the band gap energy [17], visible or UV light photocatalysis becomes possible [18,19,20]. Concomitantly, TiO2 can be functionalized by incorporation of metal ions [21,22,23,24,25]. It is reported that silver, in particular, can facilitate interfacial electron transfer in the composite by acting as an electron-conduction bridge and is conducive to retarding electron-hole recombination [26,27]. In this regard, modified-TiO2 catalysts have proven favorable for photocatalytic degrading of methyl orange and phenol as compared to bare TiO2 [28]. In this study, we investigated and compared the photocatalytic degradation ability of both reduced graphene oxide and Ag-Fe bimetal nanoparticles with TiO2, respectively. Photocatalytic enhancement imparted by the presence of graphene on a photocatalyst has been shown to fluctuate as a result of the model contaminant studied [29]. Both Ag and Fe are considered as suitable substances for photocatalysis due to their low cost and electro catalytic activity [30,31,32,33]. A low band gap, visible/UV light absorption, fast electron diffusion, and fast rate for methyl orange degradation are considered the gold standard to evaluate most accurately the photocatalyst quality [34,35,36,37,38,39,40,41]. Available records revealed that no work has been reported on the influence of AgFe-modified TiO2 functional groups on the photocatalytic degradation of methyl orange, which is the main purpose of this research work.

2. Materials and Methods

2.1. Chemicals

Methyl orange dye (4-dimethylaminoazobenzene-4′-sulfonic acid sodium salt), conforming to specifications defined by the American Chemical Society (ACS) reagent (85 %), isopropanol (98%), tetraisopropyl-orthotitanate (97%), ferrous sulfate heptahydrate (99%), nitric acid silver (I) salt (>99%), graphene oxide, and polyethylene glycol were obtained from Sigma Aldrich Co. A 1000-ppm stock solution was prepared by dissolving 1000 mg of it in 1000 mL of distilled water, and the required solutions were prepared by suitable dilution. All other chemicals were of analytical reagent grade. Deionized water was used for the preparation and dilution of solutions.

2.2. Synthesis of Single- and Mixed-Phase TiO2 Powders

TiO2 powders were fabricated by using a 1:3 ratio of titanium isopropoxide and isopropanol with a total volume of 6 mL. The mixture was stirred in a closed glass container for 10 min at 60 °C. To the stirring mixture, 5 mL of acetic acid were added and reserved for 15 min, followed by the addition of 12 mL of isopropanol. The blend was left to mix for 2 h, followed by heating at 100 °C in air to allow all the solvent to vaporize. The final gel product, i-TiO2, was obtained after additional annealing in a muffle furnace at 400 °C for 2 h. The method was repeated using n-propanol as a solvent to procure n-TiO2 as the resultant product.

2.3. Synthesis of AgFe and TiO2-AgFe-rGO Nanocomposite

The sol-gel procedure was used due to the advantage of low temperature synthesis, the formation of pure and uniform products, and producing functionalized products [42]. For the synthesis of Ag-Fe, 200 mL of NaOH were mixed with 100 mL of methanol solution containing 0.010 M of FeSO4.nH2O and 0.001 mol AgNO3 at room temperature under a nitrogen atmosphere and stirring for 30 min. The produced nanoparticles (Ag-Fe) were collected through vacuum filtration, rinsed, and dried under a vacuum at 50 °C for 10 h. To prepare the Ag-Fe/rGO nano composite, 1 g of graphene oxide was dipped into a 25-mL coating solution (10 mL of absolute ethanol and 15 mL of distilled water) containing 0.01 g polyethylene glycol (PEG) (20,000) and 1.05 g of FeSO4.7H2O. The mixture was mixed (stirring at 1000 r/min) for 30 min and then sonicated for 1.5 h. Then, 25 mL of 0.6 mol/L of NaBH4 solution were added dropwise at 0 °C for 2 h under vigorous stirring. Thereafter, 15 mL of 2.6 mmol/L of AgNO3 were added dropwise under stirring. The product was filtrated and dried in an oven at 60 °C overnight. Finally, the AgFe-rGO product (0.2 g) was mixed with 1 g of TiO2 (Degussa) nanopowder and 3 mL of NaOH (5 M). This was further sonicated for 2 h. The TiO2-AgFe-rGO was centrifuged, washed, and dried at 50 °C under a vacuum.

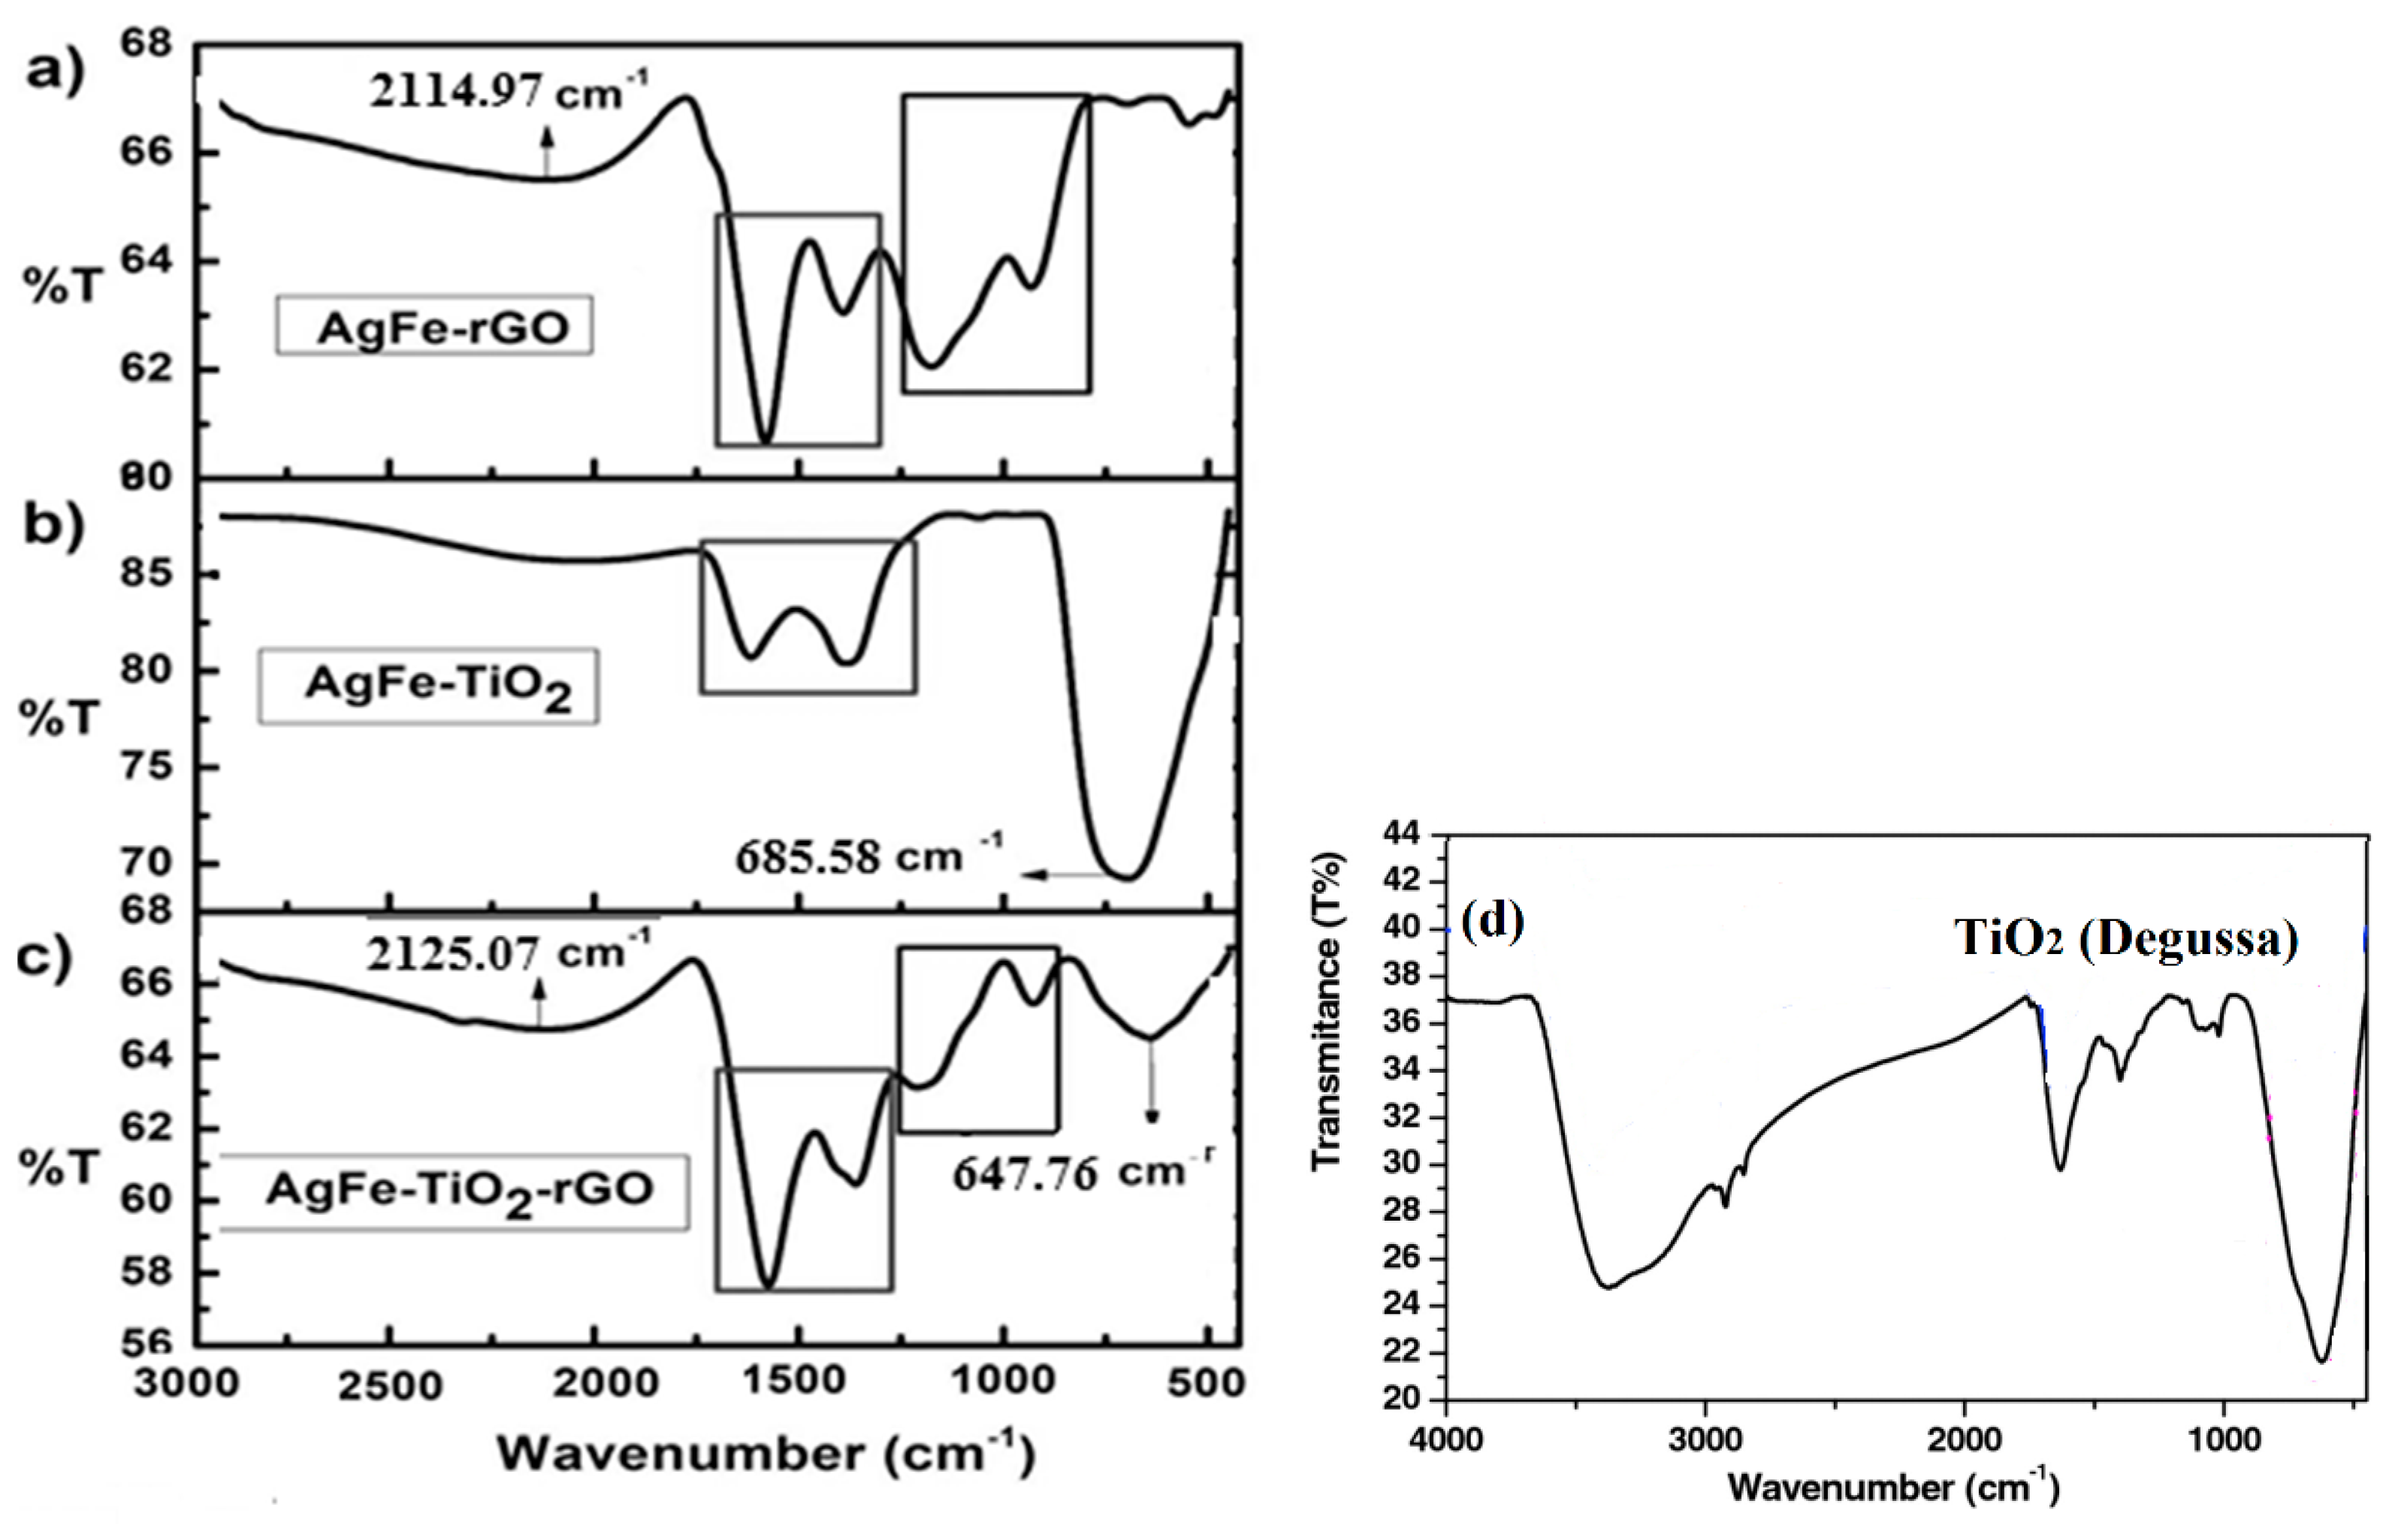
2.4. Characterization

The morphologies of the catalysts were probed by a ZEISS ULTRA high-resolution scanning electron microscope (HRSEM). Scanning electron X-rays were also reflected off the sample’s surface, which were collected and interpreted through EDAX. All analysis was performed with high-resolution HRSEM for improved atomic-scale material imagery. A Fourier transform infrared spectrometer (FT-IR, JASCO FT/IR-410) was used to probe the structural coordination of the samples in the wavenumber range from 500–3000 cm−1. The electrochemistry was done by using the conventional three-electrode cell, namely the working electrode (glassy carbon electrode), the reference electrode (Ag/AgCl), and the counter electrode (platinum wire). The setup was a CH Instrument electrochemical workstation, as well as a 600 E potentiostat (USA). The electrolyte solution was made up of LiOH and the sample. The experiment was carried out in an argon atmosphere at room temperature. The CV was used to determine the anodic and cathodic peaks and charge transfer diffusion of the synthesized nanomaterials.

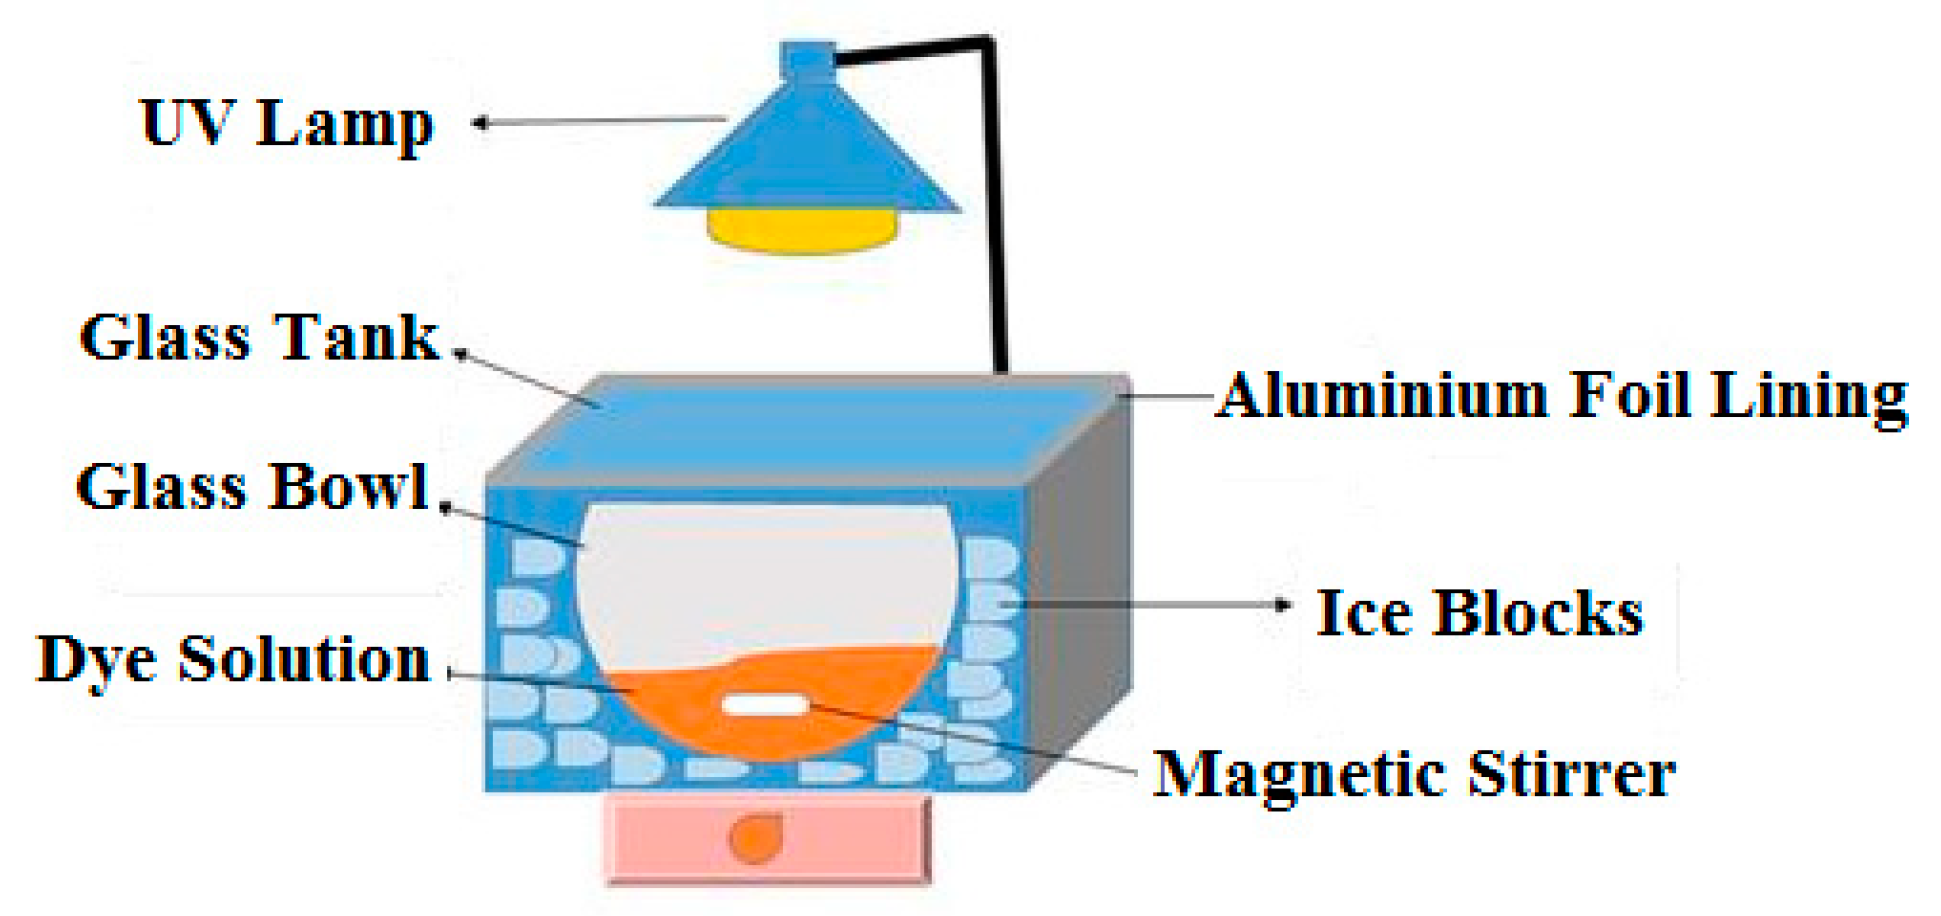
2.5. Photocatalytic Experimental Setup

The experimental setup used for the photocatalytic removal of M.O at the applied conditions is presented in Figure 1. The system consisted of a Mega-Ray 160-W/240-V MR160 SPL11/14, UV lamp (with a wavelength of 465 nm) from Kimix, a thick 5-mm glass tank, which was lined on the inside with aluminum foil, a glass bowl containing M.O solution, which rested on ice blocks for system cooling, and a magnetic stirrer placed in the vessel to ensure the homogeneity of the solution during the photocatalytic treatment process. Beforehand, the absorbance of standard concentrations of (M.O) dye was measured, and the plot of absorbance vs. standard concentrations resulted in a linear trend according to Beer’s law: A = ε · C · l, where A = absorbance (no units), ε = molar absorptivity coefficient (units = L/mol cm), C = concentration of absorbing species (units = mol/L). and l = path length (units = cm). At the end of each timed photocatalytic experiment, UV-Vis spectroscopy was utilized as an immediate measure of absorbance. The linear calibration was then used to approximate the unknown concentration of (M.O) dye at each sampling time.
Even though various factors may affect the removal of pollutants in water, in the current photocatalytic system, the initial dye concentration and solution pH were considered, and their impact on M.O degradation percentage was investigated by varying each parameter while other factors were kept constant. Each experiment was performed for 2 h by sampling every 30 min. The degradation percentages of M.O at the corresponding concentration were calculated using the formula presented in Equation (1).
D e g r a d a t i o n   % = [ C o C t C o ] ×   100

3. Results

3.1. Characterization of the Catalyst

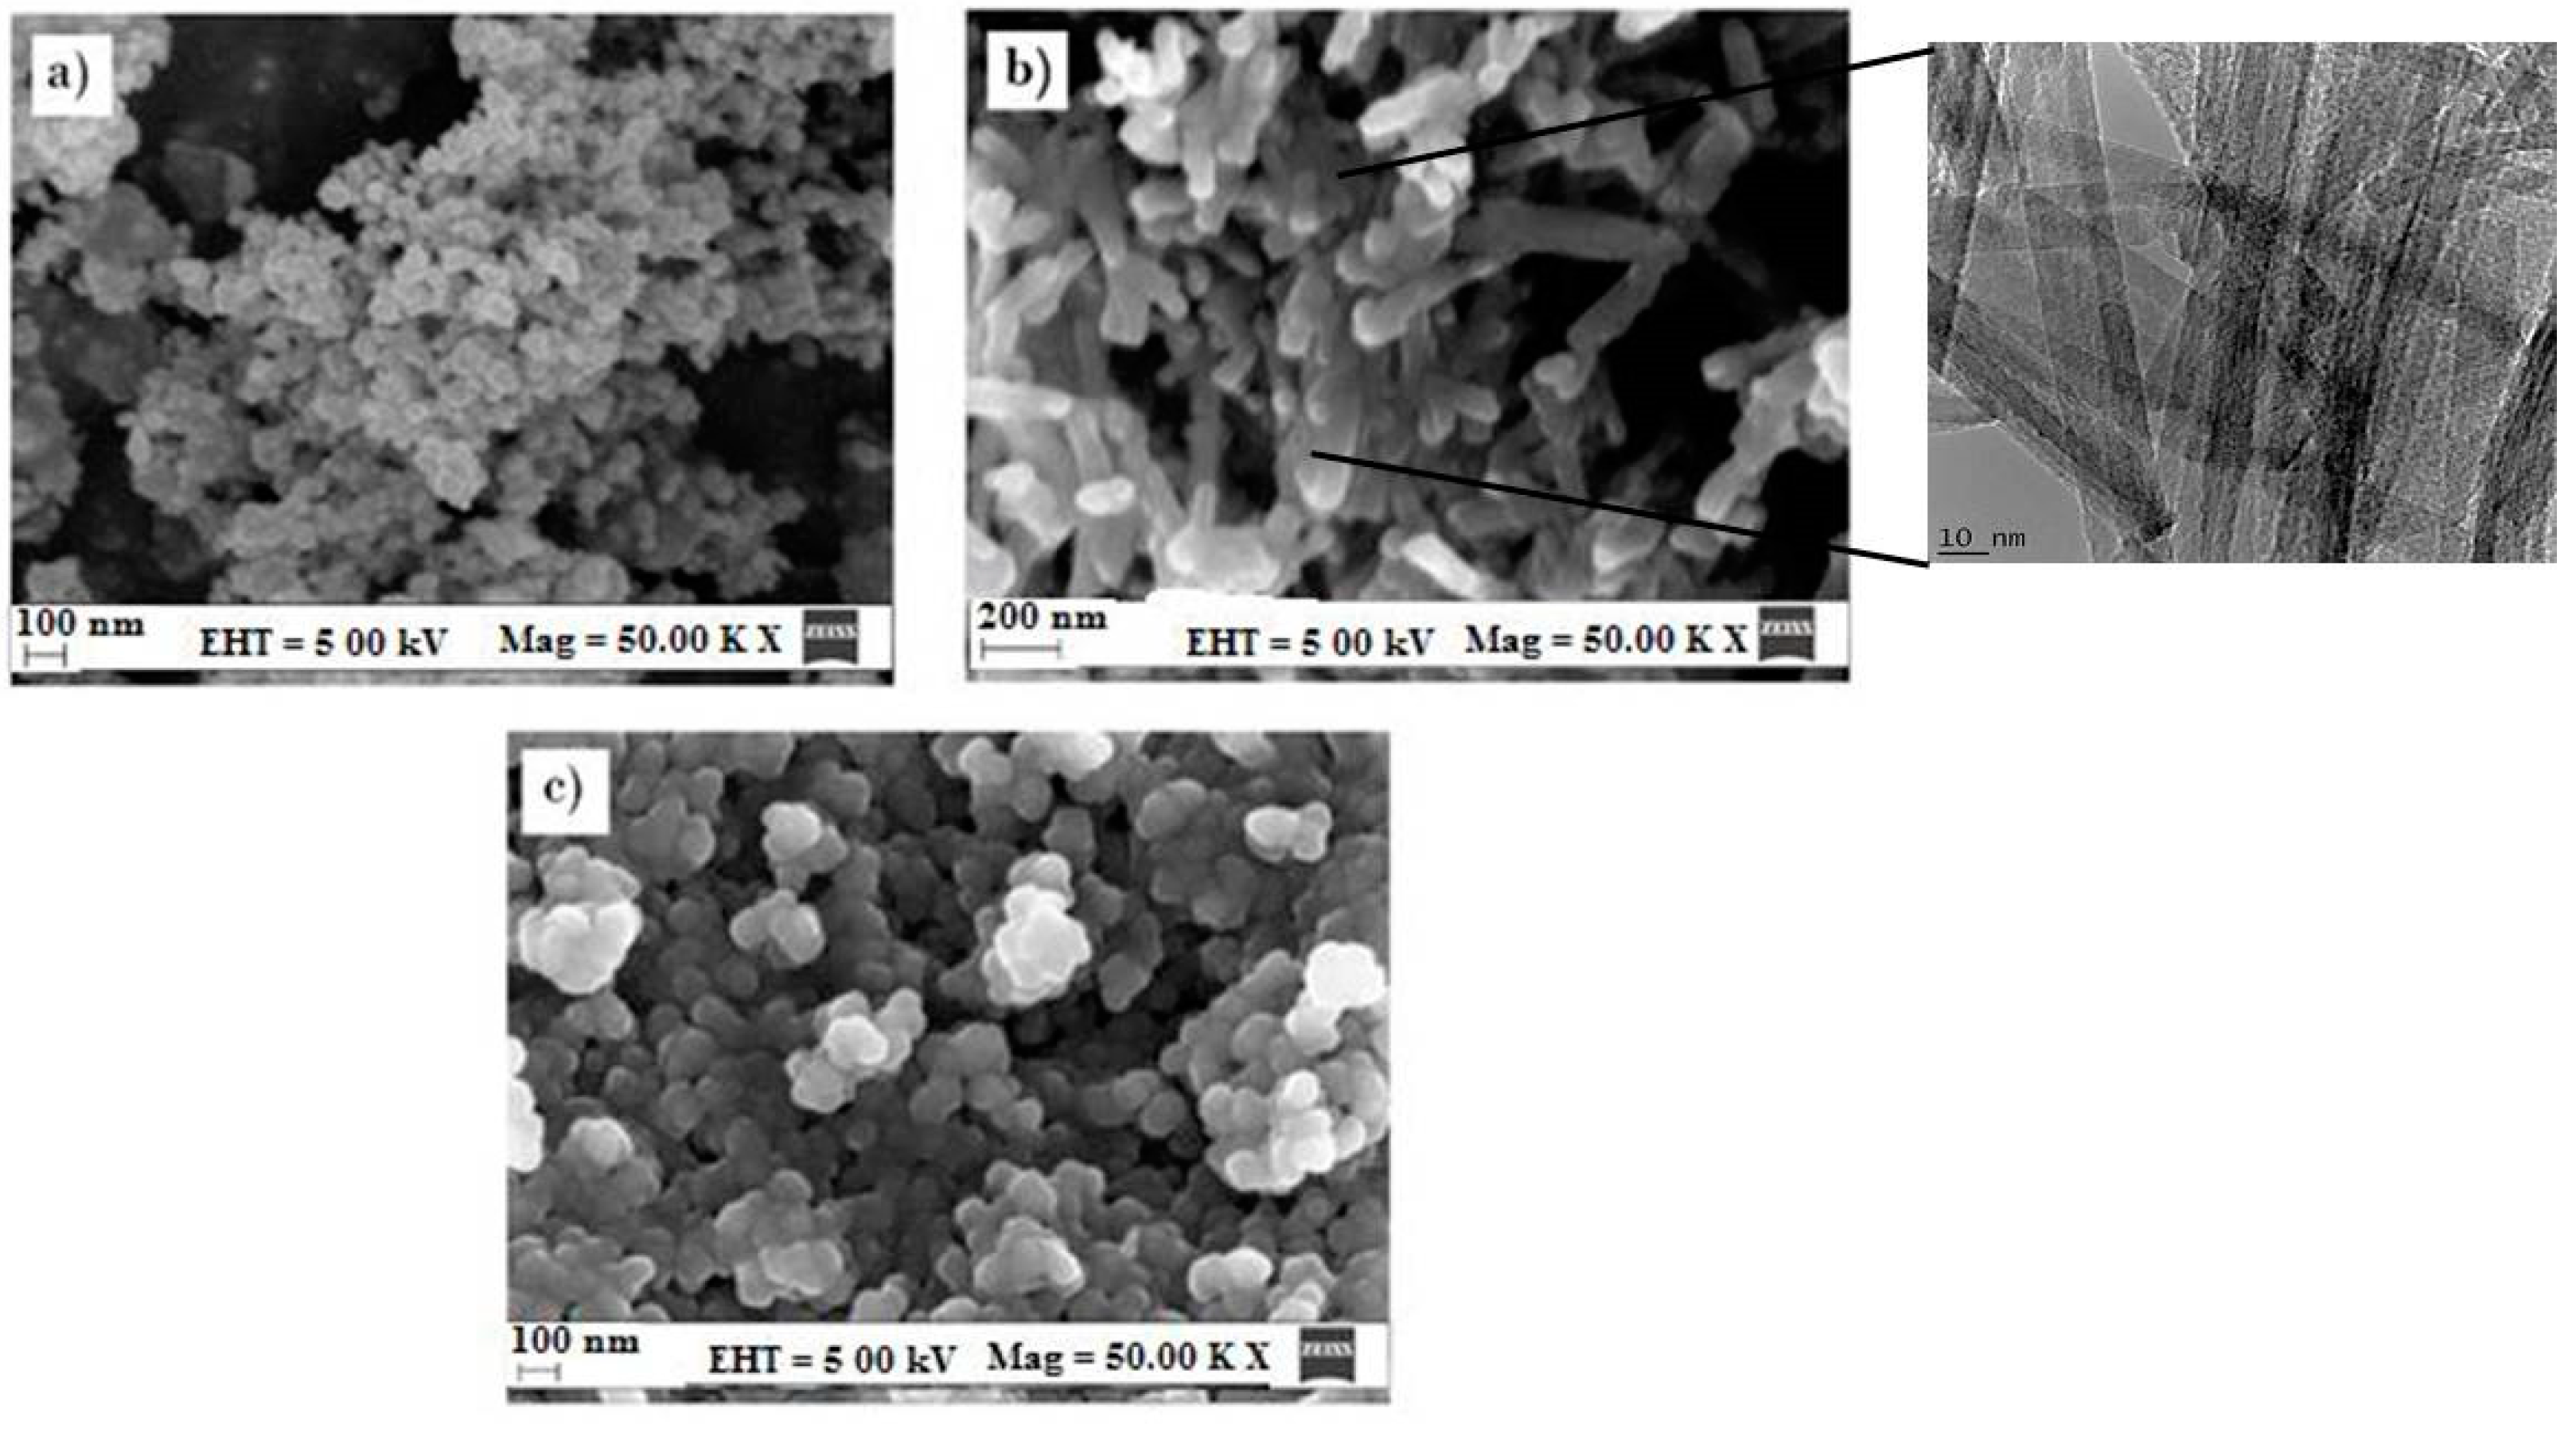
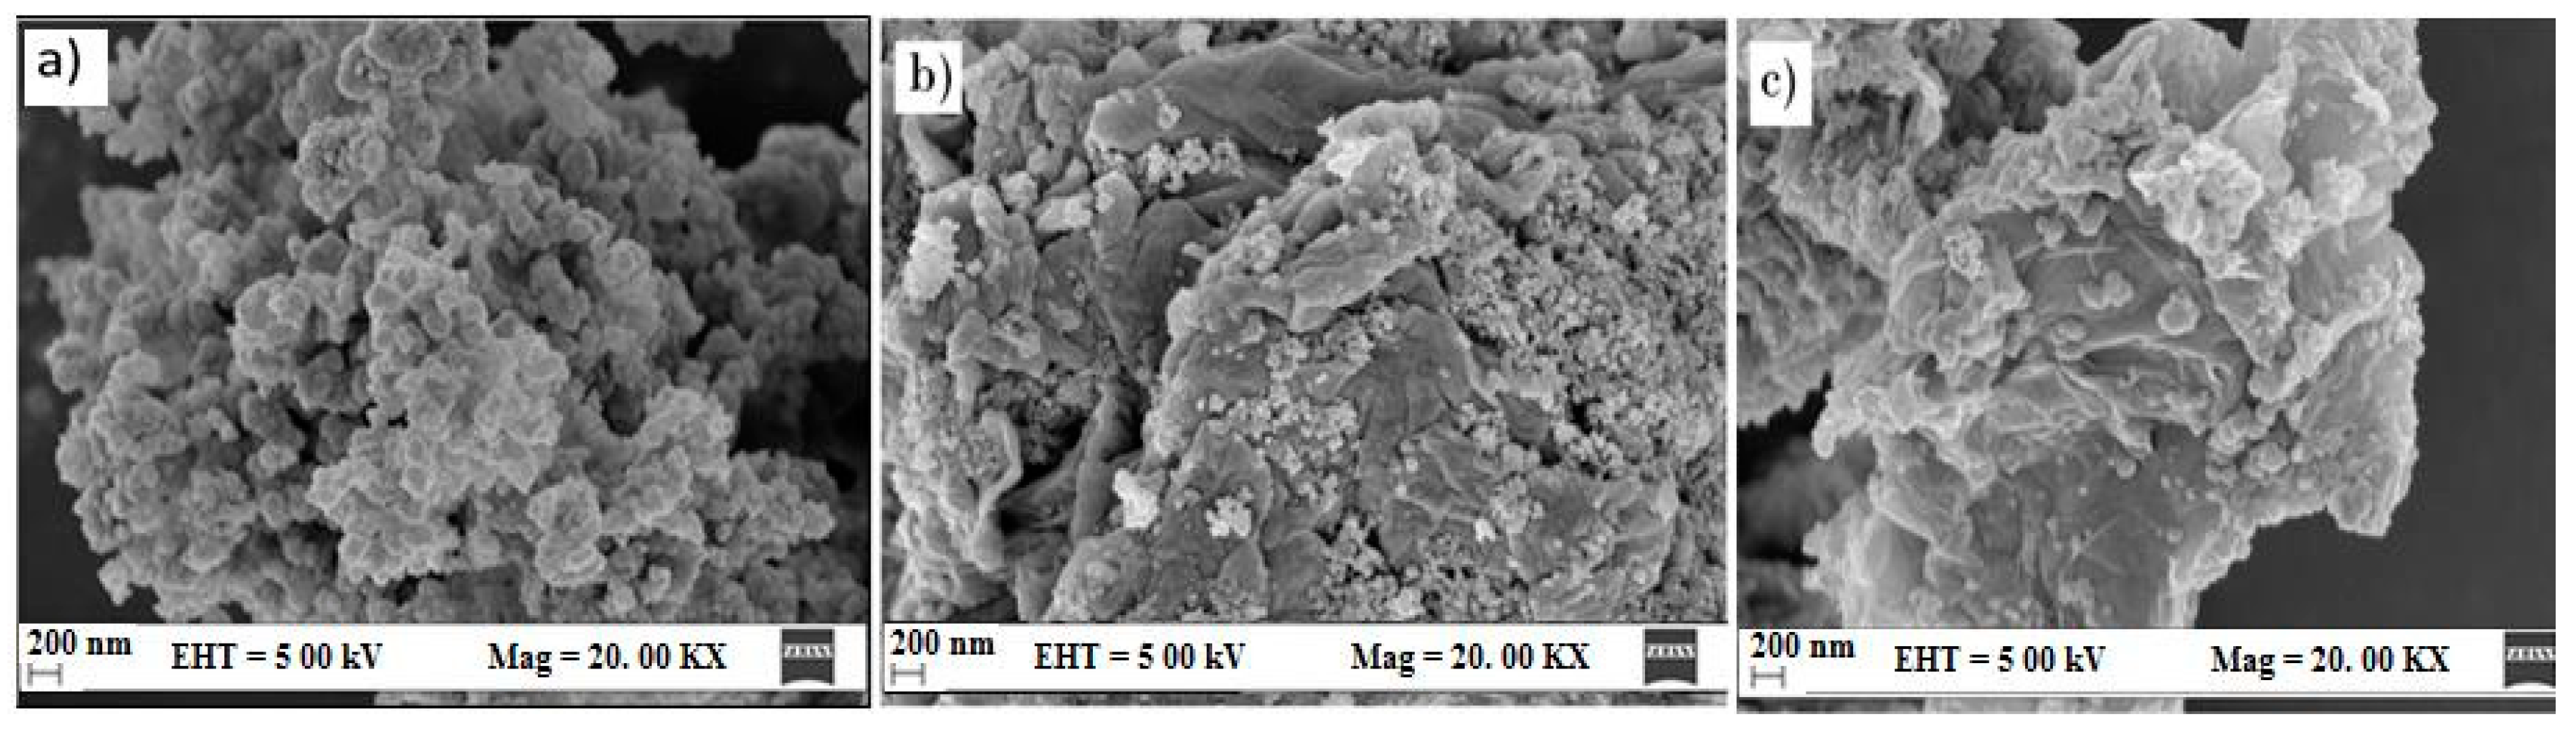
3.1.1. Scanning Electron Microscopy

From the materials science perspective of TiO2, it is important to consider both the presence of metallic and/or non-metallic dopants and the size and architecture of the catalyst, as these affect its photocatalytic activity [43]. Hence, the initial objective was to find the most suitable and highly reproducible known titanium dioxide nanostructures. Figure 2 illustrates three different forms of TiO2. Image (a) is the TiO2 Degussa nanopowder, which appears as agglomerated particles; roughly spherical in shape and approximately 15–25 nm in diameter. This was an indication of good dispersion, as it had a large surface area. Image (b) shows the TiO2 nanotubes, having long, tube-like, cross-stacked features with improved mechanical adhesion and size being roughly 1 µm in length and 60 nm in width. This indicates that TiO2 Degussa had a greater surface area and corresponding photoactivity according to the nanoscience research carried out by Schwarz et al. [44]. Image (c) is the synthesized TiO2 nanospheres. The TiO2 nanospheres were agglomerated, which in turn created much larger particles than if there were great separation between each particle. This could be due to the low temperature/pressure synthesis procedure, which produced particles with an average size of 70–90 nm in diameter. Photocatalysis testing was carried to establish the best photocatalyst before further testing was carried out, the result of which concluded that TiO2 (Degussa) was the best for the remediation of methyl orange from the water. Hence, TiO2 (Degussa) was further used to form the AgFe-TiO and AgFe-TiO2-rGO composite catalysts.
SEM analysis revealed the solid-state nature, as well as the intimate interaction between TiO2 and composite components. These are essential towards promoting photo charge transportation, as well as concentrating the organic substrate around TiO2. Figure 3a shows the morphological structure of the unmodified TiO2 Degussa catalyst at 20.00 kX. From the image, it is clear that the particles were agglomerated and roughly spherical in shape. Figure 3b shows spherically-shaped AgFe-TiO2 with good dispersion and approximately 15–25 nm in diameter. Research by Ranjit and Viswanathan [45] confirmed that the synergy of TiO2 with Fe (III) enhanced its photocatalytic activity. Figure 3c shows the rGO-AgFe-TiO2, where AgFe and TiO2 were completely infused with the rGO. Although the thicker catalyst may enhance light absorption, it also created a longer electron diffusion distance, which increased transport resistance and decreased photocatalytic activity. It is, therefore, speculated that photocatalysis would be carried out more efficiently with the AgFe-TiO2 (b) [46].

3.1.2. Cyclic Voltammetry

The fundamental phenomenon observed in semiconductor photocatalyst oxidizing (degrade) organic compounds and reducing metal ions is a promising technique in the treatment of refractory organic pollutants and heavy metals present in wastewater. Electrochemistry was used as a fundamental technique to probe the conduction efficiency and charge transfer resistance of AgFe-TiO2. Cyclic voltammetry (CV) studies were carried out to investigate the reversibility of the electrode reaction and charge efficiency at room temperature by using the Ag/AgCl electrode as a reference and the platinum electrode as a counter. The electronic interactions between the nanocomposites and the catalyst brought about slightly acidic conditions, which increased the rate of electron transfer, thus reducing the rate of electron-hole combination [47]. The separation efficiency between the generated electrons and holes could be explained based on the charge transfer resistance.
CV was used to probe the reaction mechanism of the system. Figure 4 shows the cyclic voltammograms of (a) TiO2 Degussa/GCE, (b) AgFe-rGO/GCE, (c) AgFe-TiO2/GCE, and (d) AgFe-TiO2-rGO/GCE. For the TiO2 sample (a), the expected anodic and cathodic redox peaks attributed to the pseudocapacitive nature of the sample were observed. Moreover, the peak current was found to be increased with successive scans. The observed discrepancy can be attributed to the reduction of Ti4+ to Ti3+ as per the reaction described in Equation (2):
TiO2 + e + 4H+ → Ti3+ + 2H2O
In the case of AgFe-rGO (b), the specific capacitance of the system was found to decline with increased scan rate with no distinctive redox peaks. Similar deficiency of electrochemistry is observed in Figure 4d, and this may be due to the fact that higher scan rates may not afford sufficient time for diffusion at the electrode interface. However, at the AgFe-TiO2 electrode (c), clear reduction and oxidation peaks resulting from the Faradaic reactions were discernible even at low scan rates, thereby confirming the co-presence of TiO2. The peak currents of both the oxidation and reduction peaks were found to increase with a consequent reduction in potential between the peaks. Some reversibility in the redox process was also observed for the AgFe-TiO2 electrode with the third reduction peak being indicative of the reduction of Ag2O to Ag [48]. It is noteworthy that the pristine TiO2 was composed of both rutile and anatase phases, whereas the modified TiO2 was composed mainly of the rutile phase. In addition, the AgFe-rGO, AgFe- TiO2, and AgFe-TiO2-rGO samples could have the combined effect of the faradaic capacitance of the TiO2 and the double-layer capacitance of the carbon and AgFe. This facilitated the enhanced conduction pathways with the modified catalysts [49].
The diffusion coefficient (D) in cm2/s of H+ ions was calculated by using the Randles–Sevcik Equation (3), where n is the number of electrons transferred in the redox event, A is electrode area in cm2, C is the concentration in mol/cm3, ν is the scan rate in V/s, and ј is the peak current density [50]. Compared to the D for the pure TiO2 electrode, determined to be 1.07 × 10⁻⁷, the diffusion coefficient for AgFe-TiO2-rGO and AgFe-TiO2 was 2.44 × 10⁻⁵ cm2 s−1 and 3.39 × 10⁻⁵ cm2 s−1, respectively, which showed an order of magnitude increase with the continuous nanofibers (10−6 cm2/s). The observed enhancement in the diffusion coefficient can be attributed to the lower photocurrent collection time due to the modified morphology. According to research by Rahul Malik et al. (2010), this can be attributed to a decrease in ion mobility due to diffusion in the bulkier sample being much slower [51].
D 1 2   =   j p 2.72   ×   10 5   ×   n 3 2   ×   A   ×   C o v 1 2
Electron diffusion coefficients and recombination lifetimes in the TiO2 films were studied with the size of particles and the film surface area. It was observed that electron recombination lifetimes decreased with the increase of particle size. The presence of rGO sheets is generally believed to improve electron diffusion and charge separation on TiO2 by scavenging photo-generated electrons away from the TiO2 conduction band. However, according to results obtained by Wang et al., it neither translates to the generation of more freely loose hydroxyl radicals nor improved adsorption of the organic pollutants on the modified photocatalyst [52]. Equally, in this study, the presence of a higher concentration rGO imparted the limited redox activity as a result of longer diffusion lengths [53]. Here, the AgFe-TiO2 catalyst showed enhanced electron diffusion due to optimum surface conditions, which was corroborated by its photocatalytic activity.

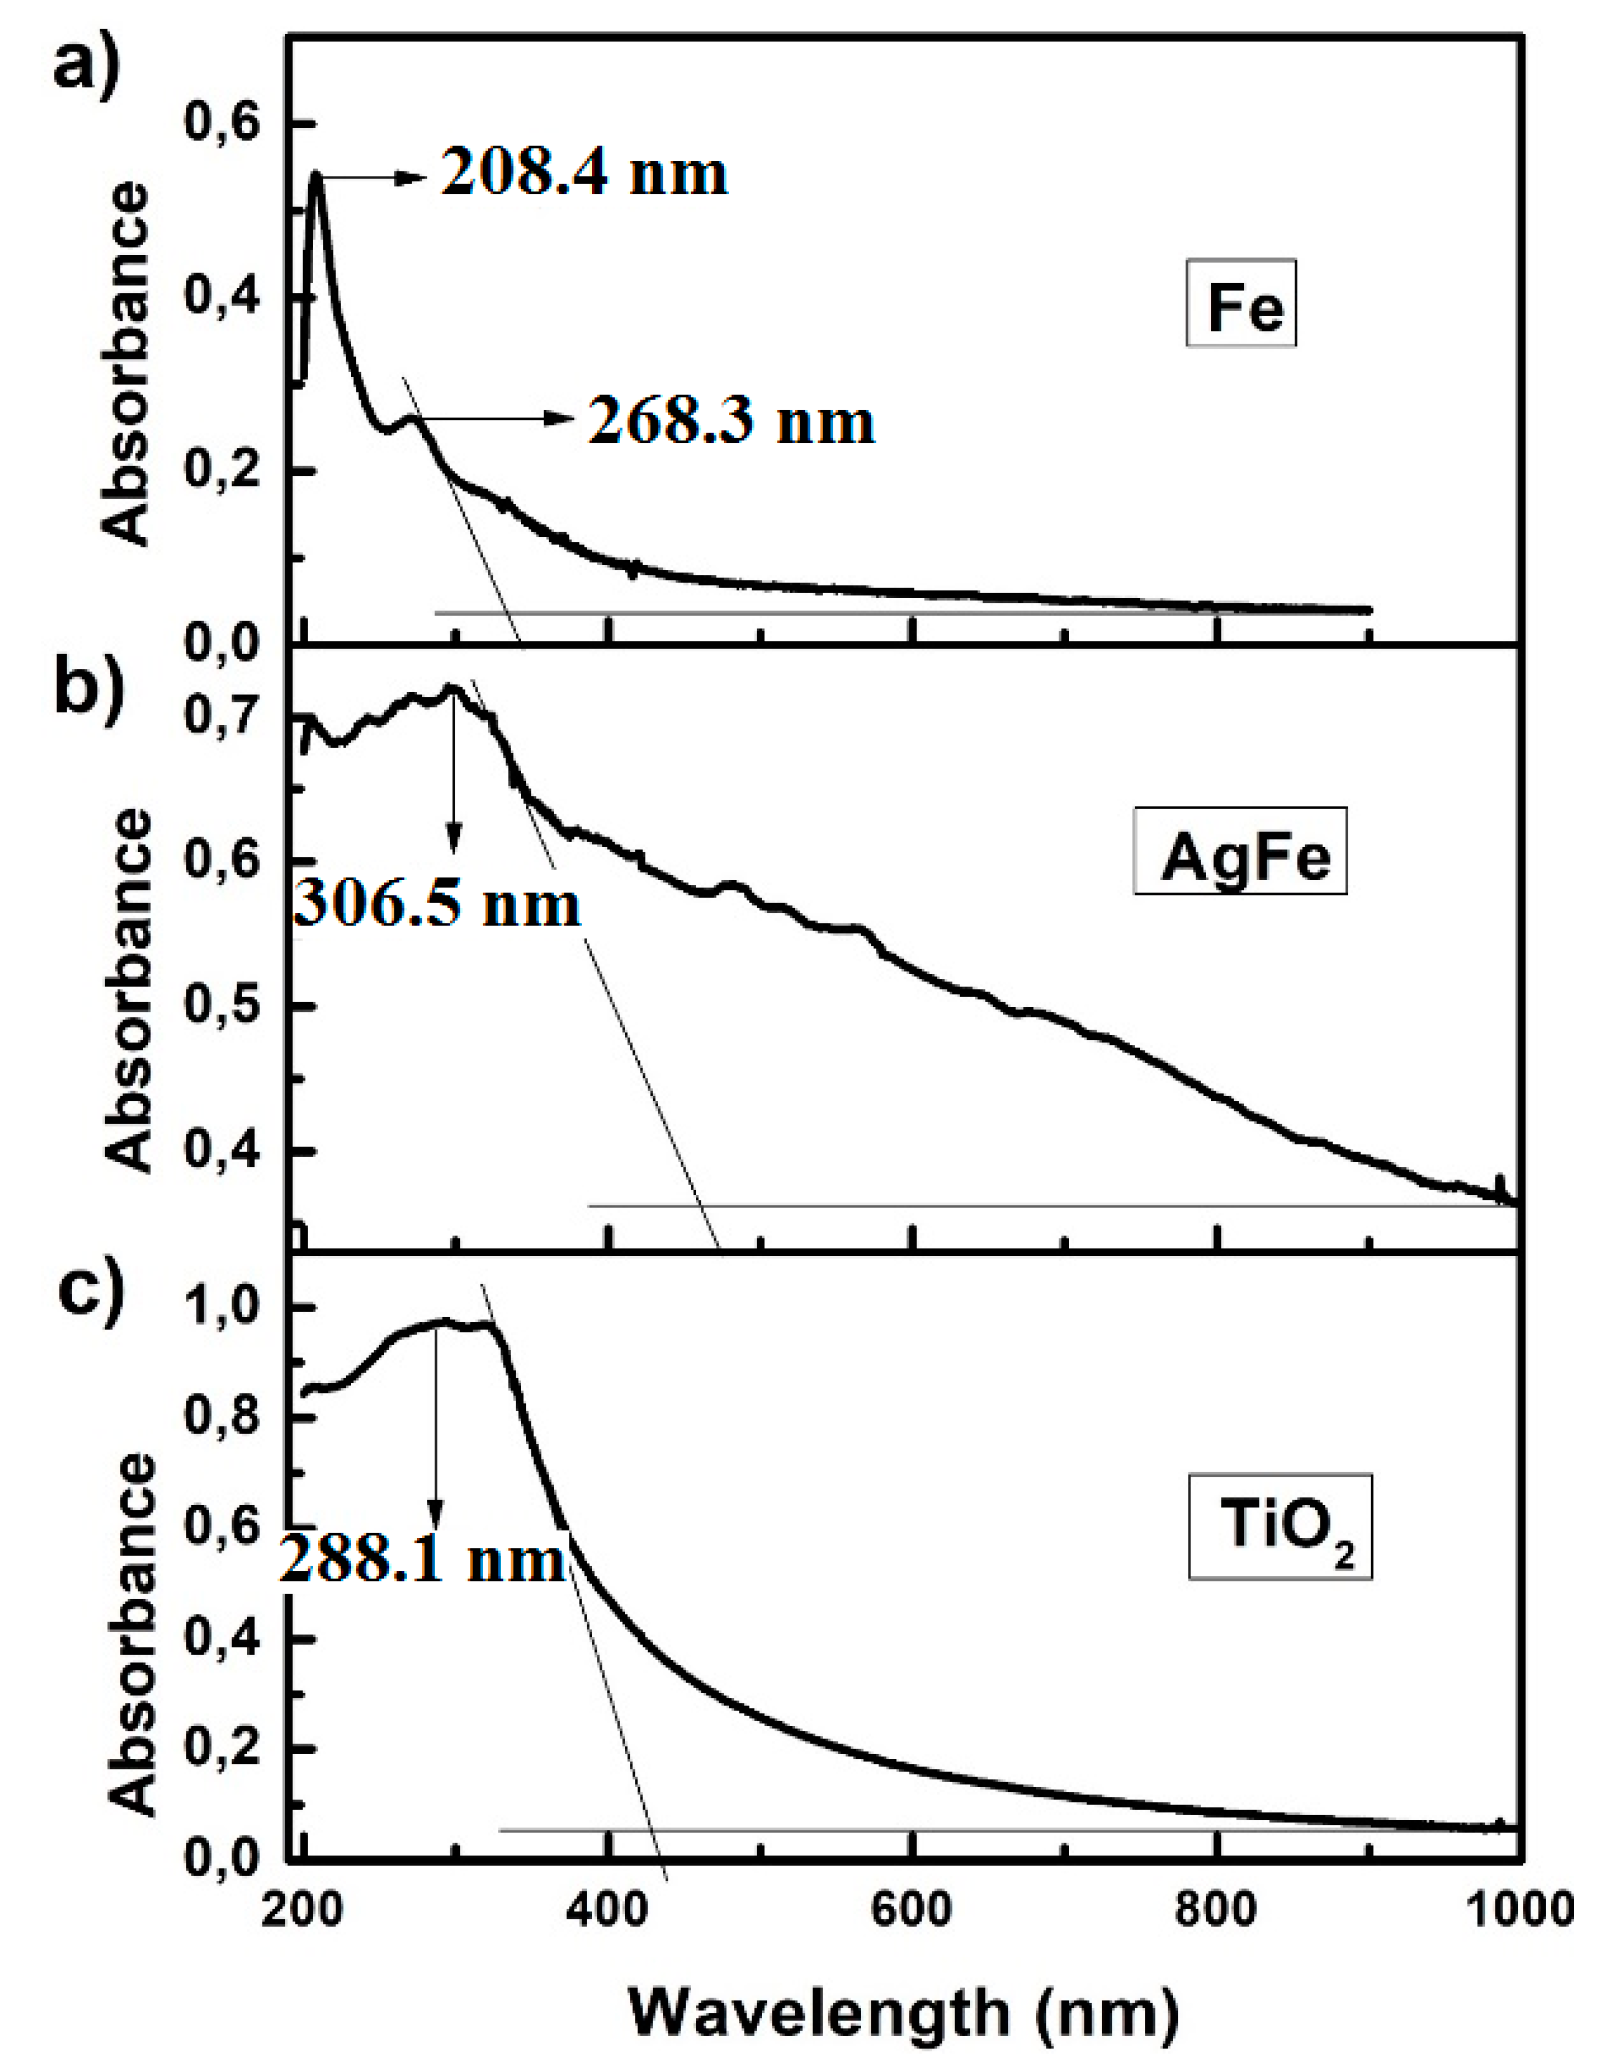
3.1.3. UV-Vis Analysis: Determination of the Catalyst Band Gap

The UV-visible spectra were measured to examine the optical absorption property of the samples, as shown in Figure 5. A sharp absorption peak in the range of 200 nm–300 nm, similar to that found by Paul Raj, Samuel in 2013, is shown in Figure 5a and verified the presence of Fe nanoparticles. The band gap for the synthesized Fe nanoparticles was calculated using the onset in the graph and the formula: E γ   =   h v   =   h c λ . It was therefore found that the band gap for Fe nanoparticles was 3.73 eV. Figure 5b shows the onset and the wavelength of AgFe with the calculated band gap of 2.5 eV. In Figure 5c the band gap for TiO2 Degussa was calculated to be 2.93 eV. This was close to the standard band gap of TiO2 Degussa, which is normally 3.1 eV. The lower band gap for the TiO2 Degussa was due to the nanosized particles that were inclined to provide more reactive sites, resulting in better photocatalytic performance [54]. Since the band gap of AgFe was calculated to be 2.5 eV, it could be inferred that it lowered the band gap of the TiO2 and caused a right shift (red shift) of the TiO2 peak. These elements may substitute the oxygen atoms in the TiO2 lattice and decrease its band gap by contributing their p-orbitals [55,56], thereby improving reaction rates for photocatalytic processes.

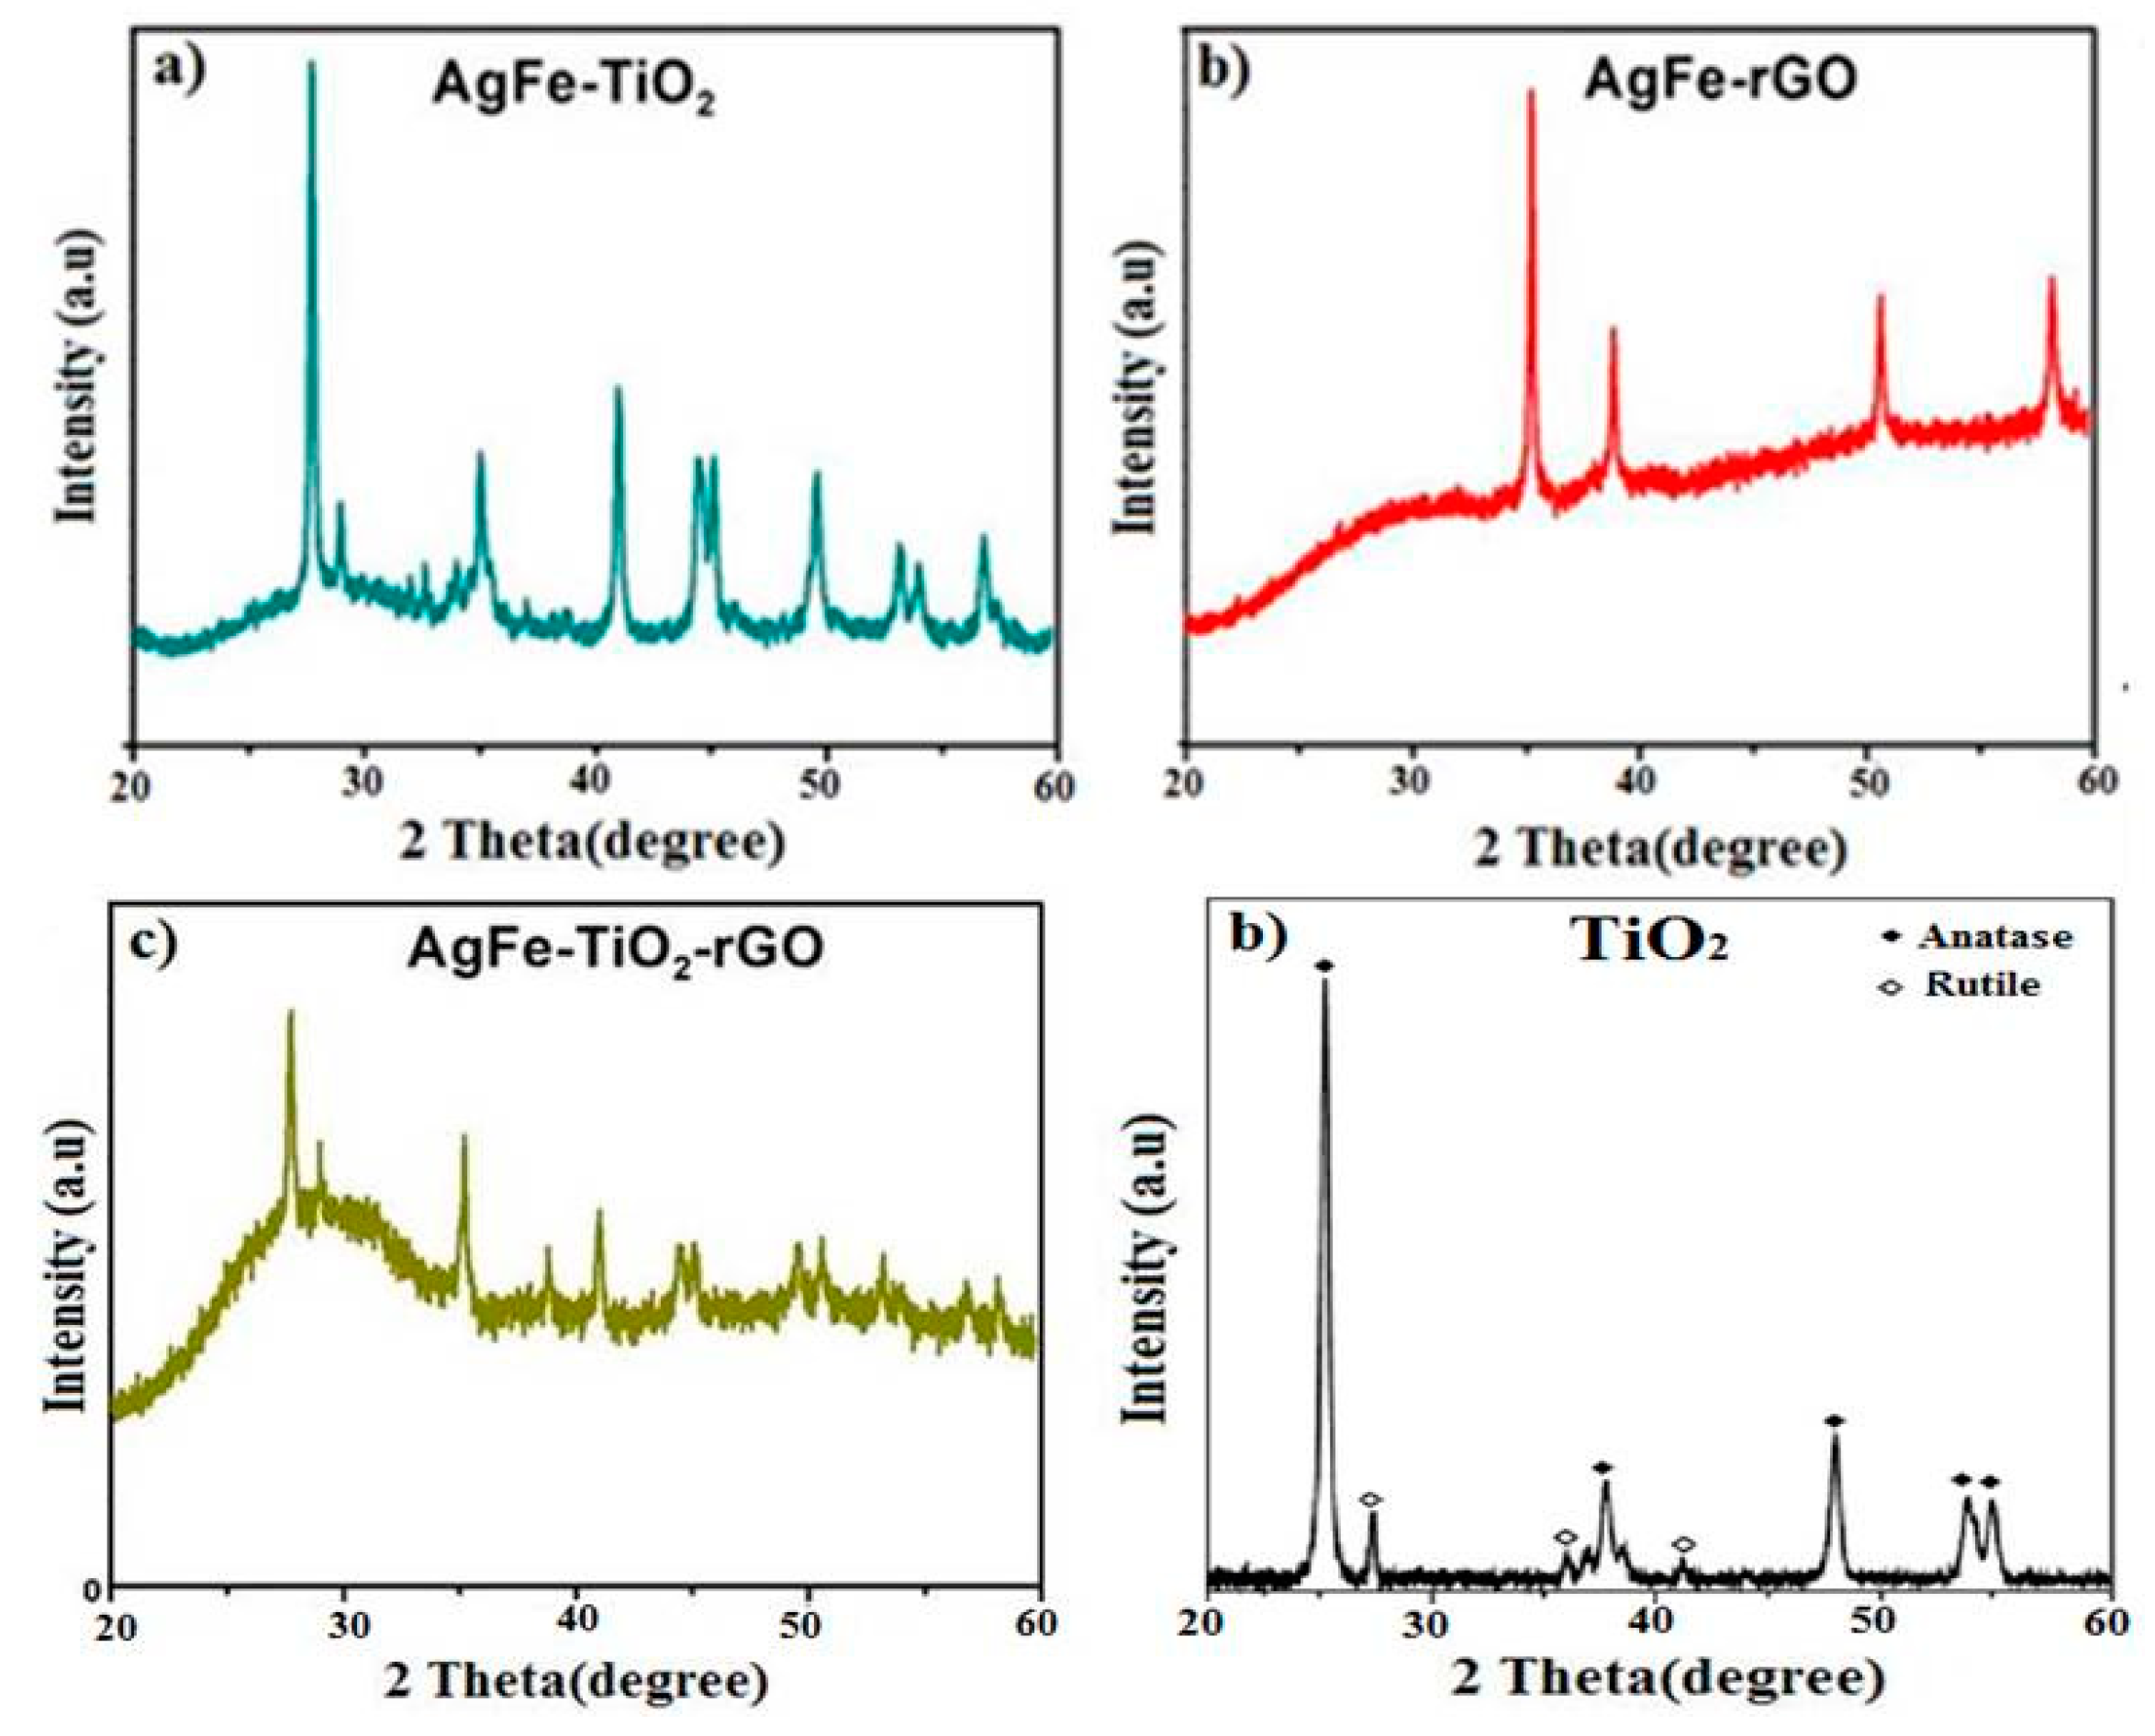
3.1.4. XRD Analysis: Determination of the Catalyst Band Gap

XRD was further used to examine the structures of AgFe-TiO2 (a), AgFe-rGO (b), AgFe-TiO2-rGO (c), and unmodified TiO2 (d), as shown in Figure 6. In the case of modified-TiO2 nanoparticle films, one peak at d = 3.346 °A was observed, which was indexed as (101) of the anatase phase in accordance with JCPDS-ICDD Card Number 75–1537. The XRD pattern in Figure 6a clearly shows the main peaks at (2θ) 36.19, 44.37, and 64.56 corresponding to the (111), (200), and (220) planes of Ag, respectively. In addition, the iron oxide particles were confirmed by the peaks at 2θ at 43.1, 51.6, and 62.6 concerning reflection of the crystal structure of magnetite (400), (440), and (533), respectively. For the AgFe-rGO sample (b), the (002) reflection peak was broad and was centered at around 25 degrees. The d-spacing for AgFe-TiO2 and AgFe-TiO2-rGO was calculated to be 2.22 nm and 3.25 nm, respectively. The broadening of the width of the half maximum of the peak in (b) and (c) was due to the reduced graphene oxide (rGO). The XRD pattern for unmodified TiO2 films (d) showed no distinct diffraction peaks, indicating its amorphous nature.

3.2. Photochemical and Photocatalysis

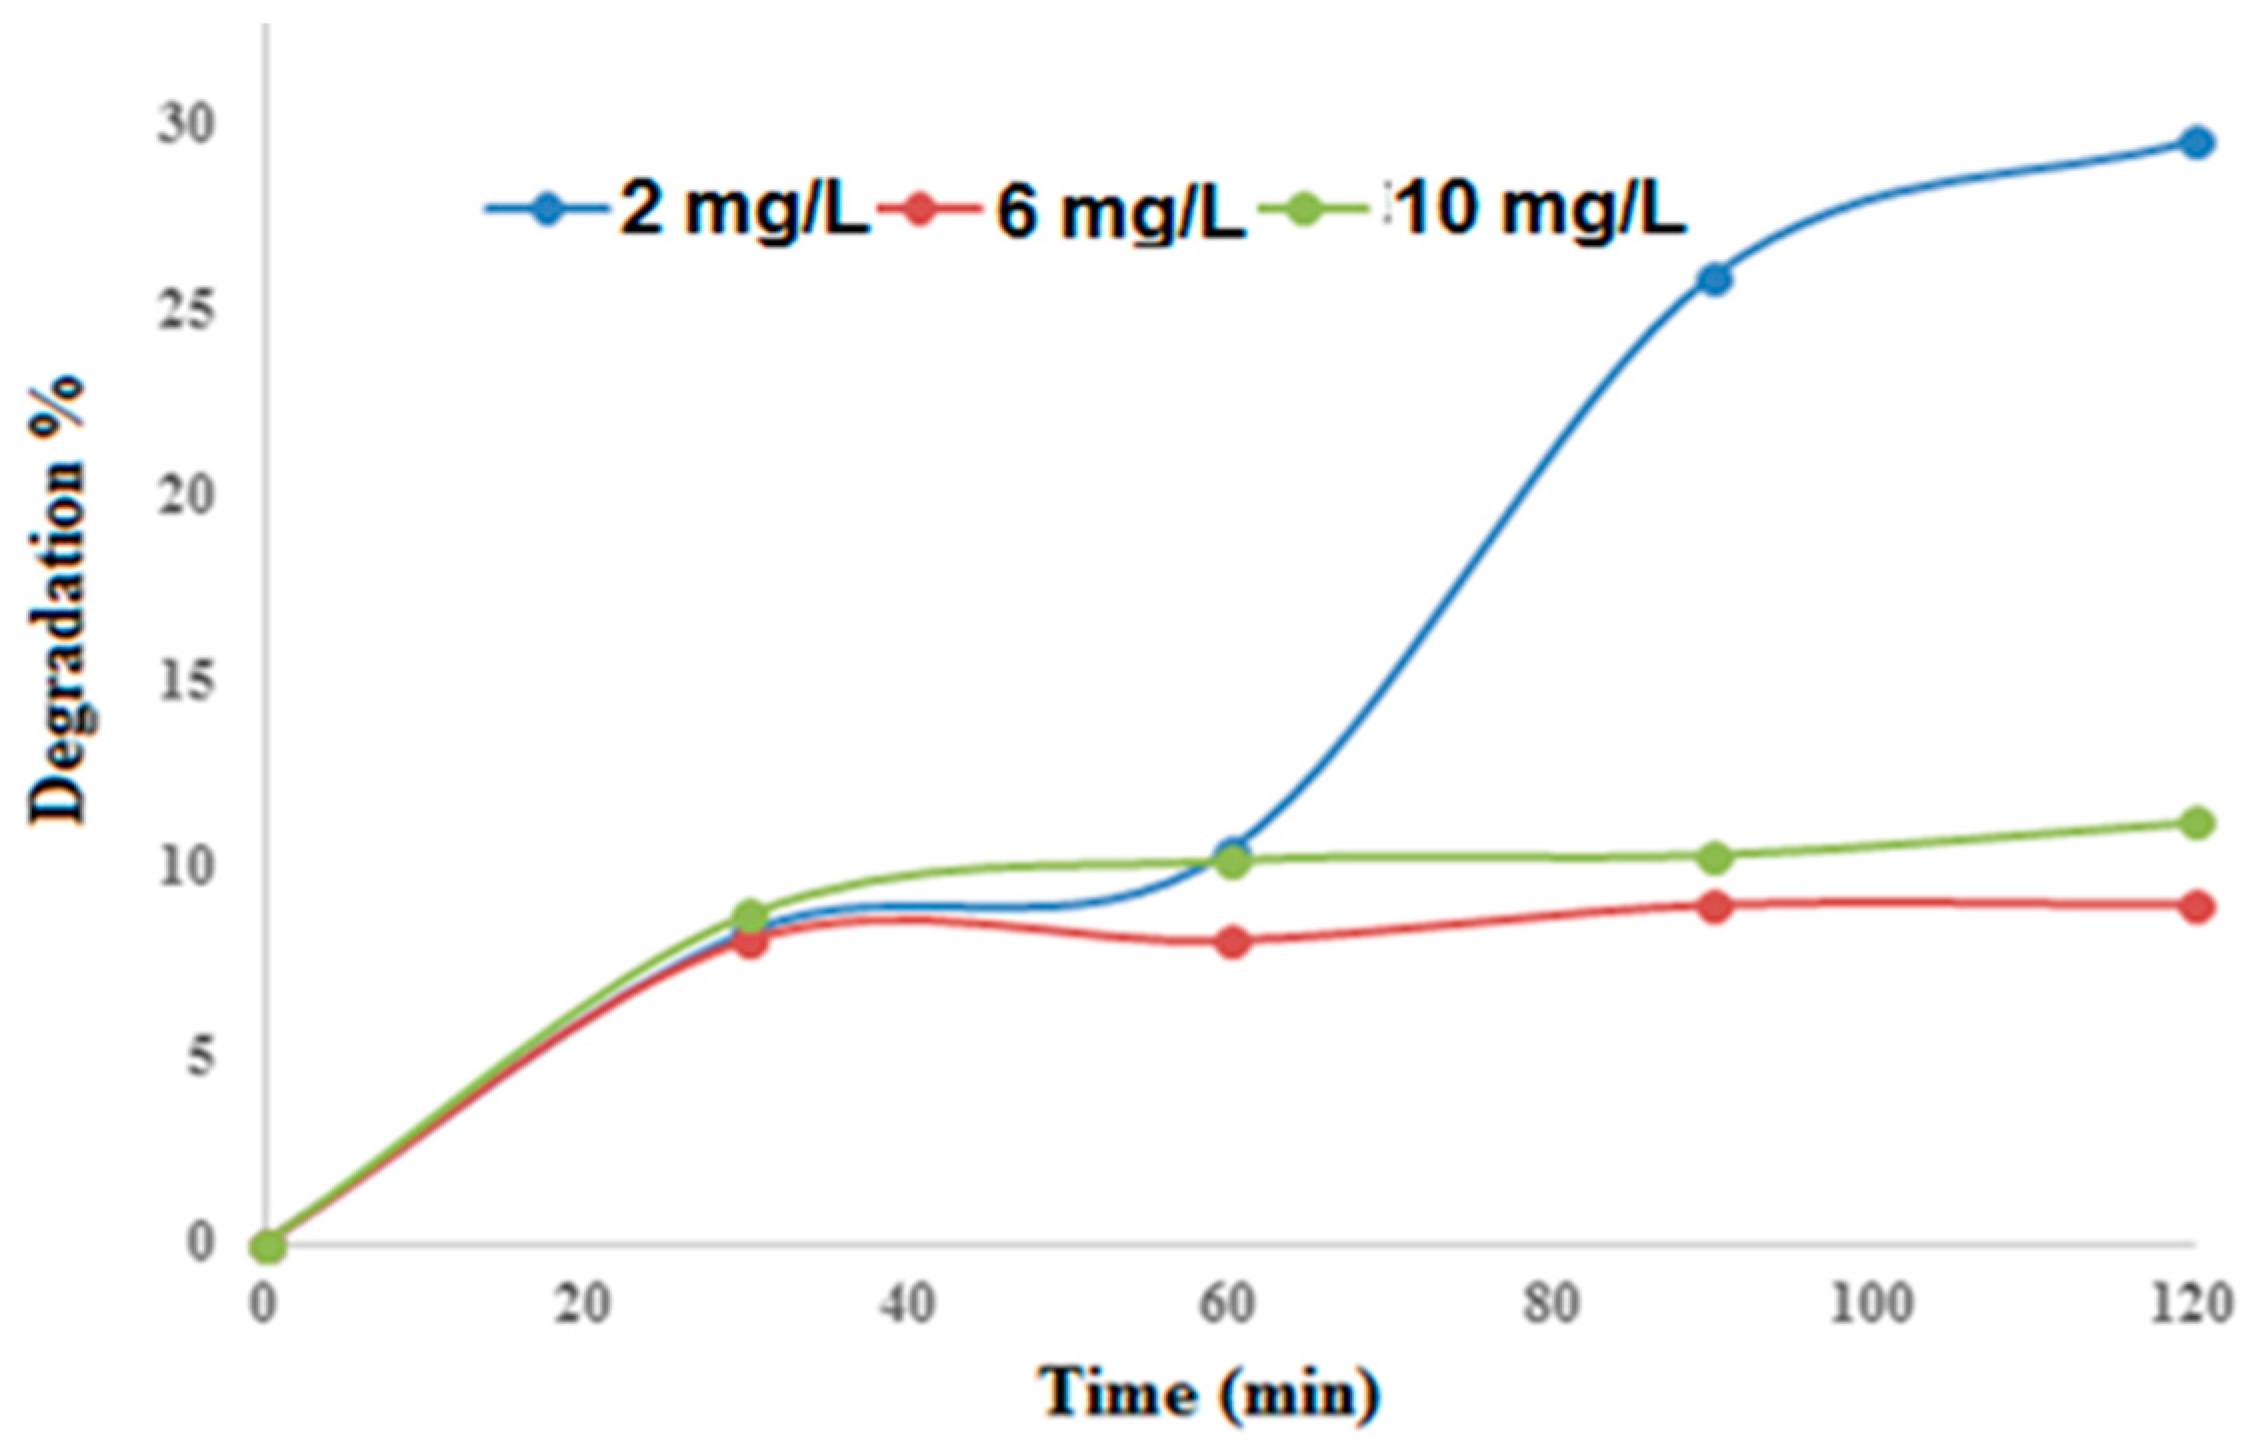
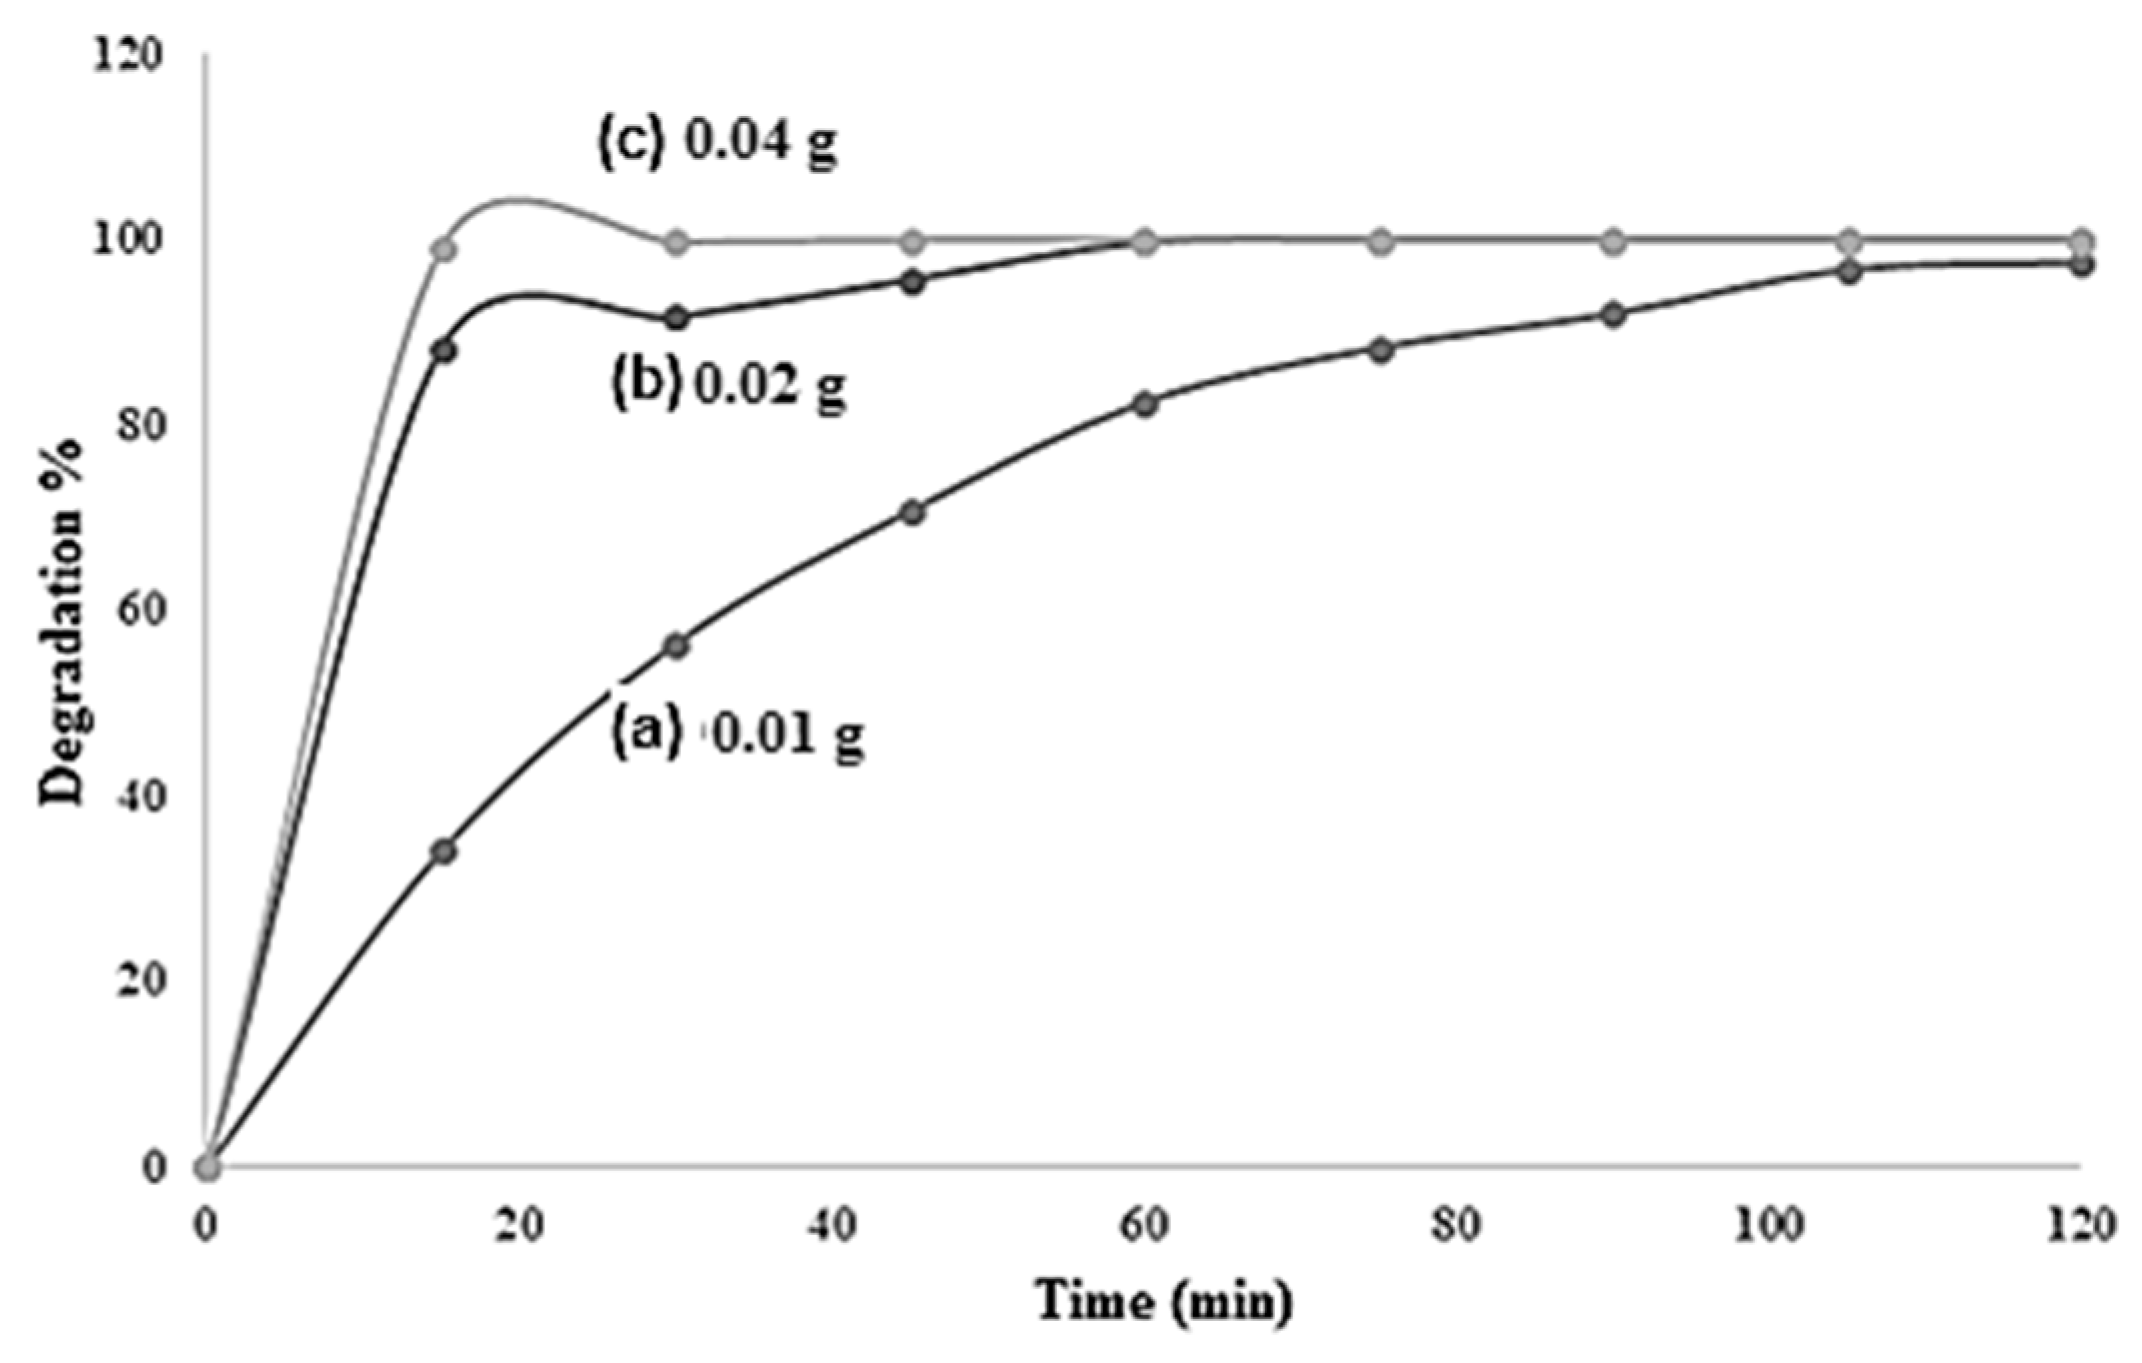
3.2.1. Effect of the Initial Concentration on M.O Degradation Efficiency

The influence of the initial concentration on the degradation percentage of M.O was assessed by changing its value from 2 mg/L to 10 mg/L, which encapsulates its permissible limit (5 mg/L) for municipal and industrial wastewaters, and the results are disclosed in Figure 7. The greatest removal was achieved at 2 mg/L. After 90 min of UV exposure, 10, 8, and 27% of M.O removals were achieved with concentrations of 10, 6, and 2 mg/L, respectively. These results suggested that M.O is a sensitive dye whose degradation should carefully be carried out [57,58]. Even though 2 mg/L appeared as the best concentration, in order to meet the sensitivity conditions for the future use of HPLC analysis, 4 mg/L was chosen as the working concentration of M.O and used for all photocatalysis experiments.
The bonding characteristics of functional groups in the composites were identified by FTIR, as shown in Figure 8. According to work done by Ng et al., it is not uncommon that graphene can be detrimental to the photocatalytic activities when the desired properties (e.g., localized high concentration of organic substances adjacent to TiO2) are not met [59]. From the spectra of AgFe-rGO (a), a band was seen from about 1800 cm−1– 900 cm−1, caused by the O-H bending and stretching, which also appeared in the spectrum (c) for AgFe-TiO2-rGO. These confirmed the origin of the band stems from rGO. Spectrum (a) contained a box inset encapsulating the band ranging from 850 cm−1–1260 cm−1, which corresponded to Spectrum (c), hence affirming the C-C bending and stretching corresponding to rGO. The band at 1624 cm−1 corresponded to the C-C bond of TiO2-rGO and TiO2-Fe, which agrees with the work done by Lu et al. (2017) [60]. The peaks at 2927, 1631, and 1383 cm−1 in Spectra (a), (b), and (c) confirmed the presence of silver in the nanocomposite [61].
However, in both Spectra (a) and (c), this band was sharper than that of Spectrum (b), and this was due to rGO enabling a stronger interaction between AgFe and TiO2 compared to AgFe-TiO2. For TiO2 (d), a broad band at 3360 cm−1 was indicative of the primary O-H stretching of the hydroxyl functional group. The band around 1630 cm−1 (H–O–H) was due to the incorporation of molecules-ligands into the coordination sphere of surface Ti-atoms, which led to the deformation of the surface TiO6 octahedrons [62]. These groups were the most basic and photoactive ones that accepted defects on the catalyst structure, which agreed with earlier work done by Zhang et al. (2002). A broad absorption band in the low-frequency region (500–800 cm−1) was associated with the Ti-O vibration mode from the structure of Ti–O–Ti bonds [63].

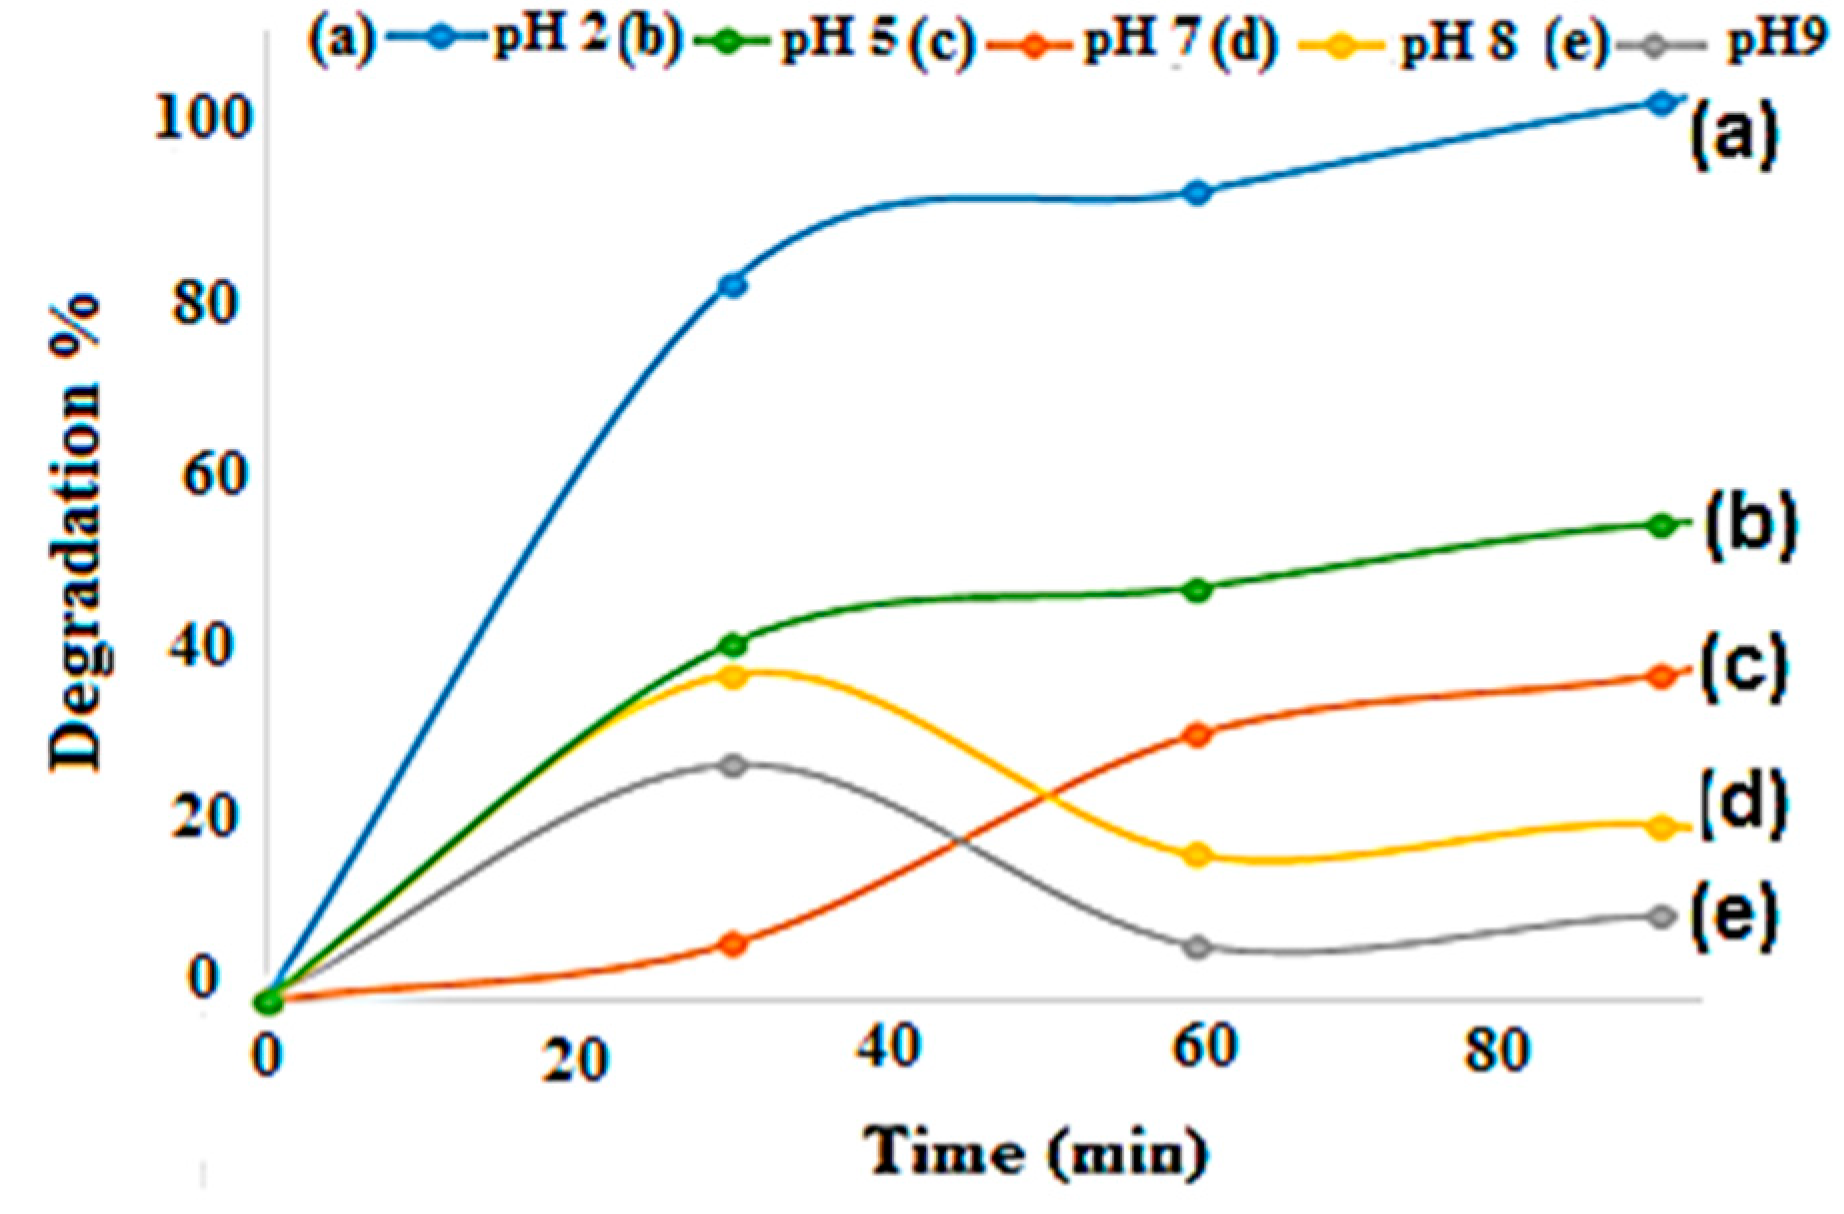
3.2.2. Effect of Solution pH on the Degradation Percentage of M.O

Solution pH is an important parameter for reactions taking place on the surface of a particulate, as is the case of TiO2 photocatalysis. Variations in pH can influence the adsorption of dye molecules on the TiO2 surfaces. Figure 9 presents the effect of solution pH on dye percentage removal at the indicated conditions. According to work done by Reza et al. (2017), the degradation percentage of the pollutant may increase with a decrease in solution pH [64]. The results in Figure 9 indicate that after 90 min of UV irradiation, the highest degradation percentage of methyl orange 98% was achieved at pH 2 followed by 50%, 35%, 20%, and 15% reached at pH 5, 7, 8, and 9, respectively. Due to excess anions in the solution, there will be repulsion of the dye by the negatively-charged surfaces of the adsorbents. Therefore, it is clear that the photocatalytic degradation rate of dye solution decreased with the increasing of the initial pH. These findings were in good agreement with work done by Sejie et al. (2016) and Niu (2013), who stated that the adsorption process was improved due to the stimulation of the adsorbent surface by the acid in solution at lower pH [65,66]. Concomitantly, in a similar study done by Milenova, K. et al. (2017), this behavior was stated to be influenced by the surface polarity, which contravenes the adsorption capacity [67]. A dye concentration of 4 mg/L and a solution pH of two were chosen as the optimum factors for the photochemical oxidation of M.O. These conditions were used to further assess the photocatalytic activity of TiO2 Degussa, TiO2 nanospheres, and TiO2 nanotube catalysts and their effect on the removal of M.O dye, respectively.

3.2.3. Photocatalytic Applications for the Degradation of Methyl Orange Dye

The influence of the initial pH of the solution and the surface area both had an influence on the photocatalysis kinetics; due to the amount of the dye adsorbed on TiO2. From the time-dependent (M.O) degradation percentage graph shown by Figure 10, the highest percentage of degradation of M.O was attained with TiO2 Degussa followed by TiO2 nanospheres and nanotubes, respectively. After 60 min of irradiation, 92.41%, 80.91%, and 21.19% degradations were reached with TiO2 Degussa, TiO2 nanospheres, and TiO2 nanotubes, respectively. The TiO2 Degussa nanomaterial prepared by a sol-gel method had a good crystalline phase and a small crystallite size, which were shown to promote thermal stability and photocatalytic activity. The impact of the amount of TiO2 Degussa on the degradation percentage of dye was also investigated at the applied conditions, and the results are exhibited in Figure 11. The outcomes indicated that dye removal percentage increased with the increase of the amount of catalyst. After 30 min of UV irradiation, total M.O degradation of 99.99% was achieved with 0.04 g TiO2 Degussa compared to 94% and 56% M.O removals reached with 0.02 and 0.01g of TiO2 Degussa, respectively, at the same experimental conditions. These results agreed with what was revealed by previous studies relating the effect of the surface functionalization and morphology of TiO2 on its photocatalytic activity [68,69,70,71]
Altogether, the results in Figure 11 show the pollutant concentration and pH; the catalyst dosage is also an important parameter, whose effect should be cautiously assessed during photocatalytic detoxification of water and wastewater pollutants.

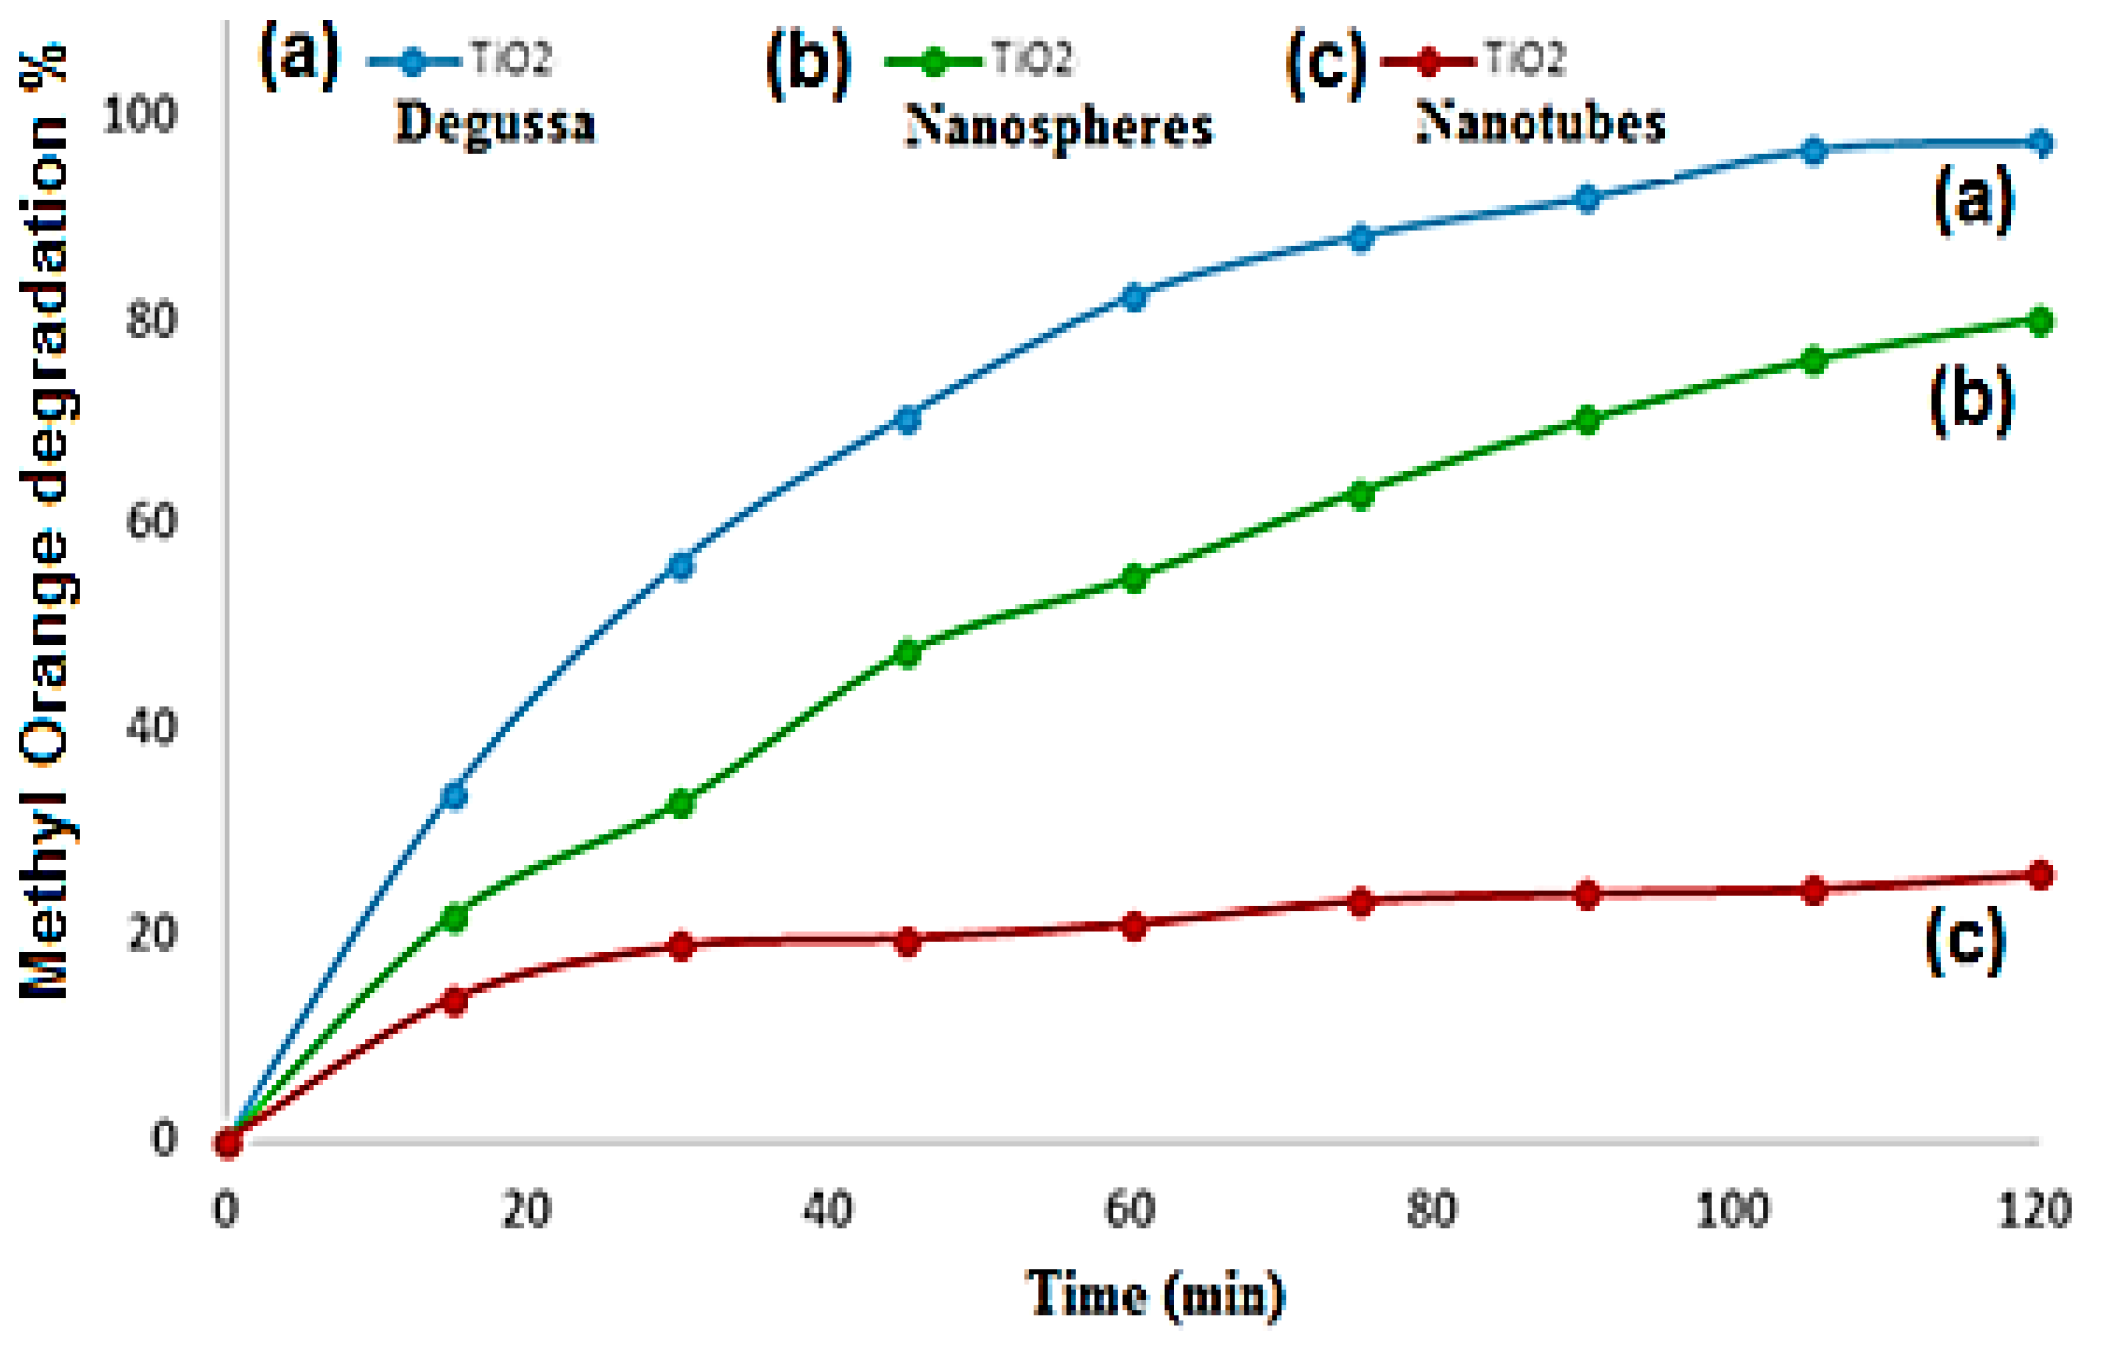
3.2.4. Degradation of M.O by TiO2 Combined with UV Light: Effect of TiO2 Morphology

An increase of the catalyst concentration resulted in an increase of the amount of dye adsorbed on the catalyst surface, affecting the catalytic activity of the photocatalyst. Figure 11 presents the effect of photocatalyst dosage on M.O percentage degradation in convenient conditions. Within 2 h of irradiation, the degradation percentage of M.O increased with an increase in the amount of TiO2 Degussa catalyst. That is, the highest M.O removal was achieved with 0.04 g TiO2 Degussa, and complete degradation was reached after 60 min with 0.2 and 0.04 g TiO2. For instance, after 30 min of experiment, 56.38%, 91.57%, and 99.67% M.O removals were achieved with 0.01 g, 0.02 g, and 0.04 g, respectively.

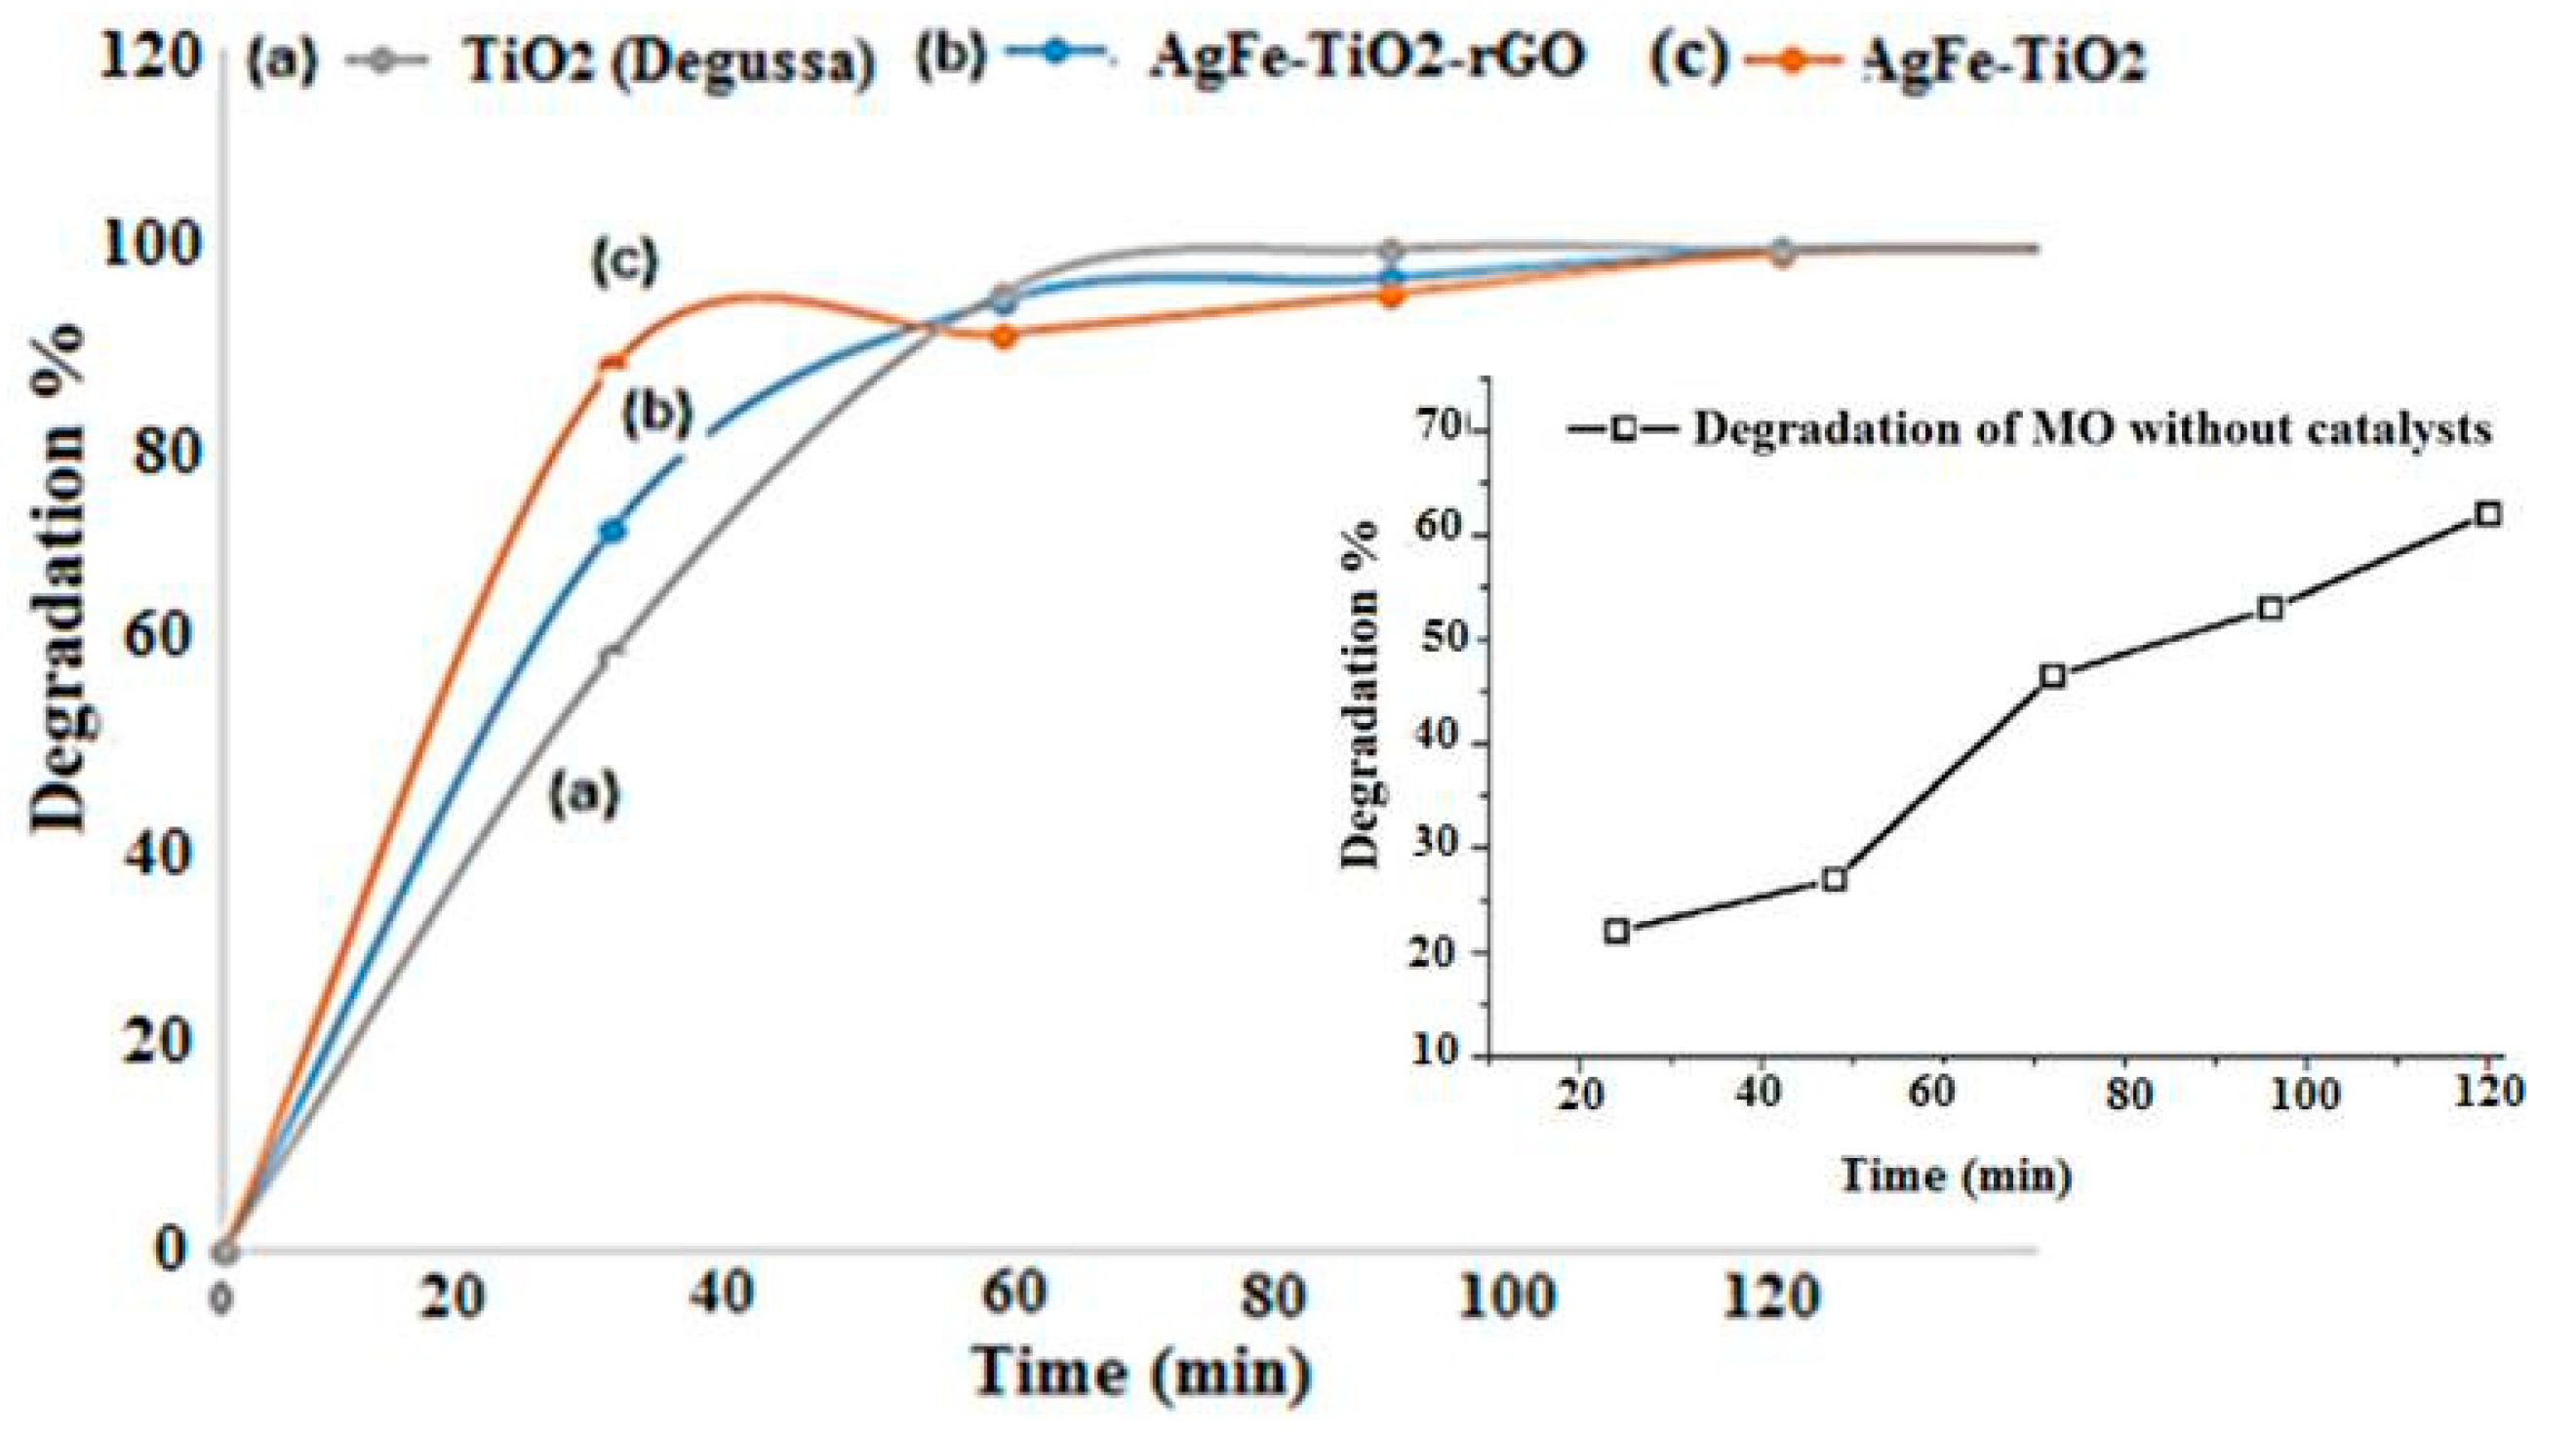
3.2.5. Photocatalytic Degradation of M.O by the Synthesized Catalysts

A strategy used to inhibit electron-hole pair recombination and previously reported by Mahmoodi, N.M. et al. was to add other electron acceptors to the reaction [72]. Since TiO2 is mostly activated under UV light, it has to be doped or modified to shift its working range in the visible light spectrum [73]. When present at a low concentration, the metal AgFe ions enhanced the dye degradation process. This could be attributed to a suitable trapping of electrons, thereby preventing the recombination of e and h+ pairs. The valence band photogenerated holes were free to react with OH. adsorbed onto the TiO2 to create hydroxyl radicals (OH.), and the conduction band electrons (at least a few of them) reacted with electron acceptors such as oxygen, creating oxygen radicals [74]. Therefore, according to the results shown in Figure 12, the degradation of M.O dye was greater in the presence of AgFe-TiO2 as compared to the other photocatalysts and the absence of any catalyst (inset). The results illustrated that within the first 30 min of UV irradiation, faster degradation of M.O was achieved with AgFe-TiO2 followed by AgFe-TiO2-rGO and TiO2 Degussa. The lower band gap of AgFe-TiO2 (2.5 eV) shown in Table 1 was expectedly due to the incorporation of AgFe into the TiO2 frame, which further reduced the electron-hole recombination process, which accelerated the accumulation of electrons in the conduction band (CB) and the proliferation of empty holes on the valence band (VB) [45]. In this regard, charge carriers (electrons and empty holes) possibly promoted the production of free radicals through oxidation (VB) and reduction (CB) processes, which validated the photocatalytic superiority of AgFe-TiO2 over AgFe-TiO2-rGO and TiO2 as disclosed in Figure 11. Concomitantly, the related pockets that were formed in the nanocomposite of AgFe-TiO2-rGO triggered encapsulation of M.O dye molecules instead of remediation [75]. This induced the analogous/misguided observation in the first 30 min. These findings were further corroborated by UV-Vis, and the calculated band gaps are shown in Table 1. The tabulated results revealed that remediation in UV or visible light was most satisfactory by the AgFe-TiO2 catalyst due to its narrow band gap, reduced electron recombination rate, and effective electron diffusion. These findings are in good agreement with an earlier study based on modified-TiO2 catalysts for complete remediation of methyl orange in water under visible light [76].

4. Conclusions

The presence of AgFe in TiO2 photocatalytic reactions was demonstrated to be beneficial in photocatalytic remediation processes. This was attributed to the improved charge transportation, as well as the pre-adsorption of organic substances adjacent to TiO2. The overall photocatalytic activities were strongly influenced by the chemical structures of the organic substances, and it was evident that graphene could be unfavorable to the photocatalytic activities when the desired properties (e.g., localized high concentration of organic substances adjacent to TiO2) are not met. The HRSEM established that AgFe-TiO2 had a more favorable morphology for photo activity compared to AgFe-TiO2-rGO, which allowed for increased adsorption ability, a reduced number of electron-hole re-combinations, and hence, enhanced photocatalytic activity. The corresponding diffusion coefficients for TiO2, AgFe-TiO2-rGO, and AgFe-TiO2 were 1.07 × 10⁻⁷ cm2 s−1, 2.44 × 10⁻⁵ cm2 s−1, and 3.39 × 10⁻⁵ cm2 s−1, respectively. The AgFe-TiO2 catalyst, therefore, ensured the adequate detachment of the photo generated carriers, which had excellent charge-transfer ability and in turn performed the best in remediation of the methyl orange dye.

Author Contributions

Formal analysis, D.S.; funding acquisition, N.R.; methodology, E.S.M.M.; writing, original draft, N.R.; writing, review and editing, E.S.M.M.

Funding

This research was funded by Center for Afroamerican and African Studies, UM, grant number BGB0326023327 Stem-Africa Seed Grant.

Acknowledgments

The authors thank the South African National Research Foundation (NRF) for the financial support to achieve the completion of this project.

Conflicts of Interest

The authors declare that there is no conflict of interest in the publication of this manuscript.

References

  1. Von Bormann, T.; Gulati, M. The Food Energy Water Nexus; WWF-SA: Newlands, South Africa, 2014. [Google Scholar]
  2. Ahed, Z.; Zu’bi, A.; Helal, M.H.S.; Park, D.; Campet, G.; Hikmat, S.H. Optimizing photo-mineralization of aqueous methyl orange by nano-ZnO catalyst under simulated natural conditions. J. Environ. Health Sci. Eng. 2015, 13, 46. [Google Scholar]
  3. Maynard, C. Riegel’s Handbook of Industrial Chemistry; Kent, J.A., Ed.; Springer: Berlin/Heidelberg, Germany, 1983. [Google Scholar]
  4. Methyl Orange, Material Safety Data Sheet, Statement of Hazardous Nature; sc-206030; Sigma-Aldrich: Saint Louis, MO, USA, 2011.
  5. Puvaneswari, N.; Muthukrishnan, J.; Gunasekaran, P. Toxicity assessment and microbial degradation of azo dyes. Indian J. Exp. Biol. 2006, 44, 618–626. [Google Scholar] [PubMed]
  6. Shih, Y.H.; Tso, C.P.; Tung, L.Y. Rapid degradation of methyl orange with nanoscale zerovalent iron particles. Nanotechnology 2010, 7, 16–17. [Google Scholar]
  7. Eljiedi, A.; Azlan, K. Removal of methyl orange and methylene blue dyes from aqueous solution using lala clam (Orbicularia orbiculata) shell. Aip Conf. Proc. 2017, 1, 1847. [Google Scholar]
  8. Tang, C.W. Study of photocatalytic degradation of Methyl Orange on different morphologies of ZnO catalysts. Mod. Res. Catal. 2013, 2, 19–24. [Google Scholar] [CrossRef]
  9. Dina, A.; Scholz, Y.M. Treatment of synthetic textile wastewater containing dye mixtures with microcosms. Env. Sci. Poll. Res. Int. 2018, 25, 1980–1997. [Google Scholar]
  10. Asgher, M.; Kausar, S.; Bhatti, H.N.; Shah, S.A.H.; Ali, M. Optimization of medium for decolorization of solar golden yellow R direct textile dye by Schizophyllum commune IBL-06. Int. Biodeterior. Biodegrad. 2008, 61, 189–193. [Google Scholar] [CrossRef]
  11. Borchert, M.; Judy, A.L. Decolorization of reactive dyes by the white rot fungus Trametesversicolor in sequencing batch reactors. Biotechnol. Bioeng. 2001, 75, 313–321. [Google Scholar] [CrossRef] [PubMed]
  12. Tahir, S.; Rauf, N. Removal of a cationic dye from aqueous solutions by adsorption onto be ntonite clay. Chemosphere 2006, 63, 1842–1848. [Google Scholar] [CrossRef] [PubMed]
  13. Camarero, S.; Ibarra, D.; Martinez, M.J.; Martinez, A.T. Lignin derived-compounds as efficient laccase mediators for decolorization of different types of recalcitrant dyes. Appl. Environ. Microbiol. 2005, 71, 1775–1784. [Google Scholar] [CrossRef] [PubMed]
  14. Wang, J.; Xu, L. Advanced Oxidation Processes for Wastewater Treatment: Formation of Hydroxyl Radical and Application. Crit. Rev.Env. Sci.Tech. 2012, 42, 251–325. [Google Scholar] [CrossRef]
  15. Awuah, E.; Nyarko, K.B.; Owusu, P.A.; Osei-Bonsu, K. Small town water quality. Desalination 2009, 248, 453–459. [Google Scholar] [CrossRef]
  16. Chong, M.N.; Jin, B.; Chow, C.W.; Saint, C. Recent developments in photocatalytic water treatment technology: A review. Water Res. 2010, 44, 2997–3027. [Google Scholar] [CrossRef] [PubMed]
  17. Gaya, U.I.; Abdullah, A.H. Heterogeneous Photocatalytic Degradation of Organic Contaminants over Titanium Dioxide: A Review of Fundamentals, Progress and Problems. J. Photochem. Photobiol. A Chem. 2008, 9, 1–12. [Google Scholar] [CrossRef]
  18. Zhu, K.; Neale, N.R.; Miedaner, A.; Frank, A. Enhanced Charge-Collection Efficiencies and Light Scattering in Dye-Sensitized Solar Cells Using Oriented TiO2 Nanotubes Arrays. J. Nano Lett. 2007, 7, 69–74. [Google Scholar] [CrossRef]
  19. Beranek, R.; Tsuchiya, H.; Sugishima, T.; Macak, J.M.; Taveira, L.; Fujimoto, S.; Kisch, H.; Schmuki, P. Enhancement and limits of the photoelectrochemical response from anodic TiO2 nanotubes. Appl. Phys. Lett. 2005, 87, 243114. [Google Scholar] [CrossRef]
  20. Roy, P.; Berger, S.; Schmuki, P. TiO2 nanotubes: Synthesis and applications. Angew. Chem. Int. 2011, 50, 2904–2939. [Google Scholar] [CrossRef]
  21. Lazar, M.A.; Varghese, S.; Nair, S.S. Photocatalytic Water Treatment by Titanium Dioxide: Recent Updates. Catalysts 2004, 2, 572–601. [Google Scholar] [CrossRef]
  22. Takeuchi, M.; Yamashita, H.; Matsuoka, M.; Anpo, M.; Hirao, T.; Itoh, N.; Iwamoto, N. Photocatalytic decomposition of NO under visible light irradiation on the Cr-ion-implanted TiO2 thin film photocatalyst. Catal. Lett. 2000, 67, 135–137. [Google Scholar] [CrossRef]
  23. Linsebigler, A.L.; Lu, G.; Yates, J.T., Jr. Photocatalysis on TiO2 Surfaces: Principles, Mechanisms, and Selected Results. Chem. Rev. 1995, 95, 735–758. [Google Scholar] [CrossRef]
  24. Pável, C.; Hernández, D.C.; Saúl, R.M.; Facundo, R. An Easy and Efficient Method to Functionalize Titanium Dioxide Nanoparticles with Maleic Anhydride. Soft Nanosci. Letters. 2014, 4, 53–62. [Google Scholar] [Green Version]
  25. Li, W.; Shah, S.I.; Huang, C.P.; Jung, O.; Ni, C. Metallorganic chemical vapor deposition and characterization of TiO2 nanoparticles. Mater. Sci. Eng. B 2002, 96, 247–253. [Google Scholar] [CrossRef]
  26. Fernndez-Garca, M.; Martnez-Arias, A.; Hanson, J.C.; Rodriguez, J.A. Nanostructured oxides in chemistry: Characterization and properties. Chem. Rev. 2014, 104, 4063–4104. [Google Scholar] [CrossRef] [PubMed]
  27. Ai, B.; Duan, X.; Sun, H.; Qiu, X.; Wang, S. Metal-free graphene-carbon nitride hybrids for photodegradation of organic pollutants in water. Catal. Today 2015, 258, 668–675. [Google Scholar] [CrossRef] [Green Version]
  28. Liu, J.; Huang, J.H.; Zhou, H.; Antonietti, M. Uniform graphitic carbon nitride nanorod for efficient photocatalytic hydrogen evolution and sustained photoenzymatic catalysis. ACS Appl. Mater. Interfaces 2014, 6, 8434–8440. [Google Scholar]
  29. Hui, L.T.; Frans, D.; Mandalena, H.; Roong, J.W.; Rose, A.; Hau, Y.N.G. Reduced graphene oxide is not a universal promoter for photocatalytic activities of TiO2. J. Mater. 2017, 3, 51–57. [Google Scholar]
  30. Wang, X.; Maeda, K.; Chen, X.; Takanabe, K.; Domen, K.; Hou, Y.; Fu, X.; Antonietti, M. Polymer Semiconductors for Artificial Photosynthesis: Hydrogen Evolution by Mesoporous Graphitic Carbon Nitride with Visible Light. J. Am. Chem. Soc. 2009, 131, 1680–1681. [Google Scholar] [CrossRef] [PubMed]
  31. Yan, H.; Yang, H. TiO2–g-C3N4 composite materials for photocatalytic H2 evolution under visible light irradiation. J. Alloy. Compd. 2011, 509, L26–L29. [Google Scholar] [CrossRef]
  32. Priti, M.; Sulagna, P.; Kulamani, P. An overview of recent progress on noble metal modified magnetic Fe3O4 for photocatalytic pollutant degradation and H2 evolution. Catal. Sci. Technol. 2019, 9, 916–941. [Google Scholar]
  33. Zheng, Z.K.; Huang, B.B.; Qin, X.Y.; Zhang, X.Y.; Dai, Y.; Whangbo, M.H. Facile in situ synthesis of visible-light plasmonic photocatalysts M@TiO2 (M = Au, Pt, Ag) and evaluation of their photocatalytic oxidation of benzene to phenol. J. Mater. Chem. 2011, 21, 9079–9087. [Google Scholar] [CrossRef]
  34. Liang, W.J.; Li, J.; Jin, Y.Q. Photo-catalytic degradation of gaseous formaldehyde by TiO2/UV, Ag/TiO2/UV and Ce/TiO2/UV. Build. Environ. 2012, 51, 345–350. [Google Scholar] [CrossRef]
  35. Sondra, A.; Cristian, P.; Ludovic, L. New one-pot synthesis of Au and Ag nanoparticles using green rust reactive particle as a micro-reactor. Nanoscale Res. Lett. 2013, 8, 95. [Google Scholar]
  36. Yanfeng, C.; Weixin, H.; Donglin, H.; Yue, H. Construction of Heterostructured g-C3N4/Ag/TiO2 Microspheres with Enhanced Photocatalysis Performance under Visible-Light Irradiation. Acs Appl. Mater. Interface 2014, 6, 14405–14414. [Google Scholar]
  37. Lai, Y.K.; Zhuang, H.F.; Xie, K.P.; Gong, D.G.; Tang, Y.X.; Sun, C.J.; Chen, Z. Fabrication of uniform Ag/TiO2 nanotube array structures with enhanced photoelectron-chemical performance. New J. Chem. 2010, 34, 1335–1340. [Google Scholar] [CrossRef]
  38. Zhu, J.; Zheng, W.; He, B.; Zhang, J.; Anpo, M. Characterization of Fe–TiO2 photocatalysts synthesized by hydrothermal method and their photocatalytic reactivity for photodegradation of XRG dye diluted in water. J. Hazard. Mater. 2004, 216, 35–43. [Google Scholar] [CrossRef]
  39. Zhou, M.; Yu, J.; Cheng, B. Effects of Fe-doping on the photocatalytic activity of mesoporous TiO2 powders prepared by an ultrasonic method. J. Hazard. Mater. 2006, 137, 1838–1847. [Google Scholar] [CrossRef] [PubMed]
  40. Mishra, T.; Mahato, M.; Noor Aman, J.; Patel, N.; Sahu, R.K. A mesoporous WN co-doped titania nanomaterial with enhanced photocatalytic aqueous nitrate removal activity under visible light. Catal. Sci. Technol. 2011, 1, 609–615. [Google Scholar] [CrossRef]
  41. Markowska-Szczupak, A.; Ulfig, K.; Morawski, A.W. The Application of Titanium Dioxide for Deactivation of Bioparticulates: An Overview. Catal. Today 2011, 169, 249–257. [Google Scholar] [CrossRef]
  42. Serpone, N. Is the band gap of pristine TiO(2) narrowed by anion- and cation-doping of titanium dioxide in second-generation photocatalysts? J. Phys. Chem. B 2006, 110, 24287–24293. [Google Scholar] [CrossRef]
  43. Sachs, M.; Pastor, E.; Kafizas, A.; Durrant, J.R. Evaluation of Surface State Mediated Charge Recombination in Anatase and Rutile TiO2. J. Phys. Chem. Lett. 2016, 7, 3742–3746. [Google Scholar] [CrossRef]
  44. Schwarz, A.; James, A.; Cristian, I.C.; Karol, P. Dekker Encyclopedia of Nanoscience and Nanotechnology; CRC Press: Boca Raton, FL, USA, 2004; Volume 4. [Google Scholar]
  45. Zhu, J.; Zhang, J.; Chen, F.; Iino, K.; Anpo, M. High activity TiO2 Photocatalysts Prepared by a Modified Sol–gel Method: Characterization and their Photocatalytic Activity for the Degradation of XRG and X-GL. Top. Catal. 2005, 35, 261–268. [Google Scholar] [CrossRef]
  46. Kim, K.H.; Ihm, S.K. Heterogeneous catalytic wet air oxidation of refractory organic pollutants in industrial wastewaters: A review. J. Haz. Mat. 2011, 186, 16–34. [Google Scholar] [CrossRef]
  47. Blair, V.L.; Nichols, E.; Liu, J.J.; Misture, S.T. Surface modification of nanosheet oxide photocatalysts. Appl. Surf. Sci. 2013, 268, 410–415. [Google Scholar] [CrossRef]
  48. Chen, Z.Y.; Liang, D.; Ma, G.; Frankel, G.S.; Allen, H.C.; Kelly, R.G. Influence of UV irradiation and ozone on atmospheric corrosion of bare silver. Corros. Eng. Sci. Technol. 2010, 45, 169. [Google Scholar] [CrossRef]
  49. Yadav, P.; Pandey, K.; Bhatt, P.; Tripathi, B.; Kumar, M. Probing the electrochemical properties of TiO2/graphene composite by cyclic voltammetry and impedance spectroscopy. Mater. Sci. Eng. B 2016, 206, 22–29. [Google Scholar] [CrossRef]
  50. Bard, A.J.; Faulkner, L.R. Electrochemical Methods; Wiley-Interscience: New York, NY, USA, 1980. [Google Scholar]
  51. Malik, R.; Burch, D.; Bazant, M.; Ceder, G. Particle Size Dependence of the Ionic Diffusivity. Nano Lett. 2010, 10, 4123–4127. [Google Scholar] [CrossRef] [PubMed]
  52. Wang, Y.; Shi, R.; Lin, J.; Zhu, Y. Significant photocatalytic enhancement in methylene blue degradation of TiO2 photocatalysts via graphene-like carbon in situ hybridization. Appl. Catal B Environ. 2010, 100, 179–183. [Google Scholar] [CrossRef]
  53. Nguyen-Phan, T.D.; Pham, V.H.; Shin, E.W.; Pham, H.D.; Kim, S.; Chung, J.S.; Kim, E.J.; Hur, S.H. The role of graphene oxide content on the adsorption-enhanced photocatalysis of titanium dioxide/graphene oxide composites. Chem. Eng. J. 2011, 170, 226–232. [Google Scholar] [CrossRef]
  54. Banerjee, A.N. The design, fabrication, and photocatalytic utility of nanostructured semiconductors: Focus on TiO2-based nanostructures. Nanotechnol. Sci. Appl. 2011, 4, 35–65. [Google Scholar] [CrossRef]
  55. Todorova, N.; Vaimakis, T.; Petrakis, D.; Hishita, S.; Boukos, N.; Giannakopoulou, T.; Giannouri, M.; Antiohos, S.; Papageorgiou, D.; Chaniotakis, E.; et al. N and N, S-doped TiO2 photocatalysts and their activity in NOx oxidation. Catal. Today 2013, 209, 41. [Google Scholar] [CrossRef]
  56. Bessegato, G.G.; Cardoso, J.C.; Zanoni, M.V.B. Enhanced photoelectrocatalytic degradation of an acid dye with boron-doped TiO2 nanotube anodes. Catal. Today 2015, 240, 100. [Google Scholar] [CrossRef]
  57. Cavalcante, R.P.; Dantas, R.F.; Bayarri, B.; Gonzalez, O.; Gimenez, J.; Esplugas, S.; Machulek, A. Synthesis and characterization of B-doped TiO2 and their performance for the degradation of metoprolol. Catal. Today 2015, 252, 27–34. [Google Scholar] [CrossRef]
  58. Ranjit, K.; Viswanathan, B. Synthesis, characterization and photocatalytic properties of iron-doped TiO2 catalysts. J. Photochem. Photobiol. A Chem. 1997, 108, 79–84. [Google Scholar] [CrossRef]
  59. Ng, Y.H.; Iwase, A.; Bell, N.J.; Kudo, A.; Amal, R. Semiconductor/reduced graphene oxide nanocomposites derived from photocatalytic reactions. Catal. Today 2011, 164, 353–357. [Google Scholar] [CrossRef]
  60. Lu, L.; Wang, H.; Wenbin, J.; Mkaouar, A.R.; Pei, X. Comparison study on photocatalytic oxidation of pharmaceuticals by TiO2-Fe and TiO2-reduced graphene oxide nanocomposites immobilized on optical fibers. J. Haz. Mat. 2017, 333, 162–168. [Google Scholar]
  61. Devaraj, P.; Kumari, P.; Aarti, C.; Renganathan, A. Synthesis and Characterization of Silver Nanoparticles Using Cannonball Leaves and Their Cytotoxic Activity against MCF-7 Cell Line. J. Nanotech. 2013, 2013, 5. [Google Scholar]
  62. Bezrodnaa, T.; Puchkovskaa, G.; Shymanovskaa, V.; Baranb, J.; Ratajczakb, H. IR-analysis of H-bonded H2O on the pure TiO2 surface. J. Mol. Struct. 2004, 700, 175–181. [Google Scholar] [CrossRef]
  63. José, O.; Carlos, M.N.R.; Carlos, H.F.; de Renê, S.C.; da Pablo, S.A. Rocha. Synthesis, Characterization and Enhanced Photocatalytic Activity of Iron Oxide/Carbon Nanotube/Ag-doped TiO2 Nanocomposites. J. Braz. Chem. Soc. 2017, 28, 1678–4790. [Google Scholar]
  64. Reza, K.; Kurny, A.; Gulshan, F. Parameters affecting the photocatalytic degradation of dyes using TiO2: A review. Appl. Water Sci. 2017, 7, 1569–1578. [Google Scholar] [CrossRef]
  65. Sejie, F.P.; Nadiye-Tabbiruka, M.S. Removal of Methyl Orange (MO) from Water by adsorption onto Modified Local Clay (Kaolinite). Phys. Chem. 2016, 6, 39–48. [Google Scholar]
  66. Niu, P. Photocatalytic Degradation of Methyl Orange in Aqueous TiO2 Suspensions. Asian J. Chem. 2013, 25, 1103–1106. [Google Scholar] [CrossRef]
  67. Milenova, K.; Zaharieva, K.; Stambolova, I.; Blaskov, V.; Eliyas, A.; Dimitrov, L. Photocatalytic performance of tio2, ceo2, zno and tio2-ceo2-zno in the course of methyl orange dye degradation. J. Chem. Tech. Met. 2017, 52, 13–19. [Google Scholar]
  68. Baeissa, E.S. Environmental remediation of aqueous methyl orange dye solution via photocatalytic oxidation using AgeGdFeO3 nanoparticles. J. Alloys Com. 2016, 678, 267–272. [Google Scholar] [CrossRef]
  69. Wang, Y.; Cheng, H.; Hao, Y.; Ma, J.; Li, W.; Cai, S. Photoelectrochemical properties of metal-ion-doped TiO2 nanocrystalline electrodes. Thin Solid Film. 1999, 349, 120–125. [Google Scholar] [CrossRef]
  70. Archana, P.S.; Jose, R.; Vijila, C.; Ramakrishna, S. Improved Electron Diffusion Coefficient in Electrospun TiO2 Nanowires. J. Phys. Chem. C 2009, 113, 21538–21542. [Google Scholar] [CrossRef]
  71. Zhou, X.T.; Ji, H.B.; Huang, X.J. Photocatalytic Degradation of Methyl Orange over Metalloporphyrins Supported on TiO2 Degussa P25. Molecules 2012, 17, 1149–1158. [Google Scholar] [CrossRef] [PubMed]
  72. Mahmoodi, N.M.; Arami, M.; Limaee, N.Y.; Gharanjig, K.; Ardejani, F.D. Decolorization and mineralization of textile dyes at solution bulk by heterogeneous nanophotocatalysis using immobilized nanoparticles of titanium dioxide. Colloids Surf. A 2006, 290, 125–131. [Google Scholar] [CrossRef]
  73. Banerjee, S.; Pillai, S.C.; Falaras, P.; O’Shea, K.E.; Byrne, J.A.; Dionysiou, D.D. New insights into the mechanism of visible light photocatalysis. J. Phys. Chem. Lett. 2014, 5, 2543–2554. [Google Scholar] [CrossRef] [PubMed]
  74. Prado, A.G.S.; Bolzon, L.B.; Pedroso, C.P.; Moura, A.O.; Costa, L.L. Nb2O5 as efficient and recyclable photocatalyst for indigo carmine degradation. Appl. Catal. A 2008, 82, 219–224. [Google Scholar] [CrossRef]
  75. Aleksandrzak, M.; Adamski, P.; Kukulka, W.; Zielinska, B.; Mijowska, E. Effect of graphene thickness on photocatalytic activity of TiO2-graphene nanocomposites. Appl. Surf. Sci. 2015, 331, 193–199. [Google Scholar] [CrossRef]
  76. Albiter, E.; Valenzuela, M.A.; Alfaro, S.; Valverde-Aguilar, G.; Martınez-Pallares, F.M. Photocatalytic deposition of Ag nanoparticles on TiO2: Metal precursor effect on the structural and photoactivity properties. J. Saudi. Chem. Soc. 2015, 19, 563–573. [Google Scholar] [CrossRef]
Figure 1. Photocatalytic experimental setup. Solution volume = 500 mL, and irradiation time = 120 min. Mega-Ray 160-W/240-V MR160 SPL11/14, UV lamp.
Environments 06 00106 g001
Figure 2. SEM Image of (a) TiO2 Degussa, (b) TiO2 nanotubes, and (c) TiO2 nanospheres at Magnification of 50.00 kX. and electron high tension (EHT) of 5.00 kV.
Environments 06 00106 g002
Figure 3. SEM images of unmodified TiO2 Degussa (a), AgFe-TiO2 (b), and rGO-AgFe-TiO2 (c) nanocomposites at a magnification of 20.00 K X.
Environments 06 00106 g003
Figure 4. CV graph of TiO2 Degussa (a), 100 mg of AgFe-rGO (b), 100 mg of AgFe- TiO2 (c), and 100 mg of AgFe-TiO2-rGO (d) with the insert in 5 M LiOH electrolyte at scan rates from 10–100 mV/s in 5 M LiOH electrolyte on glassy carbon electrode (GCE).
Environments 06 00106 g004
Figure 5. UV-Vis spectra for (a) Fe nanoparticles, (b) AgFe nanoalloy, and (c) TiO2 Degussa.
Environments 06 00106 g005
Figure 6. X-ray diffraction (XRD) patterns of (a) AgFe-TiO2, (b) AgFe-rGO, (c) AgFe-TiO2-rGO, and (d) TiO2 nanocomposites.
Environments 06 00106 g006
Figure 7. Effect of initial concentration on M.O degradation percentage. Varied parameters: dye concentration of 2, 6, and 10 mg/L, solution volume 500 mL, irradiation time 120 min.
Environments 06 00106 g007
Figure 8. FT-IR spectra for nanocomposites (a) AgFe-rGO, (b) AgFe-TiO2, (c) AgFe-TiO2-rGO, and (d) TiO2.
Environments 06 00106 g008
Figure 9. Effect of solution pH on orange II degradation percentage. Varied parameters: solution pH 2, 5, and 9. Fixed parameters: dye concentration 4 mg/L, solution volume 500 mL, and irradiation time 120 min.
Environments 06 00106 g009
Figure 10. Photocatalytic activity of TiO2 Degussa, TiO2 nanospheres, and TiO2 nanotubes on methyl orange degradation % at: pH 2, concentration 4 mg/L, amount of catalyst 0.01 g, and irradiation time 2 h.
Environments 06 00106 g010
Figure 11. Effect of TiO2 (Degussa) dosage on removal percentage of methyl orange (M.O) dye. Varied parameters: amount of TiO2 Degussa 0.01 g, 0.02 g, and 0.04 g.
Environments 06 00106 g011
Figure 12. Photocatalytic activity of various catalysts including TiO2 Degussa, AgFe-TiO2-rGO, and AgFe-TiO2 on the degradation percentage of M.O (inset: MO degradation in the absence of catalyst).
Environments 06 00106 g012
Table 1. Comparison of the three catalysts’ remediation potential in accordance with their band gap in the following conditions: solution pH 2, concentration 4 mg/L.
CatalystEstimated ΔEpD (cm2 s−1) × 10−5Band Gap
TiO20.25 V1.07 × 10−7 cm2 s−13.07 eV
AgFe-TiO2-rGO0.268 V2.44 × 10−5 cm2 s−13.02 eV
AgFe-TiO21.06 V3.39 × 10−5 cm2 s−12.5 eV

