Article

Nitrogen Mineralization in a Sandy Soil Amended with Treated Low-Phosphorus Broiler Litter

U. S. Department of Agriculture-Agricultural Research Service, Coastal Plains Soil, Water and Plant Research Center, 2611 W. Lucas St., Florence, SC 20501, USA
*
Author to whom correspondence should be addressed.
Environments 2019, 6(8), 96; https://doi.org/10.3390/environments6080096
Submission received: 15 July 2019 / Revised: 9 August 2019 / Accepted: 11 August 2019 / Published: 14 August 2019

Abstract

:
Low-phosphorus (P) litter, a manure treatment byproduct, can be used as an organic soil amendment and nitrogen (N) source but its effect on N mineralization is unknown. A laboratory incubation study was conducted to compare the effect of adding untreated (fine or pelletized) broiler litter (FUL or PUL) versus extracted, low-P treated (fine or pelletized) broiler litter (FLP or PLP) on N dynamics in a sandy soil. All four litter materials were surface applied at 157 kg N ha−1. The soil accumulation of ammonium (NH4+) and nitrate (NO3) were used to estimate available mineralized N. The evolution of carbon dioxide (CO2), ammonia (NH3), and nitrous oxide (N2O) was used to evaluate gaseous losses during soil incubation. Untreated litter materials provided high levels of mineralized N, 71% of the total N applied for FUL and 64% for PUL, while NH3 losses were 24% to 35% and N2O losses were 3.3% to 7.4% of the total applied N, respectively. Soil application of low-P treated litter provided lower levels of mineralized N, 42% for FLP and 29% for PLP of the total applied N with NH3 losses of 5.7% for FLP for and 4.1% for PLP, and very low N2O losses (0.5%). Differences in mineralized N between untreated and treated broiler litter materials were attributed to contrasting C:N ratios and acidity of the low-P litter byproducts. Soil application of treated low-P litter appears as an option for slow mineral N release and abatement of NH3 and N2O soil losses.

1. Introduction

Most of the spent broiler litter is applied to soils as a source of plant nutrients for crop and forage production [1,2]. However, recurrent land application of broiler litter in regions with a high concentration of poultry farms is a major environmental concern because of nutrient buildup in soils to elevated levels. After soil application, a significant fraction of the organic N in broiler litter mineralizes into NH4+ and NO3. Both inorganic N forms become available for plant use during the growing season but can be lost via leaching or surface runoff contaminating water resources [3]. In addition, a significant portion of surplus N from broiler litter is lost into the atmosphere through emissions of NH3 and N2O [4,5]. These environmental risks are leading to the development of technologies to manage nutrient-rich broiler litter that allow the recycling of nutrients as organic soil amendments or plant fertilizer materials.
Several management programs and technologies have been developed to solve the problem of surplus N and P from spent broiler litter including: (1) Transfer of broiler litter to nutrient-deficient agricultural lands as compost [6], as fine particles [7] or in pelletized form [8]; (2) improved manure application methods, such as subsurface soil placement of broiler litter, to prevent ammonia emissions or nutrient runoff [9,10]; (3) energy generation by thermal conversion such as incineration [11] or biological anaerobic digestion [12]; and (4) acidification with addition of chemicals to retain N in the broiler litter [13,14]. As an alternative, the U.S. Department of Agriculture developed a patented process, called “Quick Wash” (QW), to manage the surplus of N and P prior to soil application of broiler litter or animal manure [15]. The process uses a novel combination of acid, base, and organic polyelectrolyte to selectively extract a significant percentage of P from broiler litter while leaving most of the N in the organic, washed litter material. The QW approach has three distinctive advantages over other technologies or nutrient management strategies: (1) Compared with broiler litter transfer programs, there is no need to transport large volumes of broiler litter since only about 15% of its initial volume is shipped off the farm as a concentrated P product [16]; (2) compared to thermal conversion or the anaerobic digestion processes, the organic C and N in the treated low-P litter is conserved for soil health benefits; (3) compared to acidification processes such as alum addition, the treated low-P broiler litter can be safely land applied on a N basis because its N:P ratio is better balanced to match specific nutrient needs of crops.
Several studies have shown that the addition of broiler litter to soils can increase CO2, NH3, and N2O gas emissions [17,18,19]. Broiler litter adds organic N along with organic C, stimulating mineralization of organic N and C with production of NH4+ and NO3 through microbial ammonification and nitrification, and N2O through denitrification [20]. Therefore, slowing down nitrification and avoiding high NH4+ concentrations in the soil are important measures to lower N gaseous losses per unit of N input [5]. The objectives of the present study were to: (1) Compare if applications of low-P broiler litter treated with the QW process (hereafter called treated low-P litter) versus untreated broiler litter to a sandy soil would result in lower NH3 and N2O emissions; and (2) evaluate soil mineralization of low-P litter sources. To meet these objectives, we performed a laboratory soil incubation study in which both sources of N were surface applied to soil in un-pelletized and pelletized forms. The study included the determination of cumulative CO2, NH3, and N2O emissions along with the soil concentrations of NH4+ and NO3 during the course of a laboratory incubation to evaluate the N mineralization of each N source. The study used a characteristic sandy soil common to areas with intense broiler production within the eastern Coastal Plains region, USA.

2. Materials and Methods

2.1. Soil Collection

Soil samples were collected from the topsoil (Ap horizon) of a Norfolk loamy sand (Fine-loamy kaolinitic thermic Typic Kandiudults) at the USDA-ARS Coastal Plains Soil, Water, and Plant Research Center in Florence, SC, USA. The area of the field used for the soil collection in this study was under conservation tillage with paratill subsoiling. To evaluate the distribution of nutrients and pH of the topsoil, composite soil samples were taken at 7.5 and 15.0 cm depth for routine soil testing according to Bauer et al. [21]. Thereafter, soil cores were collected from the topsoil using a soil core sampler (AMS, Inc., American Falls, ID, USA) equipped with a replaceable acrylic plastic cylindrical sleeve (5-cm diameter × 15-cm long).

2.2. Sources of Broiler Litter

The study included a total of four poultry litter materials (two untreated and two treated using the QW process): Fine-particle untreated litter (FUL); pelletized untreated litter (PUL); fine-particle low-P treated litter (FLP); and pelletized low-P treated litter (PLP). The PUL material was prepared by pelleting the FUL. The FUL material was collected from a farm with six 25,000-bird broiler houses in Lee Co., SC, USA. The broiler litter used for P extraction using the QW process was also collected from the same farm in a separate sampling campaign. Details about the collection and processing of broiler litter samples before and after QW treatment are further described by Szogi et al. [16]. Briefly, the QW process consists of three consecutive steps: (1) Wet P extraction; (2) P recovery; and (3) P recovery enhancement. The FLP is the solid product from Step 1 of the QW process in which P bound to poultry litter solids was extracted in solution using citric acid with a target pH of 4.5 at ambient temperature and pressure. The FLP solids were subsequently separated from the acid extract, dewatered, and air dried. Both PUL and PLP materials were obtained by pelleting FUL or FLP using a PP200 pellet mill equipped with a 6-mm die and roller set (Pellet Pros Inc., Davenport, Iowa, USA).

2.3. Incubations

Two separate but simultaneous laboratory incubation experiments were performed using two sets of 15 soil cores for each experiment. Each set of soil cores received the following treatments in triplicate: Un-amended control, FUL, PUL, FLP, and PLP. All broiler litter materials were applied to the soil on a total N basis of 89.6 mg N kg−1 soil which is equivalent to an application of 157 kg N ha−1 to non-irrigated, high yielding, corn application rates in South Carolina [22]. The equivalent oven dry mass of broiler litter applied to the soil cores to match the 89.6 mg N kg−1 were 0.0 g for the Control, 0.772 g for FUL, 0.776 g for PUL, 1.204 g for FLP, and 1.240 g for PLP. To optimize microbial activity, distilled water was added dropwise with a syringe and a needle to adjust soil moisture to 60% water filled pore space (WFP) after surface application of the litter treatments [23]. Both sets of cores were incubated for 10 weeks (68 days) at an average ambient temperature of 23 °C and 65% relative humidity.
One set of soil cores was used for sampling the soil weekly during the incubation. The soil cores were sampled to a depth of 12.7 cm using a 0.7-cm diameter rubber stopper borer as a sampling tool. Samples were freeze-dried prior to analysis to minimize N conversion and N gas losses during sample preparation for analysis [24]. The “soil sample” cores were covered with a black polyethylene sheet that allowed gaseous exchange but retarded water evaporation loss. The weight of the cores was inspected daily to make up for evaporation losses and maintain 60% WFP throughout the incubation.
The other set of soil cores was used to determine CO2, N2O and NH3 gas emissions. Each soil core was enclosed in a 2.0-L PET (polyethylene terephthalate) plastic chamber with a threaded polyethylene lid. The lid had a port for periodic gas sampling and a 0.91-mm diameter vent to prevent pressure build-up above ambient atmospheric pressure inside the chamber. Five separate 5-mL gas samples were taken equally spaced across one hour (0, 15, 30, 45, and 60 minutes) to determine CO2 and N2O gas fluxes. The NH3 gas was trapped as ammonium (NH4+) by passive diffusion [25] from the source (soil surface) into an 8-mL glass vial holding 5.0 mL of 0.2 M sulfuric acid. The acid trap was attached with a rubber band to the outside wall of the soil core with its open end at the same level as of the soil surface.
The time between two flux samplings varied throughout the experiment. Specific flux sampling times for CO2 and N2O were 1, 3, 5, 7, 9, 13, 16, 20, 27, 34, 41, 48, 55, 62, and 68 days from the initiation of the incubation. At each sampling time, the incubation chambers were uncapped and remained open for 2 h to allow headspace gas exchange with the ambient atmosphere, change-out of the NH3 acid trap, and adjust the soil moisture to 60% WFP before recapping the chamber for another flux sampling. Gas sampling was done more frequently during the first three weeks (20 days) of incubation because the highest gas production was expected for all three measured gases (CO2, N2O, and NH3). Thereafter, gas sampling was measured every seven days because the flux of N2O and CO2 was observed to slow down for all treatments.

2.4. Chemical Analysis

2.4.1. Soil and Broiler Litter Material Properties

With the exception of NH4-N and NO3-N, which were carried out in our laboratory, the soil chemical characterization was done at the Clemson University, Agricultural Service Laboratory, Clemson, SC, USA (Table 1). Total soil C and N were determined via thermal combustion, soil P and K were determined in Mehlich 1 extracts by inductively coupled plasma analysis, soil cation exchange capacity (CEC) was determined by the neutral ammonium acetate method, and soil pH was determined in 1:1 ratio soil/deionized water using a glass pH electrode [26].
Soil and broiler litter samples were extracted with 2M KCl and analyzed for ammonium (NH4-N) and nitrite plus nitrate (NO2 + NO3-N), hereafter called NO3-N. Analysis of both NH4-N and NO3-N was carried out using an EL×800 microplate reader (Bio-Tek Instruments, Inc. Winooski, VT) set to 650 nm [27]. The total inorganic N (Nt) is defined as the sum of NH4-N + NO3-N.
All broiler litter materials were analyzed for both total Kjeldahl N (TKN) and total P (TP) after acid digestion using a Technicon auto-analyzer (Technicon Instruments Corp., Tarrytown, NJ, USA). Total C was quantified by combustion with an Elementar VarioMax CN analyzer (Elementar Americas Inc., Ronkonkoma, NY, USA). Broiler litter pH was measured in wet samples (1:1 solid to deionized water mixture) with a pH combination electrode.

2.4.2. Gas Analysis

Gas samples were injected into 10-mL headspace vials and analyzed for CO2 and N2O concentration on a Bruker Model 450-GC (Bruker Daltonics, Billerica, MA) gas chromatograph (GC) outfitted for greenhouse gas (GHG) analysis [28]. The GC was equipped with a model 1041 injector operated at 50 °C and 263 kPa which was connected to a 10-port gas sampling valve and pressure-actuated solenoid valve. Five mL of vial headspace was injected using a Combi-Pal auto-sampler equipped with a 5-mL headspace syringe. A portion of the sample was transferred onto a 1.8-m long by 1.6-cm outer diameter column packed with 80/100 mesh Hay Sep Q with a helium flow rate of 55 mL min−1. The column was connected to a thermal conductivity detector (TCD) operated at 150 °C and with a filament temperature of 200 °C for CO2 analysis. Another portion of the sample was split by means of the gas switching valve to another 10-port gas sampling solenoid valve and a portion of this sample was transferred to a 1.8-m long by 1.6-cm outer diameter silico-steel column also packed with 80/100 mesh Hay Sep Q with a N2 carrier flow rate of 20-mL min−1 for N2O analysis. This column was connected to an electron capture detector (ECD) operated at 300 °C. The GC oven was operated at 40 °C. Quantification of both CO2 and N2O was performed relative to an external standard curve for each gas. The NH3-N captured in the acid trap samples were analyzed as NH4-N by chemically suppressed cation chromatography [29].

2.5. Data Analysis

The gas flux from the soil cores was calculated by fitting the time series headspace gas concentrations with the quadratic regression model [30]. The magnitude of the flux was further corrected by determining the theoretical flux underestimation [31]. Cumulative CO2 and N2O emissions were estimated from the gas fluxes determined at the specific sampling time points throughout the incubation [32]. At the end of the 10-week study, the cumulative production of CO2, N2O-N, and NH3-N were statistically analyzed using the ANOVA procedure of SAS version 9.4 (SAS Institute, Cary, NC, USA). Pairwise comparisons of treatment means were performed using the least square difference (LSD) option and were considered different when the probability values were p < 0.05.
A repeated measures analysis was conducted using the PROC MIXED procedure of SAS to evaluate how quickly the soil mineralization (NH4-N and NO3-N) responded to various broiler litter treatments during the incubation experiment [33]. A first-order autoregressive covariance structure in SAS was used to test the effects of Treatment (Trt), Time (Week), and Trt × Week interaction. The differences in response patterns were considered different among treatments when the probability of F-values was p < 0.05 for the interaction Trt × Week.
The nitrification rates for each poultry litter material were estimated using a model that describes the kinetics of transformation of NH4-N into NO3-N [34]. To quantify the accumulation of NO3-N with time (t), the integrated form of the Verhulst equation was used:
NO3-N = a/1 + (a/[NO3-N]0 − 1) exp(-ak [t − t0])
where a is the asymptotic value of accumulated NO3-N, k is a constant, [NO3-N]0 is the initial value of NO3-N at time zero (t0). The nonlinear procedure of Prism 7, GraphPad Software, Inc. (San Diego, CA, USA) was used to fit equation 1 to experimental soil NO3-N data versus t. The maximal rate of nitrification was calculated as Kmax = k × a2/4.
The kinetics of N mineralization from application of poultry litter materials applied to soil were described by a first-order rate model [35]. The amount of N mineralized during the incubation study was evaluated using the equation:
Nt = NO(1 − exp [−kt]) + Ni
where Nt is the total inorganic N (NO3-N + NH4-N) concentration minus control concentrations, NO is the potentially available organic N, k is a rate constant, t the is time of incubation, and Ni is initial N at t = 0. The nonlinear procedure of Prism 7, GraphPad Software, Inc. (San Diego, CA, USA) was used to fit Equation (2) to experimental soil Nt, t, and NO.
In addition, the available mineralized N as percent of total N added with each broiler litter treatment was estimated according to the following equation [36].
Available mineral N (%) = [(Nt in treated soil − Nt in control soil)/total N added] × 100

3. Results

3.1. Broiler Litter Materials Used in the Soil Incubation

The concentration and proportions of C, N, P and other constituents were different among the four broiler litter materials used in the study (Table 2). All chemical parameters of the untreated broiler litter, FUL or PUL, had values within the range of those reported by service laboratory analysis [37]. All four broiler litter materials had C contents (434–499 g kg−1) within the expected range for poultry litter materials [38]. Total N concentrations were 55 to 66% higher in FUL or PUL versus FLP or PLP and also had higher NH4-N and NO3-N contents. The C:N ratio of FUL or PUL was almost half of FLP and PLP. Both FUL or PUL had a less balanced N:P ratio of <4.0 and basic pH. In contrast, the FLP and PLP had N:P ratios > 4.0 along with acidic pH, both resulting from the QW treatment [15].

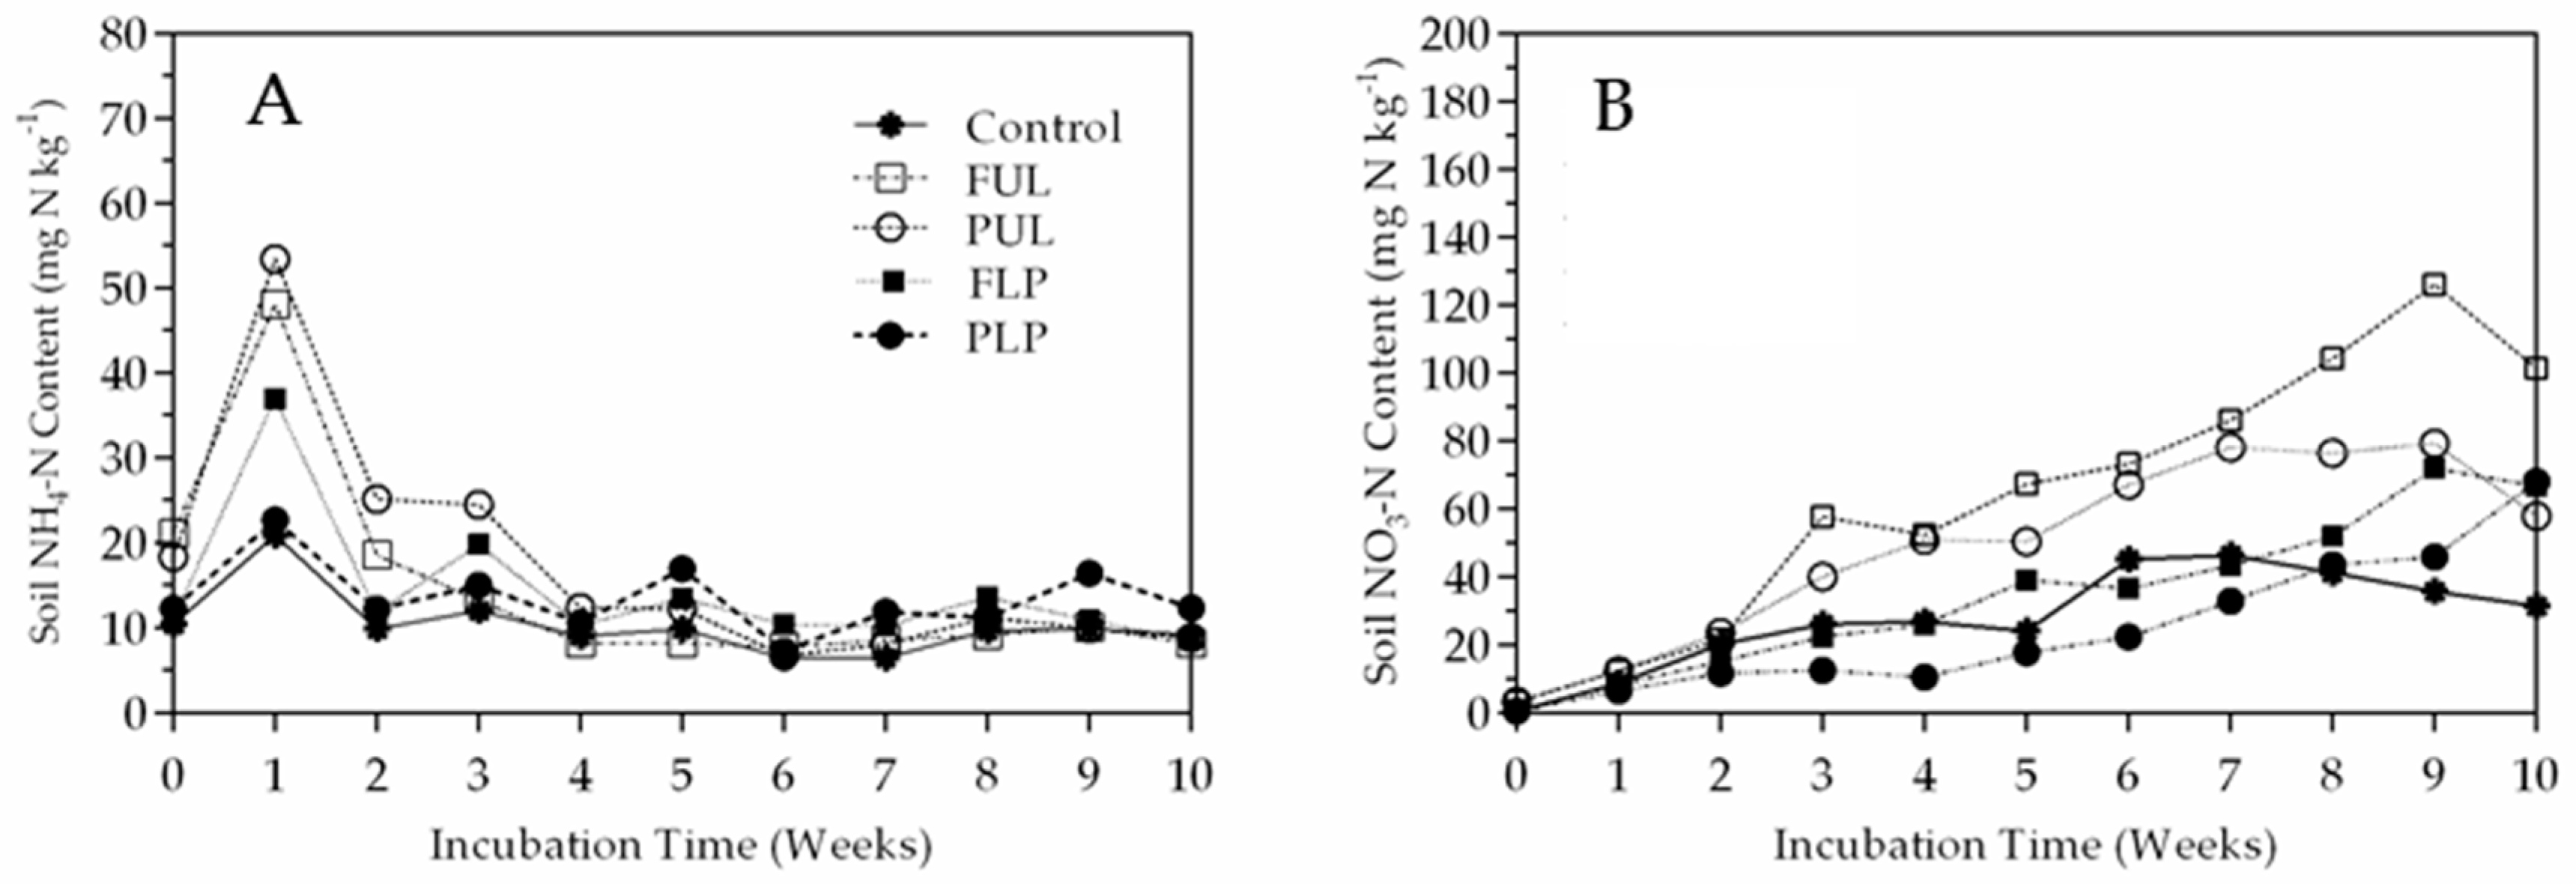
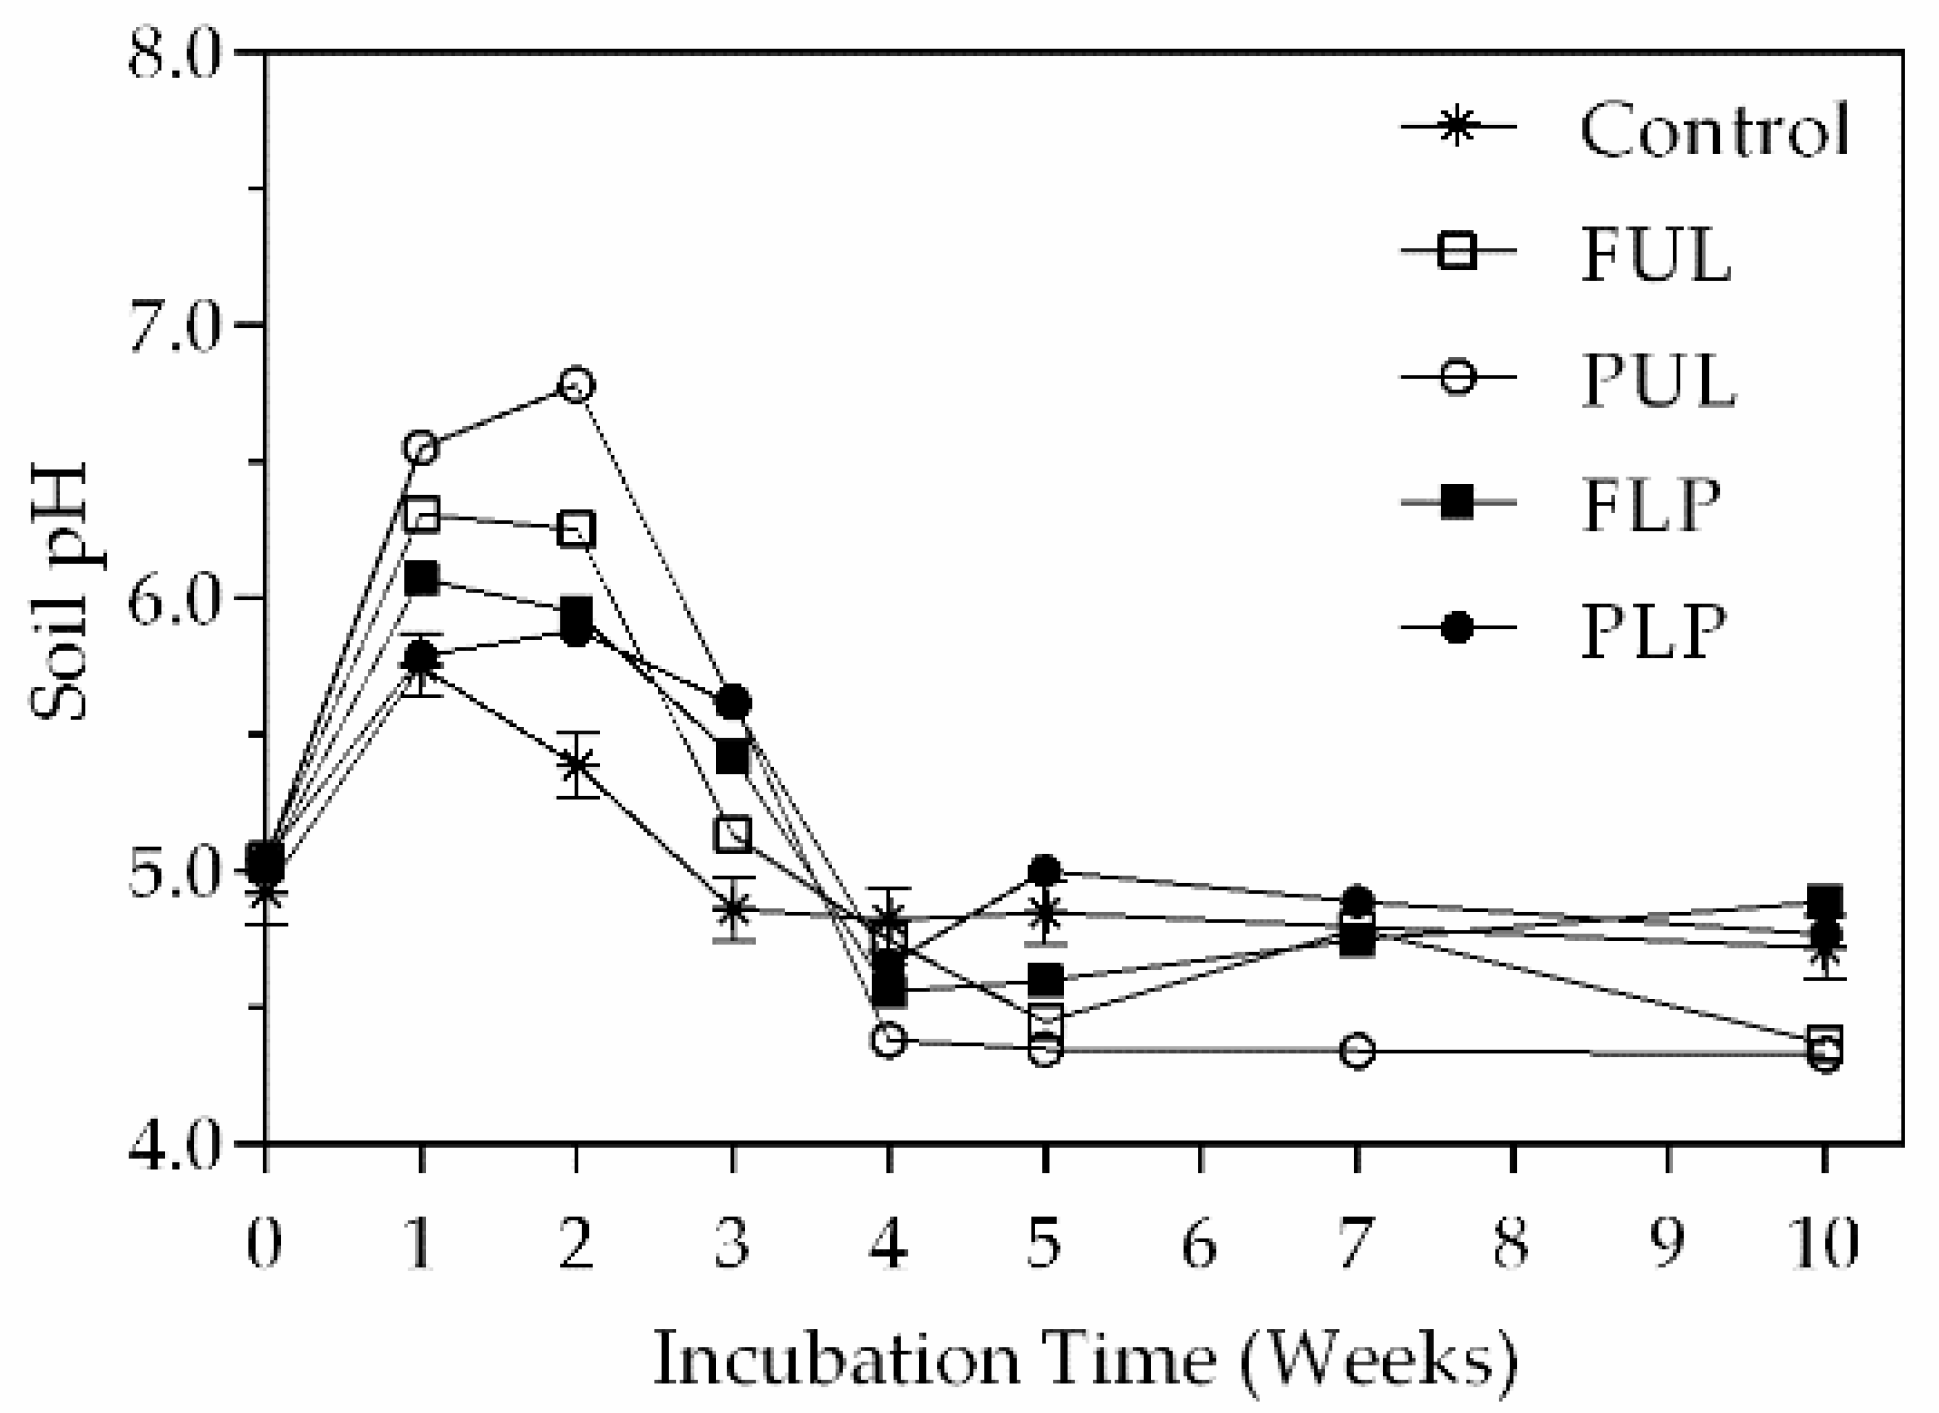
3.2. Emissions of CO2, NH3, and N2O during Soil Incubation

Analysis of variance indicated significant differences in cumulative CO2, NH3, and N2O production among treatment combinations. Despite their contrasting chemical properties (Table 2) and particle size (pelletized versus unpelletized), the soil cumulative CO2 production corrected by the CO2 emissions of the control soil (g C kg−1 soil) was not significantly different (p < 0.05) for any of the four broiler litter treatments (Table 3). However, the higher percent of cumulative CO2 emitted per unit of C added to soil with the FUL (61%) or PUL (56%) versus FLP (38%) or PLP (36%) can be attributed to all broiler litter materials being added to soil at a fixed N rate equivalent to 157 kg N ha−1. Thus, on average, the C addition to soil with FLP or PLP was 58% of those applied using FUL or PUL.

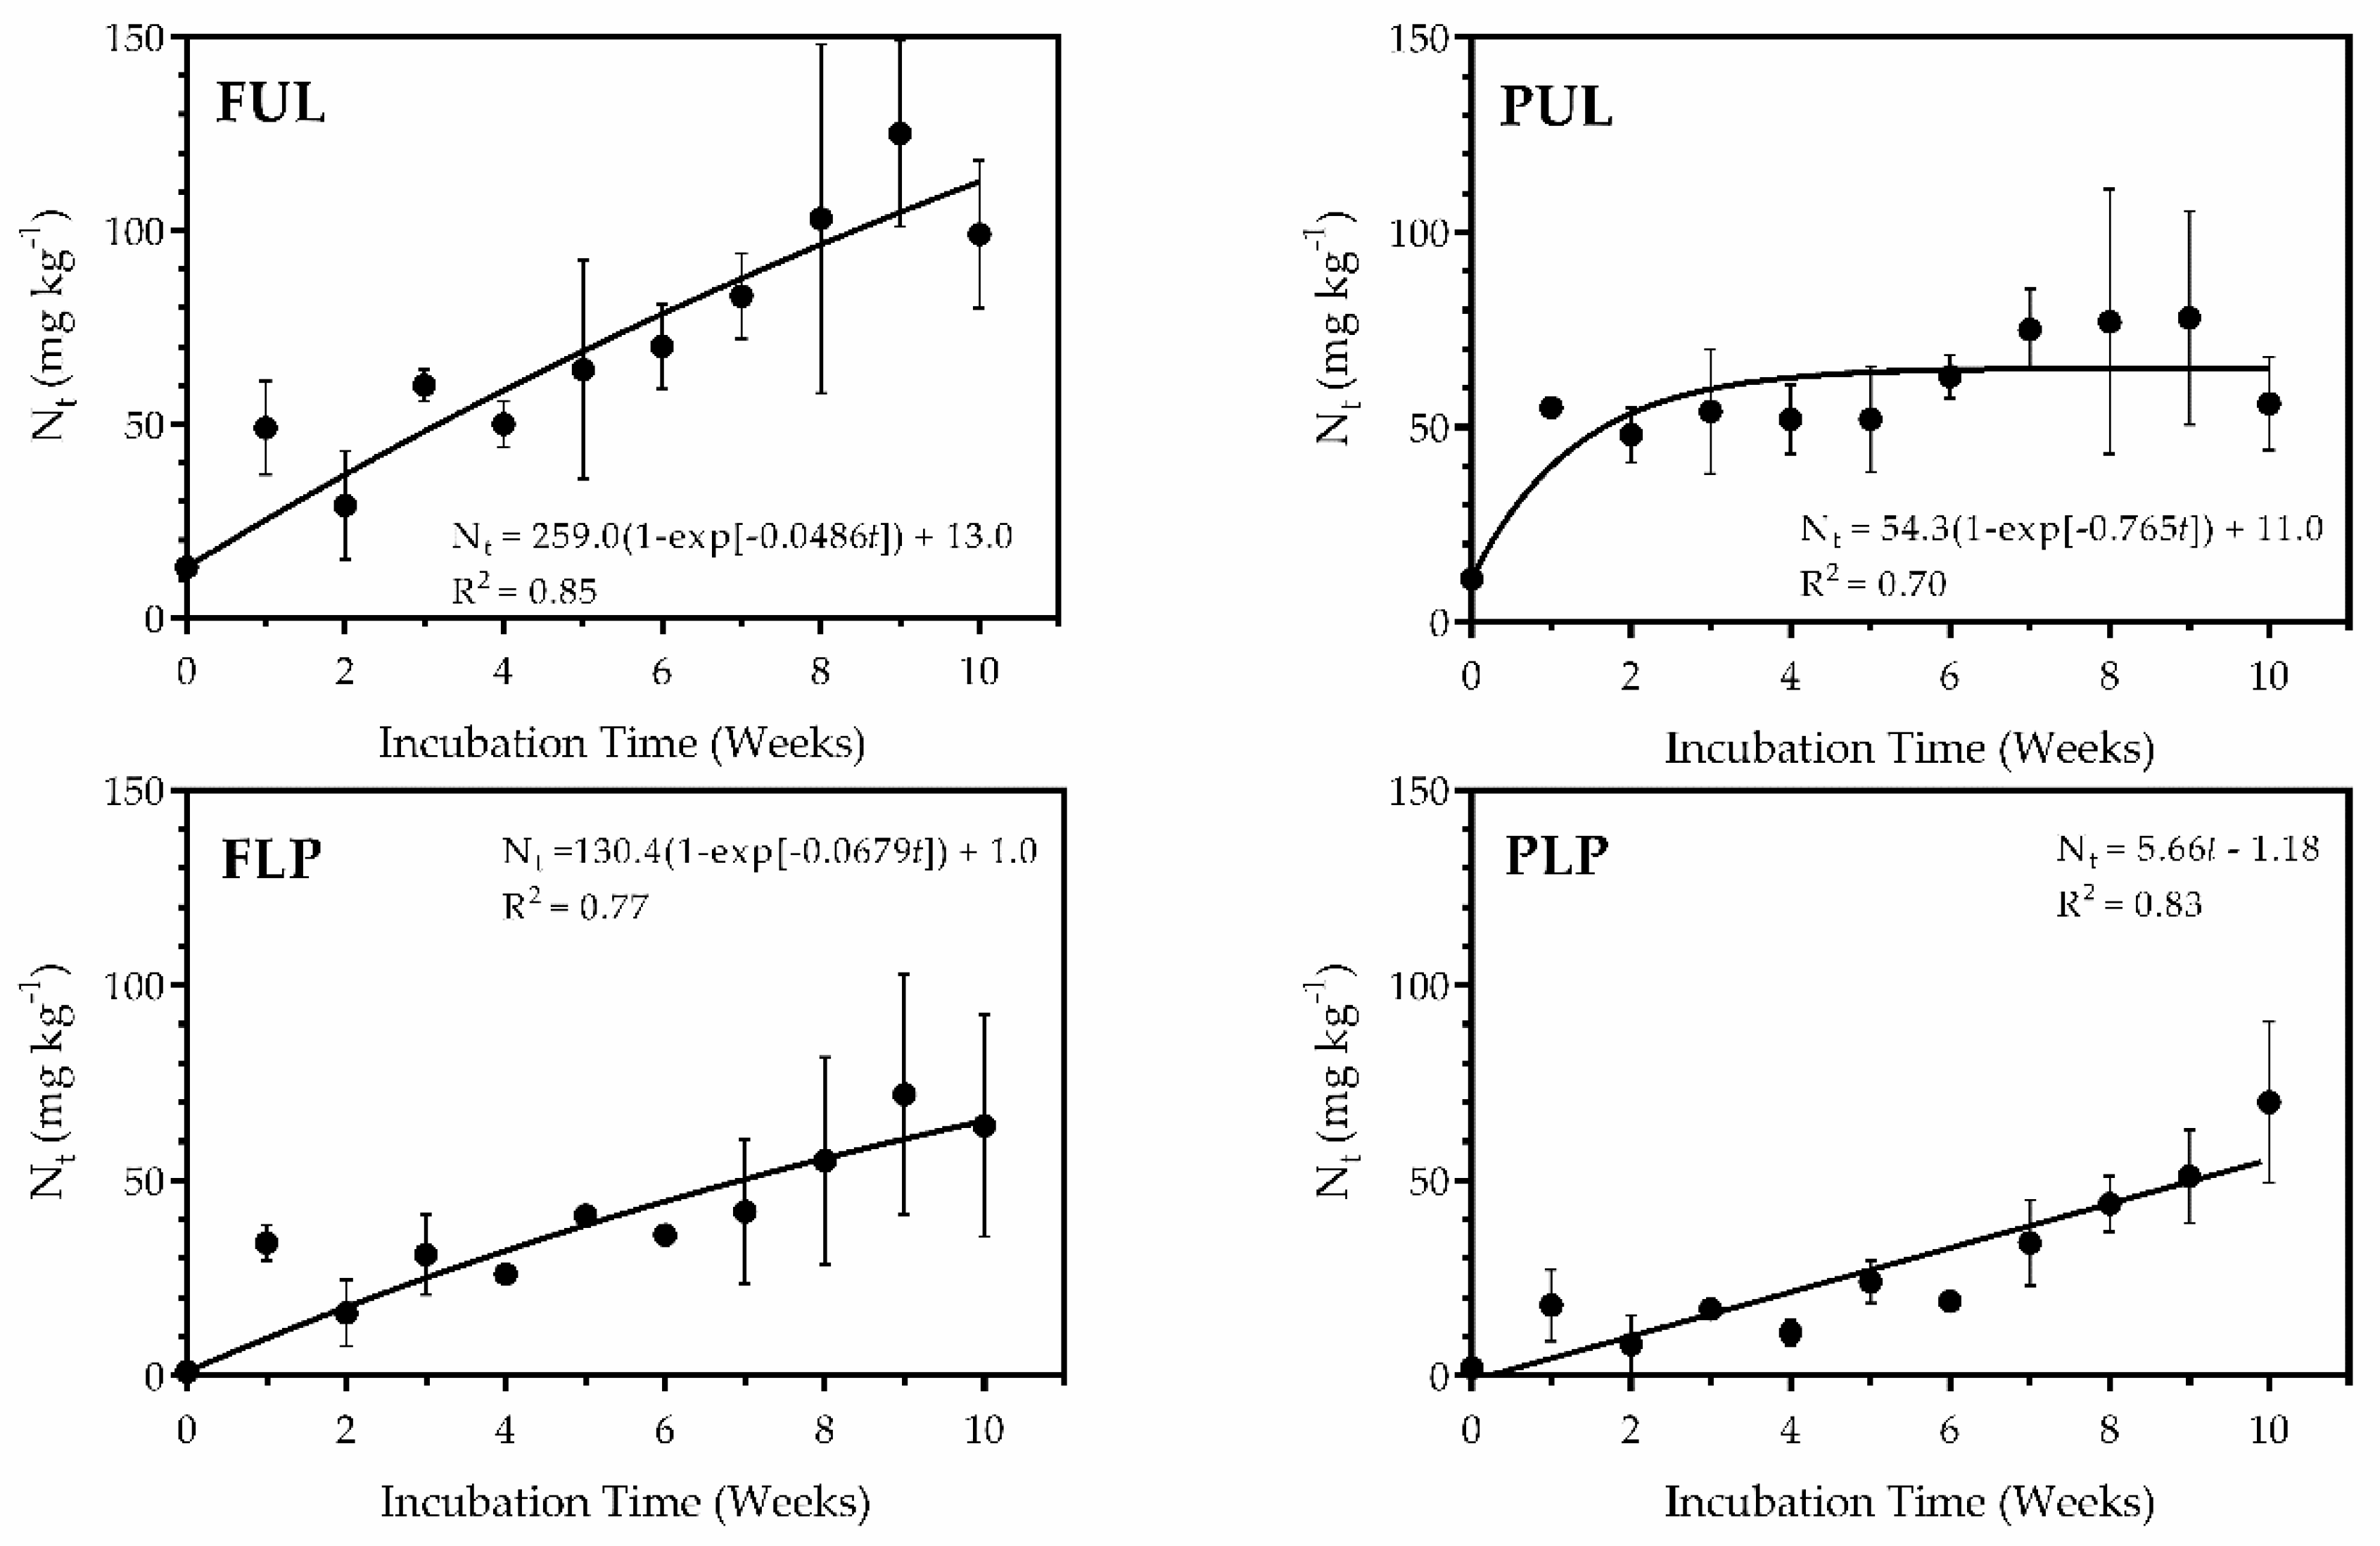
3.3. Nitrogen Mineralization

The evolution of NH4-N and NO3-N content during the 10-week “soil sample” incubation with surface applications of four broiler litter treatments and an unamended control are presented in Figure 1A,B. The rise in NH4-N content started immediately after application of the broiler materials to soil (Figure 1A). On average, the highest soil NH4-N contents occurred in the first week for FUL (53.4 mg kg−1) and PUL (48.1 mg kg−1) followed by FLP (37.0 mg kg−1) while PLP (22.7 mg kg−1) remained almost as low as the control (20.9 mg kg−1). Thereafter, in Week 4 soil NH4-N concentrations declined to levels similar to the control until the end of the 10-week incubation study. Simultaneously, NO3-N concentrations started to rise in the third week of incubation for all treatments suggesting microbial nitrification of NH4-N (Figure 1B).
An ANOVA analysis indicated that there were significant differences among poultry treatments (Trt), time (Weeks), and the interaction Trt × Weeks for both soil NO3-N and NH4-N concentrations during the incubation study (Table 4). The analysis of Trt × Weeks effect confirmed that differences in NH4-N concentrations shown in Figure 1A among poultry litter treatment combinations during the first three weeks of incubation were statistically significant but differences were not significant with respect to the control on week 4 nor on any subsequent week until the end of the incubation study (combined Trt effect per week, Table 4). The combined Trt × Weeks effect analysis also confirms that NO3-N concentrations in all treatments shown in Figure 1B were not significantly different to the soil control in the first two weeks of incubation (Table 4). Subsequently, NO3-N concentrations started to rise in the third week of incubation showing significant differences among treatments until the end of the incubation study.
Soil NO3-N accumulation as a result of biological nitrification was most rapid for the FUL and PUL treatments with maximal rates (Kmax) of 15.2 mg N kg−1 wk−1 and 14.3 mg N kg−1 wk−1, respectively (Table 5). The faster soil NO3-N accumulation for the FUL treatment could be attributed to its finer particle size and larger surface area than the pelletized litter material. Nitrification rates were much lower for FLP or PLP treatments with Kmax of 5.8 to 8.2 mg N kg−1 wk−1. These lower Kmax suggested that properties of these materials besides particle size, such as low NH4-N contents or C:N ratio, possibly had an effect on slower nitrification rates.
The addition to the soil of the four poultry litter materials initially increased the soil pH (Figure 2). At the onset of the incubation, the average soil pH was 5.03 but it rapidly increased in the first week to a value of 6.31 for the FUL, and in the second week to 6.78 for the PUL, possibly caused by the alkalinity of the materials (pH = 7.95, Table 2). In contrast, the soil pH increased only to values of 5.95 for the FLP and 5.88 for the PLP in the first week of incubation. These lower pH values were expected because of the acidic nature and low NH4-N content of these materials (Table 2). After four weeks of incubation, soil pH declined to values below pH 5.0 in all treatments along with diminishing soil NH4-N because of increasing microbial nitrification, an acid forming process. However, these lower pH values did not inhibit nitrification in the FUL and PUL treatments or fully explain the slow nitrification rates of the FLP and PLP treatments since the nitrification rates in acidic soils can equal or exceed those of neutral soils [39].
The evolution of Nt during the 10-week incubation study and model equations for each broiler litter material applied to the Norfolk soil are presented in Figure 3. Except for PLP that had a linear response, the other three treatments had a typical non-linear response according to a first-order reaction model (Equation (2)). Both FUL and PUL had the greatest Nt production rates along with higher initial NH4-N contents at time zero (Table 2) and rapid nitrification rates (Kmax) (Table 5). Instead, the Nt production rates were much lower for FLP or PLP most likely due to the very low levels of NH4-N at time zero, slow mineralization and very slow nitrification rates (Figure 3). The available Nt during each week was used to estimate the inorganic N available as a percent of total N added with each broiler litter treatment (Table 6). The weekly inorganic N available estimates revealed the significant differences in available mineralized N between treatments in each of the first seven weeks of incubation. Thereafter, in the last three weeks of incubation, all four treatments had comparable percent of inorganic available N. For values above 100% available inorganic N, such as 124% for FUL in week 9, indicated a release of native soil N occurred during incubation [40]. On average, FUL (71%) and PUL (69%) had much higher mean percent available inorganic N than FLP (42%) and PLP (29%) suggesting FLP and PLP performed as a slow-release source of Nt.

4. Discussion

The Norfolk soil used for this study had the typical physio-chemical characteristics of a sandy soil under conservation tillage in the southeastern Coastal Plain region [21]. As a result of its conservation tillage management, the topsoil showed higher nutrient concentrations (total C, N, P, and K) in soil samples from 0 to 7.5 cm than from 7.5 to 15 cm depth (Table 1). Because of the low contents of NH4-N and NO3-N and uniform CEC and pH at both soil depths, we assumed that the 15-cm soil cores were adequate for evaluating the soil inorganic N dynamics of surface applications of raw or low-P broiler litter.
In general, at a soil moisture equivalent to 60% WFP, cumulative CO2 emissions from microbial respiration increase to a maximum but denitrification and N2O emissions should remain very low [23]. In our study, the cumulative CO2 emissions had similar trends for all four litter treatments with no significant differences between pairwise mean treatment comparisons. As expected, the FUL, FLP, PLP treatment had the lowest cumulative N2O emissions. However, the cumulative N2O emission of the PUL treatment was significantly different and the highest for all treatments (3.0 mg N kg−1). Since moisture of all soil cores was adjusted back to 60% WFP after each air headspace exchange, we observed that the fine-litter in the FUL and FLP were not wetter than the pellets in the PUL and PLP treatment since they crumbled in the first week of incubation as it would be the case of litter pellets applied to a crop field. Therefore, the significant differences in N2O emissions could not be attributed either to differences in soil water content of the litter treatments, or particle size of the materials. Similar results to the FUL and PUL treatments were obtained by Cabrera et al. [41] on gaseous emissions from surface-applied fine-particle or pelletized broiler litter to sandy soils. At 58% WFP, their fine-particle broiler litter treatment showed maximum rates of CO2 production but N2O emissions rates were very low. In contrast, their pelletized broiler litter amendment produced similar CO2 emissions as fine-poultry litter, but emitted significantly more N2O than fine-particle litter. Likewise, Hayakawa et al. [42] reported that soil moisture at 50% WFP enhanced CO2 emissions of soils amended with fine-particulate or pelletized poultry litter but promoted high N2O production in the pelletized poultry litter treatment. They suggested that anaerobic conditions inside the pellets promoted denitrification during mineralization of the poultry litter pellets. Although FLP and PLP soil treatments had comparable cumulative CO2 emissions to the FUL or PUL treatments, both had significant lower NH3 and N2O emissions likely because of key chemical properties such as C:N ratio and acidity.
Ammonia content at time zero and subsequent N mineralization of both FUL and PUL treatments released significant amounts of NH4-N to soil but the alkaline pH in raw broiler litter raised the soil pH above 6.0 and induced significant N losses via NH3 volatilization that ranged from 24 to 35% total N applied to soil (Table 3). Instead, the acidic pH of low-P broiler litter had a positive effect on abating soil NH3 emissions from surface applied poultry litter by maintaining soil pH below 6.0 and decreasing NH3 losses to less than 6% of the total N applied to soil. Acidifying amendments have been extensively studied for their effectiveness to decrease NH3 emissions from broiler litter and their effect on microbial N mineralization [43]. Mineralization of organic N to NH4-N requires enzymes produced by uric-acid degrading and urea-degrading soil microorganisms [44]. According to Burt et al. [45] acidification of broiler litter using flue-gas desulfurization gypsum impacted N mineralization resulting in lower pH, less NH3 volatilization, and very low NO3-N concentrations along with up to 57% decline in urea-degrading bacteria as compared to untreated broiler litter control. In our study, the acidic nature of FLP and PLP most likely slowed down the growth of urea-degrading bacteria or activities of urea-degrading enzymes which in turn slowed the mineralization of organic N to NH4-N, and thereby, significantly abating NH3 emissions with respect to FUL and PUL treatments.
Under the controlled conditions of soil moisture and temperature of our incubation study, the evolution of inorganic N content after addition of broiler litter materials to soil were also affected by the C:N ratio of each broiler litter product. In general, when organic materials with C:N ratios of less than 15:1 are added to soil, there is usually a rapid release of mineral NH4+ early in the mineralization process [46]. In our study, the rapid release of NH4+ and subsequent NO3-N accumulation as a result of biological nitrification was most rapid for the FUL and PUL treatments with C:N ratio of 10.5:1. In contrast, C:N ratios higher than 25:1 promote N immobilization by soil microorganisms through the conversion of soil NH4-N and NO3-N into organic N lowering the inorganic N available for plant growth [20,46]. For C:N ratios in between 15 and 25, N mineralization is slow and immobilization may occur [47]. In our study the QW treated broiler litter materials, FLP and PLP, had C:N ratios > 15 that resulted in slow release of soil NH4-N and NO3-N with low NH3 and N2O emission losses.
The low-P treated broiler litter appears as a source capable of releasing N over an extended period and ideally could conserve soil N until it is needed by the crop while resolving the intractable problem of N and P imbalance in spent broiler litter. Being a slow available N source, low-P broiler litter may not effectively provide starter N during spring applications. However, it could be combined with other N sources such as untreated litter or synthetic fertilizers as starters to control N availability during the crop season, improving N use efficiency, and lessening the concerns of excessive N movement into water resources or the atmosphere. Longer incubation and field tests of using low-P broiler litter products as N sources appears warranted, especially field tests to evaluate the N use efficiencies during crop production.

Author Contributions

Conceptualization, A.A.S.; methodology, A.A.S., P.D.S., and K.S.R.; formal analysis, A.A.S., P.D.S., and G.C.S.; data curation, P.D.S.; writing—original draft preparation, A.A.S.; writing—review and editing, A.A.S., P.D.S., K.S.R. and G.C.S.

Funding

This research received no external funding.

Acknowledgments

This research was part of USDA-ARS National Program 212 Soil and Air, ARS Project 6082-12630-001-00D. Mention of trade names or commercial products in this article is solely for the purpose of providing specific information and does not imply recommendation or endorsement by the U.S. Department of Agriculture.

Conflicts of Interest

The authors declare no conflicts of interest.

References

  1. Bolan, N.S.; Szogi, A.A.; Chuasavathi, T.; Seshadri, B.; Rothrock, M.J.; Panneerselvam, P. Uses and management of poultry litter. World Poult. Sci. J. 2010, 66, 673–698. [Google Scholar] [CrossRef] [Green Version]
  2. Lin, Y.; Watts, D.B.; van Santen, E.; Cao, G. Influence of poultry litter on crop productivity under different field conditions: A meta-analysis. Agron. J. 2018, 110, 807–818. [Google Scholar] [CrossRef]
  3. Bouwman, L.; Goldewijk, K.K.; Van Der Hoek, K.W.; Beusen, A.H.; Van Vuuren, D.P.; Willems, J.; Rufino, M.C.; Stehfest, E. Exploring global changes in nitrogen and phosphorus cycles in agriculture induced by livestock production over the 1900–2050 period. Proc. Natl. Acad. Sci. USA 2013, 110, 20882–20887. [Google Scholar] [CrossRef] [PubMed]
  4. Powers, W.; Capelari, M. Measurement and mitigation of reactive nitrogen species from swine and poultry production. J. Anim. Sci. 2017, 95, 2236–2240. [Google Scholar] [PubMed]
  5. Huang, T.; Gao, B.; Hu, X.-K.; Lu, X.; Well, R.; Christie, P.; Bakken, L.R.; Ju, X.-T. Ammonia-oxidation as an engine to generate nitrous oxide in an intensively managed calcareous Fluvo-aquic soil. Sci. Rep. 2014, 4, 3950. [Google Scholar] [CrossRef] [PubMed]
  6. Sikora, L.J.; Enkiri, N.K. Comparison of phosphorus uptake from poultry litter compost with triple superphosphate in codorus soil. Agron. J. 2005, 97, 668–673. [Google Scholar] [CrossRef]
  7. Paudel, K.P.; McIntosh, C.S. Country report: Broiler industry and broiler litter-related problems in the southeastern United States. Waste Manag. 2005, 25, 1083–1088. [Google Scholar] [CrossRef]
  8. Bernhart, M.; Fasina, O.; Fulton, J.; Wood, C. Compaction of poultry litter. Bioresour. Technol. 2010, 101, 234–238. [Google Scholar] [CrossRef]
  9. Pote, D.; Meisinger, J.J. Effect of poultry litter application method on ammonia volatilization from a conservation tillage system. J. Soil Water Conserv. 2014, 69, 17–25. [Google Scholar] [CrossRef] [Green Version]
  10. Adeli, A.; McCarty, J.C.; Read, J.J.; Willers, J.L.; Feng, G.; Jenkins, J.N. Subsurface band placement of pelletized poultry litter in cotton. Agron. J. 2016, 108, 1356–1366. [Google Scholar] [CrossRef]
  11. Bauer, P.J.; Szogi, A.A.; Shumaker, P.D. Fertilizer efficacy of poultry litter ash blended with lime or gypsum as fillers. Environments 2019, 6, 50. [Google Scholar] [CrossRef]
  12. Marchioro, V.; Steinmetz, R.L.R.; do Amaral, A.C.; Gaspareto, T.C.; Treichel, H.; Kunz, A. Poultry itter solid state anaerobic digestion: Effect of digestate recirculation intervals and substrate/inoculum ratios on process efficiency. Front. Sustain. Food Syst. 2018, 2, 46. [Google Scholar] [CrossRef]
  13. Fangueiro, D.; Hjorth, M.; Gioelli, F. Acidification of animal slurry—A review. J. Environ. Manag. 2015, 149, 46–56. [Google Scholar] [CrossRef] [PubMed]
  14. Tomlinson, P.; Savin, M.; Moore, P., Jr. Long-term applications of untreated and alum-treated poultry litter drive soil nitrogen concentrations and associated microbial community dynamics. Biol. Fertil. Soils 2014, 51, 43–55. [Google Scholar] [CrossRef]
  15. Szogi, A.A.; Vanotti, M.B.; Hunt, P.G. Process for Removing and Recovering Phosphorus from Animal Waste. U.S. Patent No. 8,673,046, 18 March 2014. [Google Scholar]
  16. Szögi, A.A.; Vanotti, M.B.; Hunt, P.G. Phosphorus recovery from poultry litter. Trans. ASABE 2008, 51, 1727–1734. [Google Scholar] [CrossRef]
  17. Cabrera, M.L.; Cheng, S.C.; Merka, W.C.; Pancorbo, O.C.; Thompson, S.A. Nitrous oxide and carbon dioxide emissions from pelletized in non-pelletized poultry litter incorporated into soil. Plant Soil 1994, 163, 189–196. [Google Scholar] [CrossRef]
  18. Kim, S.U.; Ruangcharus, C.; Kumar, S.; Lee, H.H.; Park, H.J.; Jung, E.S.; Hong, C.O. Nitrous oxide emission from upland soil amended with different animal manures. Appl. Biol. Chem. 2019, 62, 8. [Google Scholar] [CrossRef] [Green Version]
  19. Sharpe, R.; Schomberg, H.; Harper, L.; Endale, D.; Jenkins, M.; Franzluebbers, A. Ammonia volatilization from surface-applied poultry litter under conservation tillage management practices. J. Environ. Qual. 2004, 33, 1183–1188. [Google Scholar] [CrossRef]
  20. Thangarajan, R.; Bolan, N.S.; Tian, G.; Naidu, R.; Kunhikrishnan, A. Role of organic amendment application on greenhouse gas emission from soil. Sci. Total Environ. 2013, 465, 72–96. [Google Scholar] [CrossRef]
  21. Bauer, P.J.; Frederick, J.R.; Busscher, W.J.; Novak, J.M.; Fortnum, B.A. Soil sampling for fertilizer recommendations in conservation tillage with paratill subsoiling. Crop Manag. 2008, 7. [Google Scholar] [CrossRef]
  22. Clemson University. Regulatory Services, Soil Test Rating System; Ag Service Lab, Clemson University: Clemson, SC, USA, 2019; Available online: https://www.clemson.edu/public/regulatory/ag-srvc-lab/soil-testing/pdf/rating-system.pdf (accessed on 13 July 2019).
  23. Linn, D.M.; Doran, J.W. Effect of water-field pore space on carbon dioxide and nitrous oxide production in tilled and non-tilled soils. Soil Sci. Soc. Am. J. 1984, 48, 1267–1272. [Google Scholar] [CrossRef]
  24. Mahimairaja, S.; Bolan, N.S.; Hedley, M.J.; McGregor, A.N. Evaluation of methods of measurement of nitrogen in poultry and animal manure. Nutr. Cycl. Agroecosyst. 1990, 24, 141–148. [Google Scholar] [CrossRef]
  25. Lahav, O.; Mor, T.; Heber, A.J.; Molchanov, S.; Ramirez, J.C.; Li, C.; Broday, D.M. A new approach for minimizing ammonia emissions from poultry houses. Water Air Soil Pollut. 2008, 191, 183–197. [Google Scholar] [CrossRef]
  26. Sikora, F.J.; Moore, K.P. Soil Test Methods from the South Eastern United States; SERA-IEG-6; Southern Cooperative Series Bulletin: Lexington, KY, USA, 2014. [Google Scholar]
  27. Sims, G.K.; Ellsworth, T.R.; Mulvaney, R.L. Microscale determination of organic nitrogen in water and soil extracts. Commun. Soil Sci. Plant Anal. 1995, 26, 303–316. [Google Scholar] [CrossRef]
  28. Duvekot, C. Analysis of greenhouse gases by gas chromatography. In Agilent Technologies Application Note SI-01741; Agilent Technologies: Santa Clara, CA, USA, 2010. [Google Scholar]
  29. ASTM. Test method for determination of dissolved alkali and alkaline earth cations and ammonium in water and waste water by iron chromatography. In Annual Book of Standards. VOL 11.02; ASTM Standard D6919-09; American Society for Testing and Materials: Washington, DC, USA, 2009. [Google Scholar]
  30. Wagner, S.W.; Reicosky, D.C.; Alessi, R.S. Regression models for calculating gas fluxes measured with a closed chamber. Agron. J. 1997, 89, 279–284. [Google Scholar] [CrossRef]
  31. Venterea, R. Simplified method for quantifying theoretical underestimation of chamber—Based trace gas fluxes. J. Environ. Qual. 2010, 39, 126–135. [Google Scholar] [CrossRef]
  32. Parkin, T.B.; Venterea, R.T. Sampling Protocols. Chamber-based trace gas flux measurements. In Sampling Protocols; Follet, R.F., Ed.; USDA-ARS Gracenet: Washington, DC, USA, 2010; Chapter 3; pp. 3-1–3-9. [Google Scholar]
  33. Gezan, S.A.; Carvalho, M. Chapter 10: Analysis of repeated measures for the biological and agricultural sciences. In Applied Statistics in Agricultural, Biological, and Environmental Sciences; Glaz, B., Yeater, K.M., Eds.; American Society of Agronomy, Crop Science Society of America, and Soil Science Society of America, Inc.: Madison, WI, USA, 2018; pp. 279–297. [Google Scholar]
  34. Hadas, A.; Feigembaum, S.; Feigin, A.; Portnoy, R. Nitrification rates in profiles of differently managed soil types. Soil Sci. Soc. Am. J. 1986, 50, 633–639. [Google Scholar] [CrossRef]
  35. Havlin, J.L.; Beaton, J.D.; Tisdale, S.L.; Nelson, W.L. Soil Fertility and Fertilizers. An Introduction to Nutrient Management, 6th ed.; Prentice Hall: Upper Saddle River, NJ, USA, 1999. [Google Scholar]
  36. Moore, A.D.; Mikkelsen, R.L.; Israel, D.W. Nitrogen mineralization of anaerobic swine lagoon sludge as influenced by seasonal tempertures. Commun. Soil Sci. Plant Anal. 2004, 35, 991–1005. [Google Scholar] [CrossRef]
  37. Sharpley, A.; Slaton, N.; Tabler, T.; VanDevender, K.; Daniels, M.; Jones, F.; Daniels, T. Nutrient Analysis of Poultry Litter; University of Arkansas System, Agriculture and Natural Resources, Research and Extension: Little Rock, AR, USA, 2009. [Google Scholar]
  38. Lynch, D.; Henihan, A.M.; Bowen, B.; Lynch, D.; McDonnell, K.; Kwapinski, W.; Leahy, J.J. Utilisation of poultry litter as an energy feedstock. Biomass Bioenergy 2013, 49, 197–204. [Google Scholar] [CrossRef] [Green Version]
  39. Li, Y.; Chapman, S.J.; Nicol, G.W.; Yao, H. Nitrification and nitrifiers in acidic soils. Soil Biol. Biochem. 2018, 116, 290–301. [Google Scholar] [CrossRef]
  40. Cayuela, M.L.; Velthoh, G.L.; Mondini, C.; Sinicco, T.; Van Groeningen, J.W. Nitrous oxide and carbon dioxide emissions during initial decomposition of animal by-products applied as fertilizers to soils. Geoderma 2010, 157, 235–242. [Google Scholar] [CrossRef]
  41. Cabrera, M.L.; Chiang, S.C.; Merka, W.C.; Pancorbo, O.C.; Thompson, S.A. Pelletizing and soil water effects on gaseous emissions from surface-applied poultry litter. Soil Sci. Soc. Am. J. 1994, 58, 807–811. [Google Scholar] [CrossRef]
  42. Hayakawa, A.; Akiyama, H.; Sudo, S.; Yagi, K. N2O and NO emissions from an Andisol field as influenced by pelleted poultry manure. Soil Biol. Biochem. 2009, 41, 521–529. [Google Scholar] [CrossRef]
  43. Cook, K.L.; Rothrock, M.J.; Eiteman, M.A.; Lovanh, N.; Sistani, K. Evaluation of nitrogen retention and microbial populations in poultry litter treated with chemical, biological or adsorbent aamendments. J. Environ. Manag. 2011, 92, 1760–1766. [Google Scholar] [CrossRef]
  44. Rothrock, M.J.; Cook, K.L.; Warren, J.G.; Sistani, K. Microbial mineralization of organic nitrogen forms in poultry litter. J. Environ. Qual. 2010, 39, 1848–1857. [Google Scholar] [CrossRef]
  45. Burt, C.D.; Cabrera, M.L.; Rothrock, M.J.; Kissel, D.E. Flue-gas desulfurization effects on urea-degrading bacteria and ammonia volatilization from broiler litter. Poult. Sci. 2017, 6, 2676–2683. [Google Scholar] [CrossRef]
  46. Nahm, K.H. Factors influencing nitrogen mineralization during poultry litter composting and calculations for available nitrogen. World Poult. Sci. J. 2005, 61, 238–255. [Google Scholar] [CrossRef]
  47. Nguyen, T.T.; Cavagnaro, T.R.; Ngo, H.T.T.; Marschner, P. Soil respiration, microbial biomass and nutrient availability in soil amended with high and low C/N residue–Influence of interval between residue additions. Soil Biol. Biochem. 2016, 95, 189–197. [Google Scholar] [CrossRef]
Figure 1. Evolution of the soil NH4-N (A) and NO3-N (B) content in the unamended control and surface applications to soil of fine-particle untreated litter (FUL); pelletized untreated litter (PUL); fine-particle low-P treated litter (FLP); and pelletized low-P treated litter (PLP). Each data point is the average of three replicates.
Environments 06 00096 g001
Figure 2. Evolution of soil pH during the soil incubation study.
Environments 06 00096 g002
Figure 3. Total inorganic N (Nt = NO3-N + NH4-N) for four broiler litter materials applied to Norfolk soil: FUL = fine untreated litter; PUL = pelletized untreated litter; FLP = fine low-P treated litter; PLP = pelletized low-P treated litter. Except for PLP the lines are based on first order reaction (Equation). Data are the mean of three samples and error bars are one standard deviation of the mean.
Environments 06 00096 g003
Table 1. Chemical properties of the Norfolk loamy sand soil.
Depth
cm
Cg
kg−1
Nmg
kg−1
NH4-N
mg kg−1
NO3-N
mg kg−1
P
mg kg−1
K
mg kg−1
CEC
cmol kg−1
pH
0–7.510.989110.40.5433714.25.3
7.5–15----17463.25.3
Table 2. Chemical properties of the four broiler litter materials: Fine untreated litter (FUL), pelletized untreated litter (PUL), fine low-P treated litter (FLP), and pelletized low-P treated litter (PLP). Data are average of two samples on a dry weight basis.
Broiler Litter MaterialC
g kg−1
N
g kg−1
P
g kg−1
NH4-N
mg kg−1
NO3-N
mg kg−1
C:N
Ratio
N:P
Ratio
pH
FUL43441.211.14891128110.53.77.95
PUL43440.915.13618133510.62.77.95
FLP47926.46.2159BD 118.14.36.31
PLP49924.84.23332020.105.95.36
1 Below detection.
Table 3. Cumulative CO2, N2O, and NH3 emissions corrected by subtracting the emissions of the control during 10 weeks of incubation of the soil cores that received surface application of fine-particle untreated litter (FUL); pelletized untreated litter (PUL); fine-particle low-P treated litter (FLP); and pelletized low-P treated litter (PLP).
N SourceCO2NH3N2O
g C kg−1% 1mg N kg−1% 1mg N kg−1% 1
FUL1.2a 261a21.5ab24ab3.0b3.3b
PUL1.1a56a31.0a35a6.8a7.5a
FLP1.5a38a5.1b5.7b1.7b1.9b
PLP2.1a36a3.7b4.1b0.4b0.5b
LSD0.051.23425283.13.5
1 Percentage of emissions with respect to the total C or N applied per kilogram of soil. 2 Means followed by the same letter are not significantly different according to least square difference (LSD0.05).
Table 4. Summary results of mineralization from repeated measures analysis: Analysis of variance and differences between the combined treatment (Trt) effect per week of soil incubation. Soil NH4-N and NO3-N, are presented with their corresponding average standard error of the mean (SEM) for the four treatment and control combination applied to Norfolk sandy loam soil and p-values.
Source NH4-NNO3-N
dfF-valuep-value 1F-valuep-value
Trt48.70.0028 *19.4<0.0001 *
Week1083.4<0.0001 *22.1<0.0001 *
Trt*Week408.2<0.0001 *1.70.0309 *
Combined Trt effect per week
Time
(Week)
dfSEMp-valueSEMp-value
0414.40.0008 *1.800.9995
1436.5<0.0001 *9.10.9739
2417.5<0.0001 *17.30.6836
3416.90.0001 *31.90.0056 *
4410.30.732633.40.0052 *
5412.10.039339.80.0011 *
647.80.721748.90.0005 *
749.00.475457.3<0.0001 *
8411.20.694663.5<0.0001 *
9411.50.161271.9<0.0001 *
1049.50.667765.2<0.0001 *
1 * Significant at the 0.05 probability level.
Table 5. Regression model parameters for the evolution of NO3-N during the course of 10-week incubation of Norfolk soil amended with four broiler litter materials.
N Sourcea 1K[NO3]0KmaxR 2
mg kg−1mg kg−1 wk−1
FUL1190.004311.315.20.93 3
PUL730.01076.414.30.93 *
FLP870.00437.28.20.95 *
PLP-- 2----5.80.88 *
Control------3.50.64 *
1 NO3-N = a/{1 + (a/[NO3-N]0 − 1) exp(−ak [t − t0])} where a is the asymptotic value of accumulated NO3-N, k is a constant, [NO3-N]0 is the initial value of NO3-N at time (t) zero, and Kmax is the maximal nitrification rate. 2 Data fitted a linear model: NO3-N = 5.84t − 4.39 for PLP; and NO3-N = 3.50t + 10.4 for Control where t is time in weeks.3 Probability (p = 0.05) that the correlation of determination (R2) is different from 0.
Table 6. Weekly soil inorganic N available in percentage of total N added with four poultry litter materials applied on the surface of a Norfolk sandy loam soil. Data are the mean of three samples.
Time
(Week)
FUL 1PULFLPPLP
015a 212a1c2d
155a61a38b21c
232b53a18bc9c
368a60a35b19b
456a58a29b12c
572a58ab46ab27b
678a70a40b21c
787a84a47b38b
887a86a60a49a
9127a87ab80ab57b
1099a78a72a63a
Mean71644229
Standard deviation31212320
1 FUL = fine untreated litter; PUL = pelletized untreated litter; FLP = fine low-P treated litter; PLP = pelletized low-P treated litter. 2 For each week, the means with different letters are significantly different at the 0.05 probability level of the least square differences test (LSD).

