Article

Use of CaO Loaded Mesoporous Alumina for Defluoridation of Potable Groundwater Containing Elevated Calcium Levels

Department of Civil Engineering, University of Moratuwa, Moratuwa 10400, Sri Lanka
*
Author to whom correspondence should be addressed.
Environments 2019, 6(6), 66; https://doi.org/10.3390/environments6060066
Submission received: 6 April 2019 / Revised: 24 May 2019 / Accepted: 4 June 2019 / Published: 9 June 2019

Abstract

:
Defluoridation in the presence of high calcium levels in potable groundwater is paramount, as the consumption of groundwater enriched with fluoride, and calcium has been implicated in causing chronic kidney disease of unknown etiology (CKDu) in Sri Lanka. CaO loaded mesoporous alumina (COMA) offers a great potential for defluoridation of potable water, but the effectiveness of COMA in the presence of calcium has not been investigated. This study, therefore, focuses on the investigation of the suitability of COMA for the defluoridation of potable water with high calcium levels. Mesoporous alumina was successfully functionalized with CaO to synthesize nano-level COMA with an optimum dosage for defluoridation being 2 g L−1. The amount of fluoride adsorbed increased (2.4–19.5 mg g−1) with the increase of the initial fluoride concentration (5–40 mg L−1), and the residual fluoride levels (0.8–1.47 mg L−1) were within the range specified by the WHO for drinking water. The amount of fluoride adsorbed by COMA varied between 6.50 and 7.97 mg g−1 with initial calcium levels between 0 and 1500 mg L−1, indicating that defluoridation was effective in the presence of high calcium levels. The fluoride adsorption was best fitted with the Langmuir model with a maximum monolayer capacity of COMA being 17.83 mg g−1, and adsorption kinetics fitted with the pseudo-2nd order model indicating strong covalent bonding by way of chemisorption. Thus, COMA can be effectively utilized as an adsorbent material in defluoridation efforts in areas prevalent with CKDu in the presence of high fluoride (15 mg L−1) and calcium (1500 mg L−1) levels.

1. Introduction

Fluoride in groundwater often occurs naturally by the dissolution of minerals in the soil. Elevated fluoride levels in groundwater have been reported in many countries (in India, 48 mg L−1 [1]; in Mexico >6 mg L−1 [2]; in China >6 mg L−1 [3]; in Sri Lanka >13 mg L−1 [4]). Prolonged consumption of water with fluoride levels exceeding 1.5 mg L−1 has been reported to have increased the risk of skeletal fluorosis, leading to permanent deformation of bones and joints, and dental fluorosis [5]. Moreover, high levels of fluoride in potable water have been implicated to be a causal factor for nephrotoxic health hazards [4,6,7].
Dissociation and dissolution of fluoride and calcium-rich minerals from soils may cause elevated levels of fluoride and calcium in groundwater [8]. Fluoride in groundwater combined with hardness has been implicated in causing a synergistic effect on chronic kidney disease of unknown etiology (CKDu). In general, hardness is attributed to a calcium and magnesium ratio of 4:1. Fluoride levels of groundwater in areas prevalent with CKDu in Sri Lanka are in the range of 0.7 to 13.7 mg L−1 [4] along with average and maximum hardness levels of 293.4 to 1733.3 mg L−1 as CaCO3, respectively [9].
Defluoridation using adsorbents has been popular as an effective technique worldwide to treat drinking water [2,10]. Adsorptive materials of non-selective removal are often used in defluoridation efforts. With high concentrations of calcium, the defluoridation efficiency sharply drops, perhaps because of a higher affinity for adsorption of calcium over fluoride; hence, new materials that have a selective adsorption potential preferably for fluoride need to be investigated. The development of such materials would, therefore, be of utmost importance to lessen the incidences of CKDu.
Activated alumina with moderate affinity and selectivity for fluoride has been used as an adsorbent for defluoridation of groundwater [11]. Further, nano γ-alumina [12], copper oxide coated alumina [13], iron and aluminum binary oxides [14], sulfate-doped iron/aluminum oxides [15], aluminum modified iron oxide [16], mesoporous alumina, and calcium oxide loaded mesoporous alumina [17,18] have been investigated for effective defluoridation. Even though alumina-based adsorbents have been investigated for defluoridation, to our knowledge, defluoridation in the presence of calcium by such materials has not been reported. Therefore, the effect of co-existing calcium ion levels on the defluoridation potential by alumina-based adsorbents needs to be examined. Thus, in this study, we investigated the defluoridation potential of calcium oxide loaded mesoporous alumina (COMA) in the presence of calcium ions in potable water. Mesoporous alumina was selected to synthesize COMA because of its excellent inherent properties, such as large surface area, narrow pore size distribution, and highly uniform channels [19,20,21]. These attributes increase the calcium loading potential, hence increasing the fluoride adsorption capacity. COMA was chosen as it gives an enhanced defluoridation efficiency compared to other alumina-based adsorbents because of the retention of positively charged calcium ions on the surface of the mesoporous alumina, resulting in an enhanced adsorption of negatively charged fluoride. Therefore, the objectives of this work were to: (i) Study the potential efficiency of COMA as an adsorbent to remove fluoride alone and fluoride in the presence of calcium in aqueous solution; (ii) investigate the fluoride adsorption efficiency of COMA with varying adsorbent dosage, initial fluoride, and calcium levels, solution pH, and contact time using batch experiments; and (iii) understand the fluoride adsorption behavior of COMA using the kinetic and equilibrium isotherms of adsorption.

2. Materials and Methods

2.1. Synthesis of COMA

Mesoporous alumina was synthesized using aluminum nitrate, stearic acid, and triethanolamine based on a method developed by Dayananda and co-workers (2014) [17]. COMA was then synthesized using calcium nitrate and a wet impregnation technique with the CaO loading percentage being 20 wt.% [17].

2.2. Characterization of COMA

Morphology and elemental composition of COMA were analyzed before and after the adsorption experiments using environmental scanning electron microscopy (ESEM-Carl Zeiss, EVO 18, Secondary Electron Microscope, Jena, Germany) coupled with energy-dispersive x-ray spectroscopy (EDX Z1 analyzer, New York, USA). The phase identification of COMA was performed by x-ray powder diffraction (XRD-D8, ECO, Advance Bruker Diffractometer with filtered Cu Kα radiation, Karlsruhe, Germany). Fourier transform-infrared spectroscopy (FT–IR, ALPHA Bruker, Karlsruhe, Germany) was performed in the adsorption mode at ambient temperature in the spectral range of 500 to 4000 cm−1 to identify the functional groups of COMA.

2.3. Adsorption Studies on Defluoridation

2.3.1. Determination of Optimum COMA Dosage

The optimum COMA dosage for defluoridation was determined by varying the COMA dosage from 0.04 to 8.0 g L−1. A synthetic solution of fluoride was prepared by adding sodium fluoride to deionized water in a 1-L polyethylene bottle. The initial fluoride level of the solution was 15 mg L−1, and the volume was 250 mL (solution pH: 6.5 and temperature: 28 °C). The initial fluoride and calcium levels were decided based on seasonal variations encountered in the dry season of CKDu prevalent areas of Sri Lanka. Twenty groundwater samples were collected during the dry season (June to August), and minimum and maximum fluoride (1.1–14.2 mg L−1) levels were determined. The maximum fluoride level of drinking water in CKDu prevalent areas has been reported as 13.7 mg L−1 in past studies [4,7,9]. The ranges of pH and temperature were decided based on the preliminary studies conducted in CKDu prevalent areas. The contact time for defluoridation was two hours shaking at a speed of 150 rpm. After two hours, the solution was filtered (WhatmanTM 1003–110 Grade 3, 6 µm, Pittsburgh, USA) and the filtrate was analyzed for the remaining fluoride level.

2.3.2. Determination of the Effect of the Initial Fluoride Level

Batch studies were conducted using 2.0 g L−1 while varying the initial level of fluoride in the range of 5 to 40 mg L−1. The volume of the solution was 250 mL (temperature: 28 °C, solution pH: 6.5) The contact time for defluoridation was two hours shaking at a speed of 150 rpm. After two hours, the solution was filtered (WhatmanTM 1003–110 Grade 3, 6 µm) and the filtrate was analyzed for the remaining fluoride level.

2.3.3. Determination of the Effect of Contact Time

The effect of contact time (0–120 minutes) on defluoridation by COMA was examined with the initial fluoride level in the range of 5 to 40 mg L−1. The volume of the solution was 250 mL with a COMA dosage of 2.0 g L−1 (temperature: 28 °C, solution pH: 6.5, and shaking speed: 150 rpm). For different contact times, the solution was filtered (WhatmanTM 1003–110 Grade 3, 6 µm) and the filtrate was analyzed for the remaining fluoride level.

2.3.4. Determination of Optimum pH

The effect of solution pH for defluoridation was determined by adjusting the pH (3–12) using 0.1 M HCl or 0.1 M NaOH. The initial fluoride level was 15 mg L−1, and the volume of the solution was 250 mL (COMA dosage: 2.0 g L−1, temperature: 28 °C, contact time: Two hours, and the shaking speed: 150 rpm). After two hours, for different solution pH values, the solution was filtered (WhatmanTM 1003–110 Grade 3, 6 µm) and the filtrate was analyzed for the remaining fluoride level.

2.3.5. Determination of the Effect of the Initial Calcium Level

The effectiveness of COMA for defluoridation in the presence of fluoride (15 mg L−1) was studied by varying the calcium levels in the solution (100–1500 mg L−1). Calcium levels were decided based on the reported values (120.0–1921.0 mg L−1 of hardness as CaCO3) [4,6,7,9] and experimental values (140.0–900.0 mg L−1 as CaCO3) during the wet (October to November) and dry (June to August) seasons in the CKDu prevalent areas of Sri Lanka. The volume of the solution was 250 mL (COMA dosage: 2.0 g L−1, temperature: 28 °C, contact time: Two hours, solution pH: 6.5, and the shaking speed: 150 rpm). After two hours, for different calcium levels, the solution was filtered (WhatmanTM 1003–110 Grade 3, 6 µm) and the filtrate was analyzed for the remaining fluoride level.

2.4. Fluoride Analysis

Fluoride levels in the samples were analyzed using ion chromatography (Metrohm, 930 Compact IC Flex, Herisau, Switzerland) with a mobile phase of 3.2 mmol L−1 Na2CO3 + 1 mmol L−1 NaHCO3 and a flow rate of 0.7 mL−1 min −1. The amount of fluoride removed per unit mass of COMA (Qe in mg g−1) was calculated using Equation (1):
Q e = ( C o C e ) × V W
where Co and Ce are the initial and equilibrium concentrations of fluoride in the solution (mg L−1), respectively, V is the volume of solution (L), and W is the mass of COMA (g).

2.5. Adsorption Isotherm and Kinetic Models

The data were fitted to Langmuir [22], Freundlich [23], Brunauer–Emmett–Teller (BET) [24], Dubinin–Radushkevich [25], and Temkin [26] isotherm models to study the adsorption behavior of COMA in defluoridation. The kinetics of fluoride adsorption were analyzed using Lagergren’s pseudo-first-order kinetic model [27] and pseudo-second-order kinetic model [28]. These two models identify the kinetics of fluoride adsorption processes to be fitted either to chemisorption or physisorption. All equations and theories related to adsorption isotherm and kinetics models are provided in the Supplementary Materials.
The average particle size was determined using the Scherrer formula (Equation (2)):
D = n λ β cos θ
where D is the particle size (Å), n is a constant (if particles are assumed to be spherical, n = 0.9), λ is the wavelength of the X-ray radiation (Å), β is the line width (rad), and θ is the angle diffraction (degrees).

3. Results and Discussion

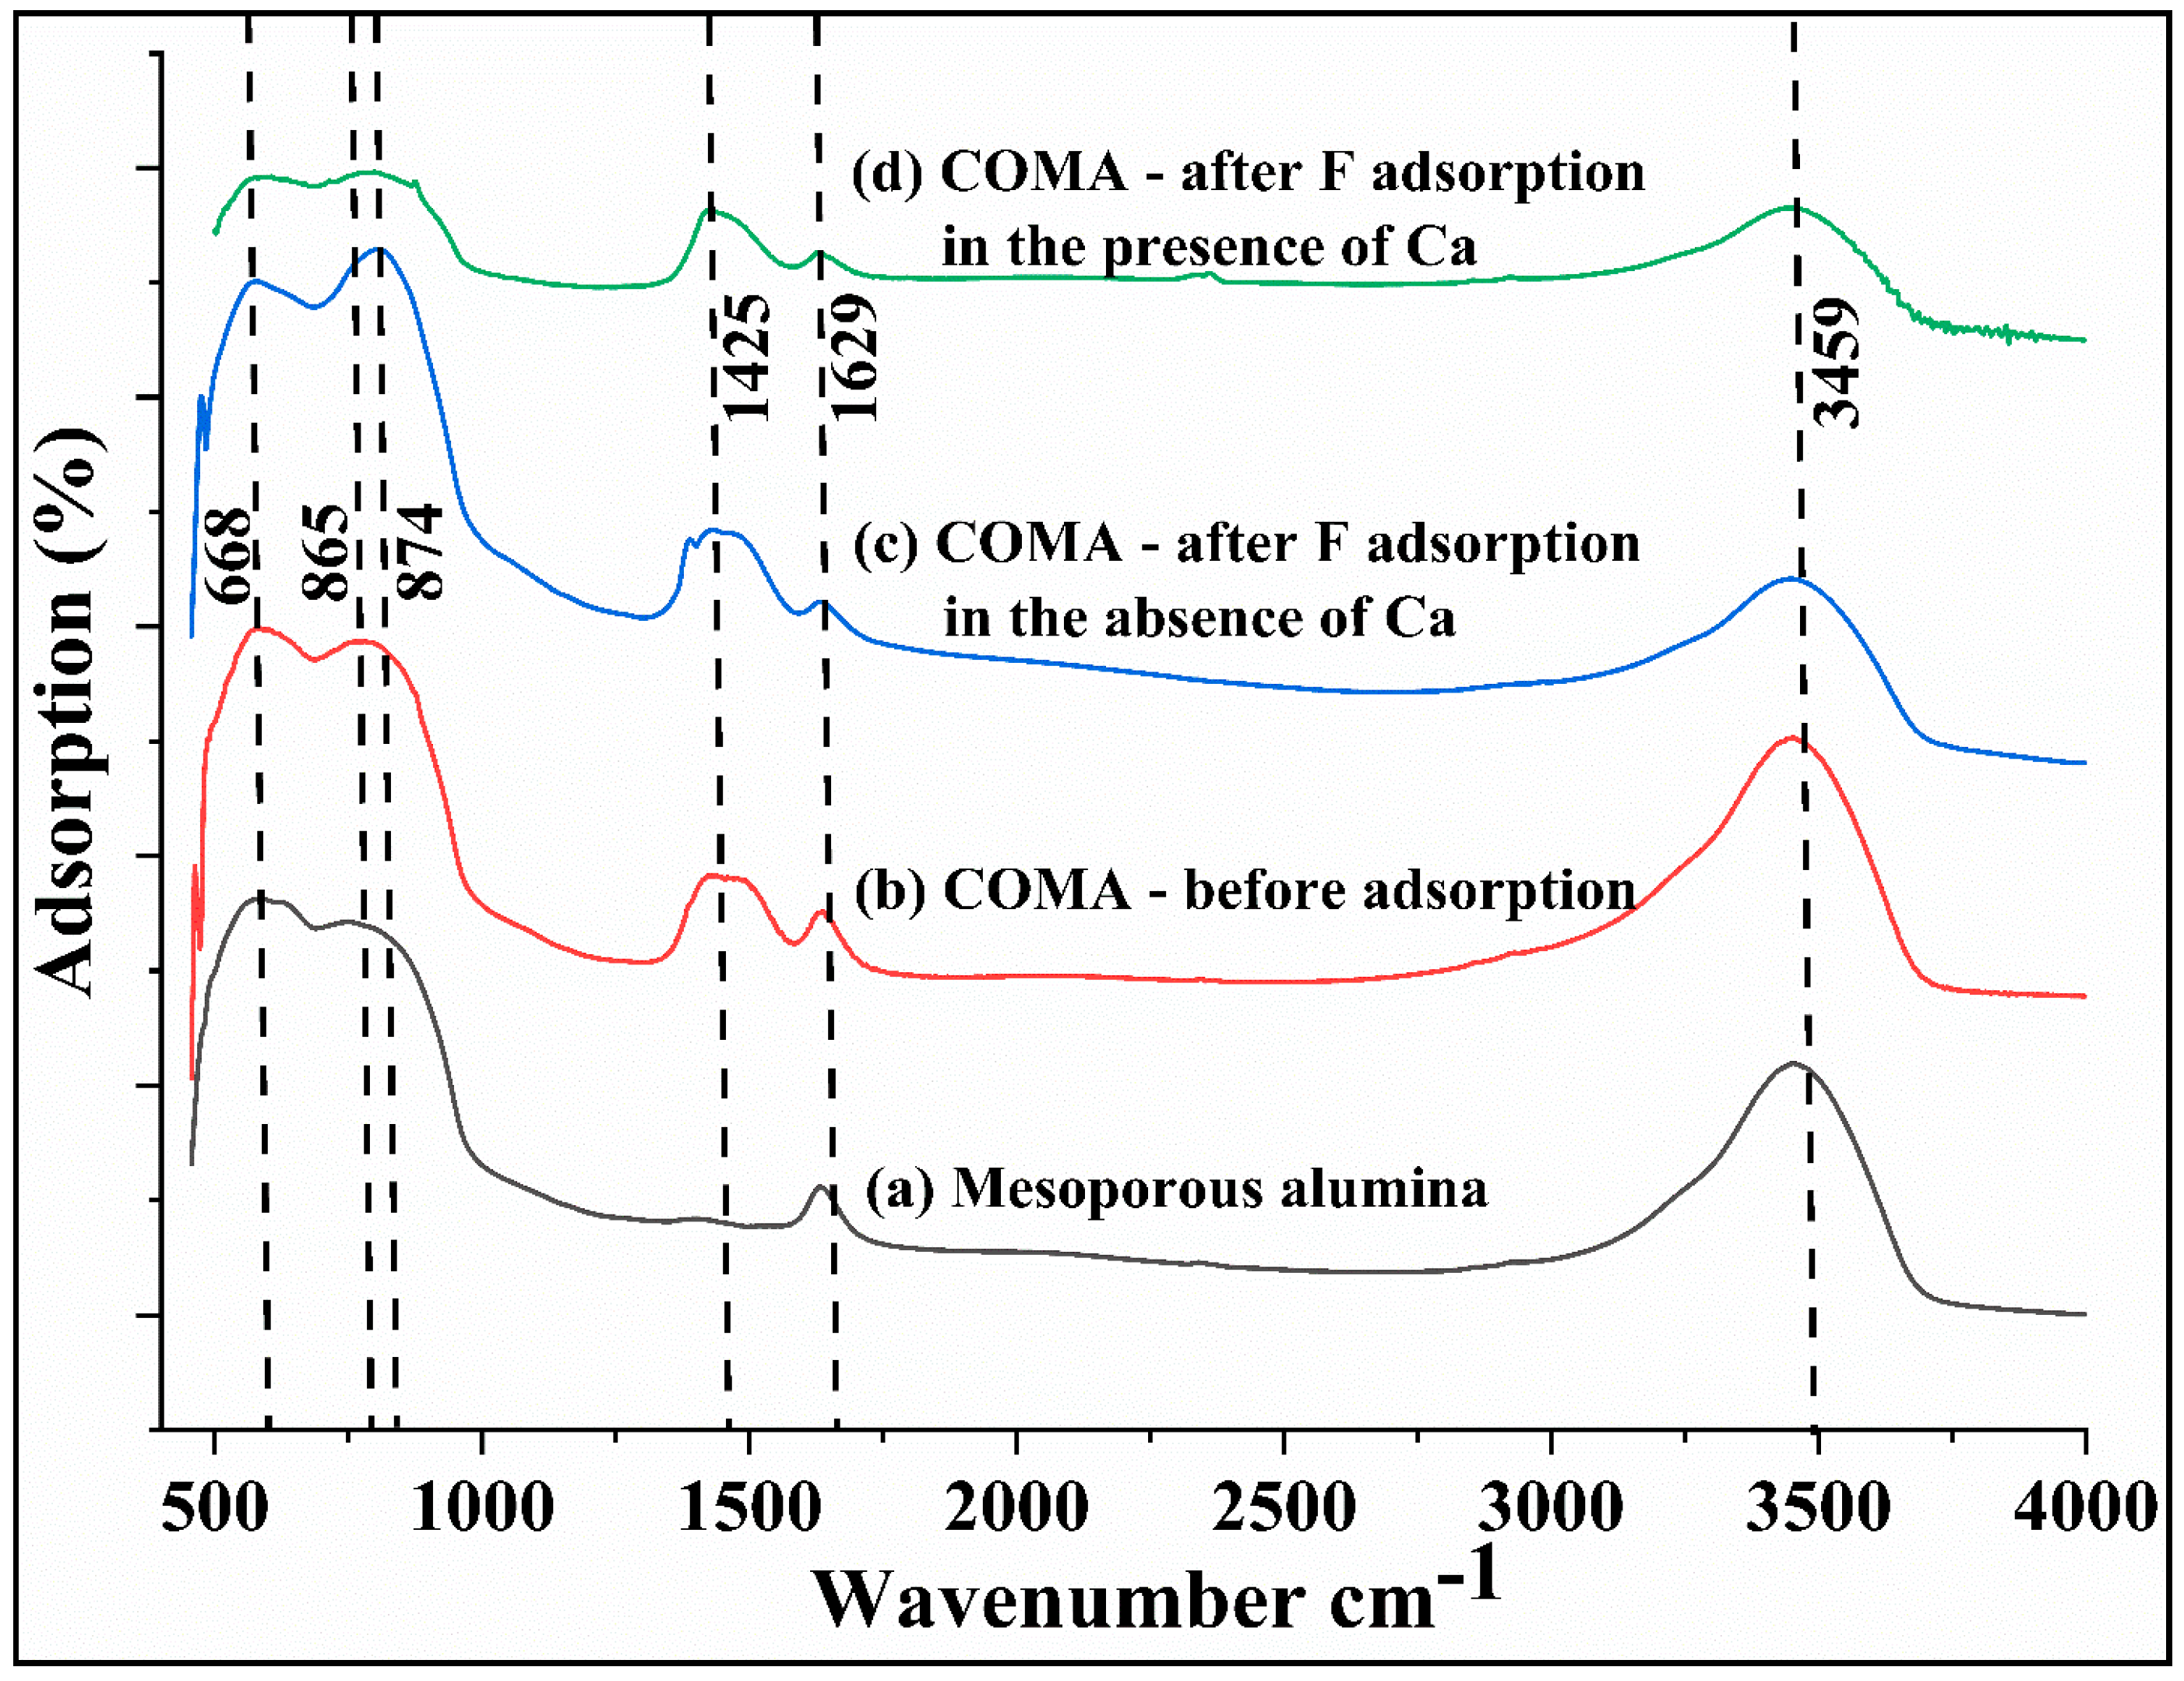
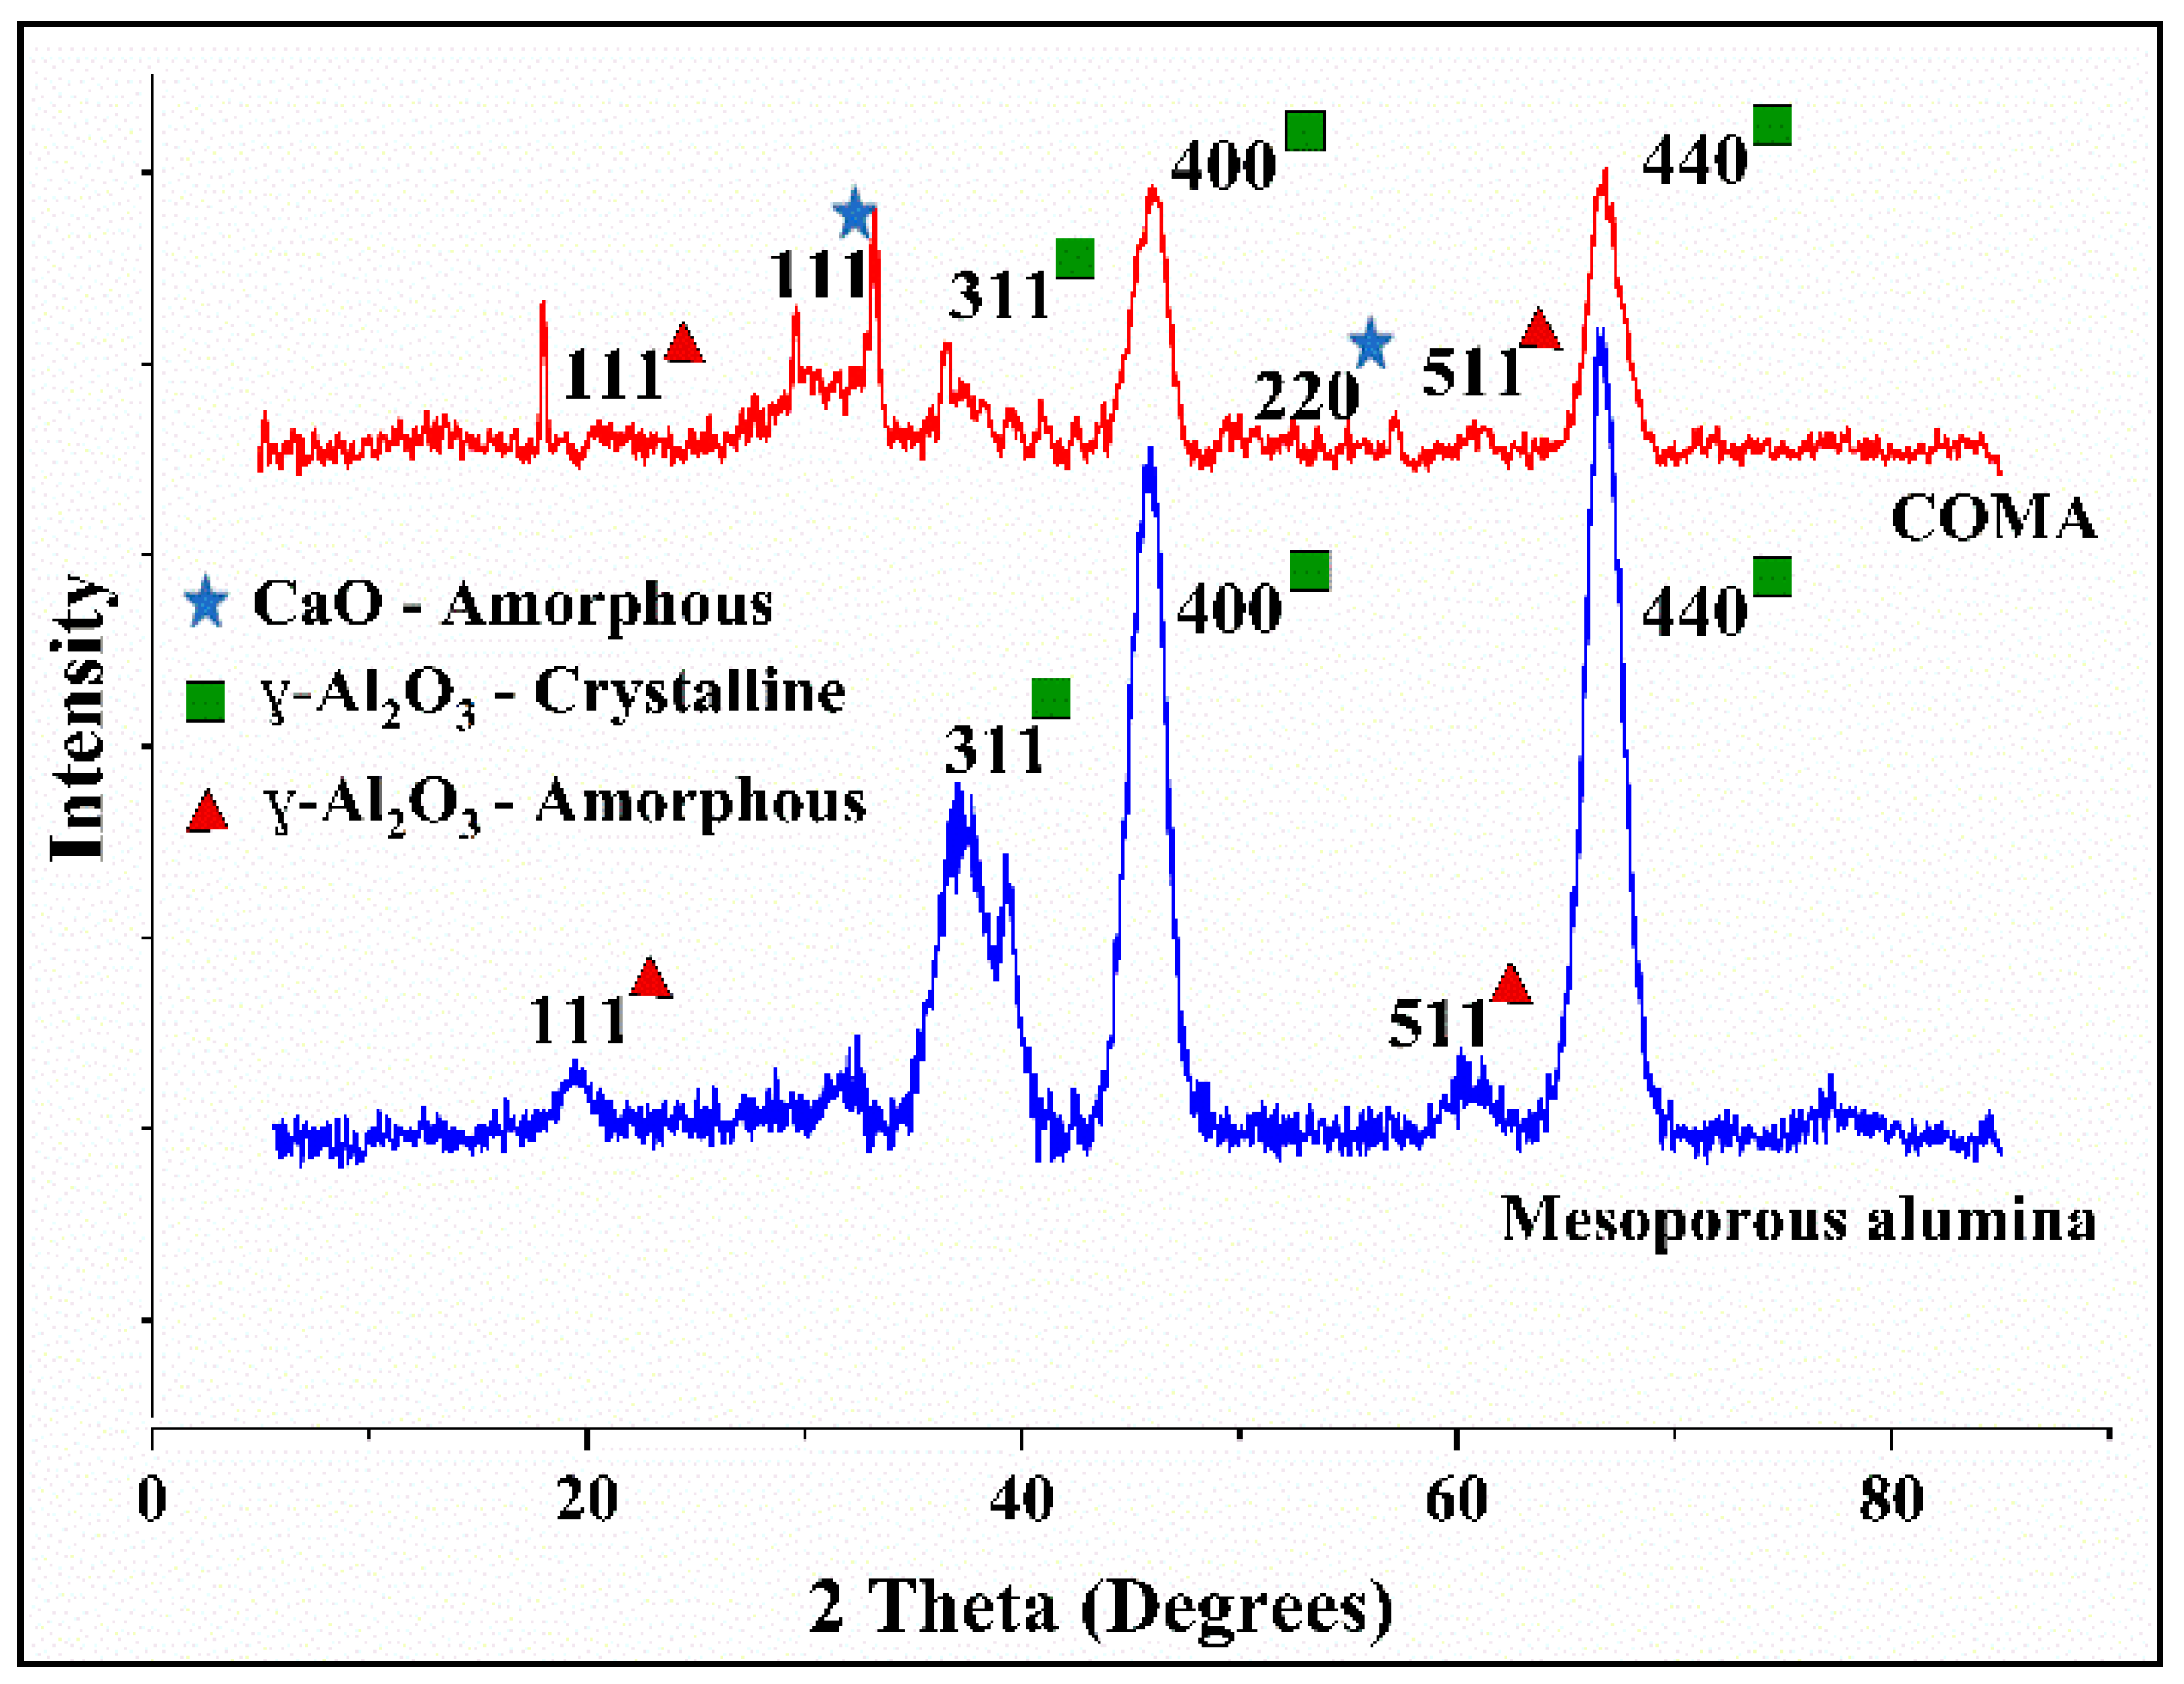
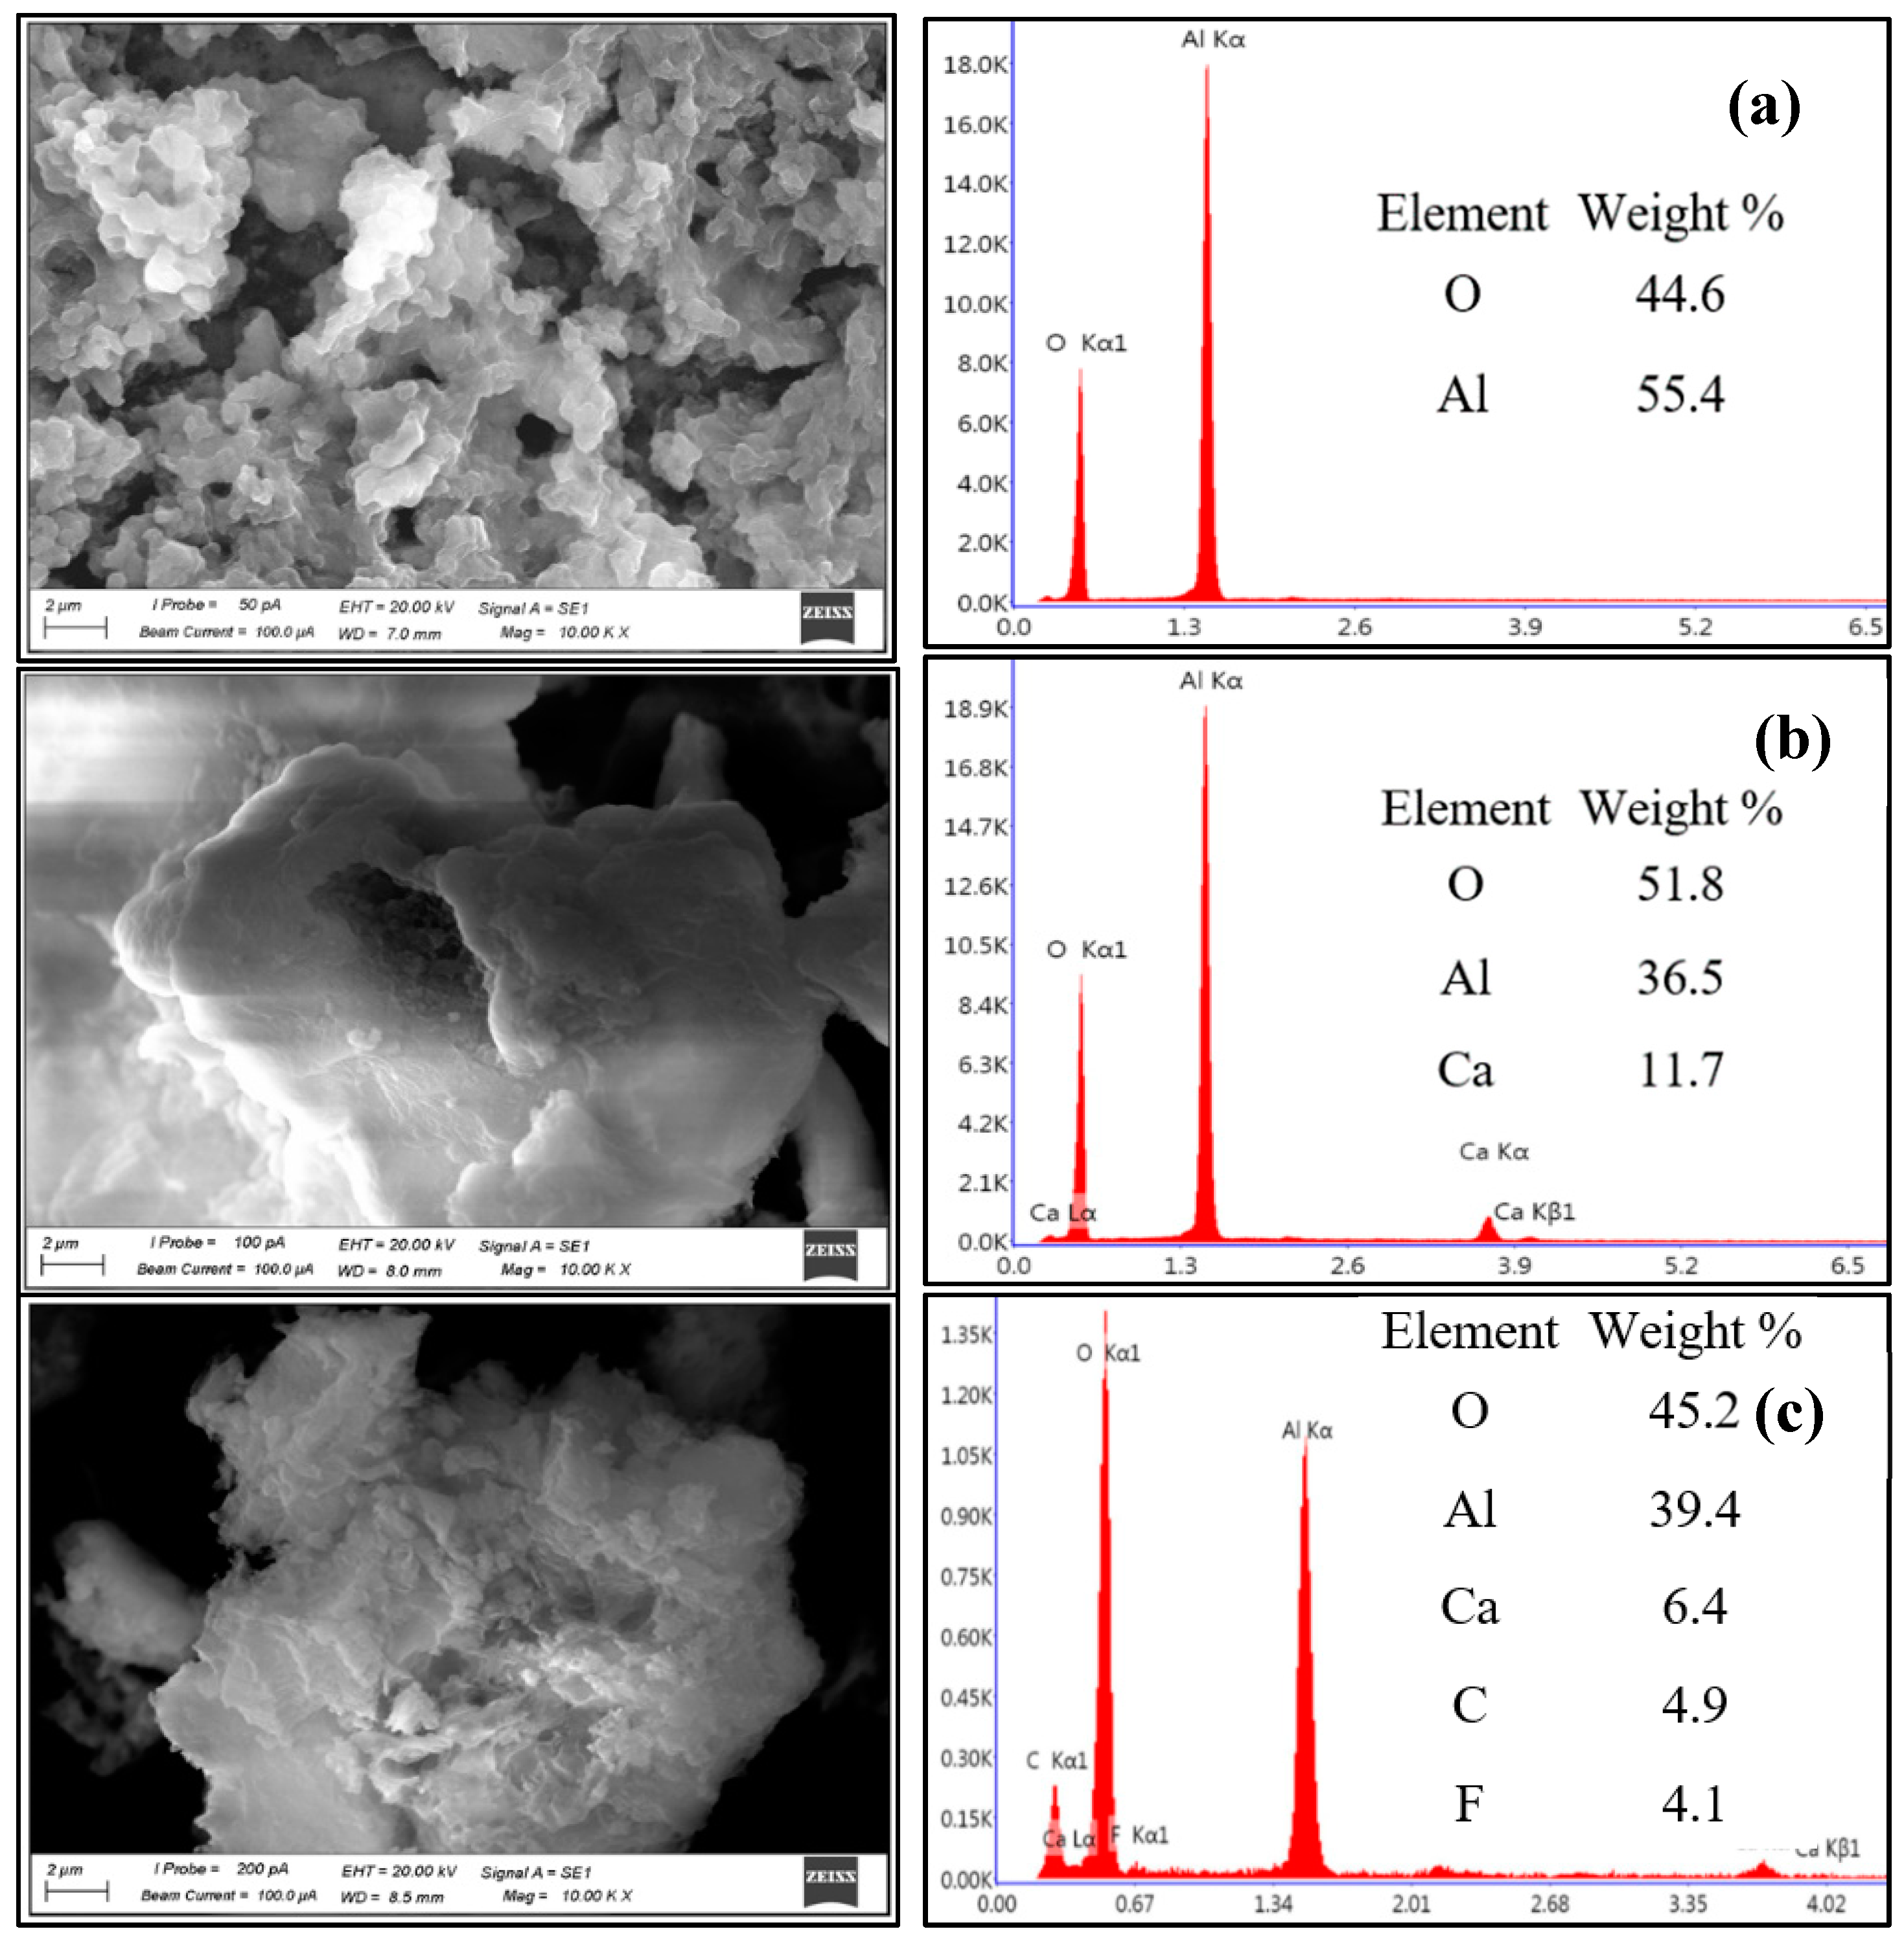
3.1. Characterization of the Adsorbent

The XRD pattern shows the diffraction peaks, which characterize the crystalline structure of COMA (Figure 1). The XRD peaks of mesoporous alumina exhibit typical 2θ reflections at 19.4° (111), 33.7° (311), 45.7° (400), 60.6° (511), and 66.7° (440), which are similar to the work done by others [17,29]. Mesoporous alumina showed three broad peaks at 311, 400, and 440 reflections attributed to crystalline γ–Al2O3 [30]. The peak intensities corresponding to the mesoporous alumina phase were found to decrease in the XRD pattern developed for COMA probably because of CaO loading. The broad peaks at 32.2° (111) and 53.8° (220) were ascribed to the amorphous structure of CaO in COMA [31,32]. The particle size of COMA was found to vary between 15.3 and 68.4 nm, confirming the nano-scale particle formation. The crystal phase of mesoporous alumina was found, as aluminum oxide (γ–Al2O3) depicts the highest purity of alumina, and it is amorphous in nature. Calcium aluminum oxide (5CaO. 3Al2O3), aluminum oxide (γ-Al2O3), and calcium aluminum oxide (Ca(AlO2)2) were the other crystal phases found in COMA. The peaks of calcium aluminum complexes and other prominent aluminum oxides justified the incorporation of calcium more effectively on the surface of mesoporous alumina. The formation of calcium and aluminum oxides on the surface of mesoporous alumina was, therefore, confirmed by the XRD.
The ESEM was used to observe the morphology of mesoporous alumina (Figure 2a), COMA before the adsorption of fluoride (Figure 2b), and COMA after the adsorption of fluoride (Figure 2c). Before CaO was loaded, the surface morphology of the mesoporous alumina showed a high void ratio with a multitude of pores and a rough texture with a honeycomb-like structure (Figure 2a). The porous surface, therefore, endows COMA with large surface areas, and thus, mesoporous alumina could be loaded with a high amount of calcium. The EDX analysis of the adsorbent surface provides the elemental composition of the adsorbent. The spectrum of the EDX confirmed the presence of aluminum (55.4%) and oxygen (44.6%) on the surface of mesoporous alumina showing 100% purity (Figure 2a). The ESEM image of COMA before the adsorption of fluoride depicts the presence of an agglomerated mushroom-like structure and surface homogeneity as observed in Figure 2b. The EDX analysis (Figure 2b) showed that the surface was composed of aluminum (36.5%), calcium (11.7%), and oxygen (51.8%) with no other impurities. The narrow-band diffraction peaks suggest a crystalline structure without any impurities [33]. The EDX spectrum of COMA before the adsorption indicates the fact that the loading of calcium on the surface of mesoporous alumina was successful. ESEM analysis of COMA after adsorption of fluoride showed a flake-like structure (Figure 2c), which could be attributed to the formation of aluminum and calcium salts with fluoride [34]. EDX analysis confirmed the presence of aluminum (39.4%), oxygen (45,2%), calcium (6.4%), and the adsorbed fluoride (4.1%) on the surface of the COMA (Figure 2c). A peak of carbon was observed, which might be due to the adsorption of atmospheric CO2 onto the surface of COMA.
The FT-IR analysis showed the vibrational state of surface complexes on COMA (Figure 3). The results showed wavenumbers corresponding to the bond patterns of CaO, Al2O3, and calcined COMA. The adsorption peaks at ~668 cm−1 were attributed to vibrations of Al–O bonds and ~865 cm–1 symmetric bending of Al–O–H [32,33]. Such peaks were not changed drastically with the adsorption experiments. The peaks appeared at ~874 cm−1, and at ~1425 cm−1 (Figure 3b–d) can be assigned to the vibration of Ca–O species [32]. The bands due to O–H stretching vibration at ~1629 cm–1 [34] and O-H bending vibration at ~3459 cm−1 [29] were observed in all spectra. The O–H stretching and bending vibrations depicted surface adsorbed water, which was ascribed to the formation of aluminum oxide hydroxide (AlOOH) and calcium hydroxide (CaOH2) on the surface of COMA [35]. With the synthesis of COMA, peaks for O–H stretching vibration at ~1629 cm–1, and O–H bending vibration at ~3459 cm−1 reduced when compared to mesoporous alumina. After the adsorption of fluoride, the functional groups on the surface of COMA were changed with observations of the original peaks being increased, decreased, shifted, and disappeared, and new peaks appearing. The peak intensities were observed to be decreased at 874 cm−1, 1629 cm−1, and 3459 cm−1 after the adsorption of fluoride alone and in the presence of calcium.

3.2. Adsorption Studies for Defluoridation

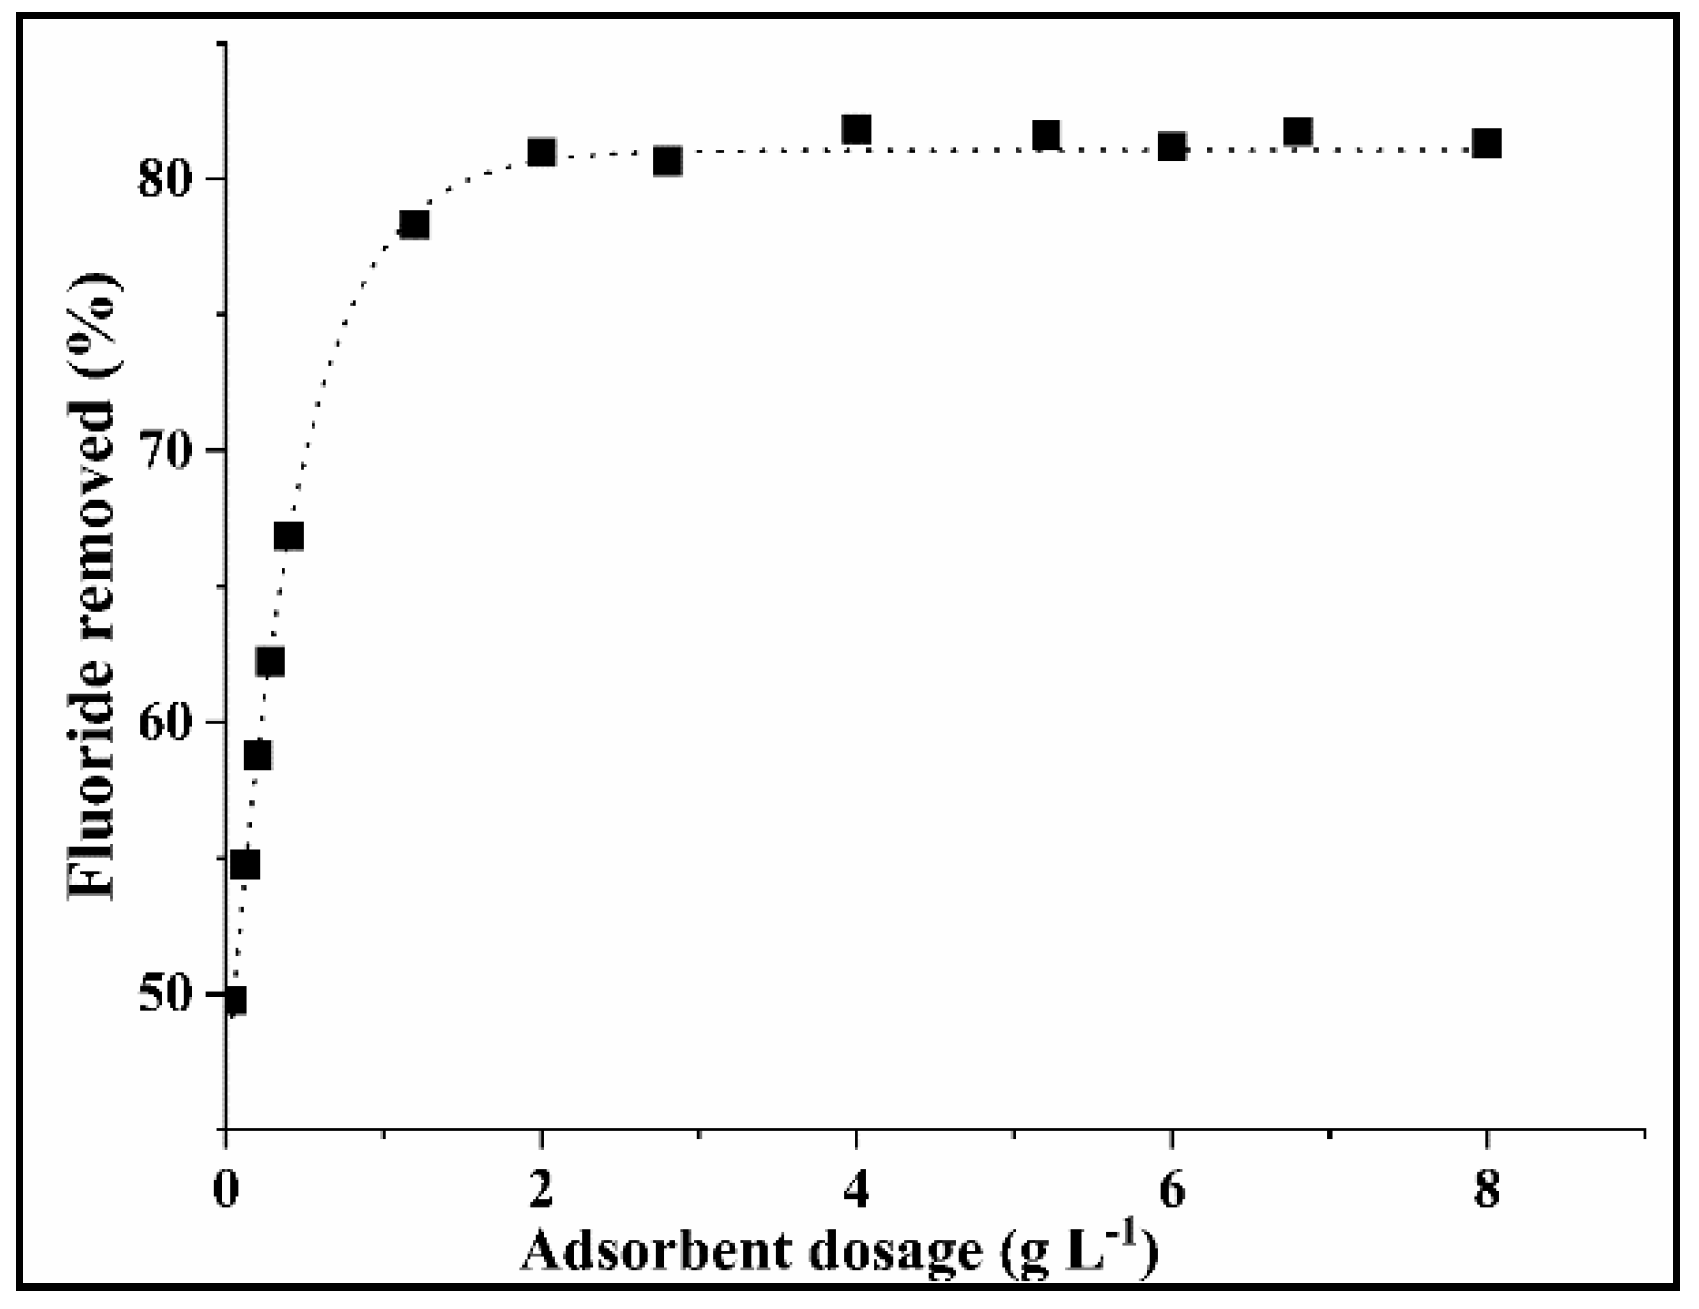
3.2.1. Effect of the COMA Dosage

The percentage of fluoride adsorbed for different COMA dosages is depicted in Figure 4. The experimental data showed that the adsorption of fluoride increased gradually with the increase of the dosage. The increased fluoride removal was attributed to the increase in several adsorption sites at a higher dosage and the increased adsorption site/fluoride ratio [32]. The percentage of fluoride adsorbed sharply increased until the COMA dosage was increased up to about 2 g L−1 and remained almost constant, as COMA particles consequently increased particle–particle interactions, particle agglomeration, and the unsaturated partial filling of adsorption sites [29,32,36]. When the COMA dosage was increased further, no discernible adsorption was observed. Such an observation is attributed to a limited number of fluorides ions in comparison to the adsorption sites of COMA available for the reaction, and a finite number of active adsorption sites per unit weight of adsorbent [37]. The optimum COMA dosage was, therefore, selected as 2.0 g L−1. The optimum dosage of COMA was sufficient to bring the residual fluoride levels of the treated water to levels less than that of the permissible level (1.5 mg L−1) stipulated by the WHO drinking water guideline.

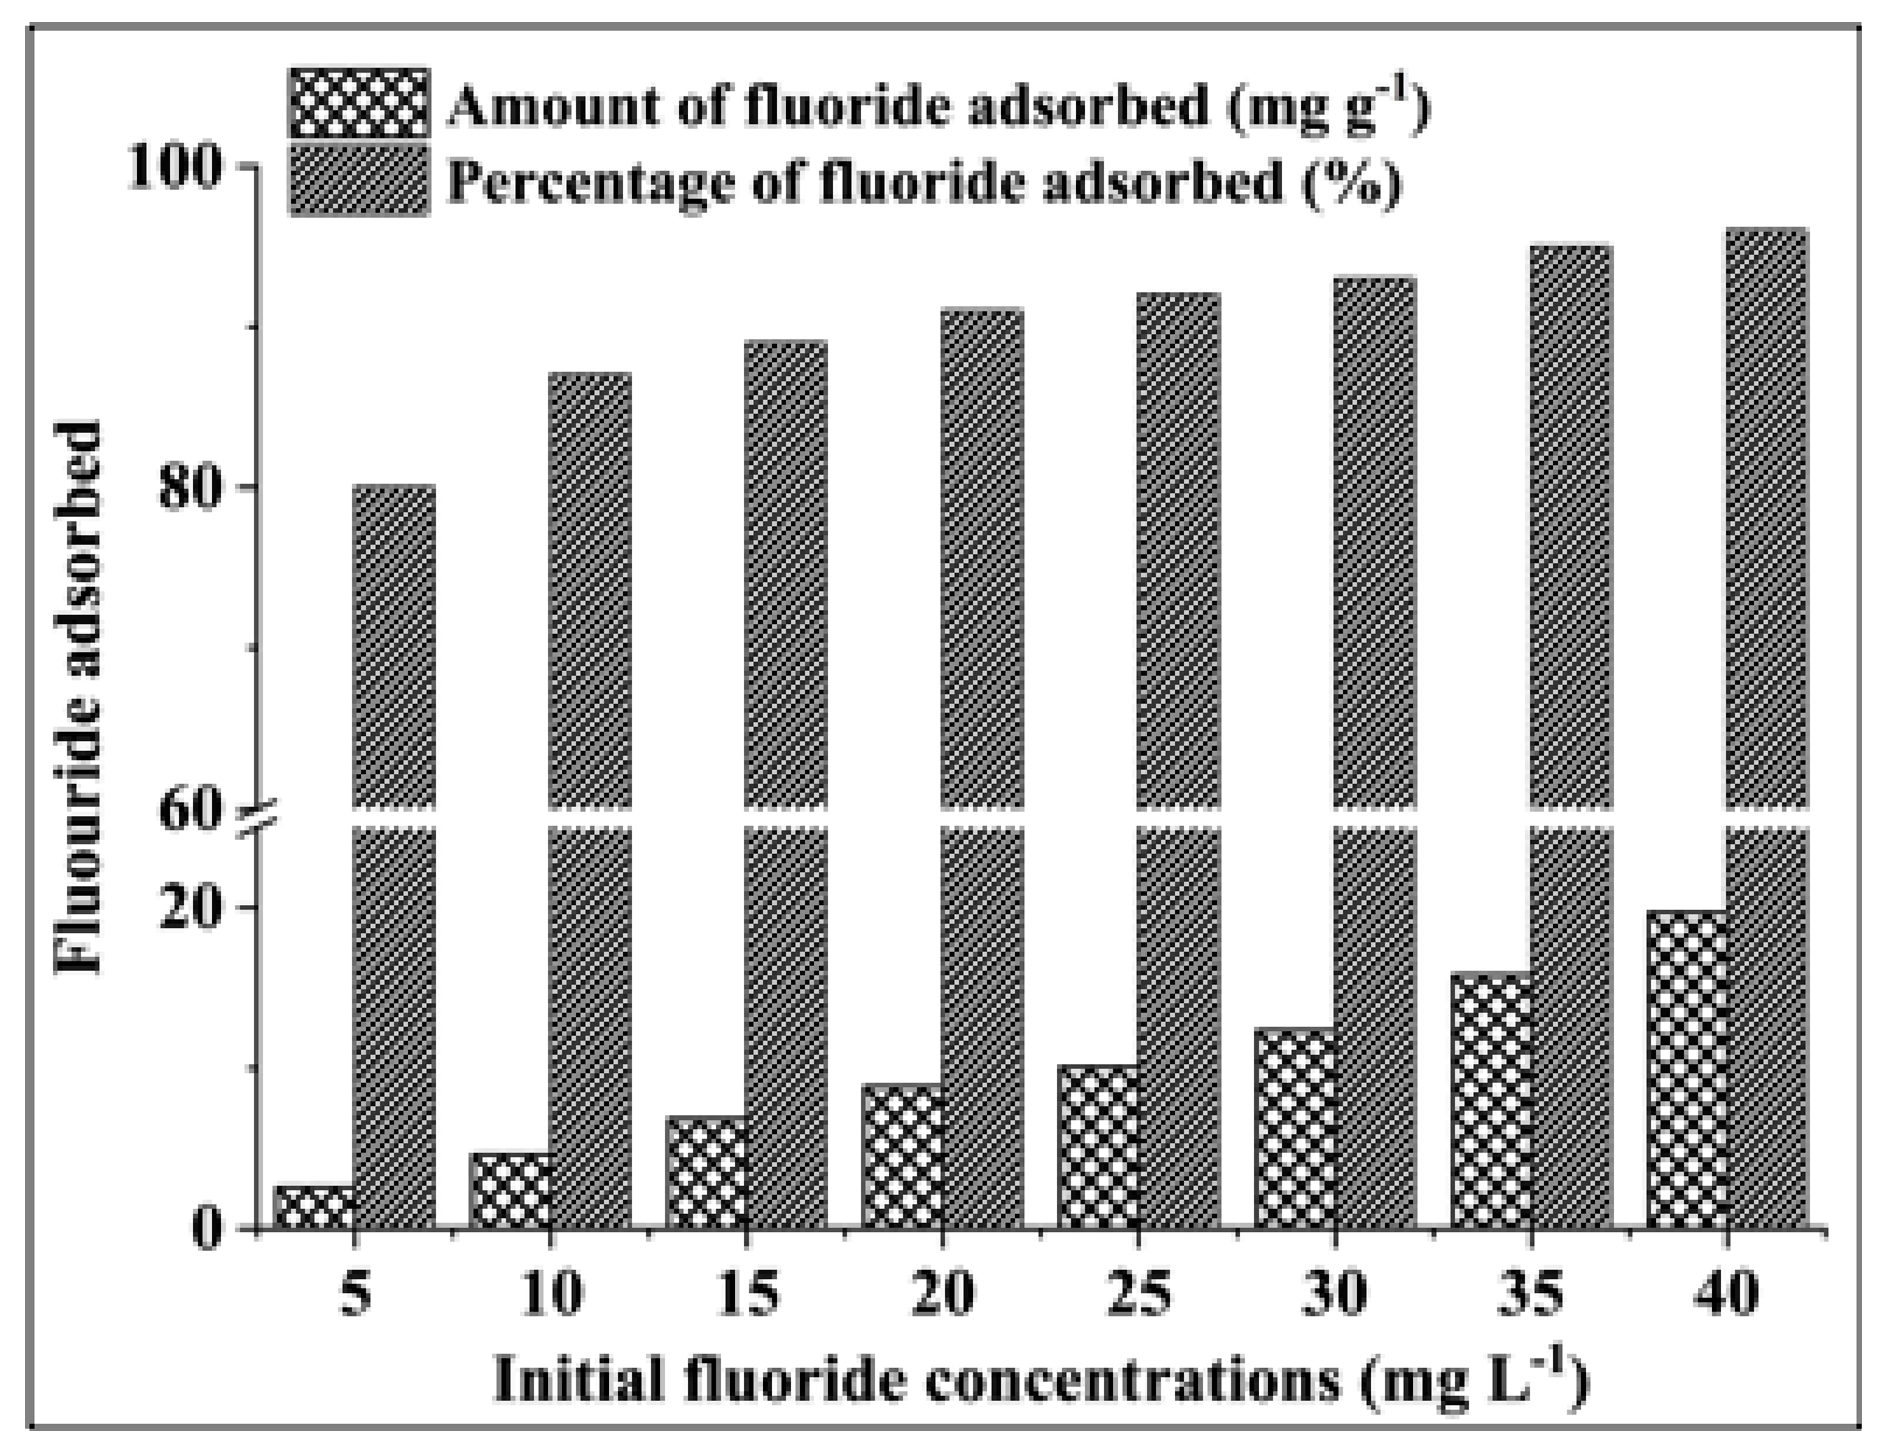
3.2.2. Effect of Initial Fluoride Concentration

The effect of the initial fluoride concentration on the adsorption of fluoride by COMA was studied with a dosage of 2.0 g L−1. The COMA showed different fluoride adsorption capacities for a range of 5 to 40 mg L−1 of fluoride concentrations (Figure 5). The initial fluoride levels in the solution played a prominent role as a driving force to effect the mass transfer between the COMA surface and the aqueous solution [36,37], and the increased fluoride adsorption by COMA was attributed to the presence of high levels of fluoride in the aqueous solution [32]. Therefore, the amount of fluoride adsorbed increased (2.4–19.5 mg g−1) with the increase of the initial fluoride concentration (5–40 mg L−1) (Figure 5). The amount of fluoride adsorbed remained unchanged with any further increase of the fluoride level beyond 40 mg L−1 because the dosage of 2.0 g L−1 reached its saturation point. The total removal of fluoride was ascribed to the formation of aluminum fluoride (AlF3) complexes [38] and calcium fluorite precipitate [39] other than fluoride ion adsorption. All the combinations manifested that the residual levels of fluoride (0.8–1.47 mg L−1) were within the permissible level stipulated by the WHO for drinking water (0.6–1.5 mg L−1).

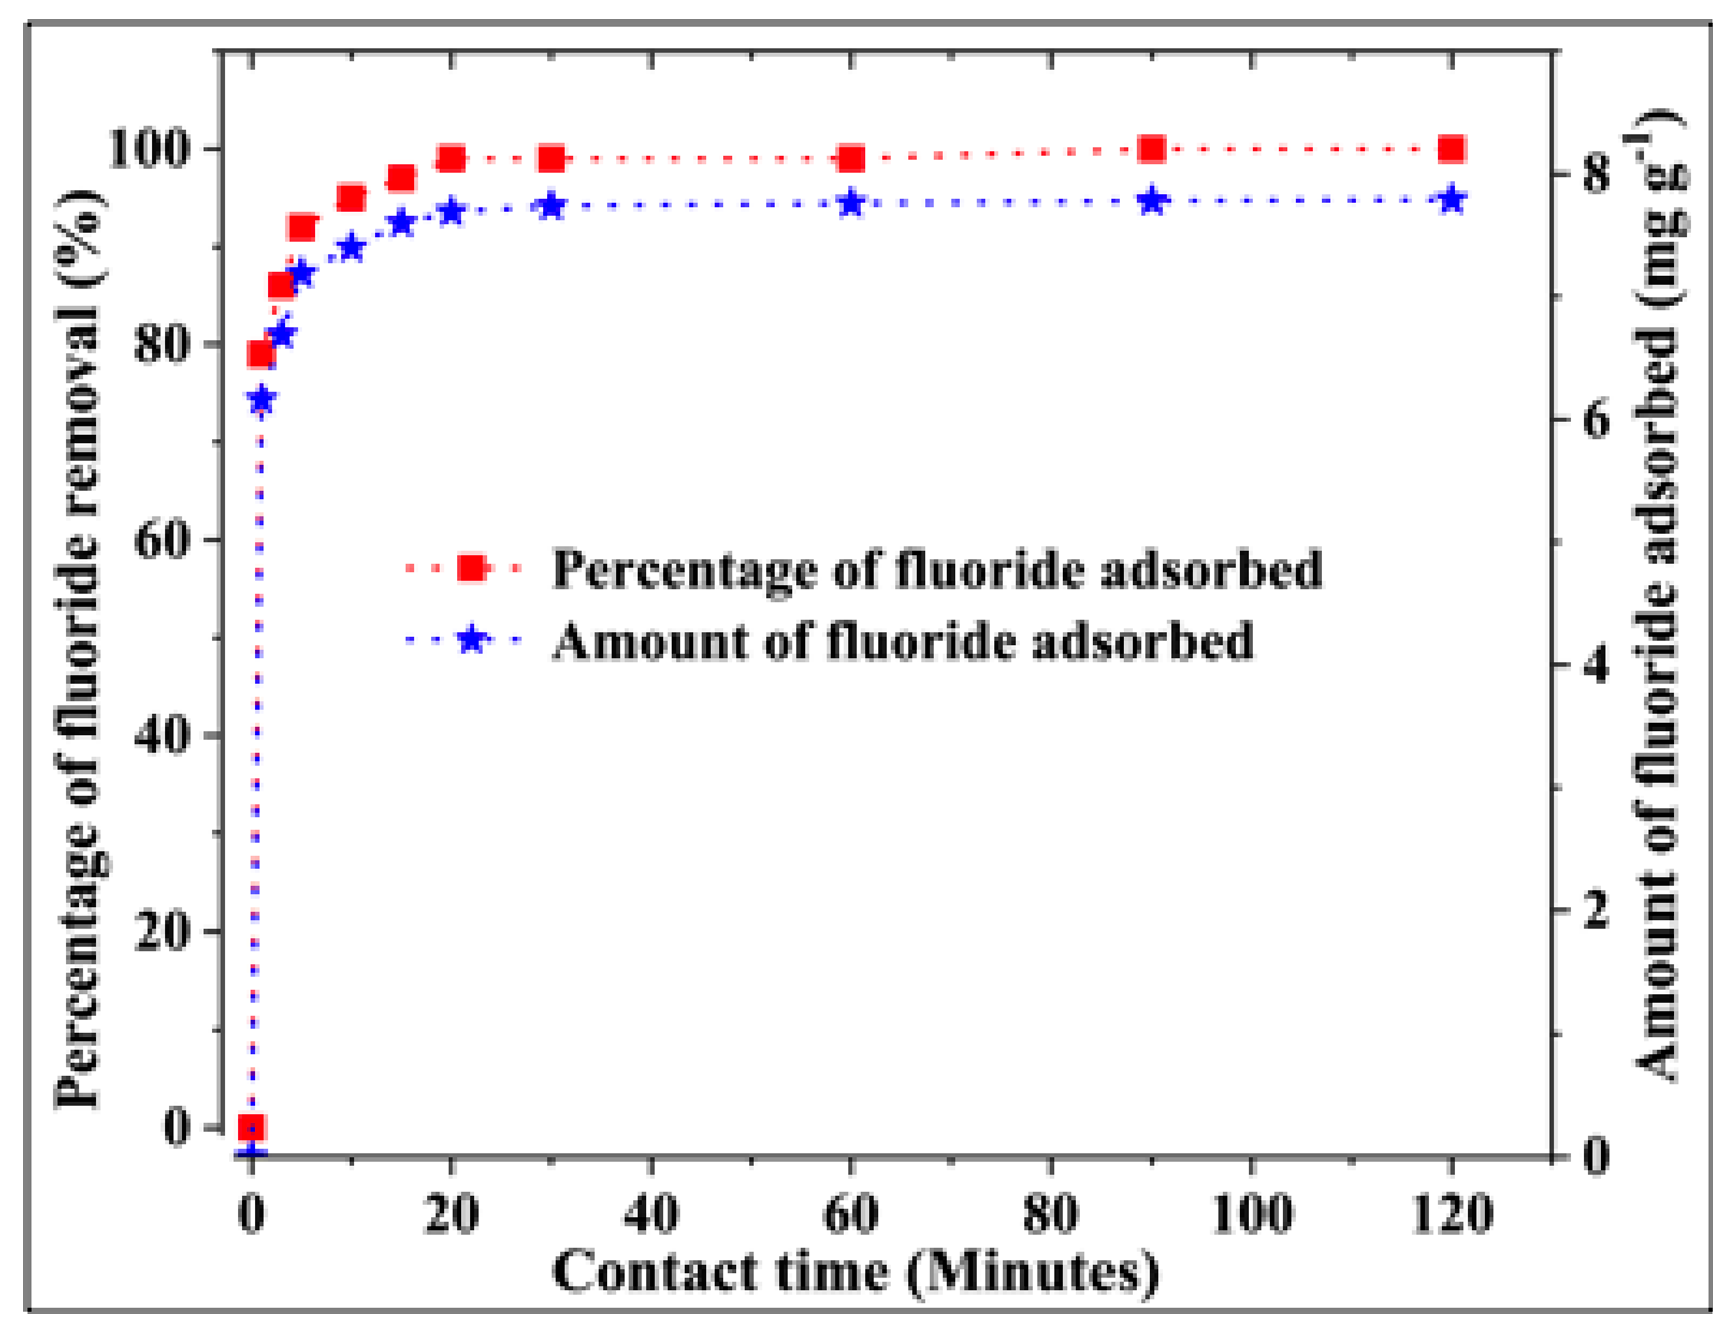
3.2.3. Effect of the Contact Time

The effect of the contact time on the adsorption of fluoride by COMA was determined by varying the contact time between 0 and 120 min and initial fluoride concentration was kept at 15 mg L−1. The solution pH was 6.5 and the COMA dosage was 2.0 g L−1 (Figure 6). The percentage of fluoride adsorbed was observed as 79% (6.16 mg g−1) at the beginning, and after 90 minutes of contact time, the percentage of removal increased to 100% (7.79 mg g−1). The rate of adsorption of fluoride onto COMA was high initially for a period of approximately one minute, and after that the same became slower because a large number of sites available for fluoride adsorption were mostly occupied [36,40]. Initially, the rapid adsorption occurred because of van der Waal forces or electro-statistic interactions at the surface [41], the high concentration gradient between the fluoride and COMA in the solution, and high numbers of the vacant sites being available [39,42]. These facts favor a process of rapid mass transfer onto the surface of COMA [39]. Further adsorption of fluoride ceased or was marginal, as the remaining adsorption sites of COMA were not occupied because of the repulsive forces activated among the equally charged fluoride ions adsorbed on COMA [43]. The adsorption of fluoride by COMA completely ceased due to the low concentration gradient between the surface of COMA and the bulk solution and the exhaustion of available adsorption sites [39]. After that, the system approached equilibrium within 15 minutes of contact time. The total percentage removal of fluoride was determined as 97% (7.6 mg g−1) at the point of equilibrium, and the adsorption process was an equilibrium-driven process for which the time taken became a crucial factor for effective defluoridation [40].

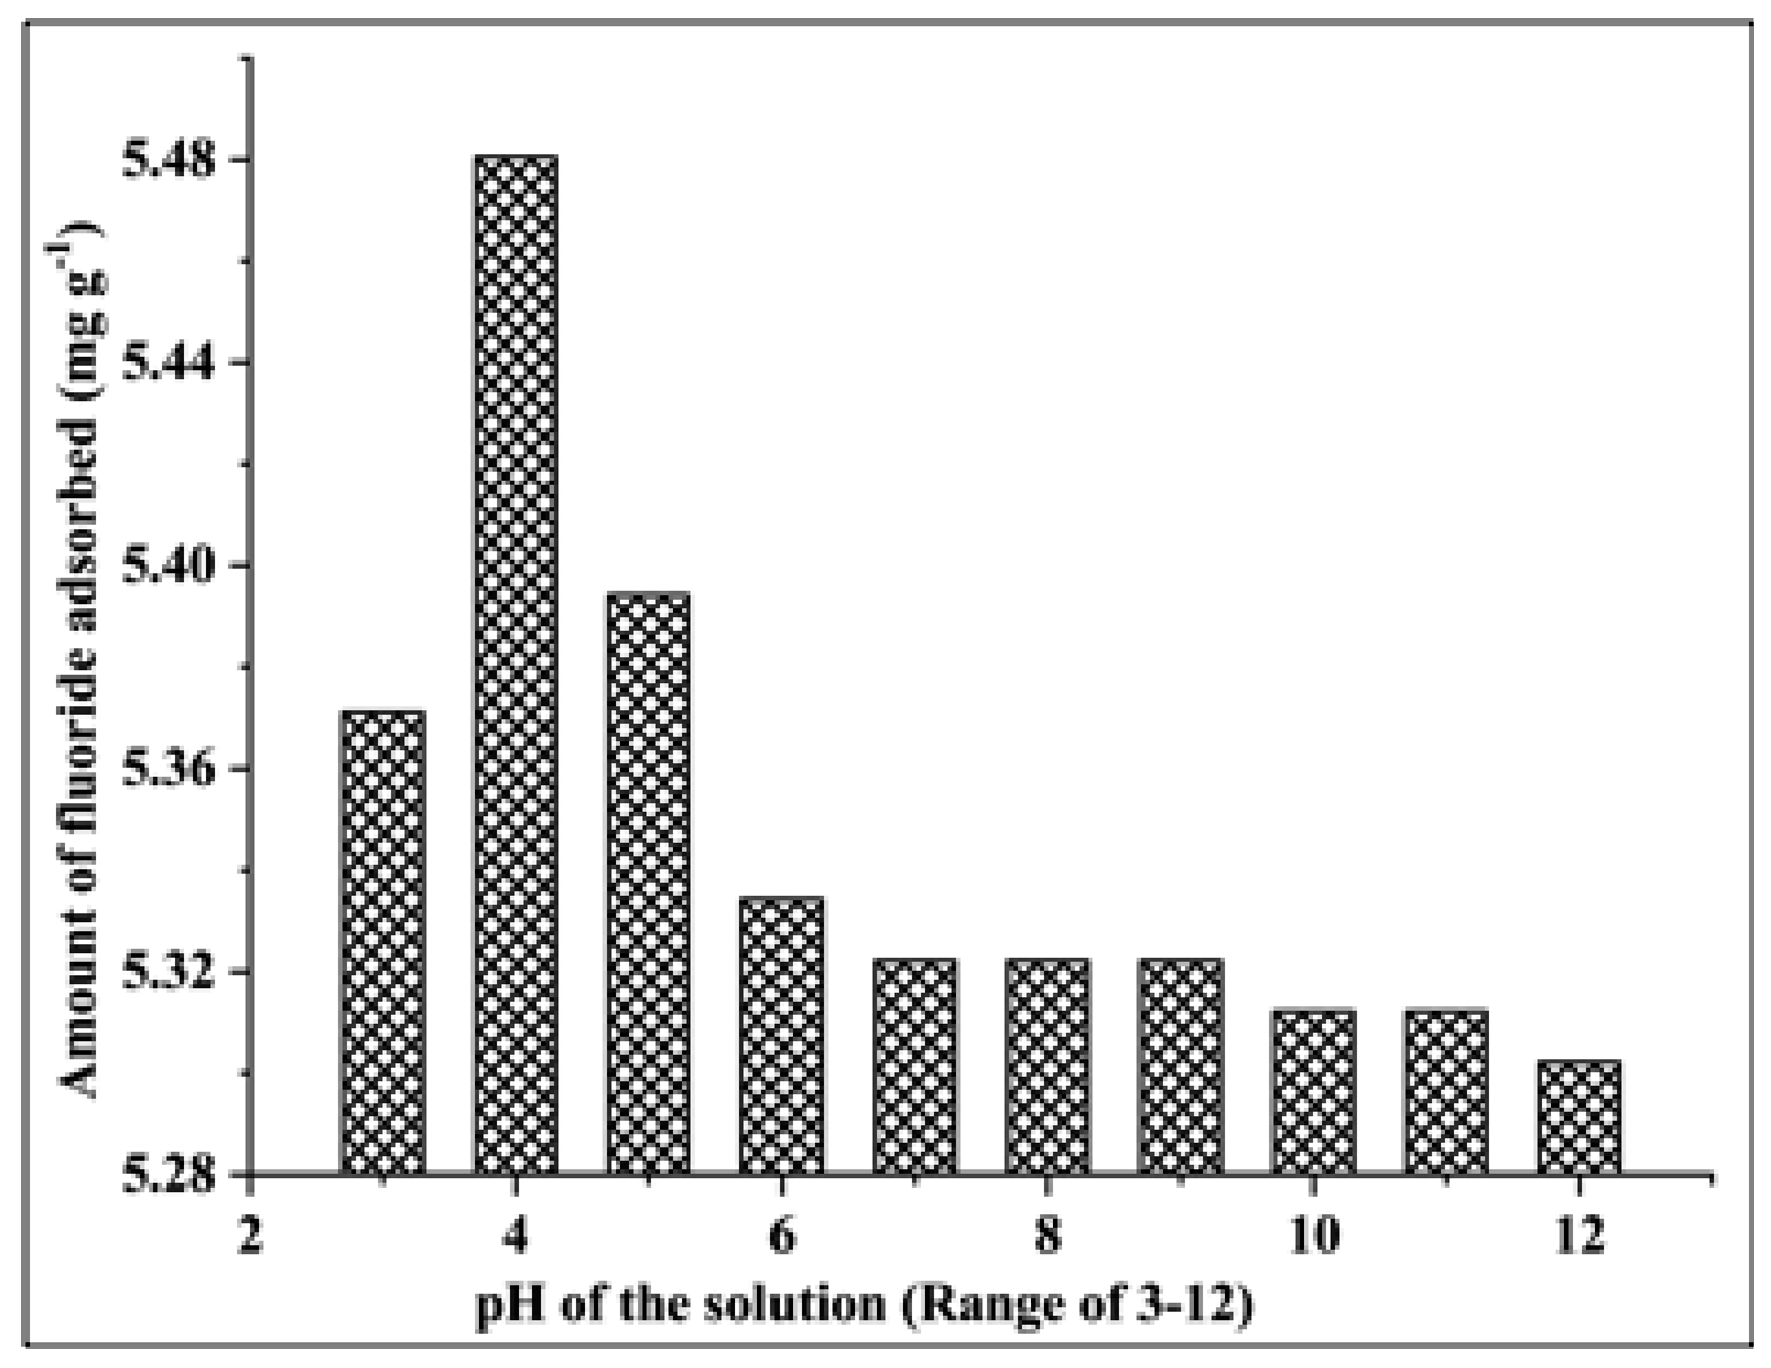
3.2.4. Effect of the pH of the Solution

The amount of fluoride adsorbed showed no marked difference (5.28–5.48 mg g−1) with the pH varying between 3 and 12 (Figure 7). For pH values in the range of 4 to 5, COMA showed a remarkable affinity for fluoride adsorption (92%). At pH 9, the adsorption propensity of COMA gradually decreased (88%). Hence, the best working range of pH was found between 3 and 6 because the adsorption capacity remained unchanged at a high level. When the solution pH was changed, the surface functional groups (surface charge) can be positive, negative, or neutral, leading to the formation of H3O+ or OH- functional groups by the processes of protonation and deprotonation, respectively [18]. At low pH levels in the solution, the surface charges of COMA become positive due to protonation forming ≡ Al-OH + H3O+ -> ≡ AlOH+2 [44]. At low pH values, fluoride in the solution interacts with high levels of H3O+, forming HF, and such a formation hinders the adsorption of fluoride by COMA [40]. In contrast, at high pH values, the charges on the surface of COMA become negative due to the occurrence of deprotonation as ≡ Al-OH -> ≡ Al-O- + H3O+ and CaO on the surface of mesoporous alumina produces calcium hydroxide as follows: CaO + H2O -> Ca(OH)2 [17,18]. Fluoride ions in the solution have a higher affinity to replace surface hydroxyl groups because fluoride is attributed the properties of high reactivity and electronegativity. The amount of fluoride adsorbed was slightly decreased (figure not shown) at high pH values because the negative surface charges bring about repulsive forces among negatively charged oxygen and fluoride ions and the competition of hydroxide ions (OH-) for the same adsorption sites on the surface of COMA [41,44,45].

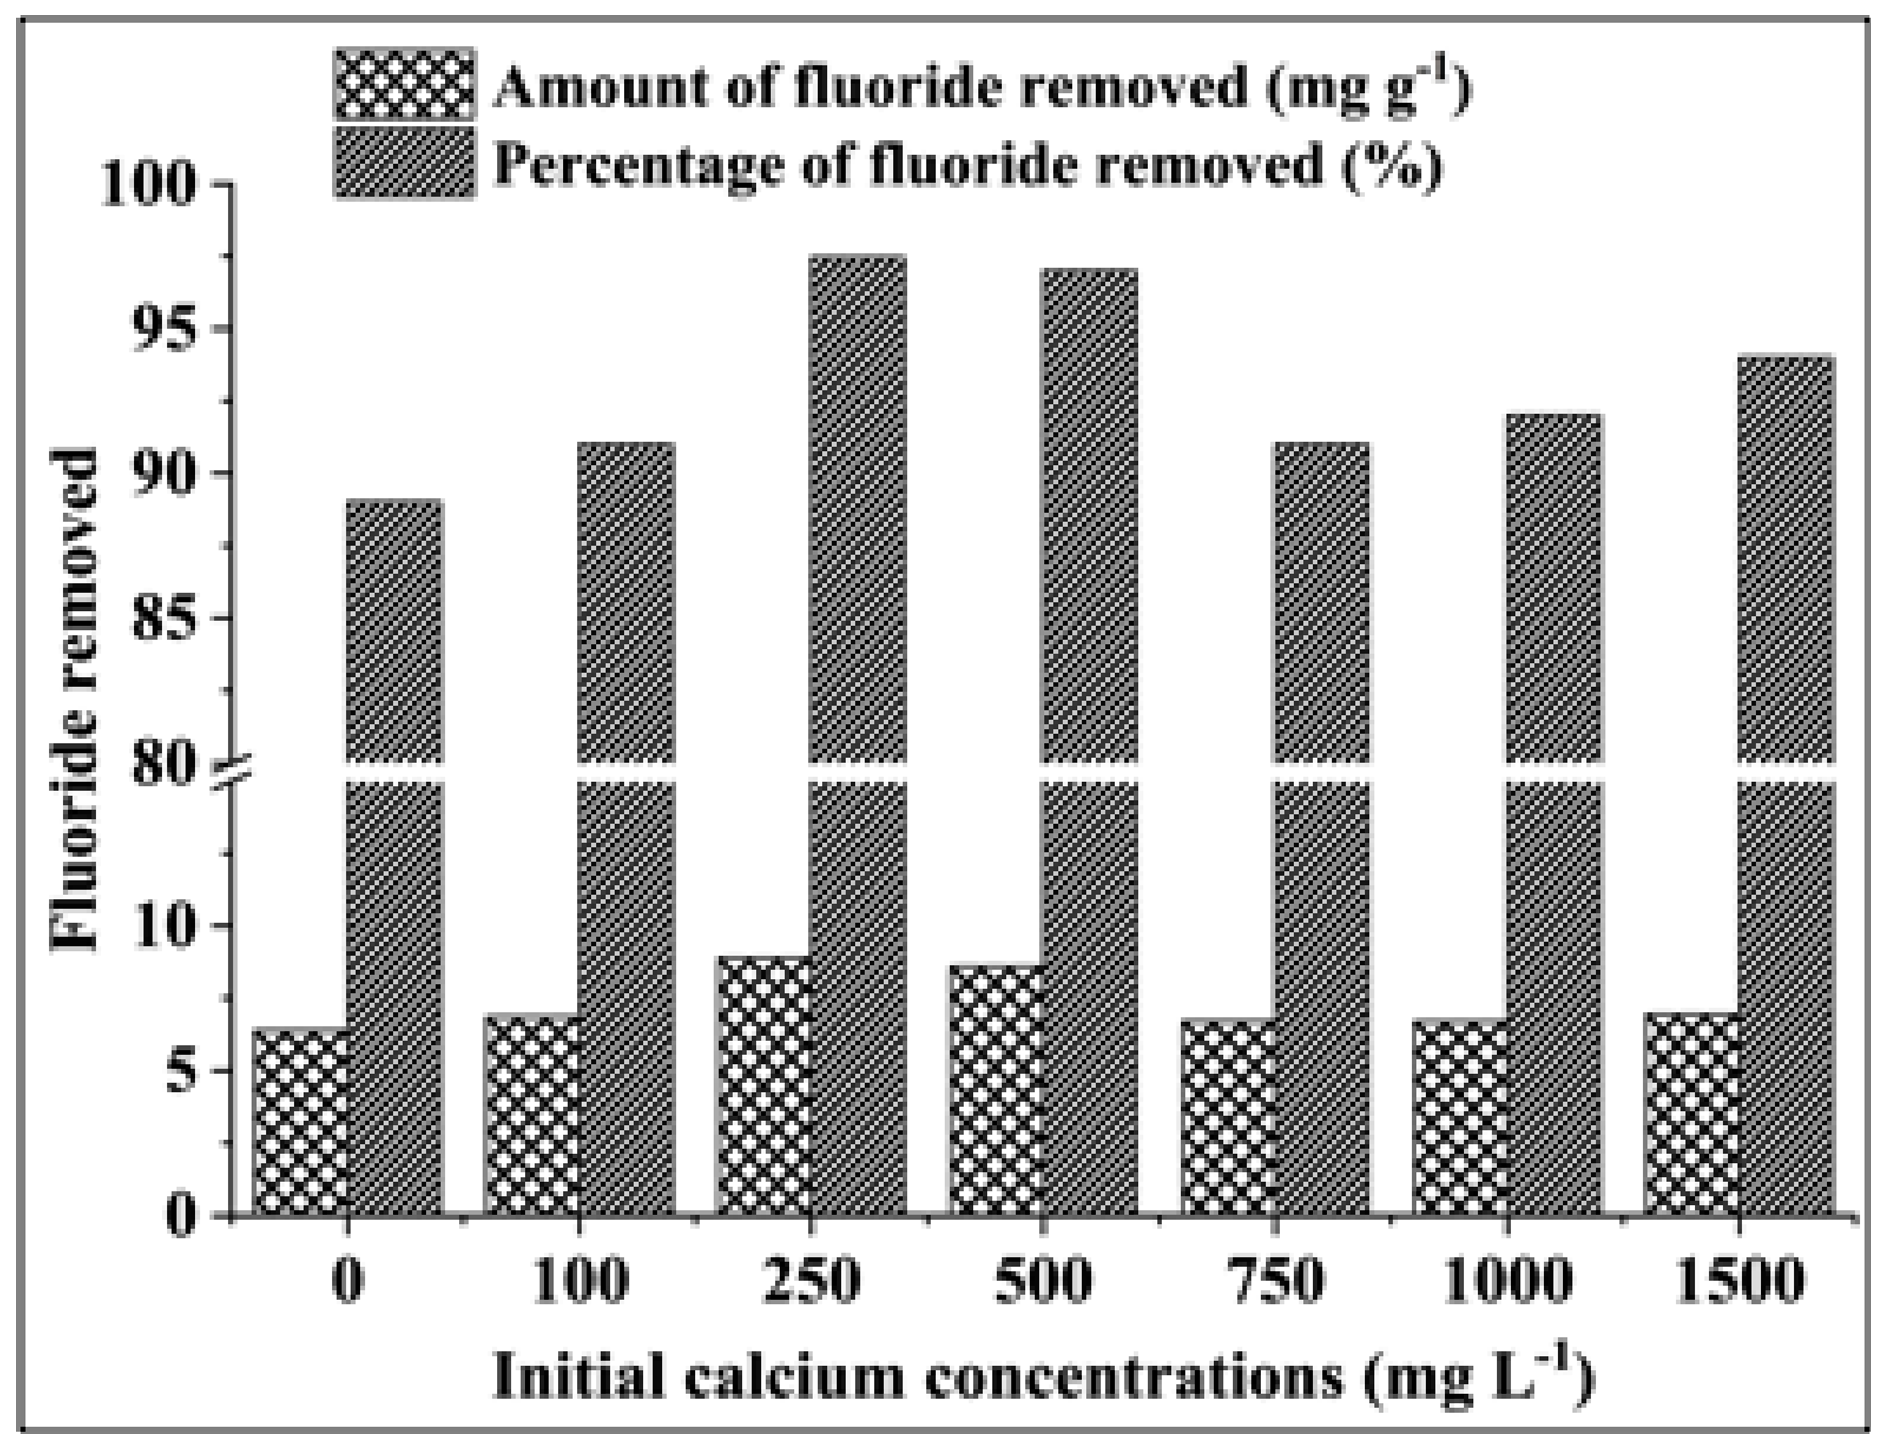
3.2.5. Effect of the Initial Calcium Concentration

The amount of fluoride adsorbed by COMA varied between 6.50 and 7.97 mg g−1 with initial calcium levels between 0 and 1500 mg L−1 and higher percentages of removal (greater than 90%) were observed with the addition of calcium (Figure 8). The calcium levels were decided based on the reported and experimental levels of calcium during the wet (October to November) and dry (June to August) seasons in the CKDu prevalent areas. High calcium levels in the solution often increase the calcium reactivity in the solution and produce calcium hydroxide (Ca(OH)2 complexes. Fluoride ions replace hydroxyl groups (–OH) in such complexes because of their high reactivity and electronegativity [11]. The replacement of –OH leads to the formation of the calcium fluorite precipitate (CaF2) [46]. The process of CaF2 formation is represented by the following equation; Ca(OH)2(aq) + 2F(aq) -> CaF2(s) + 2OH(aq). This phenomenon helps remove fluoride from the solution in addition to the fraction removed by adsorption. The percentage of fluoride adsorption on the surface of COMA increased when the calcium levels in the solution were increased. Because free calcium ions in the solution are attached to pores in the surface of COMA, there is an increase in the number of adsorption sites on the surface. Thus, the amount of fluoride removal increased. The residual fluoride levels in the treated water (0.20–0.77 mg L−1 and 0.42–0.64 mg L−1) complied with the WHO drinking water guideline, with the levels of calcium in the solution being 250 mg L−1 and 500 mg L−1, respectively. Thus, the removal of fluoride was effective in the presence of high calcium levels in the range of 250 mg L−1 and 500 mg L−1. Consequently, previous studies [47,48] suggest possible synergic effects on CKDu by fluoride in the presence of calcium at levels less than the WHO maximum level of 1.5 mg L−1. Thus, COMA helps negate the synergic effect that could otherwise instigate CKDu by the presence of fluoride and calcium in water.

3.3. Adsorption Isotherms and Kinetics Models for Fluoride

The Langmuir, Freundlich, BET, Temkin, and Dubinin–Radushkevich (D–R) isotherm models were used to investigate the fluoride adsorption behavior of COMA. The isotherm parameters obtained from the Langmuir model for the adsorption of fluoride are depicted in Table S1 in Section 2 of the Supplementary Materials. The Langmuir model had a higher R2 value (0.99) in comparison to other isotherm models, and the Langmuir isotherm constant (KL) was 0.85 L mg−1. The maximum monolayer adsorption capacity for fluoride was 17.82 mg/g of COMA. Thus, the adsorption of fluoride by COMA was preferably represented by the Langmuir model, which describes that the adsorption mechanism follows the monolayer adsorption, the COMA surface contains a finite number of homogeneous adsorption sites, and no transmigration of fluoride occurs in the monolayer. The equilibrium factor (RL) of the Langmuir isotherm was 0.40, which indicates that the monolayer adsorption mechanism of COMA was favorable.
The Freundlich model describes the availability of heterogeneous active sites on the surfaces of COMA. The Freundlich isotherm was applied to multilayer adsorption, which describes the non-uniform distribution of adsorption heat and affinities over the heterogeneous surface [49]. The Freundlich model showed an R2 value of 0.86, the Freundlich isotherm constant (Kf) was 0.13 mg g−1, and the adsorption intensity was 1/n 0.93, which indicated that COMA did not convincingly fit the Freundlich model. The isotherm parameters obtained from the Freundlich model for the adsorption of fluoride are presented in Table S1 in Section 2 of the Supplementary Materials.
The BET adsorption isotherm related to the energy of surface interaction implies multilayer formation due to physisorption of fluoride in the surface of the COMA. The BET model showed an R2 value of 0.89, the maximum adsorption capacity of fluoride for forming single layers per gram of COMA (Qo) was 0.44 mg g−1, and energy of surface interaction (KB) was 864.90 L/mg, which indicated that COMA followed a poor interaction with the BET model. The values of parameters obtained from the BET model are presented in Table S1 in Section 2 of the Supplementary Materials.
The Temkin isotherm model takes into account the interactions between COMA and fluoride. The model was based on the assumption that (i) the free energy of adsorption is merely a function of surface coverage, which describes that the heat of adsorption (function of temperature) of all molecules in the layer deceases linearly, and (ii) a uniform distribution of binding energies up to the maximum energy level. The positive value of the variation of adsorption energy indicated that the reaction is exothermic. The R2 value was observed as 0.80, which demonstrates that COMA did not follow the Temkin model. The parameters obtained from the Temkin model are presented in Table S1 in Section 2 of the Supplementary Materials.
The Dubinin–Radushkevich isotherm describes whether the nature of adsorption by COMA is physical or chemical. The value of E calculated according to the Dubinin–Radushkevich model was found to be 1.45 KJ mol−1, indicating that the adsorption process was controlled by the physisorption rather than chemisorption and ions exchange. When the value of E is < 8 kJ mol−1, the adsorption process is physical in nature; for a value between 8 and 16 kJ mol−1, the ion exchange mechanism occurs; and for a value greater than 16 kJmol−1, the adsorption process is controlled by the chemisorption [50]. The isotherm parameters obtained from the Dubinin–Radushkevich model for the adsorption of fluoride are presented in Table S1 in Section 2 of the Supplementary Materials.
The equilibrium constants and thermodynamic parameters for the kinetics models of fluoride adsorption are shown in Table S2 in Section 3 of the Supplementary Materials. Higher R2 values were observed for the pseudo 2nd order model than for those of the pseudo 1st order. The calculated and experimental Qe values of the pseudo 2nd order model were approximately the same in magnitude; hence, the adsorption kinetics of fluoride using COMA were described by the pseudo 2nd order model and characterized by chemisorption with covalent bonding.

4. Conclusions

Mesoporous alumina was successfully functionalized with CaO to synthesize COMA, which was confirmed by the XRD analysis, and the average particle size was on the nano-scale. The optimum COMA dosage for defluoridation was found to be 2 g L−1. The fluoride adsorption was best fitted with the Langmuir model, with the maximum monolayer adsorption capacity of COMA being 17.83 mg g−1, and the adsorption kinetics fitted with the pseudo-2nd order model, indicating strong covalent bonding by way of chemisorption. Thus, COMA can be effectively utilized as an adsorbent material in defluoridation of potable water in areas prevalent with CKDu in the presence of high fluoride (15 mg L−1) and calcium (1500 mg L−1) levels. COMA is, therefore, reckoned to be a potent and reliable material for the selective removal of fluoride in the presence of high calcium levels.

Supplementary Materials

The following are available online at https://www.mdpi.com/2076-3298/6/6/66/s1.

Author Contributions

Conceptualization, M.J.; methodology, M.S., A.P.; validation, M.J., J.M., and B.G.; formal analysis, M.S. and A.P.; data curation, M.S. and A.P. writing—original draft preparation, M.S. and A.P. writing—review and editing, M.J., J.M., and B.G.; visualization, M.S.; supervision, M.J., J.M., and B.G.; funding acquisition, M.J., B.G.

Funding

This research was funded by the Senate Research Committee (SRC) Grant of the University of Moratuwa (Grant No. SRC/ND/15/01) and the National Research Council (NRC), Sri Lanka (Grant No. 15-056).

Acknowledgments

We wish to acknowledge the analytical support given by the staff of Department of Materials Science & Engineering, Faculty of Engineering, University of Moratuwa.

Conflicts of Interest

The authors declare no conflict of interest.

References

  1. Saxena, K.L.; Sewak, R. Fluoride consumption in endemic villages of India and Its remedial measures. Int. J. Eng. Sci. Invent. 2015, 4, 58–73. [Google Scholar]
  2. Camacho, L.M.; Torres, A.; Saha, D.; Deng, S. Adsorption equilibrium and kinetics of fluoride on sol-gel-derived activated alumina adsorbents. J. Colloid Interface Sci. 2010, 349, 307–313. [Google Scholar] [CrossRef] [PubMed]
  3. Currell, M.; Cartwright, I.; Raveggi, M.; Han, D. Controls on elevated fluoride and arsenic concentrations in groundwater from the Yungchen Basin. Appl. Geochem. 2011, 26, 540–552. [Google Scholar] [CrossRef]
  4. Chandrajith, R.; Padmasiri, J.P.; Dissanayake, C.B.; Prematilaka, K.M. Spatial distribution of fluoride in groundwater of Sri Lanka. J. Natl. Sci. Found. Sri Lanka 2012, 40, 303–309. [Google Scholar] [CrossRef]
  5. World Health Organization (WHO). Guidelines for Drinking Water Quality: 4th Edition Incorporating the 1st Addendum; World Health Organization: Geneva, Switzerland, 2017; pp. 370–373. [Google Scholar]
  6. Dharma-wardana, M.; Amarasiri, S.L.; Dharmawardene, N.; Panabokke, C. Chronic kidney disease of unknown etiology and ground-water ionicity; study based on Sri Lanka. Environ. Geochem. Health 2015, 37, 221–231. [Google Scholar] [CrossRef] [PubMed]
  7. Noble, A.; Amerasinghe, P.; Manthrithilake, H.; Arasalingam, S. Review of Literature on Chronic Kidney Disease of Unknown Etiology (CKDu) in Sri Lanka; Working Paper 158; International Water Management Institute: Colombo, Sri Lanka, 2014. [Google Scholar]
  8. Bhatnagar, A.; Kumar, E.; Sillanpaa, M. Fluoride removal from water by adsorption—A review. Chem. Eng. J. 2011, 171, 811–840. [Google Scholar] [CrossRef]
  9. Wijerathna, C.; Weragoda, S.; Kawakami, T. A Review of Chronic Kidney Disease Due to Unknown Etiology and groundwater quality in Dry Zone, Sri Lanka. In Proceedings of the International Conference on Advances in Applied Science and Environmental Engineering, Kuala Lumpur, Malaysia, 20–21 December 2014. [Google Scholar]
  10. Meenakshi; Maheshwari, R. Fluoride in drinking water and its removal. J. Hazard. Mater. 2006, B137, 456–463. [Google Scholar]
  11. Habuda-Stanić, M.; Ravančić, M.E.; Flanagan, A. A Review on adsorption of fluoride from aqueous solution. Materials 2014, 7, 6317–6366. [Google Scholar] [CrossRef]
  12. Chinnakoti, P.; Chunduri, A.L.A.; Vankayala, R.K.; Patnaik, S.; Kamisetti, V. Enhanced fluoride adsorption by nanocrystalline c-alumina: Adsorption kinetics, isotherm modelling and thermodynamic studies. Appl. Water Sci. 2017, 7, 2413–2423. [Google Scholar] [CrossRef]
  13. Bansiwal, A.; Pillewan, P.; Biniwale, R.B.; Rayalu, S.S. Copper oxide incorporated mesoporous alumina for defluoridation of drinking water. Microporous Mesoporous Mater. 2010, 129, 54–61. [Google Scholar] [CrossRef]
  14. Liu, R.; Gong, W.; Lan, H.; Yang, T.; Liu, H.; Qu, J. Simultaneous removal of arsenate and fluoride by iron and aluminum binary oxide: Competitive adsorption effects. Sep. Purif. Technol. 2012, 92, 100–105. [Google Scholar] [CrossRef]
  15. Chai, L.; Wang, Y.; Zhao, N.; Yang, W.; You, X. Sulfate-doped Fe3O4/Al2O3 nanoparticles as a novel adsorbent for fluoride removal from drinking water. Water Res. 2013, 47, 4040–4049. [Google Scholar] [CrossRef] [PubMed]
  16. García-Sánchez, J.J.; Solache-Ríos, M.; Martínez-Miranda, V.; Solís-Morelos, C. Removal of fluoride ions from drinking water and fluoride solutions by aluminum modified iron oxides in a column system. J. Colloid Interface Sci. 2013, 407, 410–415. [Google Scholar] [CrossRef] [PubMed]
  17. Dayananda, D.; Sarva, V.R.; Prasad, S.V.; Arunachalam, J.G. Preparation of CaO loaded mesoporous Al2O3: Efficient adsorbent for fluoride removal from water. Chem. Eng. J. 2014, 248, 430–439. [Google Scholar] [CrossRef]
  18. Dayananda, D.; Sarva, V.R.; Prasad, S.V.; Arunachalam, J.; Ghosh, N.N. A Simple Aqueous Solution Based Chemical Methodology for Preparation of Mesoporous Alumina: Efficient Adsorbent for Defluoridation of Water. Part. Sci. Technol. 2015, 33, 8–16. [Google Scholar] [CrossRef]
  19. Pan, F.; Lu, X.; Wang, T.; Wang, Y.; Zhang, Z.; Yan, Y.; Yang, S. Synthesis of large mesoporous γ-Al2O3 form coal-series kaolin at room temperature. Mater. Lett. 2013, 91, 136–138. [Google Scholar] [CrossRef]
  20. Yin, Q.; Zhao, S.; Asuha, S. Novel approach of synthesis of mesoporous γ-AlOOH powder from Coal-bearing Kaolinite and its enhanced adsorption performance for Congo Red and fluoride. Solid State Phenom. 2019, 288, 79–86. [Google Scholar] [CrossRef]
  21. Galarneau, A.; Mehlhorn, D.; Guenneau, F.; Coasne, B.; Villemot, F.; Minoux, D.; Aquino, C.C.; Dath, J. Specific surface areas determination for microporous/mesoporous materials: The case of mesoporous FAU-Y zeolites. Langmuir 2018. [Google Scholar] [CrossRef]
  22. Langmuir, I. The adsorption of gases on plane surfaces of glass, mica and platinum. J. Am. Chem. Soc. 1918, 40, 1361–1403. [Google Scholar] [CrossRef]
  23. Freundlich, H.M.F. Over the adsorption in solution. J. Phys. Chem. 1906, 57, 385–471. [Google Scholar]
  24. Brunauer, S.; Emmett, P.H.; Teller, E. Adsorption of gases in multi molecular layers. J. Am. Chem. Soc. 1938, 60, 309–319. [Google Scholar] [CrossRef]
  25. Dubinin, M.M. The potential theory of adsorption of gases and vapours for adsorbents with energetically non-uniform surfaces. Chem. Rev. 1960, 60, 235–241. [Google Scholar] [CrossRef]
  26. Tempkin, M.I.; Pyzhev, V. Kinetics of ammonia synthesis on promoted iron catalyst. Acta Phys. Chim. Sin. 1940, 12, 327–356. [Google Scholar]
  27. Lagergren, S. About the theory of so-called adsorption of soluble substances. Kungliga Svenska Vetenskapsakademiens Handlingar 1898, 24, 1–39. [Google Scholar]
  28. Ho, Y.S.; McKay, G. Pseudo-second order model for sorption processes. Process Biochem. 1999, 34, 451–465. [Google Scholar] [CrossRef]
  29. Marinković, D.M.; Stanković, M.V.; Veličković, A.V.; Avramović, J.M.; Cakić, M.D.; Veljković, V.B. The synthesis of CaO loaded onto Al2O3 from calcium acetate and its application in transesterification of the sunflower oil. Adv. Technol. 2015, 4, 26–32. [Google Scholar] [CrossRef]
  30. Chang, Y.; Chang, P.; Lee, Y.; Lee, T.; Lai, Y.; Chen, S. Morphological and structural evolution of mesoporous calcium aluminate nanocomposites by microwave-assisted synthesis. Microporous Mesoporous Mater. 2014, 183, 134–142. [Google Scholar] [CrossRef]
  31. Imtiaz, A.; Farrukh, M.A.F.; Khaleeq-ur-rahman, M.; Adnan, R. Micelle-Assisted synthesis of Al2O3⋅CaO nanocatalyst: Optical properties and their applications in photodegradation of 2,4,6-Trinitrophenol. Sci. World J. 2013, 2013, 641420. [Google Scholar] [CrossRef] [PubMed]
  32. Lesbani, A.; Sitompul, S.O.C.; Mohadi, R.; Hidayati, N. Characterization and utilisation of Calcium Oxide (CaO) thermally decomposed from fish bones as a catalyst in the production of biodiesel from waste cooking oil. Makara J. Technol. 2016, 20, 121–126. [Google Scholar] [CrossRef]
  33. Azzam, A.; El-Wakeelb, S.; Mostafa, B.; El-Shahatc, M.F. Removal of Pb, Cd, Cu and Ni from aqueous solution using nanoscale zero-valent iron particles. J. Environ. Chem. Eng. 2016, 4, 2196–2206. [Google Scholar] [CrossRef]
  34. Prathibha, C.; Sharma, B.; Chunduri, L.A.; Aditha, S.K.; Rattan, T.; Venkataramaniah, K. Nano Calcium-Aluminum Mixed Oxide: A Novel and Effective Material for Defluoridation of Drinking Water. Sep. Sci. Technol. 2015, 50, 1915–1924. [Google Scholar] [CrossRef]
  35. Kumar, E.; Bhatnagar, A.; Kumar, U.; Sillanpa, M. Defluoridation from aqueous solutions by nano-alumina: Characterization and sorption studies. J. Hazard. Mater. 2011, 186, 1042–1049. [Google Scholar] [CrossRef] [PubMed]
  36. Kanehiraa, S.; Kanamori, S.; Nagashima, K.; Saeki, T.; Visbal, H.; Fukui, T.; Hirao, K. Controllable hydrogen release via aluminum powder corrosion in calcium hydroxide solutions. J. Asian Ceram. Soc. 2013, 1, 296–303. [Google Scholar] [CrossRef] [Green Version]
  37. Peng, S.; Wang, R.; Yang, L.; He, L.H.; Liu, X. Biosorption of copper, zinc, cadmium and chromium ions from aqueous solution by natural foxtail millet shell. Ecotoxicol. Environ. Saf. 2018, 165, 61–69. [Google Scholar] [CrossRef] [PubMed]
  38. Ileperuma, O.A.; Dharmagunawardhane, H.A.; Herath, K.P. Dissolution of aluminium from sub-standard utensils under high fluoride stress: A possible risk factor for chronic renal failure in the North-Central Province. J. Natl. Sci. Found. Sri Lanka 2009, 37, 219–222. [Google Scholar] [CrossRef]
  39. Pandurangappaa, C.; Lakshminarasappab, B.N.; Nagabhushana, B.M. Synthesis and characterisation of CaF2 nanocrystals. J. Alloys Compd. 2010, 489, 592–595. [Google Scholar] [CrossRef]
  40. Singh, P.K.; Saharan, V.K.; George, S. Studies on performance characteristics of calcium and magnesium amended alumina for defluoridation of drinking water. J. Environ. Chem. Eng. 2018, 6, 1364–1377. [Google Scholar] [CrossRef]
  41. Liu, X.; Chen, Z.Q.; Han, B.; Su, C.L.; Han, Q.; Chen, W.Z. Biosorption of copper ions from aqueous solution using rape straw powders: Optimisation, equilibrium and kinetic studies. Ecotoxicol. Environ. Saf. 2018, 150, 251–259. [Google Scholar] [CrossRef]
  42. Tillotson, M.J.; Brett, P.M.; Bennett, R.A.; Grau-Crespo, R. Adsorption of organic molecules at the TiO2(110) surface: The effect of van der Waals interactions. Surf. Sci. 2015, 632, 142–153. [Google Scholar] [CrossRef]
  43. Arshadi, M.; Amiri, M.J.; Mousavi, S. Kinetic, equilibrium and thermodynamic investigations of Ni(II), Cd(II), Cu(II) and Co(II) adsorption on barley straw ash. Water Resour. Ind. 2014, 6, 1–17. [Google Scholar] [CrossRef] [Green Version]
  44. Nigussie, W.; Zewge, F.; Chandravanshi, B. Removal of excess fluoride from water using waste residue from alum manufacturing process. J. Hazard. Mater. 2007, 147, 954–963. [Google Scholar] [CrossRef] [PubMed]
  45. Li, F.; Fu, J.; Jin, J.; Wang, S.; Liu, Y.; Yang, M.; Fu, X. Evaporation-induced self-assembly (EISA) synthesized mesoporous bimetalic oxides (MBOs) enabling enhanced co-uptake of arsenate and fluoride from water. J. Chem. Technol. Biotechnol. 2018, 94, 879–891. [Google Scholar] [CrossRef]
  46. Islam, M.; Patel, R. Evaluation of removal efficiency of fluoride from aqueous solution using quick lime. J. Hazard. Mater. 2007, 143, 303–310. [Google Scholar] [CrossRef] [PubMed]
  47. Wasana, H.M.S.; Perera, G.D.R.K.; Gunawardena, P.S.; Fernando, P.S.; Bandara, J. WHO water quality standards Vs Synergic effect(s) of fluoride, heavy metals and hardness in drinking water on kidney tissues. Sci. Rep. 2017, 7, 42516. [Google Scholar] [CrossRef] [PubMed]
  48. Dissanayake, C.B.; Chandrajith, R. Groundwater fluoride as a geochemical marker in the etiology of chronic kidney disease of unknown origin in Sri Lanka. Ceylon J. Sci. 2017, 46, 3–12. [Google Scholar] [CrossRef]
  49. Zhang, L.; Wang, Y.; Jin, S.; Lu, Q.; Ji, J. Adsorption isotherm, kinetic and mechanism of expanded graphite for sulfadiazine antibiotics removal from aqueous solutions. Environ. Technol. 2017, 38, 2629–2638. [Google Scholar] [CrossRef] [PubMed]
  50. Dada, A.O.; Olalekan, A.P.; Olatunya, A.M.; Dada, O. Langmuir, Freundlich, Temkin and Dubinin-Radushkevich Isotherms Studies of Equilibrium Sorption of Zn2+ Unto Phosphoric Acid Modified Rice Husk. IOSR J. Appl. Chem. 2012, 3, 38–45. [Google Scholar]
Figure 1. XRD patterns of mesoporous alumina and COMA.
Environments 06 00066 g001
Figure 2. ESEM and EDX images of (a) mesoporous alumina, (b) COMA before the adsorption of fluoride, and (c) COMA after adsorption of fluoride.
Environments 06 00066 g002
Figure 3. FT-IR spectra of mesoporous alumina and COMA.
Environments 06 00066 g003
Figure 4. Percentage of fluoride removal over different COMA dosages in the absence of calcium (initial fluoride concentration: 15 mg L−1).
Environments 06 00066 g004
Figure 5. Amount and percentage of fluoride adsorbed for different initial fluoride concentrations in the absence of calcium.
Environments 06 00066 g005
Figure 6. Amount and percentage of fluoride adsorbed over time in the absence of calcium (initial fluoride concentration: 15 mg L−1).
Environments 06 00066 g006
Figure 7. Amount of fluoride adsorbed for varying pH in the absence of calcium (initial fluoride concentration: 15 mg L−1).
Environments 06 00066 g007
Figure 8. The amount and percentage of fluoride removal in the presence of calcium (initial fluoride level: 15 mg L−1).
Environments 06 00066 g008

