Article

Temporal and Spatial Study of Water Quality and Trophic Evaluation of a Large Tropical Reservoir

by
Alberto Quevedo-Castro
1,
Erick R. Bandala
2,
Jesús G. Rangel-Peraza
1,
Leonel E. Amábilis-Sosa
3,
Antonio Sanhouse-García
1 and
Yaneth A. Bustos-Terrones
3,*
1
Division of Postgraduate Studies and Research, Technological Institute of Culiacán, Juan de Dios Bátiz 310, Col. Guadalupe. CP. 80220 Culiacán, Mexico
2
Division of Hydrologic Sciences, Desert Research Institute, 755 Flamingo Road, Las Vegas, NV 89119-7363, USA
3
CONACYT—Division of Postgraduate Studies and Research, Technological Institute of Culiacán, Juan de Dios Bátiz 310, Col. Guadalupe. CP. 80220 Culiacán, Mexico
*
Author to whom correspondence should be addressed.
Environments 2019, 6(6), 61; https://doi.org/10.3390/environments6060061
Submission received: 10 May 2019 / Revised: 30 May 2019 / Accepted: 1 June 2019 / Published: 4 June 2019

Abstract

:
A water quality study was carried out at the Adolfo López Mateos (ALM) reservoir, one of the largest tropical reservoirs in Mexico, located within an intensive agricultural region. In this study, the seasonal and spatial variations of nine water quality parameters were evaluated at four different sites along the reservoir semiannually over a period of seven years (2012–2018), considering the spring (dry) and fall (rainy) seasons. An analysis of variance was performed to compare the mean values of the water quality parameters for the different sampling sites. Then, a multiparametric classification analysis was carried out to estimate the spatial density of the sampling points by using a probabilistic neural network (PNN) classifier. The observations (seasonal and spatial) of the water quality parameters at the ALM reservoir revealed no significant influence. The trophic status was evaluated using the Carlson Modified Trophic State Index, finding the trophic state of the reservoir at the mesotrophic level, with nitrogen being the limiting nutrient. The PNN revealed neural interactions between total suspended solids (TSS) and the other four parameters, indicating that the concentration ranges of five parameters are equally distributed and classified.

1. Introduction

The alteration of biogeochemical cycles in waters bodies by the constant contribution of nutrients causes an increase in the amount of sediments, especially in lentic systems. Globally, this phenomenon generates a tendency towards the disappearance or loss of ecological functions [1,2]. Nutrient presence in water bodies leads to an increase in phytoplankton and algae biomass production. However, algae show a short life cycle, and this situation causes the sedimentation and accumulation of bottom material [3,4].
The accumulation of sediments in reservoirs can lead to a variety of problems, including the obstruction of dam outlets, the generation of abrasive effects on power generation turbines and concrete structures, and/or the reduction of reservoir storage capacities [5]. The quality of a water body is also affected by high concentrations of nutrients (e.g., phosphates and nitrogen) that cause changes in the natural balance of a water body [6]. The chemical processes and dynamics of aquatic ecosystems are adversely affected by an excess of nutrients. The observed changes in water quality characteristics due to chemical and biological processes are better known as eutrophication, and they are usually related to human activities [7,8,9,10].
The eutrophication of a river or lake has effects that can be perceived by the naked eye, such as the alteration of biota, turbid water, large amounts of aquatic plants, sediments and the development of organisms that prevent light from penetrating columns of water, which then leads to a decrease of dissolved oxygen [11,12,13].
Tropical water bodies are more sensitive to an increase the supply of nutrients because, in these regions, more intensive agricultural activities are observed. Tropical water bodies are also susceptible to other anthropogenic sources of nutrients from urban areas (e.g., wastewater effluents) due to the use of soaps and phosphorus-based detergents [14]. Therefore, these water bodies show major changes in their water quality and biotic communities in response to eutrophication [15]. In this sense, they require stricter regulation of the presence of organic matter and nutrients than temperate reservoirs [16].
Several eutrophication studies have been carried out in temperate regions, but only a few have been reported in tropical regions. This study proposes the use of statistical techniques in order to facilitate the interpretation of the physical and chemical characteristics of a large tropical reservoir located in Culiacan, Mexico; the trophic state of this water body was assessed by analyzing the spatial and seasonal variations of nutrients (phosphorous and nitrogen). In Mexico, reservoirs represent the largest volume of stored available water, with a storage capacity of approximately 70% of the total volume. The ALM reservoir is one of the largest water reservoirs in Mexico, and it is the object of this study due to its economic importance. Given that this reservoir has been proposed as an important water source for the near future, more accurate knowledge about its water quality characteristics and their relation to its hydrological parameters is necessary.
The main objective of this work was to evaluate the water quality and trophic of the ALM reservoir. The interactions between water quality parameters and the relationships between these parameters with natural variations of the hydrological cycle in the basin were also studied. The trophic status was evaluated using the Carlson Modified Trophic State Index. Finally, statistical tools such as a probabilistic neural network (PNN) classifier and an ANOVA were used to assess the seasonal and spatial variation of water quality.

2. Material and Methods

2.1. Study Area

The Adolfo Lopez Mateos (ALM) reservoir is important for the state of Sinaloa. The agriculture of this region depends on this waterbody. It is located in the municipalities of Badiraguato and Culiacán (Figure 1). The operation of the ALM reservoir began in 1963. The geographical location of the reservoir is 25°05′25″ N and 107°23′00″ W. Its altitude is 186.50 meters above sea level (m.a.s.l.), and it has a surface area of 11,354 ha. It is considered as a large reservoir due to its total capacity of 4,034.5 hm3 [17].
The ALM reservoir serves several purposes, including generating electric power, housing fisheries, and supplying agricultural irrigation. The generation capacity of electric energy is 90,000 kW. The ALM reservoir is a 105.5 m-high concrete-faced rockfill reservoir located at the confluence of the Badiraguato and Humaya Rivers. The study area presents a warming subhumid climate with summer rains, and its average annual temperature is 24.5 °C. Most of the human settlements in the basin are concentrated in the southern zone of the reservoir; they are generally villages with less than 500 inhabitants whose main activities are agriculture and fishing. Part of the land is intended for agricultural activities, but there are different types of vegetation in the study area: A low deciduous jungle and a median sub-deciduous forest containing gallery forest, as well as forests of oak and pine–oak. The fishing activities in the reservoir are important food and income sources for the inhabitants. This water body is important because it irrigates an area of 219,000 ha of crops, which aids the production of 3,240,00 tons of food, one of the main economic activities in Mexico [18].

2.2. Water Quality

The Culiacan River hydrological basin is one of the most important basins for the agricultural valley of Sinaloa, and it supplies water to the ALM reservoir. There are only four systematic monitoring stations where water quality information is available in the reservoir. These stations are: Guaténipa II (sampling point 3), Badiraguato (sampling point 1), El Varejonal A.L. (sampling point 4), and P.D. Andrew W (sampling point 2). In these stations, water quality samples were taken every six months during a period of 2012–2018. (Figure 1). These monitoring stations are operated by the Mexican National Water Commission (CONAGUA). The water quality parameters included in this study were: pH, dissolved oxygen (DO), electrical conductivity (EC), turbidity, total suspended solids (TSS), biochemical oxygen demand (BOD), chemical oxygen demand (COD), total organic carbon (TOC), total nitrogen (TN), total phosphorus (TP), and fecal coliforms (FC) [19]. During the study period, hydrometric and climatological conditions were also studied. This information was collected from the climatological and gauging stations located next to El Varejonal A.L. (sampling point 4), which is operated by the Federal Electricity Commission.

2.3. Statistical Analysis

Statistical analysis was carried out using Statgraphics Centurion software. First, a time-series analysis of environmental temperature, precipitation, evaporation, and reservoir volume (storage volume) was carried out. The time-series analysis described hydrological and climatological trends and seasonal variations. Then, a statistical analysis of the behavior of the water quality parameters was performed during the study period. All these physicochemical parameters were classified by a probabilistic neural network (PNN) classifier to estimate the spatial density of the sampling points via the Parzen window method [20]. In the same way, the semiannually water quality was assessed, and the temporal distribution of water quality was identified in the reservoir. Water quality analysis was carried out over a period of seven years (2012–2018). These analyses were complemented with an analysis of variance (ANOVA). The differences between the means of water quality parameters were validated through a Duncan multiple range test. This statistical analysis identified water quality responses at different points of the reservoir. Prior to all statistical analysis, a normality test was performed with the Anderson–Darling test. According to this test, all the variables were normally distributed with 95% or higher confidence.

2.4. Trophic Status

Several authors have introduced different criteria for the classification of freshwater trophic levels; most of them have been based on phosphorus (P), nitrogen (N) compounds, and chlorophyll-a concentrations [21,22,23,24]. In this study, the mean values of chlorophyll-a, total phosphorus, total nitrogen, and Secchi disk depth (SD) were used for calculating the Carlson Modified Trophic State Index (CMTSI) [22,25,26,27]. Water quality classification based on the CMTSI was adapted from Begliutti et al. [28] and Molisani et al. [23]. The equations used to determine the CMTSI (Equations (1)–(4)) correspond to the proposal of Carlson [29] and were applied to the ALM reservoir.
CMTSI for Chlorophyll-a = 9.81 ln Chlorophyll-a (μg/L) + 30.6
CMTSI for Secchi depth = 60 − 14.4 ln Sechhi depth (m)
CMTSI for Total Phosphorus = 14.42 ln total phosphorus (μg/L) + 4.15
Total CMTSI = [CMTSI(TP) + CMTSI(CA) + CMTSI(SD)]/3
According to Prasad and Siddaraju [30], lakes can be classified as oligotrophic (low productive), mesotrophic (moderately productive), and eutrophic (highly productive). Finally, the nitrogen/phosphorus ratio was evaluated to identify the nutrient prevailing in the reservoir [9].

3. Results and Discussion

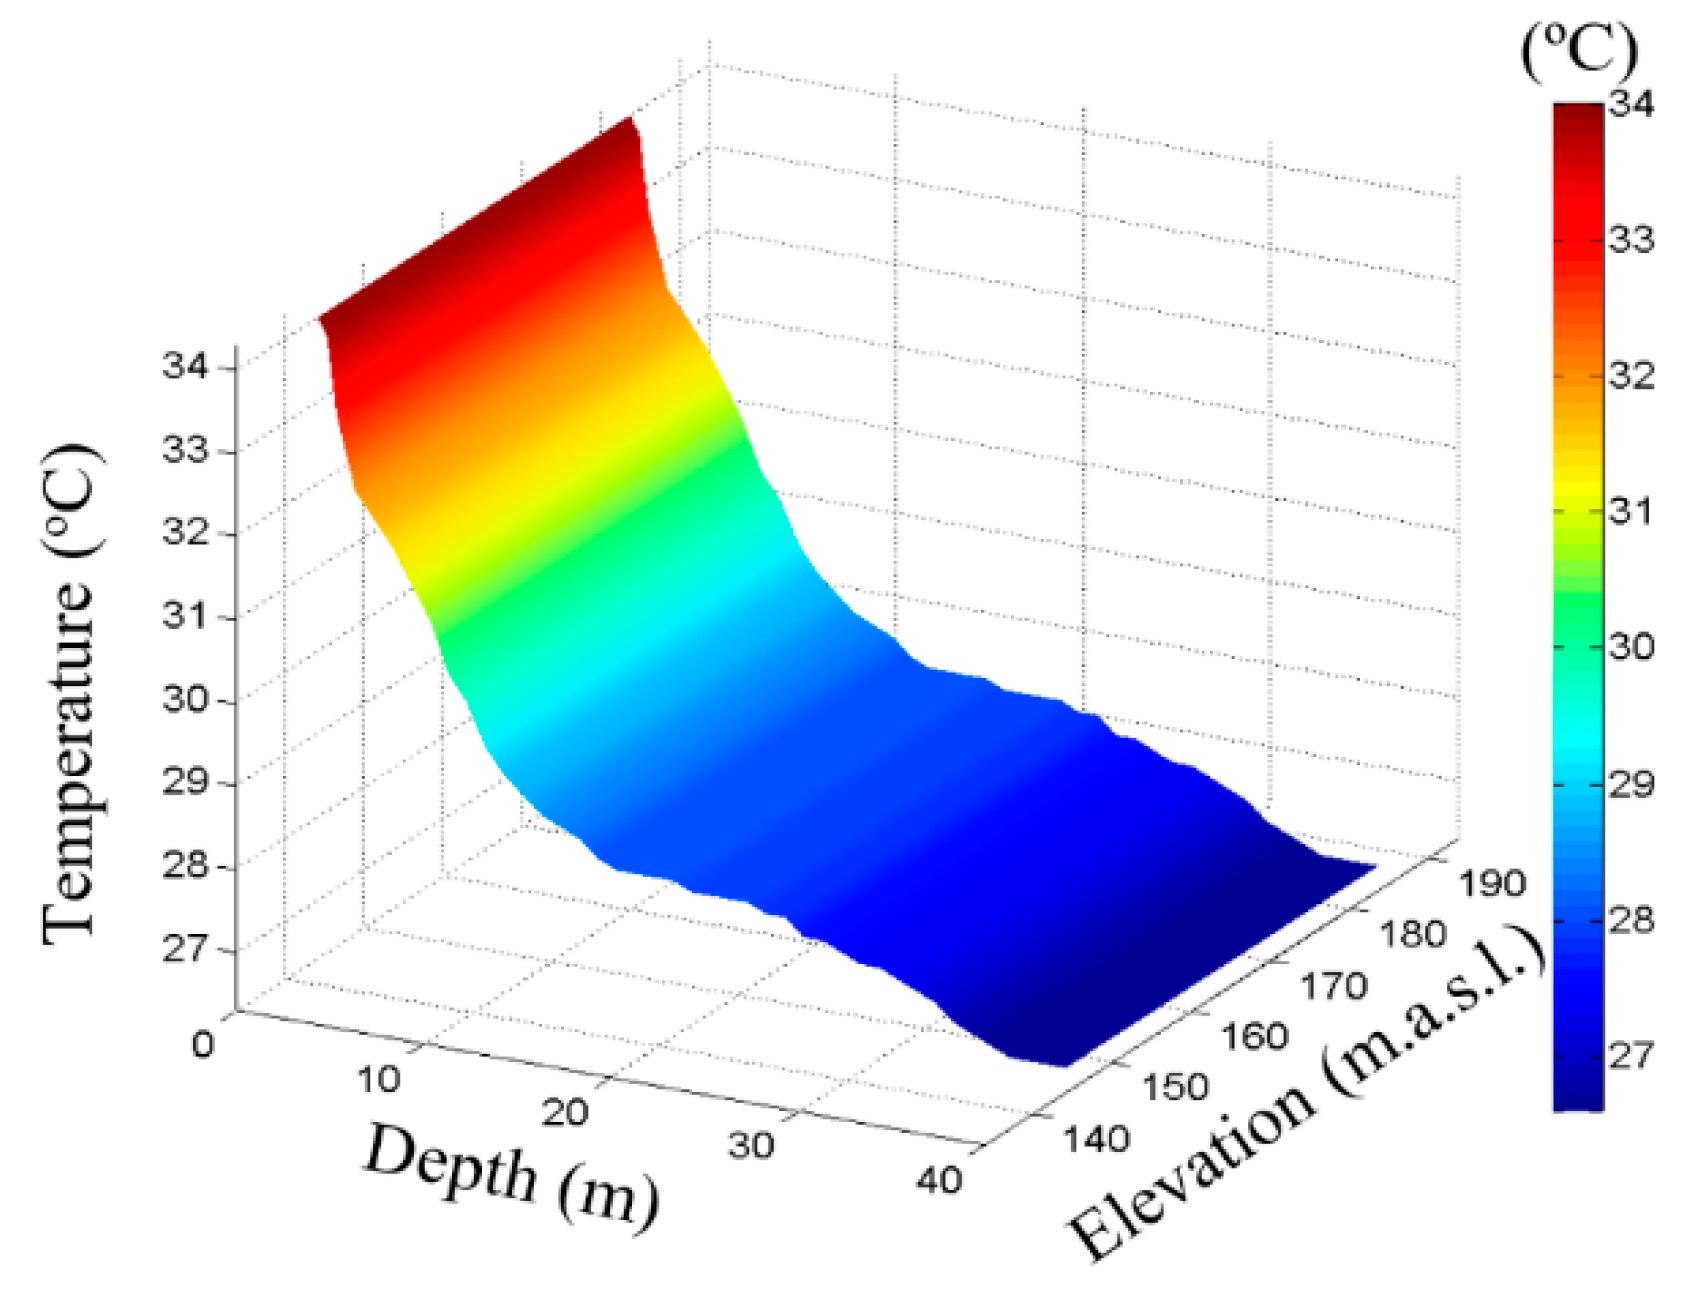
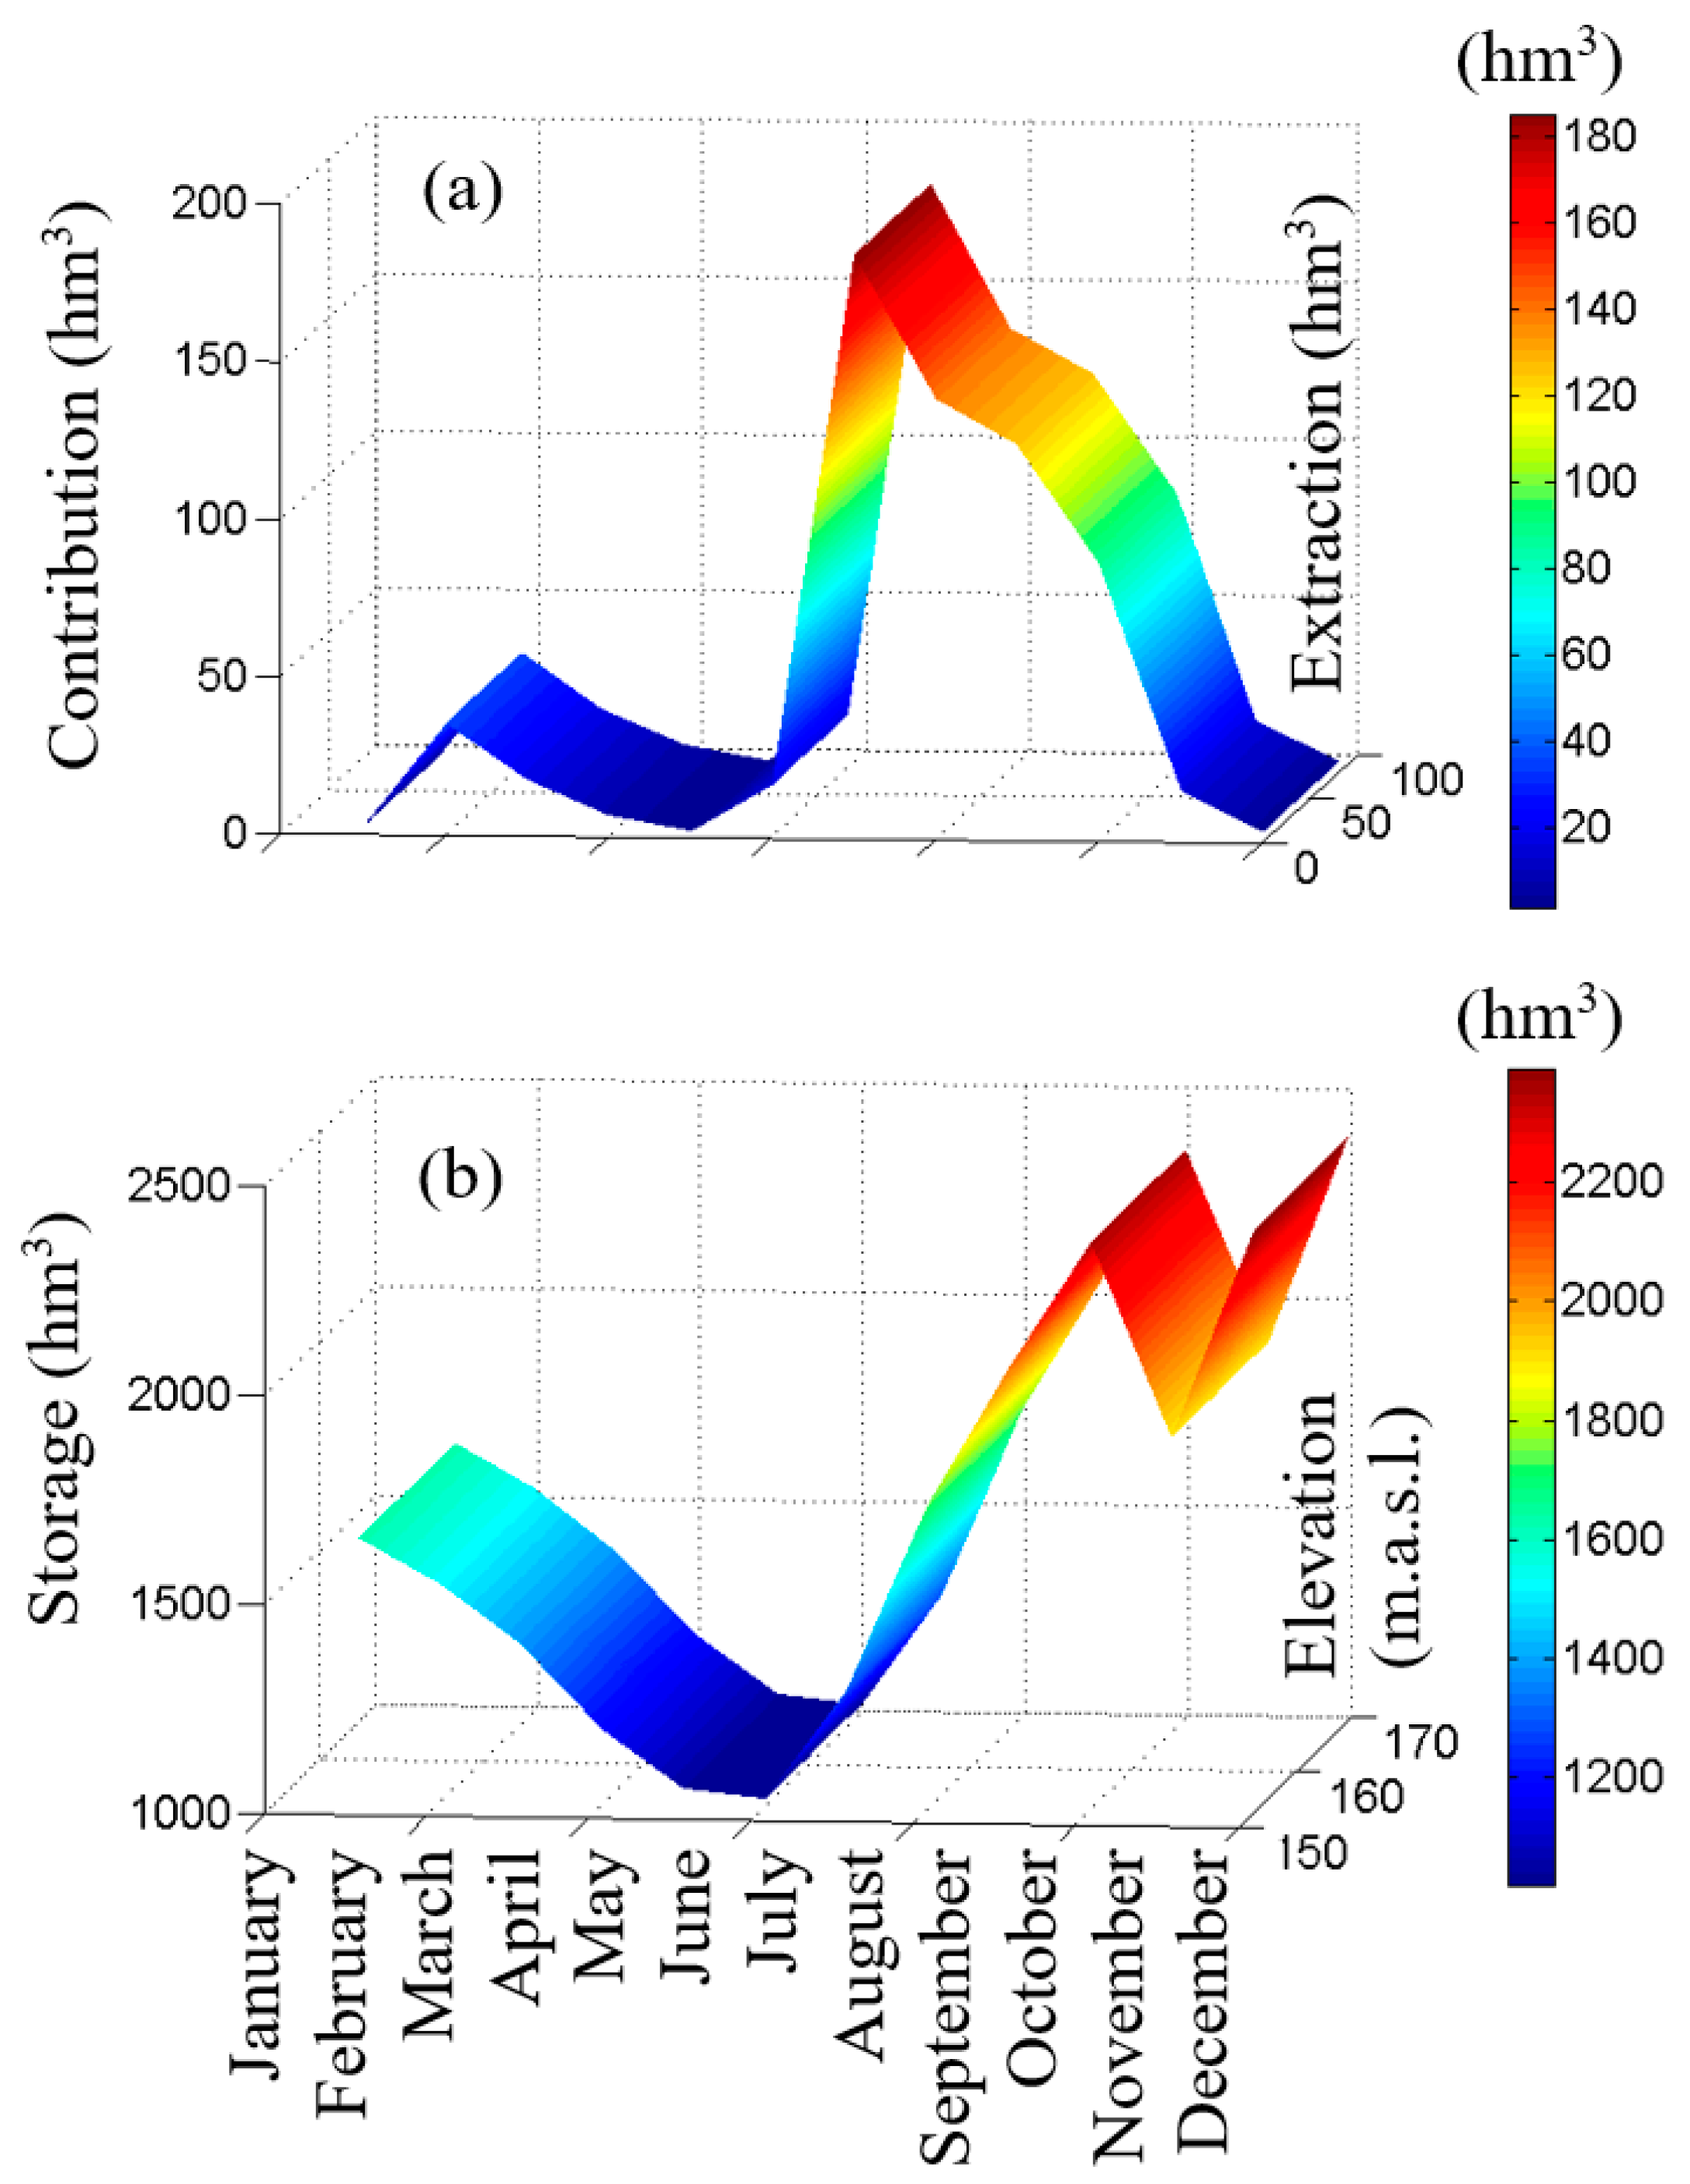
3.1. Hydrological Conditions

An analysis of hydrometrical parameters indicated that the variations of the quantity of stored water in the ALM reservoir are related to natural variations of the hydrologic cycle. The results also indicate slight variations in temperature, precipitation, and evaporation. The hydrological and climatic characteristics of the study area are summarized in Table 1.
The ambient temperature is a factor that could be related to the behavior of the water body. The average ambient temperature (at the reservoir area) is almost 20 °C, very similar to those observed by Rangel-Peraza et al. [31] for a tropical reservoir located at a subhumid warm climate area with summer rains. Water contributions and extractions were found with no significant monthly variation, as the volume storage of the reservoir was maintained along the period of time included in the study.
Figure 2a presents the input and extraction of water in the reservoir with respect to each month of the year. The colored scale represents the contribution (input) of water in the reservoir. Figure 2b presents the storage level of water in the reservoir, registered as the maximum elevation level of water. Figure 2a,b present a very similar tendency, since these parameters are related. The storage water in the reservoir depended on the contribution and extraction of the water. The water level in the reservoir was higher during the rainy season, and the lowest water levels were observed during the dry season, with a recurrent annual pattern. The rainy season was present from June to October, and the dry season included the rest of the year. The inflow was at a maximum during the summer and at a minimum during the winter months. Overall, the outflow was stable throughout the study period, indicating a stable water demand of the hydroelectric plant and the role of the reservoir for stabilizing downstream river flow [32,33]. This pattern has been repeated year after year because it is related to the natural variations of the hydrologic cycle.

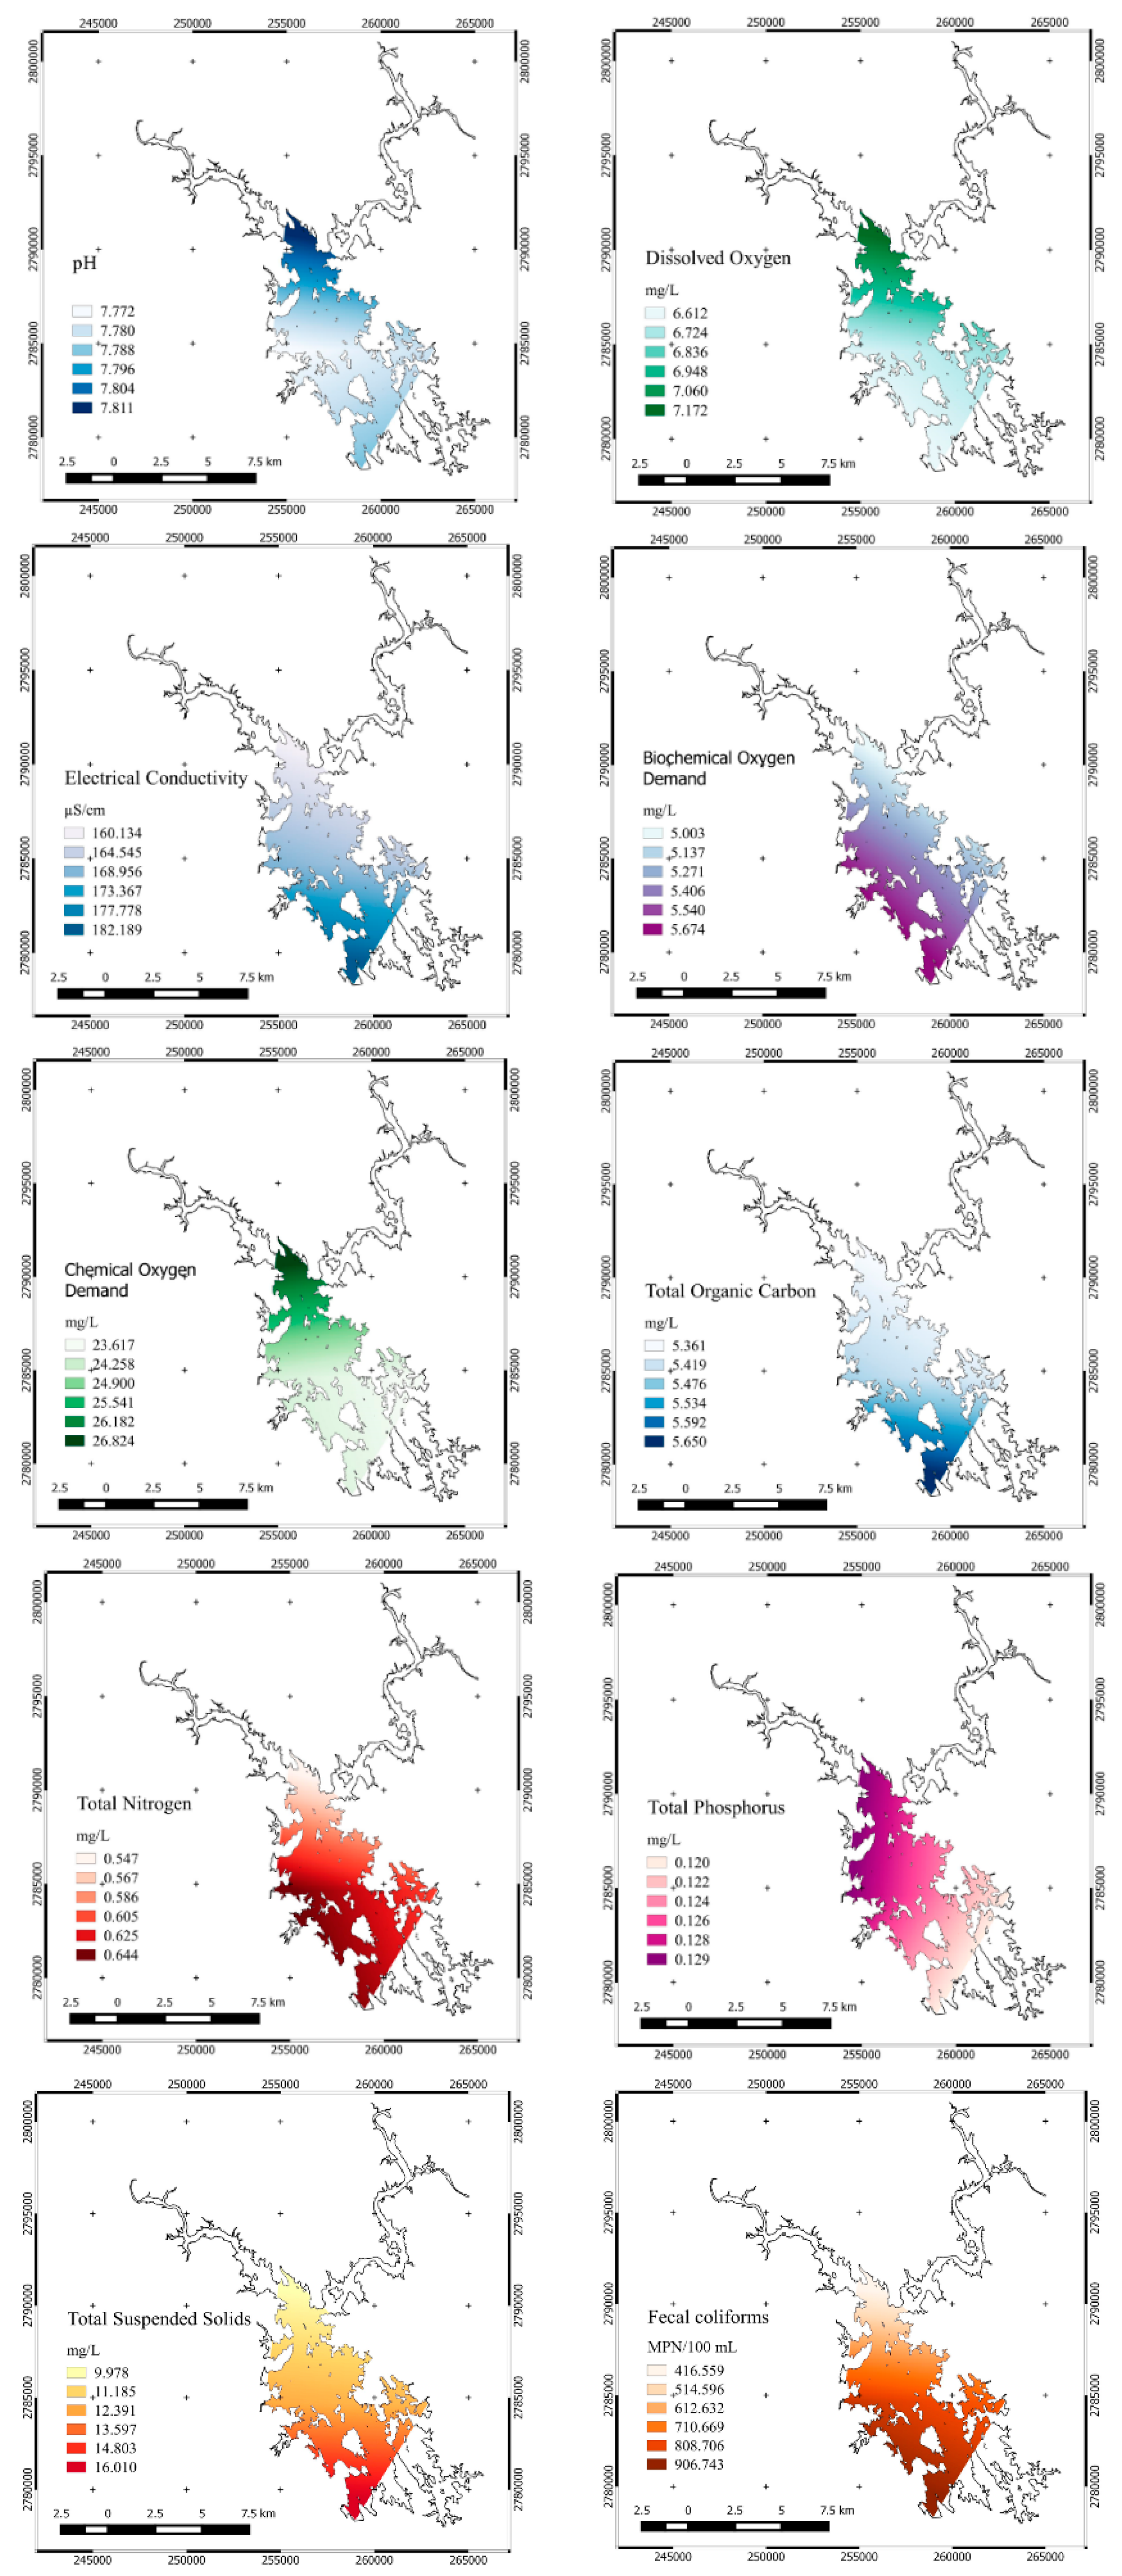
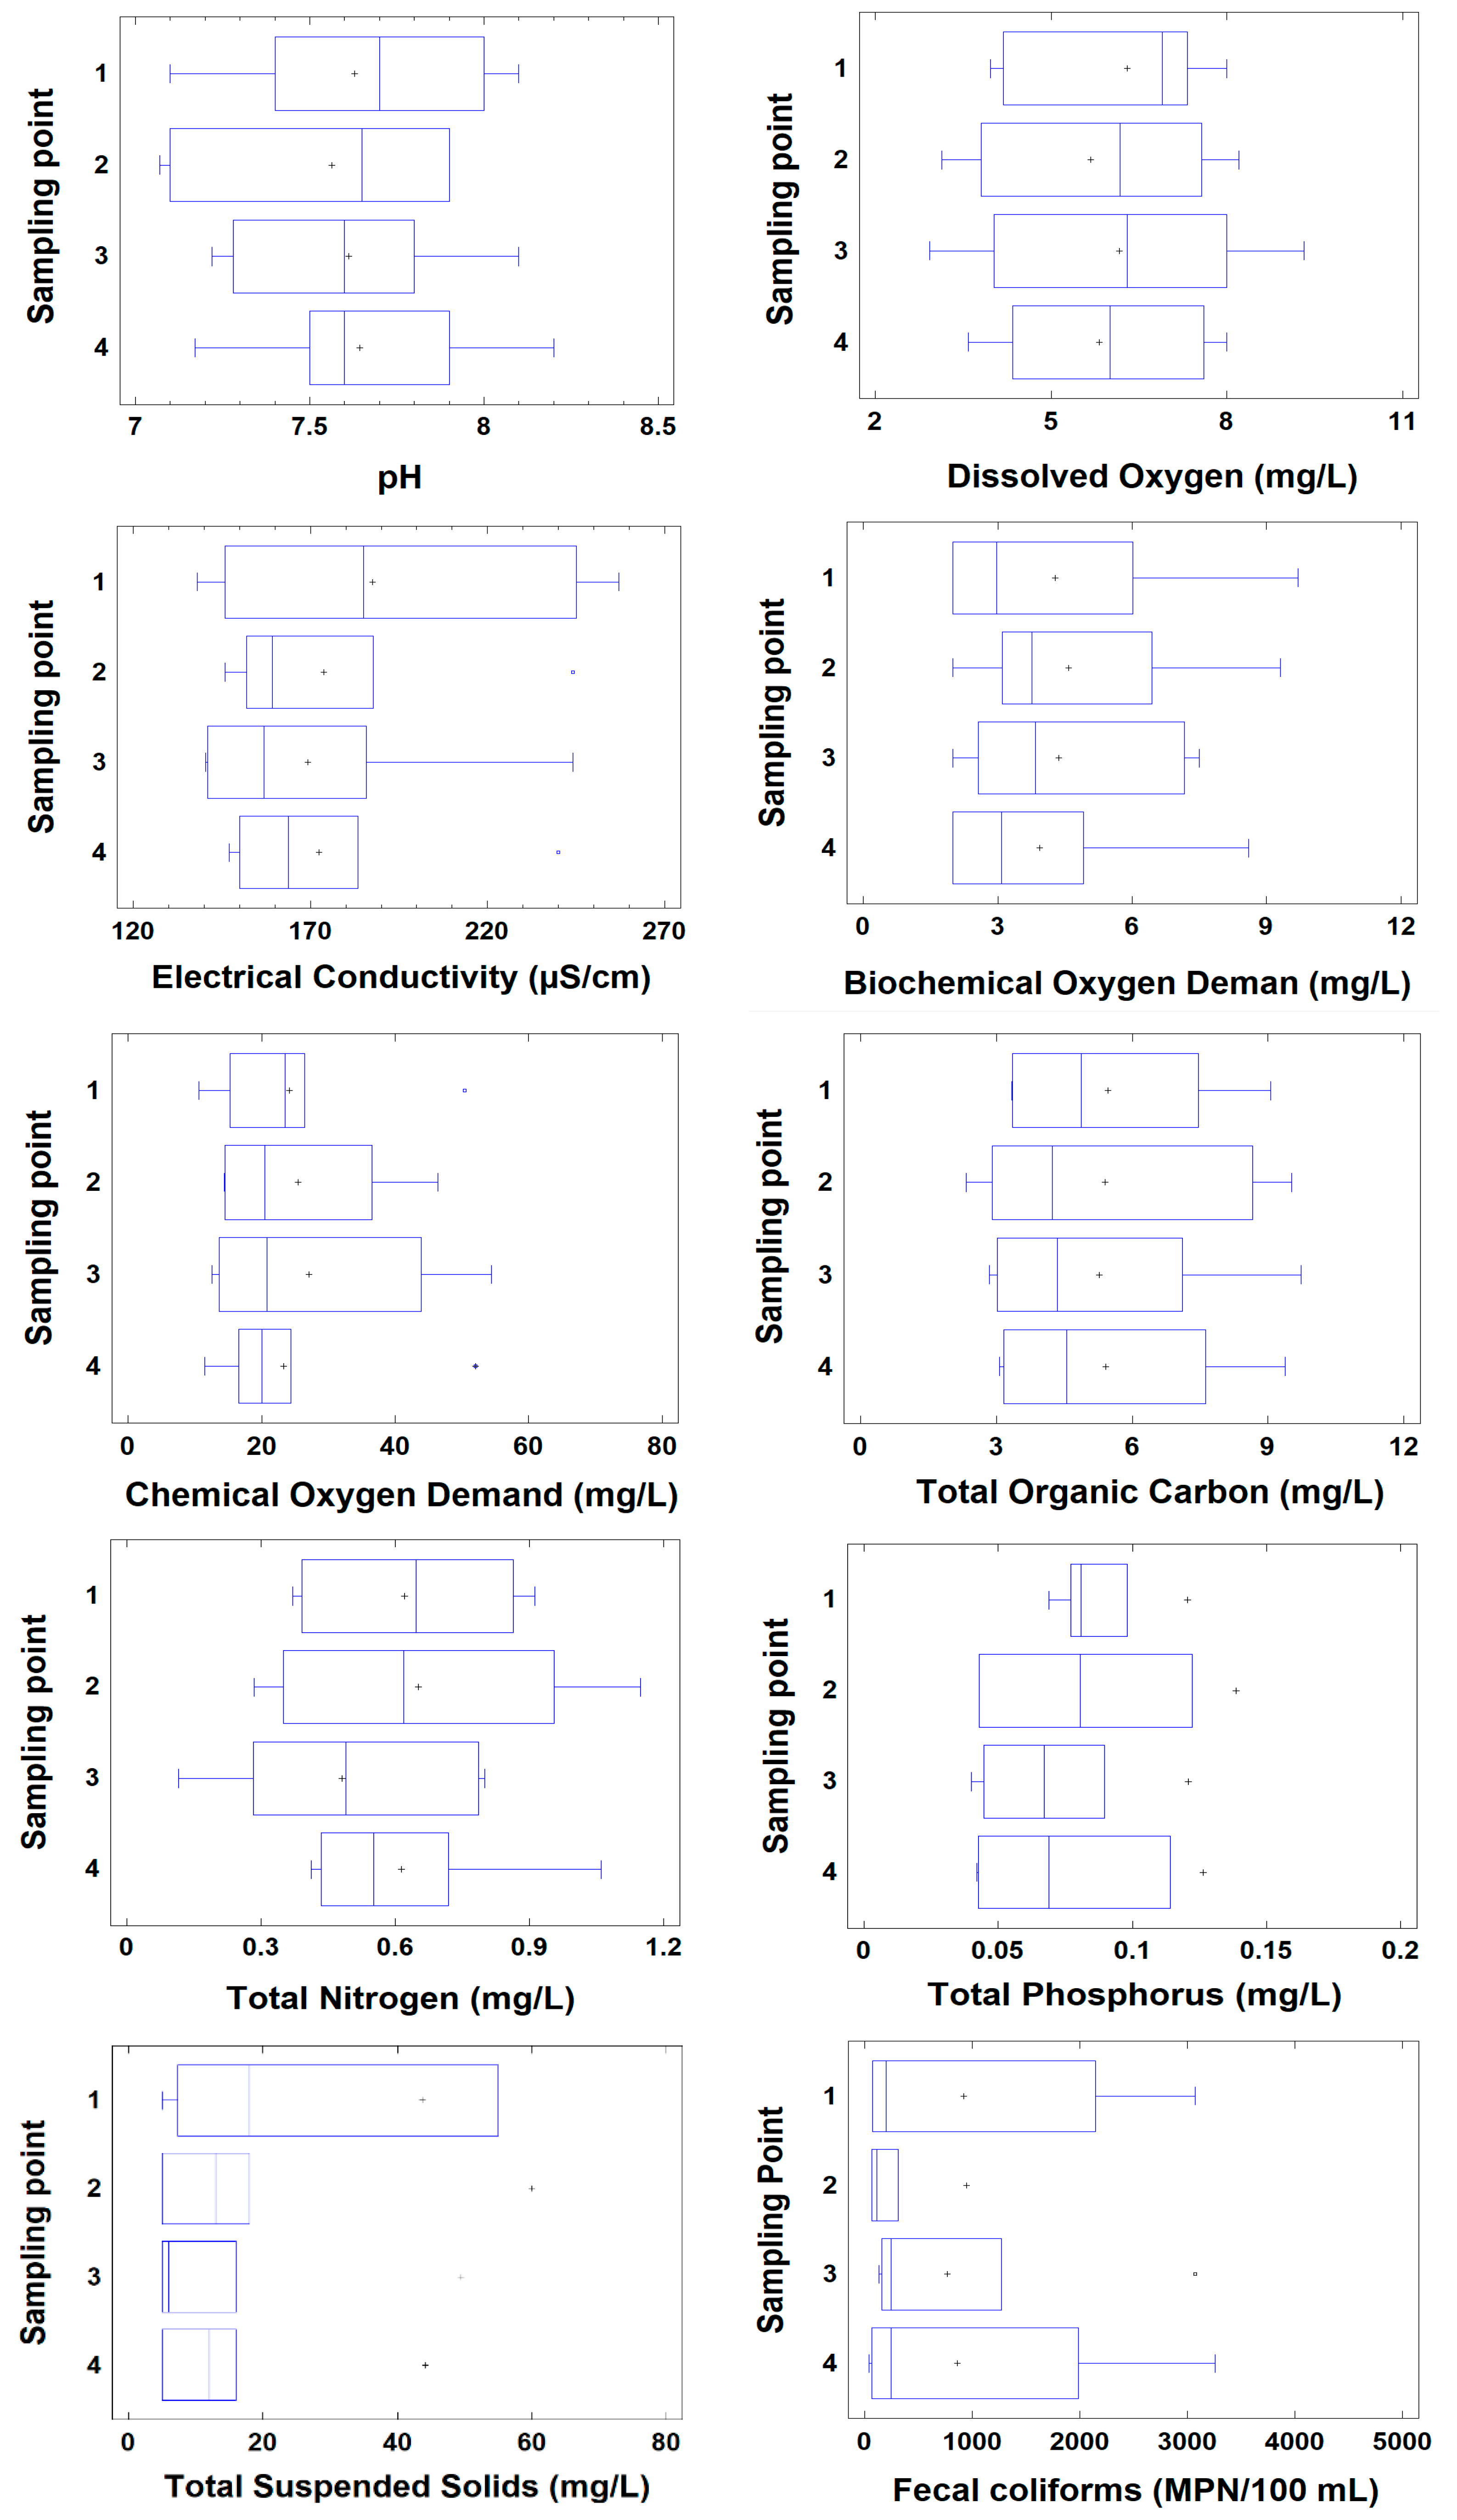
3.2. Temporal and Spatial Variations of Water Quality in the ALM Reservoir

According to the descriptive analysis, water surface temperature variations in the reservoir were related to ambient temperature variations. The range of water surface temperature observed in the ALM reservoir is considered normal in comparison with the temperature of similar studies carried out in others tropical water bodies [34,35,36]. Figure 3 shows the water temperature with respect to depth and elevation (meters above sea level, m.a.s.l.) in the ALM reservoir. In the period 2012–2018, the highest water temperature recorded was 34 °C on the surface of the reservoir, a temperature which decreased to 26.7 °C at the bottom. This temperature behavior was similar to that reported by other researchers [36,37]. The average water temperature was lower from October to March and higher from May to August. In general, higher average temperatures were recorded in summer, and lower averages were recorded in winter months. The depth of the water samples in the reservoir was variable at each sampling point; the maximum depth was 40 m for sampling point 2.
The descriptive analyses of the physicochemical parameters measured in the ALM reservoir are summarized in Table 2 and Table 3 for the spring and fall seasons, respectively. These water quality parameters were determined according to analytical procedures established by the American Public Health Association (APHA) in standard methods for the examination of water and wastewater [19]. It can be observed that turbidity and fecal coliforms were the parameters that showed the greatest coefficient of variation in both the spring and autumn seasons. Likewise, these parameters did not show a statistically significant difference between the means of the variables according to the ANOVA test (the P-value is greater than 0.05).
Figure 4 and Figure 5 present the spatial variation of the water quality parameters in the ALM reservoir. Figure 4 presents the box and whiskers diagrams of the main parameters of the water quality in the ALM reservoir. This graph describes several important characteristics of the distribution of the parameters. Data that were not within the ranges can also be observed. Figure 5 shows the behavior of the water quality parameters in the reservoir.
The dissolved oxygen is related to the water temperature. The solubility of oxygen decreases as temperature increases. This means that warmer surface water requires less dissolved oxygen to reach 100% air saturation. Dissolved oxygen is necessary to many forms of life including fish, invertebrates, bacteria, and plants. Therefore, a higher concentration of the dissolved oxygen is related to good water quality conditions in water bodies. The mean dissolved oxygen in the surface water in the ALM reservoir remained over 6.85 mg/L. The high concentration of dissolved oxygen observed in surface waters of the ALM reservoir was related to photosynthesis and the oxygen that is exchanged with the atmosphere by diffusion or turbulent mixing. This finding suggests that the reservoir surface water is good for fish production. These concentrations were similar to those reported by Yu et al. [38] and Malik and Nadeem [36]. According to Figure 5, a higher DO concentration was observed at the entrance of the dam, but this concentration difference was slight compared to the rest of the reservoir.
The average electrical conductivity was 160.46 and 171.41 µS/cm for the spring and fall seasons, respectively. No significant statistical difference between seasons was found for electrical conductivity. This value was very similar to that reported by Varol et al. [39], and these values were greater than those reported by Chittoor et al. [33] but lower than those reported by Palma et al. [40] and Yu et al. [38]. The electrical conductivity showed a slight variability in both seasons. Higher conductivity values were observed in the rainy season due to the erosion process in the basin.
For both electrical conductivity and TSS, lower concentrations were observed towards the north of the reservoir (Figure 5), where the confluence of the Badiraguato and Humaya Rivers is located. No statistical difference was observed for TSS concentration. Mean TSS concentrations of 9.612 mg/L and 10.2835 mg/L were registered for the spring and fall seasons, respectively. According to Figure 5, a lower TSS concentration was observed at the entrance of the dam, and a higher concentration was observed in the center and towards the south of the reservoir. These results were consistent with those observed by Varol et al. [39] and Toor et al. [35], where run-off was recognized as the major source of solid suspended material in water bodies.
A parameter that is related to TSS is turbidity. The turbidity depends on the materials suspended in the water column. The reservoir presented an average turbidity of 3.467 and 8.825 NTU during the spring and fall seasons, respectively. Turbidity was higher in the rainy season, possibly due to higher incoming flows or run-offs. These results were consistent with those observed by Ciric et al. [41] and Toor et al. [35]. The aforementioned behavior was similar for chlorophyll-a. Secchi depth ranged from a minimum of 1.3 m to a maximum of 3.4 m for the sampling points, while the true color was observed from 15 to 25 UPt/Co. According to the water authority [17], these values do not represent any affectation of the reservoir.
The TOC, COD, and BOD are indicators of organic matter pollution in water bodies. These indicators are typically related to industrial and domestic wastewater discharges [39,42]. According to Figure 5, a lower organic material (TOC and BOD) concentration was observed at the entrance of the reservoir, and a higher concentration of organic matter was located in the center and towards the south of the reservoir, near sampling point 4. These concentrations of organic matter remained very similar, and no significant variations were observed during the study period. Organic matter values were similar to those obtained in Rawal Lake Reservoir [36] and lower than those reported in Palma et al. [40]. The mean values for five years sampling in the ALM reservoir suggest that this reservoir shows no organic matter pollution, which coincides with the high values of dissolved oxygen recorded in the present study.
The contamination of water resources by pathogenic organisms and micropollutants is a major problem in many parts of the world, including Latin America. The existence of coliform bacteria in the reservoir represents a risk to public health and to the multiple uses for the reservoir [37,43,44]. The mean concentration of fecal coliform bacteria registered in the ALM reservoir during the study period was lower than the recommended limits for fishing and navigation purposes. Based on these criteria, the surface water in the ALM reservoir is suitable for any of the aforementioned uses. Nevertheless, it has been observed that fecal coliforms exceeded the recommended limits for fishing and navigation in sampling sites 1 and 4 (Figure 4). Possibly, cattle grazing on lands close to the reservoir, runoff, and the lack of sanitation infrastructure for the human settlements and wastewater treatment systems in the surrounding area may be the cause for the fecal pollution concentrations observed in this study [42]. According to Figure 5, a lower FC concentration was observed at the entrance of the dam, and a higher concentration of the contaminant was observed in the center and towards the south of the reservoir.

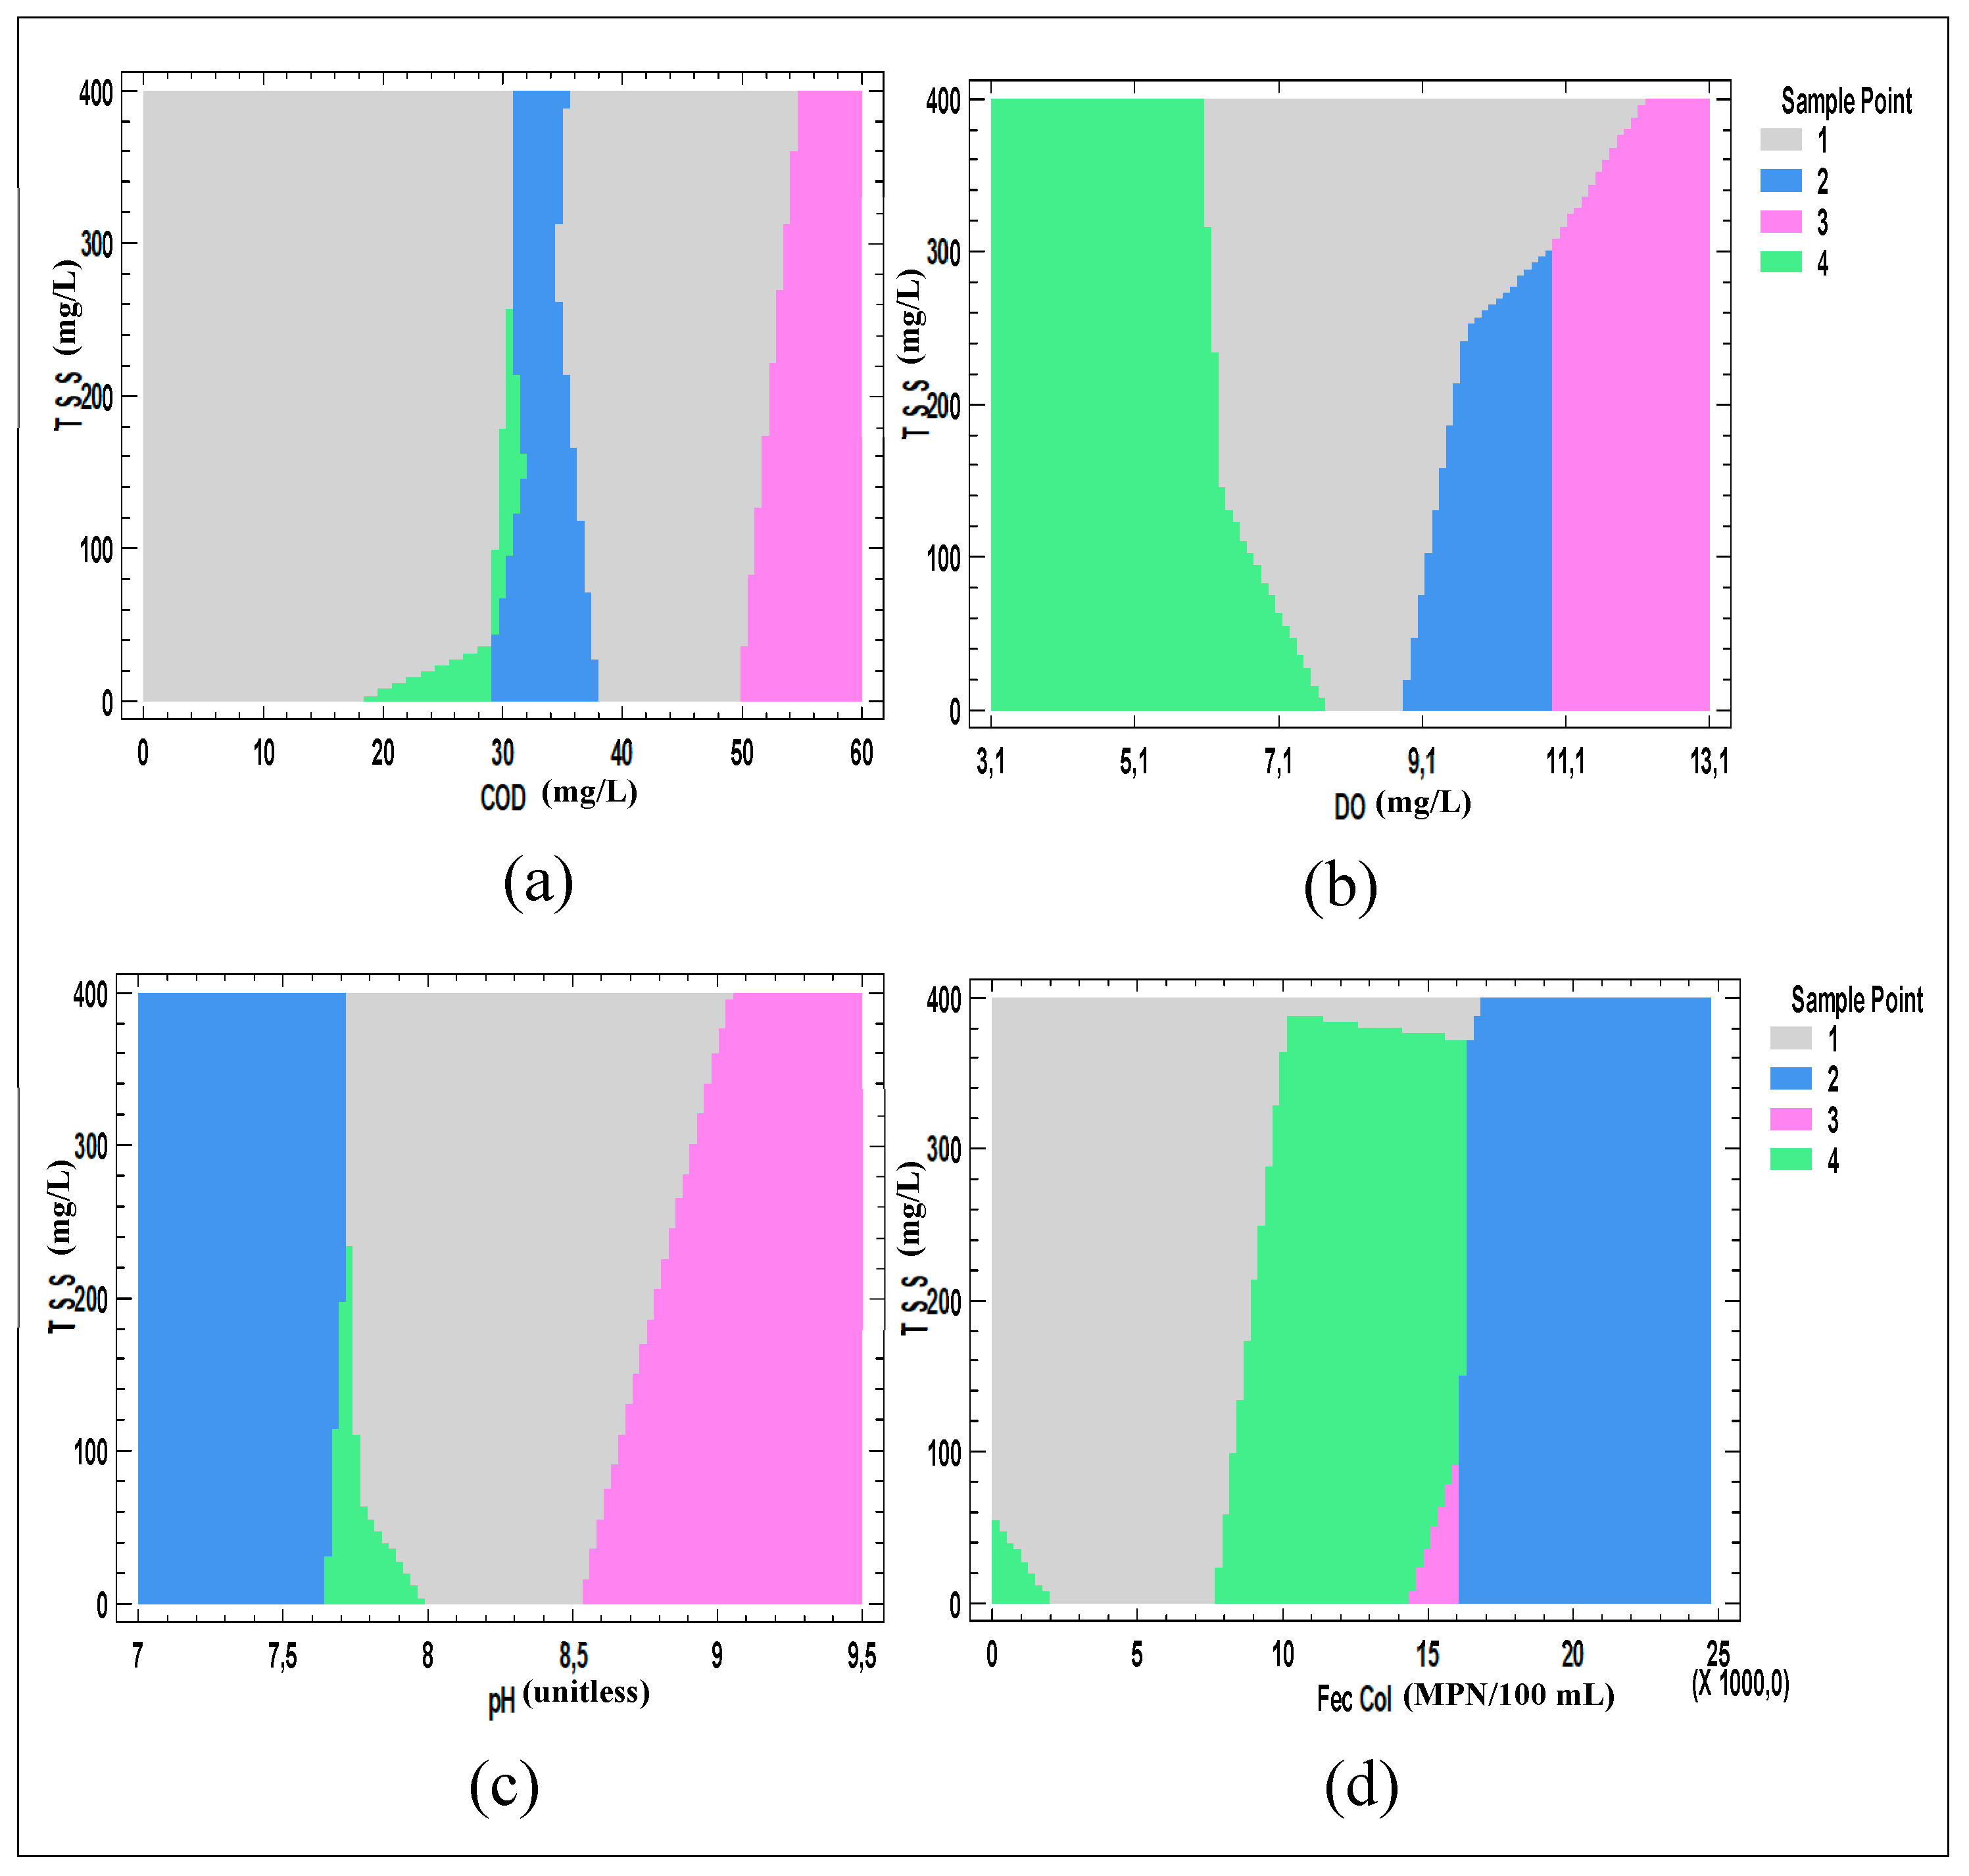
3.3. Spatial Classification of Parameters by Probabilistic Neural Network

The probabilistic neural network classifier (PNNC) analysis does not depend on a linear correlation that may exist between the water quality variables like principal component analysis does. PNNC is independent of the similarity between variables (given by variance), which is the principle of heuristic methods like nearest neighbor analysis. In PNNC analysis, combinations are established from the connection between each neural unit, generating a mathematical model that detects solutions or characteristics difficult to express with any other method [45]. This combination is a classification of each pair of variables, with significant interaction.
PNNC showed 37 different cases of the spatial distribution that can be obtained in the ALM reservoir. For this analysis, each case of spatial distribution was defined as a set of variables that could be statistically attributed or classified based on the water quality information obtained during the five years of sampling. This multi-parametrical analysis described the spatial distribution of water quality variables within its possible range of concentrations. PNNC analysis identified that the combination of TSS with COD, OD, fecal coliforms, and pH can only be detected in the four sampling sites. These combinations served as neural model output layers. Through this multi-parametric analysis, it was observed that the COD, DO, pH, and fecal coliforms were dependent on the spatial behavior of the TSS (Figure 6).
Figure 6a shows a high variability of COD in site 1. At this site, values from 0 mg/L to 30 mg/L were dominant, but values from 35 mg/L to 54 mg/L could be also observed. In site 2, a slight variation in the COD concentration was observed. In this site, COD varied from 29 mg/L to 38 mg/L. Though a slight variation in COD concentrations was also shown in site 3, the values obtained in this sampling site were the highest from a spatial point of view. Figure 6b shows a clear difference in the distribution of dissolved oxygen concentration at the sampling sites. The PNNC results coincide with the spatial behavior discussed previously for this parameter, where the highest DO concentration was observed at the entrance of the reservoir, and the lowest concentrations were found in the center and towards the south of the reservoir. Similar spatial behavior was observed for pH and fecal coliforms. Differences between water quality features were shown in the different sampling sites. This spatial behavior meets the characteristics suggested for reservoir water quality modeling [31].

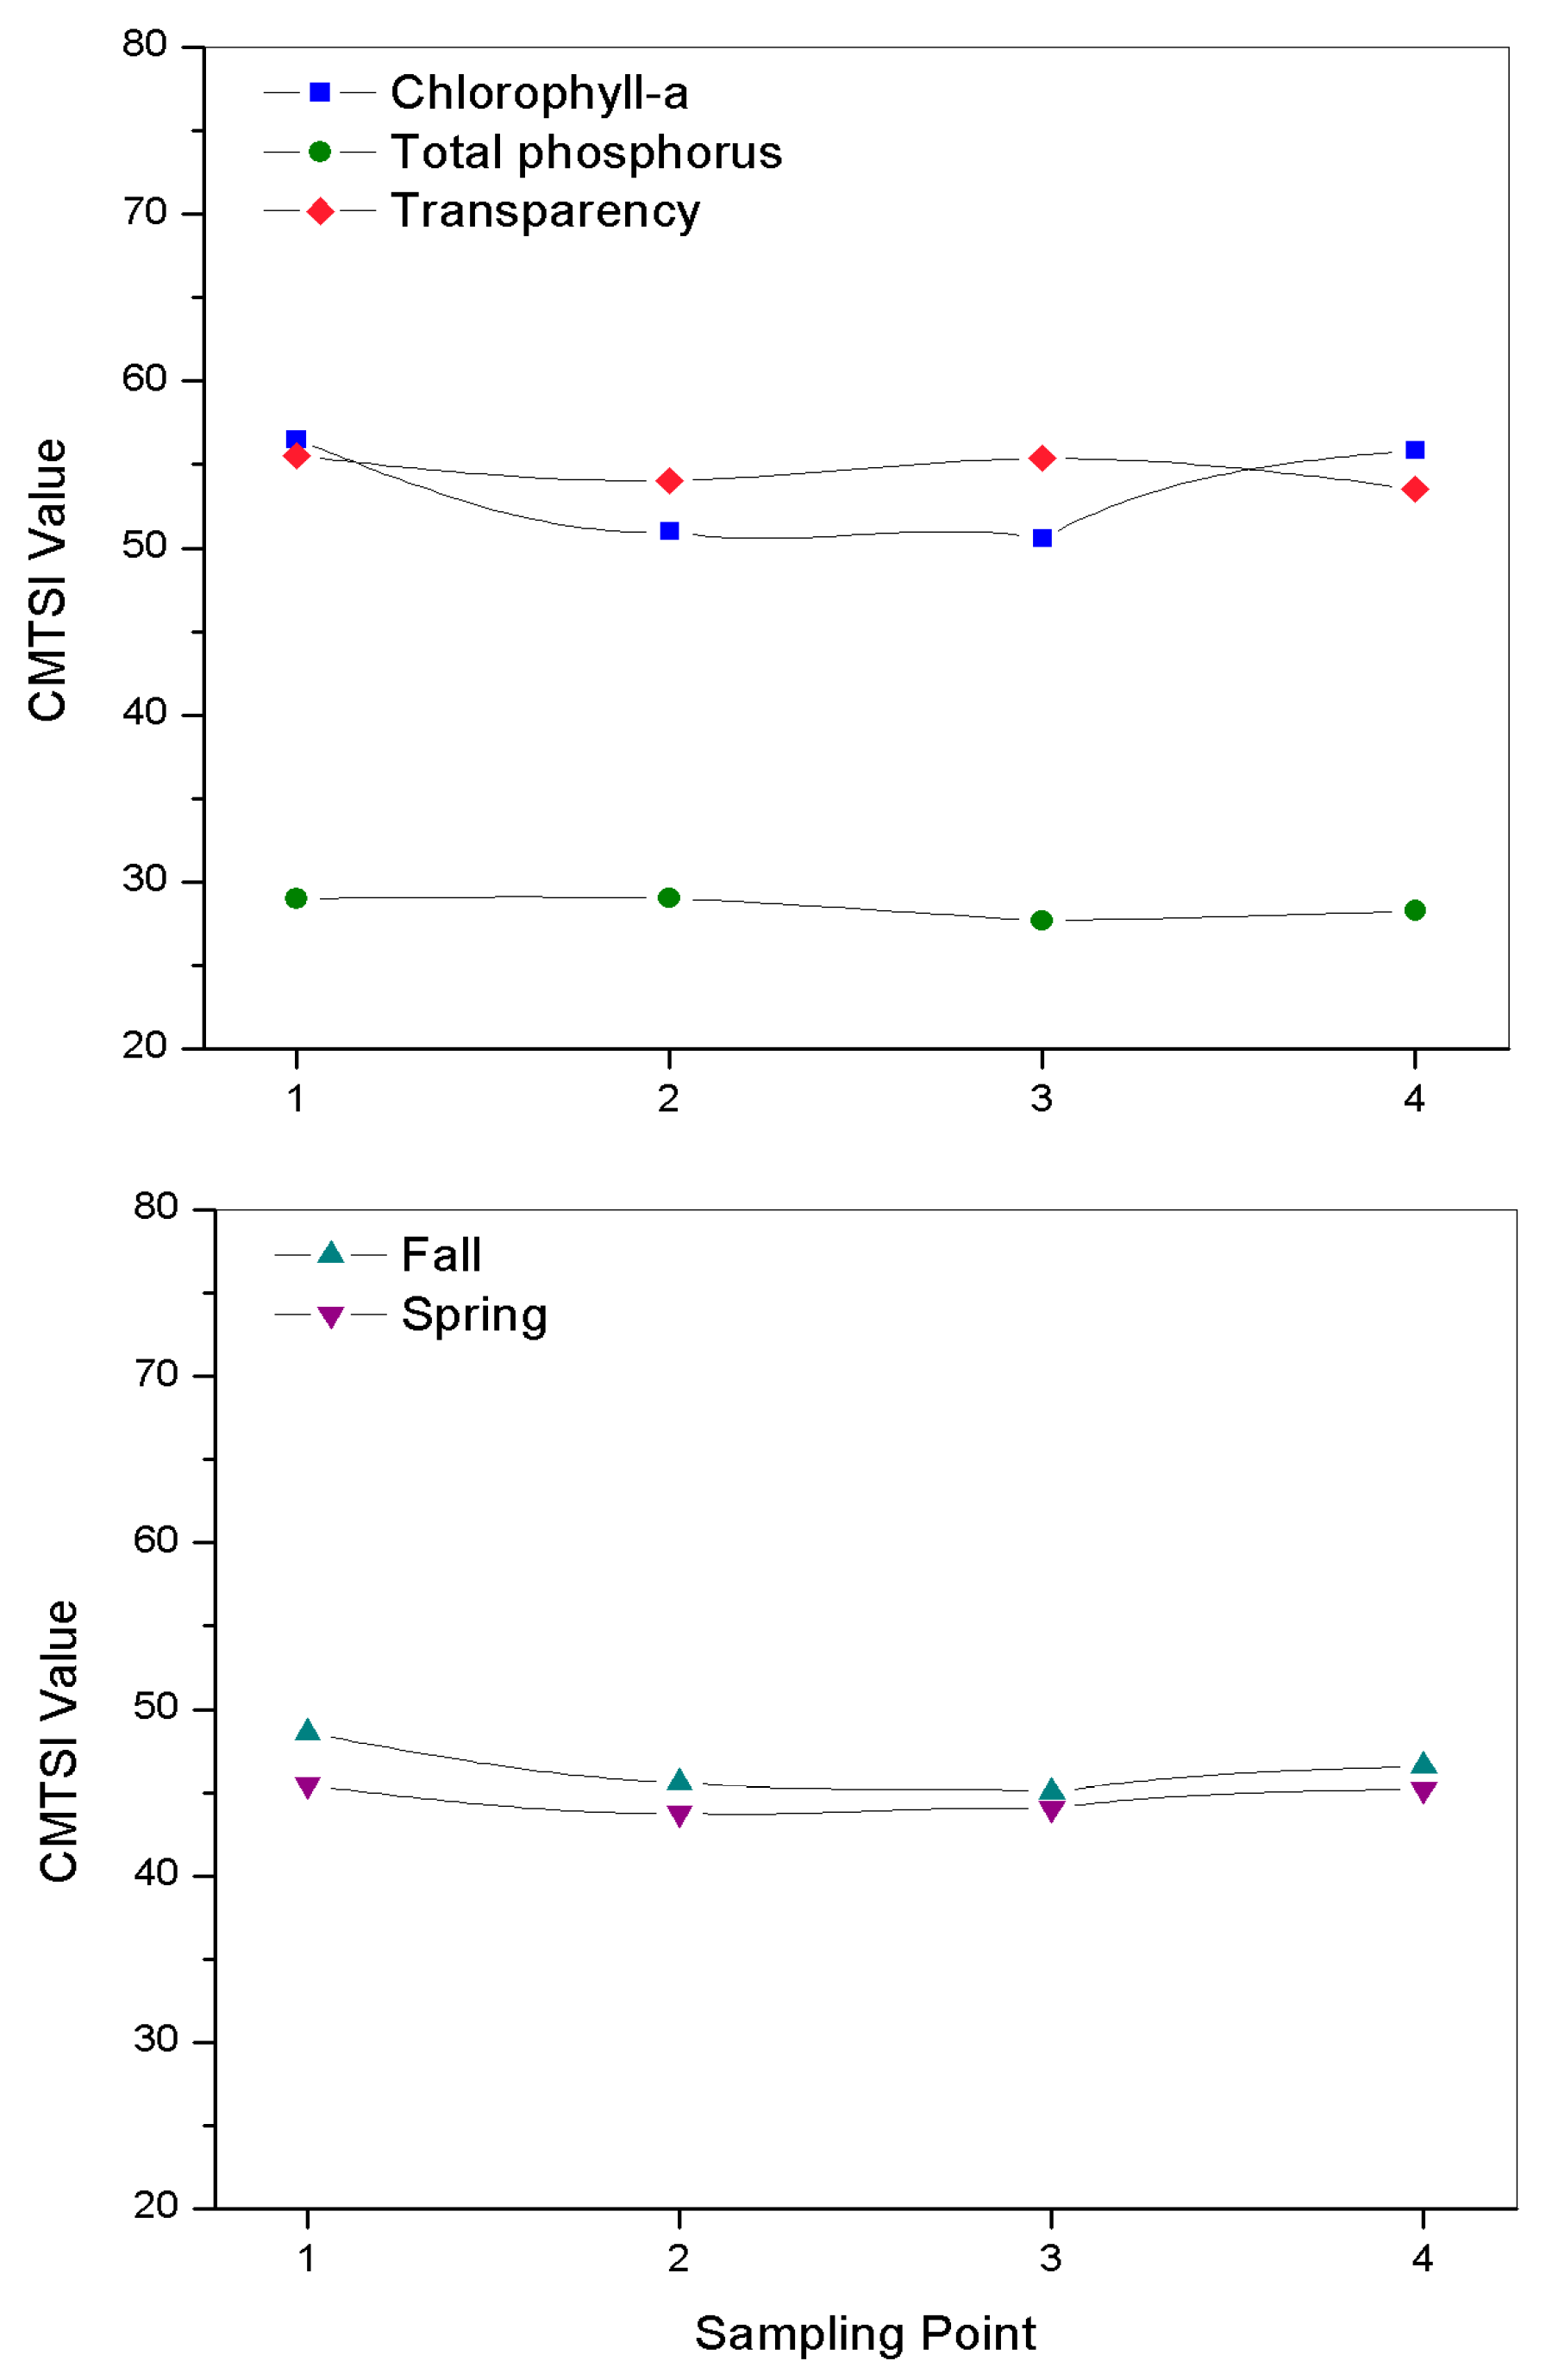
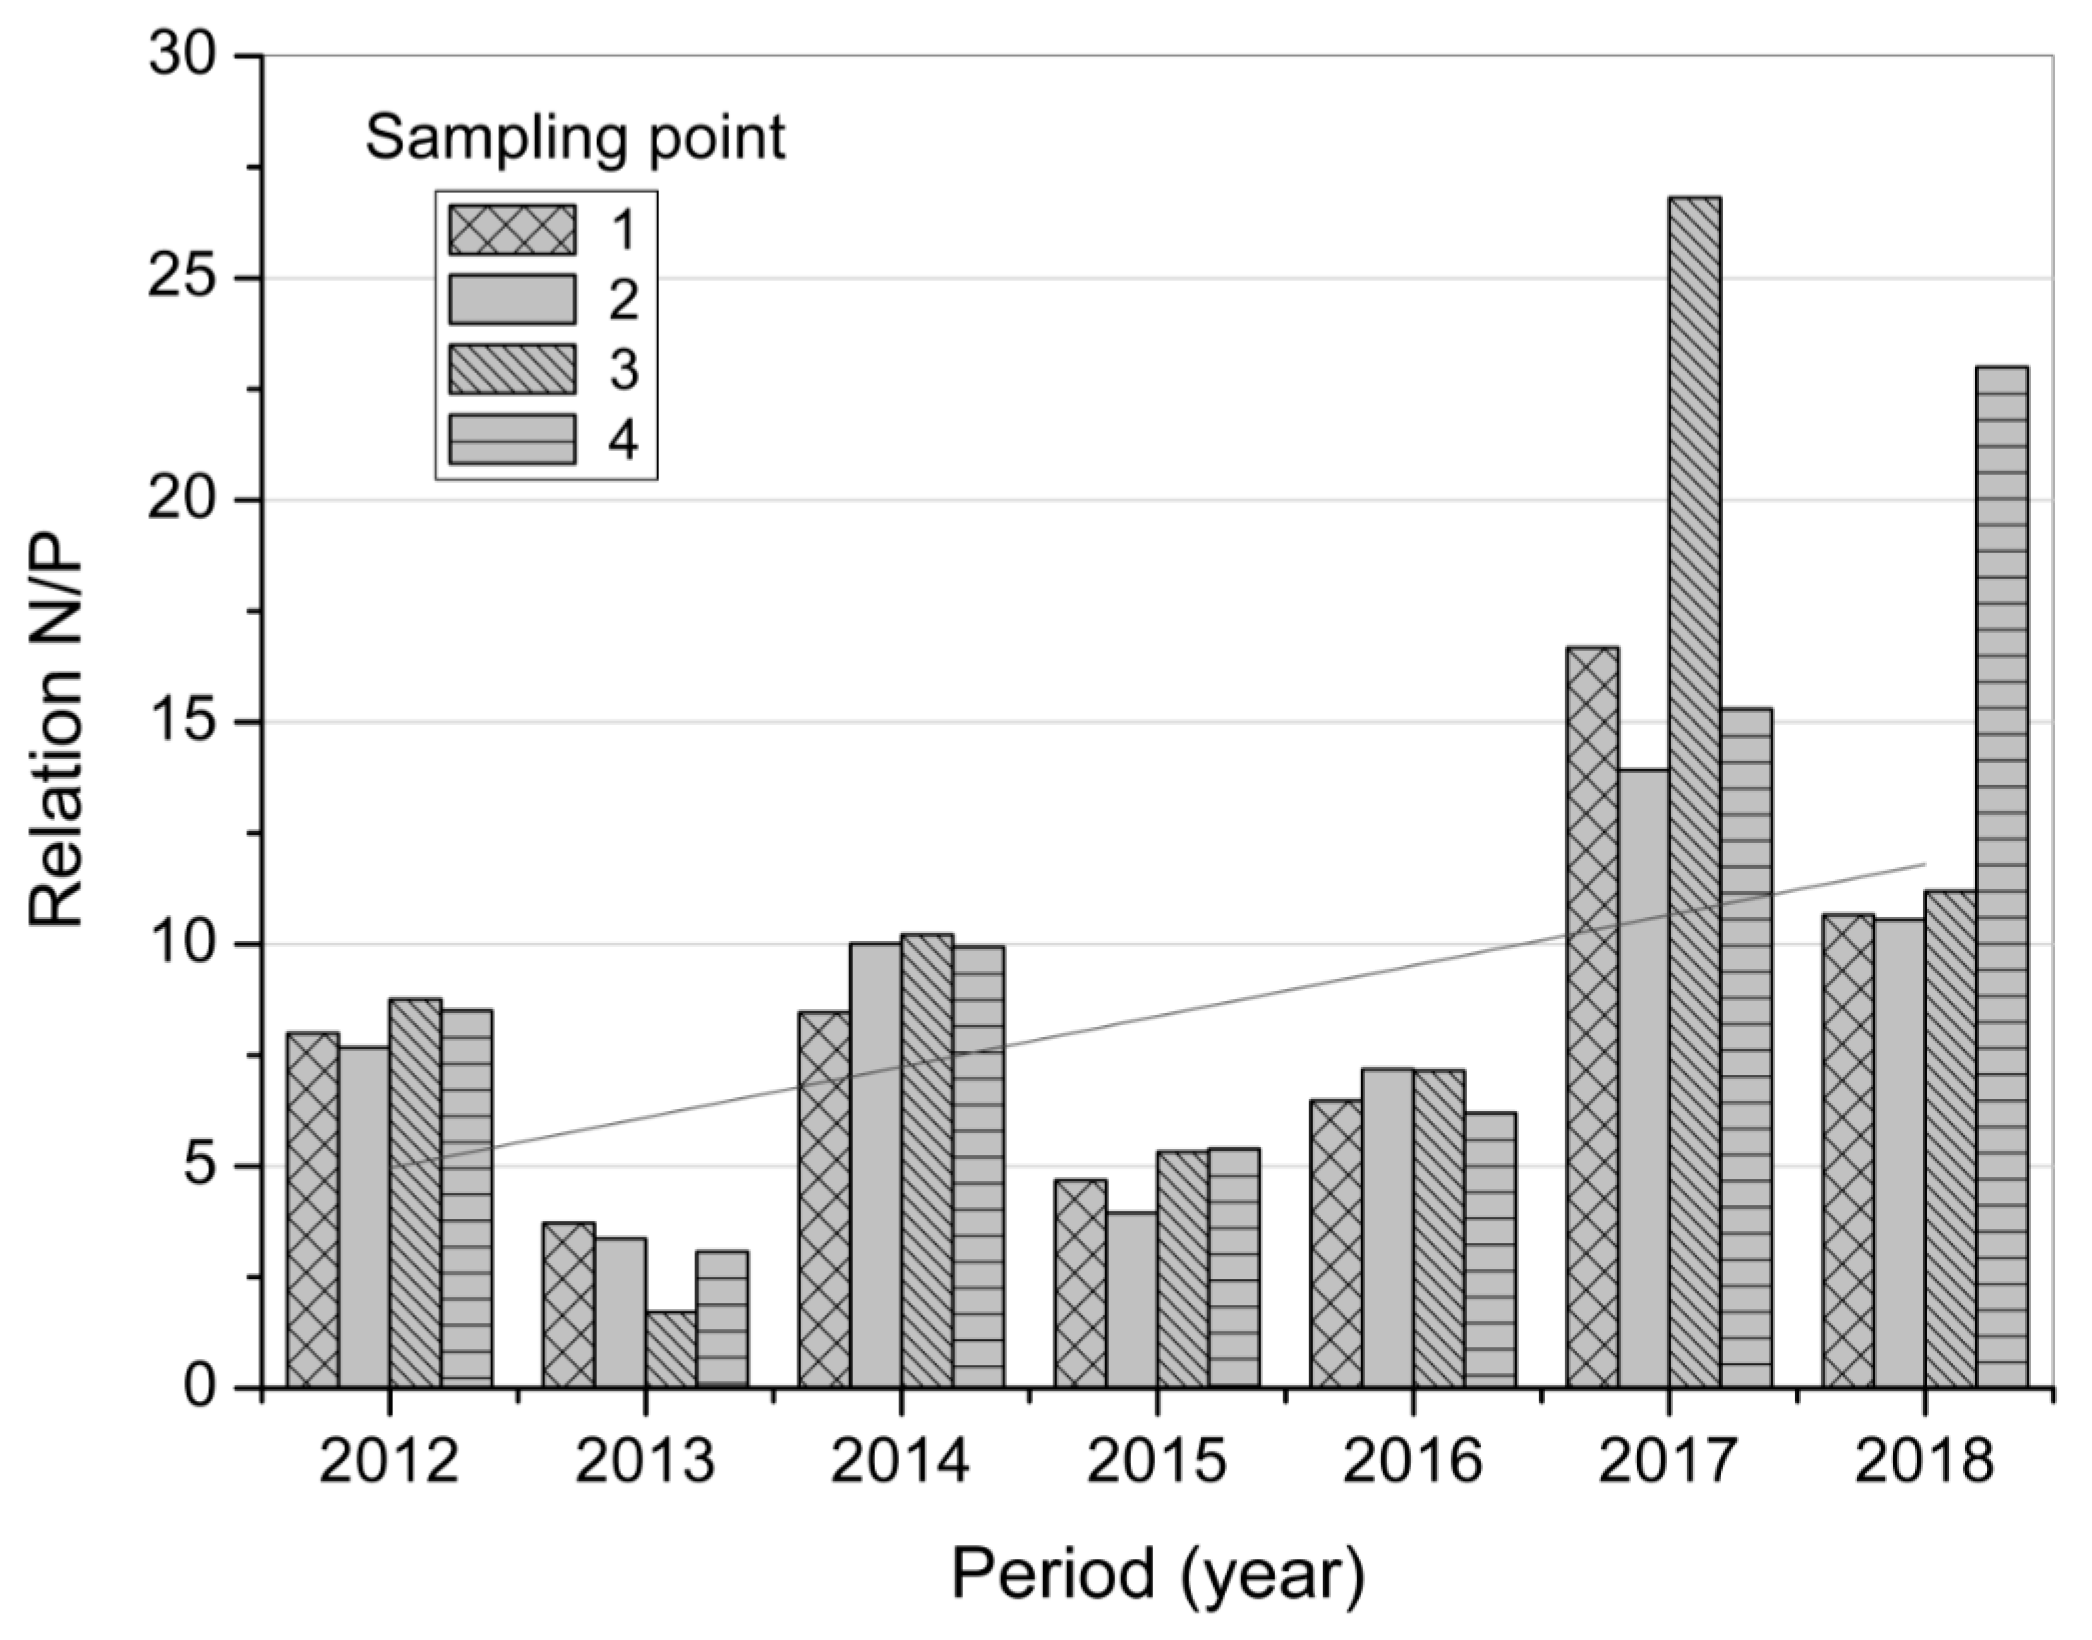
3.4. Trophic Status of the Reservoir

A water body trophic state depends on nutrient levels. The trophic status assesses water body changes by simplifying complex environmental variables. Maznah and Makhlough [22] suggested a trophic state index which also includes chlorophyll-a. This index has been found to be reliable for quantifying the trophic state in tropical water bodies [46,47].
The Carlson Modified Trophic State Index (CMTSI) was computed in the ALM reservoir by using Equations (1)–(4) with the mean values of chlorophyll-a, total phosphorus, total nitrogen, and Secchi disk depth (SD) during the study period (2012–2018). According to the CMTSI obtained, results indicate that the trophic state of the ALM reservoir was maintained as mesotrophic (40–50) over time (Figure 7) [30]. The value of the CMTSI was similar in the four sampling sites. The CMTSI calculated on the basis of nutrients (total phosphorus) showed lower values than the one calculated using the concentration of transparency and chlorophyll-a [2]. Hence, the total phosphorus was the parameter that showed the least influence in trophic status calculation. These results were very similar to those reported by Mazhan and Makhlougl [22] and Vidović et al. [2]. Similar results have also been published by Quevedo-Castro et al. [48].
Nitrogen and phosphorus are indicators of eutrophication by anthropogenic sources. High levels of nutrients are also related to the presence of pesticides and fertilizers. The mean concentration of total nitrogen in the ALM reservoir was 0.57 mg/L, and the mean concentration of total phosphorus was 0.12 mg/L. These values were similar to those reported by Li et al. [42]. Thus, the nitrogen/phosphorus ratio was used to define the limiting element in the growth of aquatic plants. This concept was suggested based on the cellular stoichiometry of aquatic plants. The nutrient that controls the maximum amount of plant biomass is the one that is first consumed or reaches a minimum value before the other nutrient. In general, when N/P ratio is less than 9, nitrogen is the limiting element, and when N/P > 9, phosphorus controls biomass growth. This is subject to variation according to the stoichiometry of the plants. The relation of total nitrogen and total phosphorus proposed by Vollenweider [49] was used in this study.
Figure 8 shows the N/P relation at the four sampling points in the reservoir for 2012–2018. The mean N/P ratio obtained in this study was 7.2. An important positive trend was observed since 2017. High concentrations of total nitrogen (0.73 mg/L) were found in sampling point 3 in comparison with the total phosphorus (0.03 mg/L). This situation is also observed in 2018, where a great N/P ratio was observed at the sampling point 4. In this way, the reservoir was generally limited by nitrogen in 2012, 2013, 2015, and 2016; it was not limited by nitrogen in 2014, 2017, and 2018. The behavior of these parameters between sampling points during the spring and fall seasons was similar in the years 2012–2016. This situation agrees with Vidović et al. [2] who suggested that the subtraction of indexes CMTSI (Chl-a) – CMTSI (TP) < 0 indicated that phosphorus could not be considered as limiting factor of algal production. Sakka et al. [50] and Perkins and Underwood [51] mentioned that a tropical water body could show different nutrient limitations in each season—i.e., during winter nitrogen, could be limited by nitrogen, and, during summer, it could be limited by phosphorus. They also mentioned that the increase of nutrients in the reservoir may influence algae proliferation. It is important to mention that algae blooms are usually observed in the ALM reservoir.

4. Conclusions

In this study, a spatial and temporal behavior of nine water quality parameters was evaluated semiannually across seven years (2012–2018). Some water quality parameters, such as temperature and dissolved oxygen, were related to climatic conditions, while other parameters, such as conductivity and TSS, were associated with the hydrological regime (rainy season). The ALM reservoir showed no organic matter pollution according to TOC, COD, and BOD values observed in surface waters. Besides, the mean concentration of fecal coliform bacteria registered in the ALM reservoir during the study period was lower than the recommended limits for fishing and navigation purposes.
A multi-parametric analysis was carried out to describe the spatial distribution of water quality variables within its possible range of concentrations. PNNC analysis identified that the COD, DO, pH, and fecal coliform values were dependent on the spatial behavior of the TSS. The spatial behavior for these parameters was described, showing that better water quality conditions were observed at the entrance of the reservoir. The water quality of the ALM reservoir decreased towards the south of the reservoir. Differences between water quality characteristics were shown in the different sampling sites. Based on this spatial analysis, the water quality behavior in the ALM reservoir can be considered for future modeling efforts.
The Carlson Modified Trophic State Index indicated that the trophic state of the ALM reservoir was mesotrophic (40–50). This conclusion was based on the nitrogen, phosphorous, and chlorophyll-a concentrations and Secchi disk depths measurements. The total nitrogen and total phosphorus ratio was 7.3. In this way, the reservoir was considered limited by nitrogen. According to the results obtained, an efficient reservoir management is necessary to prevent eutrophication and restore the water quality of the reservoir.

Author Contributions

Investigation, A.Q.-C. and Y.B.-T.; supervision, E.R.B.; writing—original draft, L.E.A.-S. and A.S.-G.; writing—review and editing, J.G.R.-P.

Acknowledgments

The authors would like to thank CONAGUA for their collaboration. This work was supported by CONACYT (Cátedras CONACYT 2014 Ref. 2572).

Conflicts of Interest

The authors declare no conflicts of interest.

References

  1. Mori, N.; Sugitani, K.; Yamamoto, M.; Tomioka, R.; Sato, M.; Harada, N. Major and minor elemental compositions of streambed biofilms and its implications of riverine biogeochemical cycles. Environ. Pollut. 2018, 243, 308–317. [Google Scholar] [CrossRef] [PubMed]
  2. Vidović, M.M.; Rodić, M.N.; Vidović, M.U.; Trajković, I.S.; Jovanić, S.Z. Assessment of the Trophic Status by Monitoring of Reservoir’s Water Quality. J. Water Resour. Prot. 2015, 7, 1–13. [Google Scholar] [CrossRef]
  3. Qiu, J.; Shen, Z.; Huang, M.; Zhang, X. Exploring effective best management practices in the miyun reservoir watershed, china. Ecol. Eng. 2018, 123, 30–42. [Google Scholar] [CrossRef]
  4. Klymiuk, V.; Barinova, S.; Fatiukha, A. Algal bio-indication in assessment of hydrological impact on ecosystem in wetlands of “slavyansky resort”. Transylv. Rev. Syst. Ecol. 2015, 17, 63–70. [Google Scholar] [CrossRef]
  5. Zhao, G.; Kondolf, G.M.; Mu, X.; Han, M.; He, Z.; Rubin, Z.; Sun, W. Sediment yield reduction associated with land use changes and check dams in a catchment of the loess plateau, china. Catena 2017, 148, 126–137. [Google Scholar] [CrossRef]
  6. Yang, Z.; Cheng, B.; Xu, Y.; Liu, D.; Ma, J.; Ji, D. Stable isotopes in water indicate sources of nutrients that drive algal blooms in the tributary bay of a subtropical reservoir. Sci. Total Environ. 2018, 634, 205–213. [Google Scholar] [CrossRef] [PubMed]
  7. Park, J.; Nayna, O.; Begum, M.; Chea, E.; Hartmann, J.; Keil, R.; Yu, R. Reviews and syntheses: Anthropogenic perturbations to carbon fluxes in asian river systems—Concepts, emerging trends, and research challenges. Biogeosciences 2018, 15, 3049–3069. [Google Scholar] [CrossRef]
  8. Nyairo, W.N.; Owuor, P.O.; Kengara, F.O. Effect of anthropogenic activities on the water quality of Amala and Nyangores tributaries of River Mara in Kenya. Environ. Monit. Assess. 2015, 187, 691. [Google Scholar] [CrossRef] [PubMed]
  9. Jiang, Y.; He, W.; Liu, W.; Qin, N.; Ouyang, H.; Wang, Q.; Kong, X.; He, Q.; Yang, C.; Yang, B.; et al. The seasonal and spatial variations of phytoplankton community and their correlation with environmental factors in a large eutrophic Chinese lake (Lake Chaohu). Ecol. Indic. 2014, 40, 58–67. [Google Scholar] [CrossRef]
  10. Huang, T.; Li, X.; Ma, W.; Qin, C. Dynamic characteristics of nutrients and causal analysis in eutrofic reservoir: A case study of Shibianyu reservoir. Desalin. Water Treat. 2014, 52, 1624–1635. [Google Scholar] [CrossRef]
  11. Zhang, H.; Lyu, T.; Bi, L.; Tempero, G.; Hamilton, D.P.; Pan, G. Combating hypoxia/anoxia at sediment-water interfaces: A preliminary study of oxygen nanobubble modified clay materials. Sci. Total Environ. 2018, 637, 550–560. [Google Scholar] [CrossRef] [PubMed]
  12. Semedo-Aguiar, A.; Pereira-Leal, J.; Leite, R. Microbial diversity and toxin risk in tropical freshwater reservoirs of cape verde. Toxins 2018, 10, 186. [Google Scholar] [CrossRef] [PubMed]
  13. Morrison, J.; Baker, K.; Zamor, R.; Nikolai, S.; Elshahed, M.; Youssef, N. Spatiotemporal analysis of microbial community dynamics during seasonal stratification events in a freshwater lake (grand lake, OK, USA). PLoS ONE 2017, 12, e0177488. [Google Scholar] [CrossRef] [PubMed]
  14. Gomes de Quevedo, C.M.; Da Silva, P.W. Detergents as a source of phosphorus in sewage: The current situation in Brazil. Water Air Soil Pollut. 2016, 227, 1–12. [Google Scholar] [CrossRef]
  15. Gillett, N.; Pan, Y.; Asarian, J.; Kann, J. Spatial and temporal variability of river periphyton below a hypereutrophic lake and a series of dams. Sci. Total Environ. 2016, 541, 1382–1392. [Google Scholar] [CrossRef] [PubMed]
  16. Wu, Z.; Zhang, Y.; Zhou, Y.; Liu, M.; Shi, K.; Yu, Z. Seasonal-spatial distribution and long-term variation of transparency in xin’anjiang reservoir: Implications for reservoir management. Int. J. Environ. Res. Public. Health. 2015, 12, 9492–9507. [Google Scholar] [CrossRef] [PubMed]
  17. CONAGUA. Water Statistics in Mexico, 2015th ed.; Ministry of Environment and Natural Resources: Coyoacan, Mexico, 2015. Available online: http://www.conagua.gob.mx/CONAGUA07/Publicaciones/Publicaciones/EAM2015_ing.pdf (accessed on 13 May 2018).
  18. Sanhouse-Garcia, A.; Bustos-Terrones, Y.; Rangel-Peraza, J.; Quevedo-Castro, A.; Pacheco, C. Multi-temporal analysis for land use and land cover changes in an agricultural region using open source tools. Remote Sens. Appl. Soc. Environ. 2017, 8, 278–290. [Google Scholar] [CrossRef]
  19. APHA (American Public Health Association). Standard Methods for the Examination of Water and Wastewater, 21st ed.; American Public Health Association: Washington, DC, USA, 2005. [Google Scholar]
  20. Rangayyan, R.M.; Wu, Y. Screening of knee-joint vibroarthrographic signals using probability density functions estimated with parzen windows. Biomed. Signal Process. Control 2010, 5, 53–58. [Google Scholar] [CrossRef]
  21. Lewandowski, V.; Bridi, V.; Bittencourt, F.; Signor, A.; Boscolo, W.; Feiden, A. Spatial and temporal limnological changes of an aquaculture area in a neotropical reservoir. Ann. Limnol. Int. J. Lim. 2018, 54, 27. [Google Scholar] [CrossRef]
  22. Maznah, W.; Makhlough, A. Water quality of tropical reservoir based on spatio-temporal variation in phytoplankton composition and physico-chemical analysis. Int. J. Environ. Sci. Technol. 2014, 12, 221–2232. [Google Scholar] [CrossRef]
  23. Molisani, M.; Barroso, H.; Becker, H.; Parente, M.; Grossi, C.; Maia do Monte, T.; Harrison, G. Trophic state, phytoplankton assemblages and limnological diagnosis of the Castanhao Reservoir, CE Brazil. Acta Limnol. Bras. 2010, 22, 1–12. [Google Scholar] [CrossRef]
  24. Vollenwieder, R.A. The scientific basis of lake and stream eutrophication with particular reference to phosphorus and nitrogen as eutrophication factors. OECD 1998, 27, 1–182. [Google Scholar]
  25. Kubiak, J.; Machula, S.; Stepanowska, K.; Biernaczyk, M. Evaluation of trophic level of the largest dimictic lakes of western Pomerania based on the Carlson criteria. Limnol. Rev. 2012, 12, 79–85. [Google Scholar] [CrossRef] [Green Version]
  26. Boyd, C.; Tucker, C. Water Quality and Pond Soil Analyses for Aquaculture; Auburn University: Auburn, AL, USA, 1992. [Google Scholar]
  27. James, R.T.; Havens, K.; Zhu, G.; Qin, B. Comparative analysis of nutrients, chlorophyll and transparency in two large shallow lakes (Lake Taihu, P.R. china and Lake Okeechobee, USA). Hydrobiologia 2009, 627, 211–231. [Google Scholar] [CrossRef]
  28. Begliutti, B.; Buscarinu, P.; Marras, G.; Sechi, G.; Sulis, A. Reservoirs water-quality characterization for optimization modelling under drought conditions. Part 1—reservoirs trophic state characterization. Methods Tools Drought Anal. Manag. 2007, 62, 239–261. [Google Scholar]
  29. Carlson, R. A trophic state index for lakes. Limnol. Oceanogr. 1977, 2, 361–369. [Google Scholar] [CrossRef]
  30. Prasad, D.; Siddaraju, P. Carlson’s Trophic State Index for the assessment of trophic status of two Lakes in Mandya district. Adv. Appl. Sci. Res. 2012, 3, 2992–2996. [Google Scholar]
  31. Rangel-Peraza, J.; de Anda, J.; González-Farías, F.A.; Rode, M.; Sanhouse-García, A.; Bustos-Terrones, Y. Assessment of heavy metals in sediment of Aguamilpa dam, México. Environ. Monit. Assess. 2015, 18, 1–14. [Google Scholar] [CrossRef] [PubMed]
  32. Pestana, I.; Bastos, W.; Almeida, M.; de Carvalho, D.; Rezende, C.; Souza, C. Spatial-temporal dynamics and sources of total hg in a hydroelectric reservoir in the western amazon, Brazil. Environ. Sci. Pollut. Res. 2016, 23, 9640–9648. [Google Scholar] [CrossRef]
  33. Chittoor, V.; Molson, J.; Schirmer, M. Does river restoration affect diurnal and seasonal changes to surface water quality? A study along the thur river, Switzerland. Sci. Total Environ. 2015, 532, 91–102. [Google Scholar] [CrossRef]
  34. Monteiro, D.; Nogueira, M.; Ayroza, M.; Marques, L.; Carvalho, E.; Ferraudo, S.; Camargo, A. Temporal and spatial variability of limnological characteristics in areas under the influence of tilapia cages in the chavantes reservoir, paranapanema river, Brazil. J. World Aquacult. Soc. 2013, 44, 814–825. [Google Scholar]
  35. Toor, G.; Han, L.; Stanley, C.D. Temporal variability in water quality parameters—a case study of drinking water reservoir in Florida, USA. Environ. Monit. Assess. 2013, 185, 4305–4320. [Google Scholar] [CrossRef] [PubMed]
  36. Malik, R.; Nadeem, M. Spatial and temporal characterization of trace elements and nutrients in the rawal lake reservoir, Pakistan using multivariate analysis techniques. Environ. Geochem. Health 2011, 33, 525–541. [Google Scholar] [CrossRef] [PubMed]
  37. Mwanamoki, P.; Devarajan, N.; Thevenon, F.; Atibu, E.; Tshibanda, J.; Ngelinkoto, P.; Mpiana, P.; Prabakar, K.; Mubedi, J.; Kabele, C.; et al. Assessment of pathogenic bacteria in water and sediment from a water reservoir under tropical conditions (Lake Ma Vallée), Kinshasa democratic republic of Congo. Environ. Monit. Assess. 2014, 186, 6821–6830. [Google Scholar] [CrossRef] [PubMed]
  38. Yu, S.; Xua, Z.; Wuc, W.; Zuoa, D. Effect of land use types on stream water quality under seasonal variation and topographic characteristics in the Wei River basin, China. Ecol. Indic. 2016, 60, 202–212. [Google Scholar] [CrossRef]
  39. Varol, M.; Gökot, B.; Bekleyen, A.; Şen, B. Spatial and temporal variations in surface water quality of the dam reservoirs in the tigris river basin, Turkey. Catena 2012, 92, 11–21. [Google Scholar] [CrossRef]
  40. Palma, P.; Ledo, L.; Soares, S.; Barbosa, I.; Alvarenga, P. Spatial and temporal variability of the water and sediments quality in the alqueva reservoir (guadiana basin; southern portugal). Sci. Total Environ. 2014, 470, 780–790. [Google Scholar] [CrossRef] [PubMed]
  41. Ciric, M.; Gavrilović, B.; Simić, G.S.; Krizmanić, J.; Vidović, M.; Zebić, G. Driving factors affecting spatial and temporal variations in the structure of phytoplankton functional groups in a temperate reservoir. Oceanol. Hydrobiol. Stud. 2015, 44, 431–444. [Google Scholar] [CrossRef]
  42. Li, W.; Gao, L.; Shi, Y.; Wang, Y.; Liu, J.; Cai, Y. Spatial distribution, temporal variation and risks of parabens and their chlorinated derivatives in urban surface water in Beijing, China. Sci. Total Environ. 2016, 539, 262–270. [Google Scholar] [CrossRef] [PubMed]
  43. Tong, Y.; Yao, R.; He, W.; Zhou, F.; Zhou, M.; Chen, C.; Lin, Y. Impacts of sanitation upgrading to the decrease of fecal coliforms entering into the environment in china. Environ. Res. 2016, 149, 57–65. [Google Scholar] [CrossRef] [PubMed]
  44. Pachepsky, Y.; Shelton, D. Escherichia coli and fecal coliforms in freshwater and estuarine sediments. Crit. Rev. Environ. Sci. Technol. 2011, 41, 1067–1110. [Google Scholar] [CrossRef]
  45. Alweshah, M.; Abdullah, S. Hybridizing firefly algorithms with a probabilistic neural network for solving classification problems. Appl. Soft Comput. 2015, 35, 513–524. [Google Scholar] [CrossRef]
  46. Santhanam, H.; Raj, S. Carlson’s index, a poor cursor of trophic status assessment of pulicat lagoon, southeast coast of India. Int. J. Environ. Stud. 2010, 67, 17–25. [Google Scholar] [CrossRef]
  47. Phillips, G.; Pietiläinen, O.; Carvalho, L.; Solimini, A.; Solheim, A.L.; Cardoso, A. Chlorophyll—nutrient relationships of different lake types using a large European dataset. Aquat. Ecol. 2008, 42, 213–226. [Google Scholar] [CrossRef]
  48. Quevedo-Castro, A.; Lopez, J.; Rangel-Peraza, J.; Bandala, E.; Bustos-Terrones, Y. Study of the Water Quality of a Tropical Reservoir. Environments 2019, 6, 7. [Google Scholar] [CrossRef]
  49. Vollenweider, R.A. Scientific Fundamentals of the Eutrophication of Lakes and Flowing Waters, with Particular Reference to Nitrogen and Phosphorus as Factors in Eutrophication. Available online: http://garfield.library.upenn.edu/classics1987/A1987J648000001.pdf (accessed on 1 June 2018).
  50. Sakka, A.; Chikhaoui, M.; El Grami, B.; Hadj Mabrouk, H. Effects of N and P supply on phytoplankton in bizerte lagoon (western mediterranean). J. Exp. Mar. Biol. Ecol. 2006, 333, 79–96. [Google Scholar] [CrossRef]
  51. Perkins, R.G.; Underwood, G. Gradients of chlorophyll a and water chemistry along a eutrophic reservoir with determination of the limiting nutrient by in situ nutrient addition. Water Res. 2000, 34, 713–724. [Google Scholar] [CrossRef]
Figure 1. The geographic location of the Adolfo López Mateos (ALM) reservoir and sampling sites.
Environments 06 00061 g001
Figure 2. Hydrological information of the ALM reservoir during the year 2018. (a) Contribution and extraction; (b) Storage and elevation.
Environments 06 00061 g002
Figure 3. Water temperature of the reservoir.
Environments 06 00061 g003
Figure 4. Physicochemical and microbiological dynamics for the ALM reservoir (box-and-whisker diagrams).
Environments 06 00061 g004
Figure 5. Spatial variation of the physicochemical and microbiological parameters for the ALM reservoir.
Environments 06 00061 g005
Figure 6. 3-D graph of spatial density of water quality of the ALM reservoir. PNNC neural interactions between TSS and (a) COD, (b) DO, (c) pH, (d) FC.
Environments 06 00061 g006
Figure 7. The Carlson Modified Trophic State Index (CMTSI) value in the sampling points.
Environments 06 00061 g007
Figure 8. N/P relation value in the sampling points for year.
Environments 06 00061 g008
Table 1. Statistical summary of hydroclimatological characteristics of the study area.
ParameterUnitsnAverageStandard DeviationVariation CoefficientMinimumMaximumANOVA
Reason-FValue-P
Temperature°C936019.8584.89724.6%10.628.50.780.76
Precipitationmm93602.4773.615145.9%0180.280.99
Evaporationmm93605.5882.08437.3%2.110.60.540.96
Table 2. Statistical summary of water quality parameters in the spring season.
ParameterUnitsnAverageSDVariation CoefficientMinimumMaximumANOVA
Reason-FValue-P
pHunitless207.7040.4435.757%7.078.40.080.9704
DOmg/L207.332.21030.139%3.8110.40.070.9759
TurbidityNTU203.46755.1537148.63%0.8822.00.800.5150
ECµS/cm20160.4629.70718.502%127.0257.01.700.2200
TSSmg/L209.6125.44756.671%5.020.000.730.5528
BODmg/L205.4422.84952.356%2.09.70.060.9770
CODmg/L2028.32514.74652.061%14.454.40.050.9855
TNmg/L200.44660.164736.876%0.11540.75760.850.4913
TPmg/L200.07820.037648.140%0.040.16180.770.5323
FCMPN/100 mL20765.251210.02158.12%1.03255.00.010.9991
Table 3. Statistical summary of water quality parameters in the fall season.
ParameterUnitsnAverageSDVariation CoefficientMinimumMaximumANOVA
Reason-FValue-P
pHunitless207.8210.3774.82%7.288.70.110.9553
DOmg/L206.3732.21634.77%2.939.60.220.8839
TurbidityNTU208.82517.829202.032%1.074.00.460.7118
ECµS/cm20171.4142.53024.811%110.0245.00.020.9948
TSSmg/L2010.28355.70855.5152%5.020.670.540.6633
BODmg/L204.36251.98445.484%2.07.160.190.9002
CODmg/L2022.0918.95940.555%10.6643.850.410.7511
TNmg/L200.74410.239832.223%0.28351.14910.130.9387
TPmg/L200.15540.1598102.815%0.05410.52320.050.9845
FCMPN/100mL20457.56692.81151.41%20.02143.00.410.7488

