1. Introduction
Today, about 50% of the world’s population lives in cities; this proportion is expected to reach 80% by 2030 [
1]. Large amounts of energy are consumed in the building sector, and cities are responsible for 70% of global carbon emissions [
2,
3]. In this situation, it is necessary to consider savings and reduction of energy consumption in all areas, including in buildings [
4]. About 40% of energy consumption in Iran is related to buildings [
5]. In some buildings, about half of the heating and cooling load is lost through windows. Meanwhile, in order to reduce the energy consumption of buildings, the insulation of walls and windows has been increasing. For this purpose, it is necessary to determine the optimum percentage of windows at different facades of the building, especially for the various climate conditions of Iran.
The optimum window-to-wall ratio (WWR) must be taken into consideration in the early stages of designing a building with respect to the form, orientation, distribution, and dimensions of the windows. The optimum WWR means the window area that minimizes the total annual energy of cooling, heating, and lighting [
6]. Usually, in the design of static buildings to increase the amount of solar heat gain, at the northern facade small windows are used and at the southern facade large windows are utilized. The impact of increasing the northern window areas and reducing the southern windows in static buildings was examined by Persson in
Gothenburg, Sweden [
7]. The results of this study revealed that the dimensions of the energy-efficient window had a low impact on the heating load, but were very effective for the cooling load. Moreover, this study revealed that heat losses were very low, since the building envelope was well insulated and triple-glazed windows had been installed. This suggests that, contrary to conventional thinking in static buildings, it is possible to use large windows at the northern facade and have desirable light conditions. If the windows are used efficiently, the larger dimensions of the northern window cause a slight increase in the thermal energy and do not have much impact on the heating peak. However, when using large southern windows, the ventilation rate needs to be increased and shading devices should be utilized. In addition, the orientation towards the sun has moderate importance in increasing the indoor temperature for the window size, so no significant change in the amount of energy is obtained by rotating houses 180°. Meanwhile, it is worth mentioning the results from other cold climates with more solar irradiation during the winter; buildings with inadequate insulation and buildings in the shade could have different results [
7].
In some studies, the impact of window type and its optical properties related to its relative area for different building types were analyzed. In this regard, the study of Goia [
6] was conducted for a building in Rome. The results of this study indicated that changing the area of the window changes its optimal type. Based on the results, the optimal WWR was 35–45%, which does not depend on the orientation and facade surface. The greatest difference in the energy consumption was for the best and worst configurations of the northern façade, and the smallest difference was in the southern facade. The analysis of the results revealed that the overall energy consumption of the building has a low correlation with the geometry and efficiency of the air-conditioning system, while it is highly dependent on changing the indoor heat load and the shading system. The impact of facade on energy-efficient buildings was much lower than that of conventional buildings [
8]. Various studies have investigated the optimum WWR in cold climates of Europe. Meanwhile, in a new study, this ratio has been carried out for a typical office building at four different climates of Europe, from 35° to 60° N latitude. The studied building has had advanced technology regarding envelope components and also the optimum ratio for four building facades. According to the results, for each climate with a certain orientation, there is no optimal ratio for the window size, but in all cases, the minimum energy consumption in samples was for those with a window area of 30–45%. However, the southern facade of the cold climate and the very hot climate were exceptions. In addition, the difference in energy consumption for the best and worst cases was 5–25% [
6]. In the central European region, non-compact forms are more suitable than compact forms because they allow for using larger window surfaces and therefore allow more solar heat gain to be received. One of the best models in this climate was a square plan with 50% southern glass and without shading devices. However, for other cases, using proper shading device is essential to prevent overheating in the summer. In case of using a shading device (especially a movable shading device), energy consumption will be minimal even if large glass areas are used [
9].
Various types of optimization algorithms can be used to optimize the envelope design of buildings. In simulations that were conducted with optimization, the genetic algorithm is coupled to a building engine in order to select optimal values for envelope parameters for the minimum energy consumption of buildings. Tuhus-dubrow and Krarti [
10], using the genetic algorithm, investigated residential buildings that were rectangular, L-shaped, T-shaped, cross-shaped or trapezoidal, and examined the effect of the type and area of the windows. The results of this study revealed that rectangular and trapezoidal-shaped buildings have the best performance from the aspect of life-cycle and cost amongst all of the different climates. In addition, for hot climates the southern trapezoid form, and for cold climates the northern trapezoid form, are more suitable. If all variables can be changed, the square form with the minimum cost has the best performance in all climates. For the optimized parameters, the difference between the results was small, about 5%. For various climatic conditions, especially the hot‒humid climate, there was not enough information about the thermal performance of the envelope of buildings. Such a function depends on the configuration of design elements and the technical characteristics of the facades [
11]. In research in Kuala Lumpur, the energy consumption of a building has been evaluated by changing the orientation, building envelope heat transfer coefficients, and window properties. The changes in the window characteristics affect the absorption of thermal energy and transfer visible light. By using regression analysis, the relationship between the window characteristics and energy consumption of the building has been analyzed and the envelope design guide was represented for five climates. Based on these results, the proposed ratio of WWR in all directions (except for the north facade in two climates) is 25%. In climates 1 and 2, based on ASHRAE’s division, installing window in the north, south, west, and east facades confers the most benefits. For three to five climates of ASHRAE, the highest impact was related to the south, north, west, and east facades [
12].
In a parametric study, the optimal dimension of a window was investigated based on the thermal performance of a reference room located in Portugal and the parameters of opening type, orientation, and size were evaluated; then the overhangs were checked and the degree-hours of discomfort calculated. It was revealed that the northeast and west directions are inappropriate, and a triple-glazed window at the northern facade is the most appropriate. The results of this study reveal that shades do not significantly improve thermal performance but allow windows to have a wider dimensional opening [
13].
Recently an extensive research effort has been carried out by means of Energy Plus software in order to measure the optimum WWR for a conventional office building based on Italian regulations. The factors investigated in this study were the thermal characteristics of the building envelope, electrical lighting of environment, and movable shadings for 12 different climates. The studied WWR ratios with 10% steps varied from 5% to 55%. For all climates, the optimum WWR in a building with good insulation was 23.5%; for a building with poor insulation it was 25.9%. In different conditions, the optimum glass area can be doubled due to the configuration effect of the envelope characteristics and electrical lighting. For all climates, glass was a more efficient choice, and for specific glass types the maximum window area was about 32% [
14].
In the study of Alghoul et al. [
15], the influence of WWR and window orientation on the overall energy consumption of a small office building in Libya was investigated by means of Energy Plus software funded by the U.S. Department of Energy Building Technologies Office. The results of this study indicate that increasing the WWR between 0% and 90% increases the cooling load and reduces the heating load; in different conditions the total energy consumption of the building has been increased by 6‒181%. In methodologies that estimate the design parameters, the purpose is to determine the thermal requirements of a building as a dynamic thermal system. For such design its internal temperature range should not be changed more than a few degrees. Accordingly, Ma et al. [
16]. have determined the maximum allowable WWR based on the thermal characteristics of the building envelope and outdoor air temperatures in seven climates of the United States. If the heat transfer coefficient can be reduced to 0.2 W/m
2, the window area can be increased equivalent to the green surface.
Krarti et al. [
17] examined the effects of variables of building geometry, window area, and window type and perimeter area on lighting and energy consumption in four American regions. The visible light transmittance coefficient of the window and the relative window to floor area was determined in a way that had a significant impact on daylighting-induced energy savings. Hence, increasing the transmission coefficient increases the benefits of daylighting. A window area larger than 30% reduced the amount of energy saved. When using daylighting, the latitude has a relatively small effect, and in all locations a light transmittance coefficient larger than 0.3 reduced the energy returns. The purpose of larger windows in non-residential buildings is to create more daylight and a suitable view while avoiding thermal loss [
18]. In addition, for using daylight, the window area should not be less than 10% of the floor area, although the optimum window size for daylight may not be the same as the optimum value for energy [
19]. To determine the optimum WWR for a particular building, the characteristics of the environment and the urban topology should also be considered [
9]. The location and window shape are also issues that should be investigated in future studies [
14]. The opening position of a window area is highly important and by installing a window in the optimal location, the amount of energy loss through the thermal bridge decreases by 50% [
20]. Due to the lack of information associated with the optimum WWR ratio, future studies on different types of buildings and different forms of cooling and heating systems are suggested [
10].
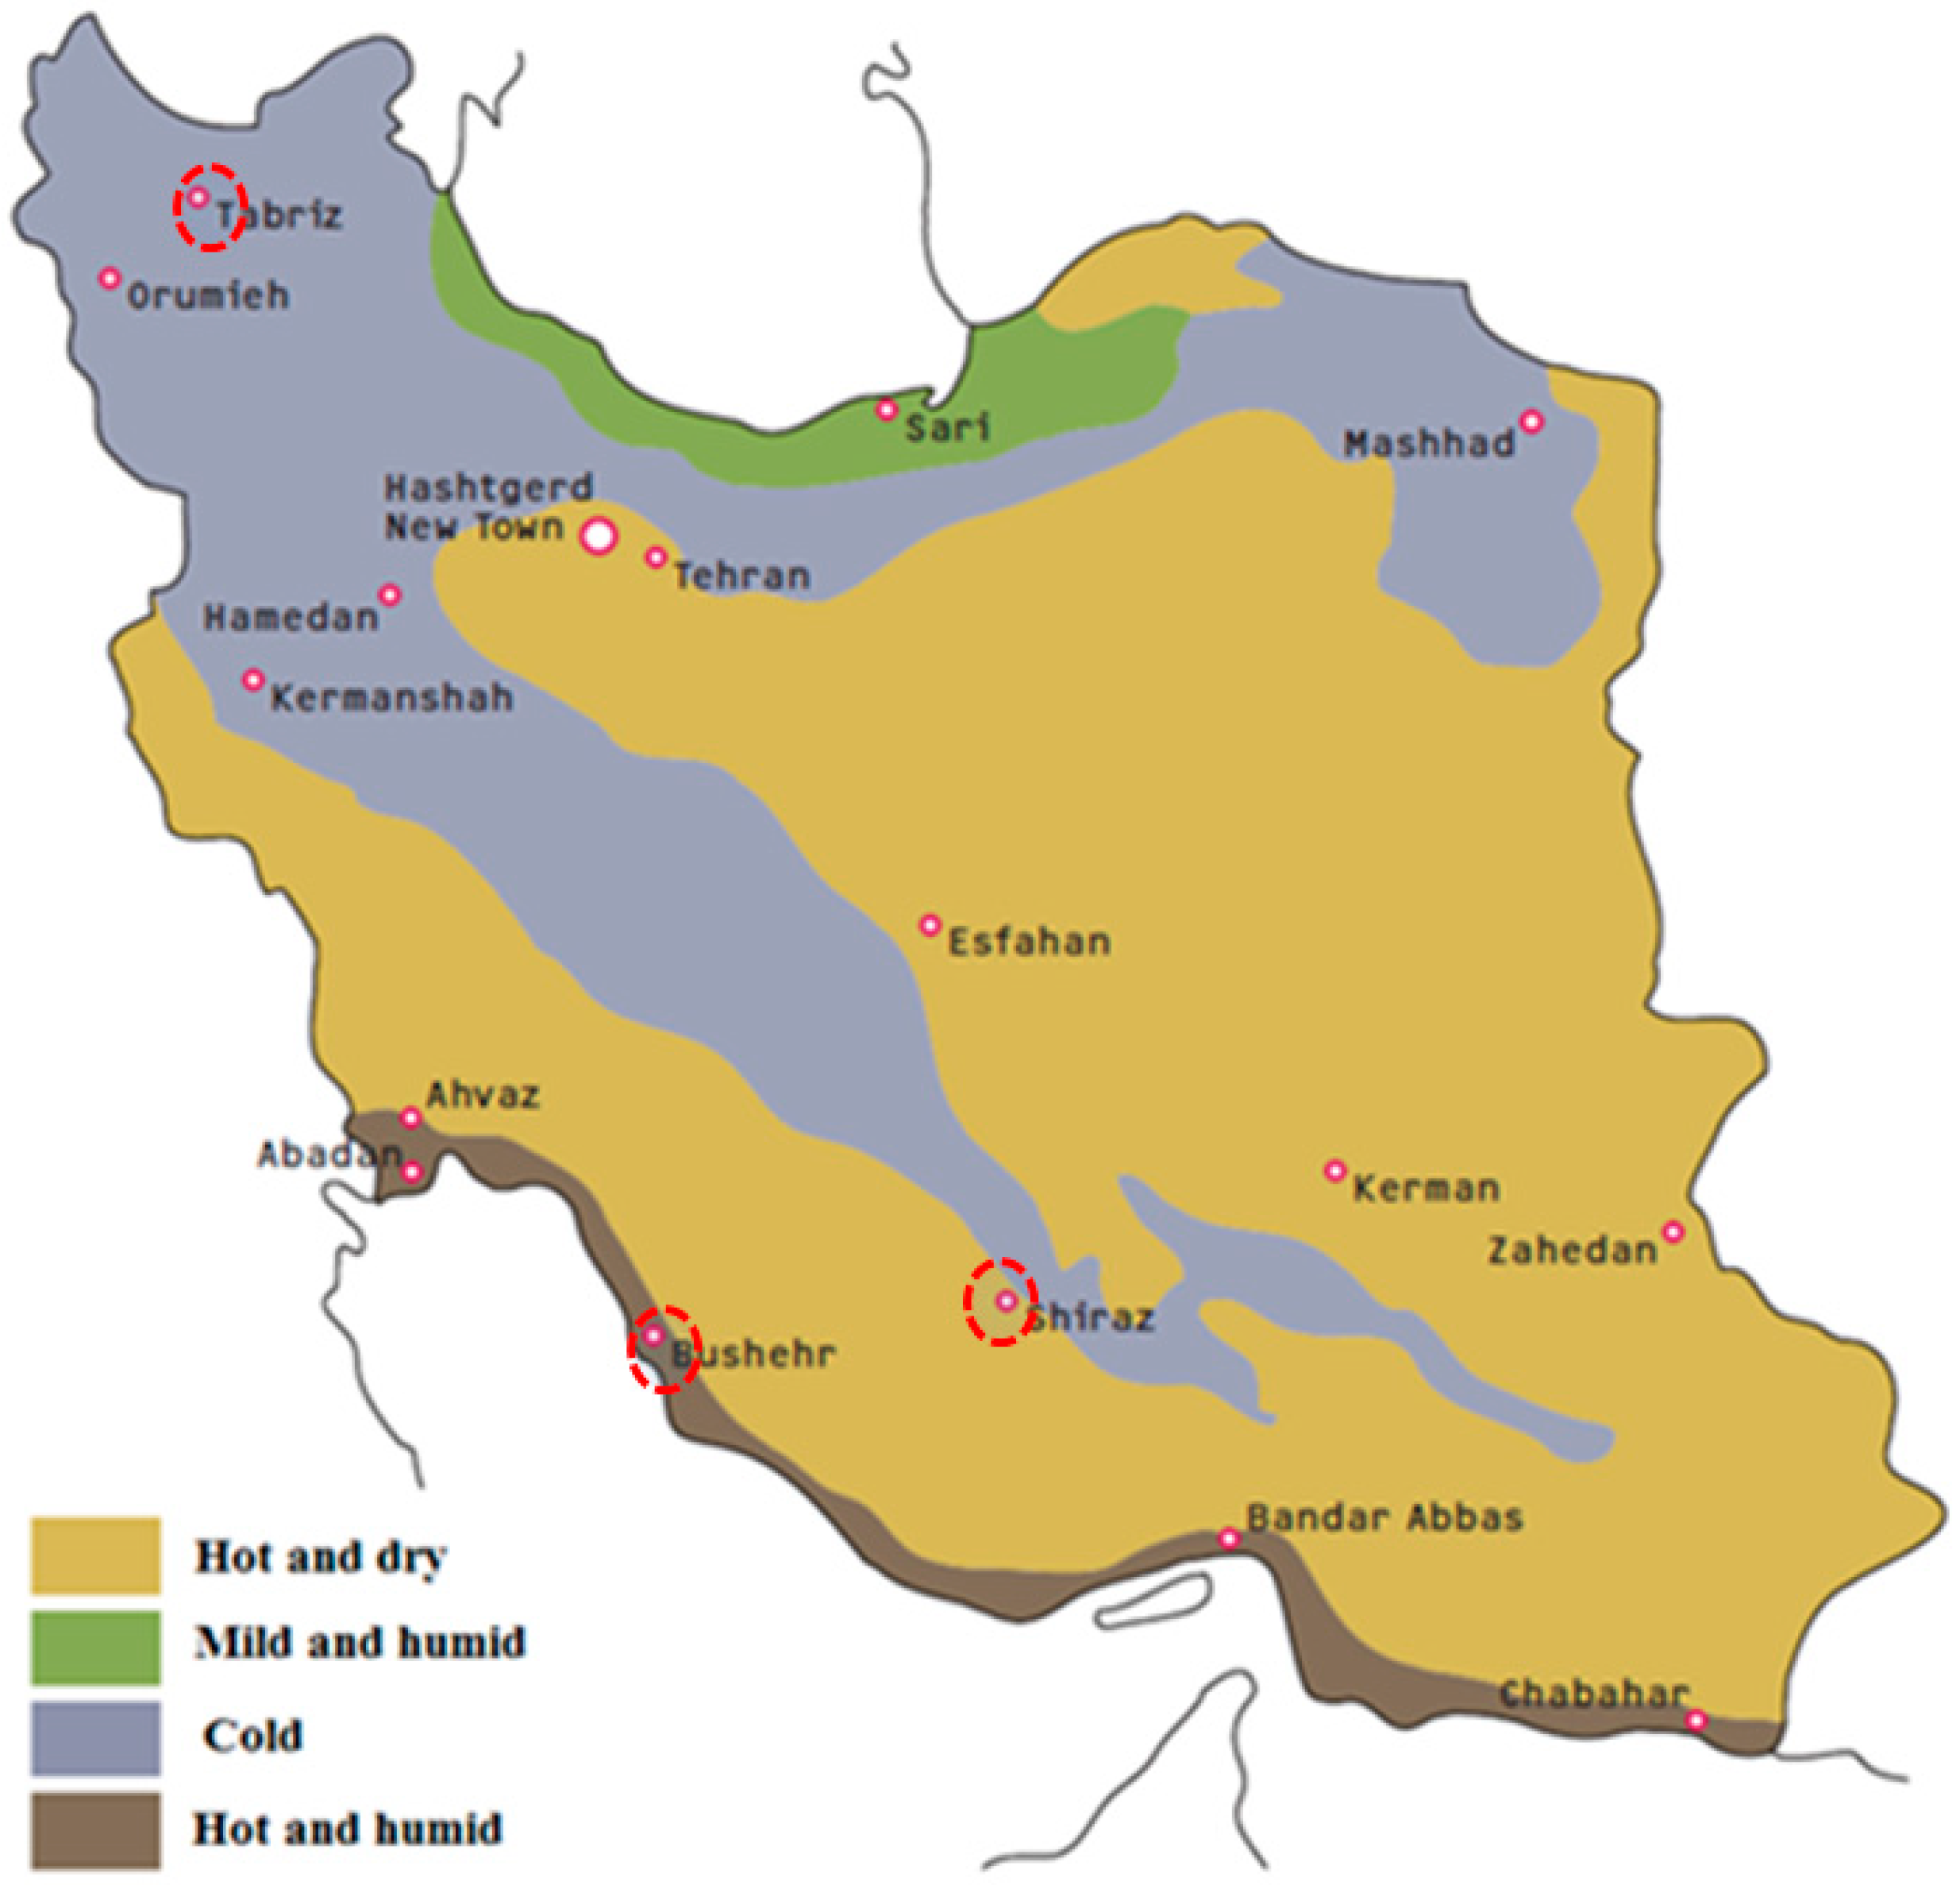
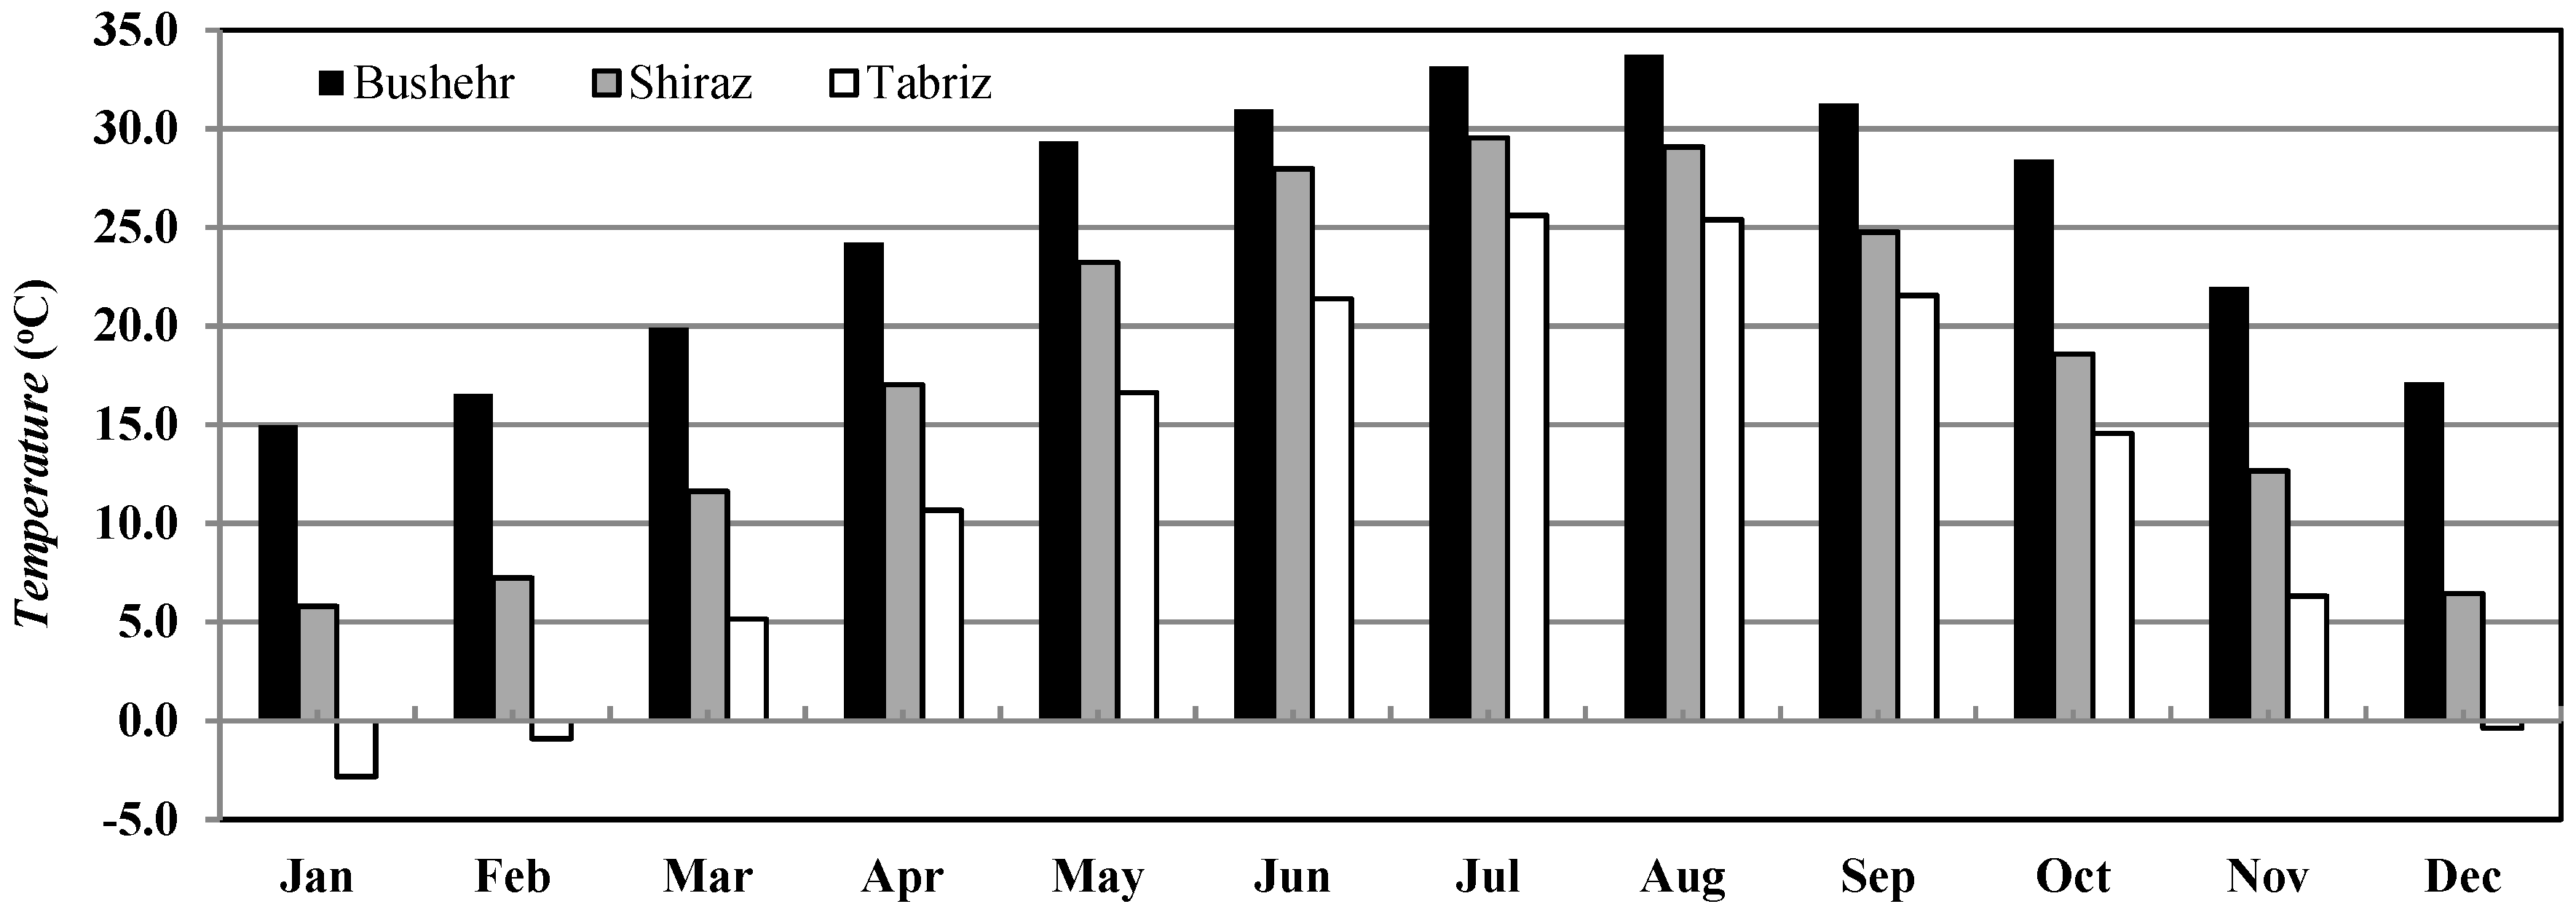
Based on the literature review, no study has been conducted determining the optimum percentage of windows area in office buildings for the various climates of Iran. Therefore, the purpose of this study is to determine the optimum window wall ratio for the north, south, east and west facades of an office building for the three different climates of Iran, including the hot‒humid climate of Bushehr, the hot‒dry climate of Shiraz, and the cold climate of Tabriz.
3. Methodology
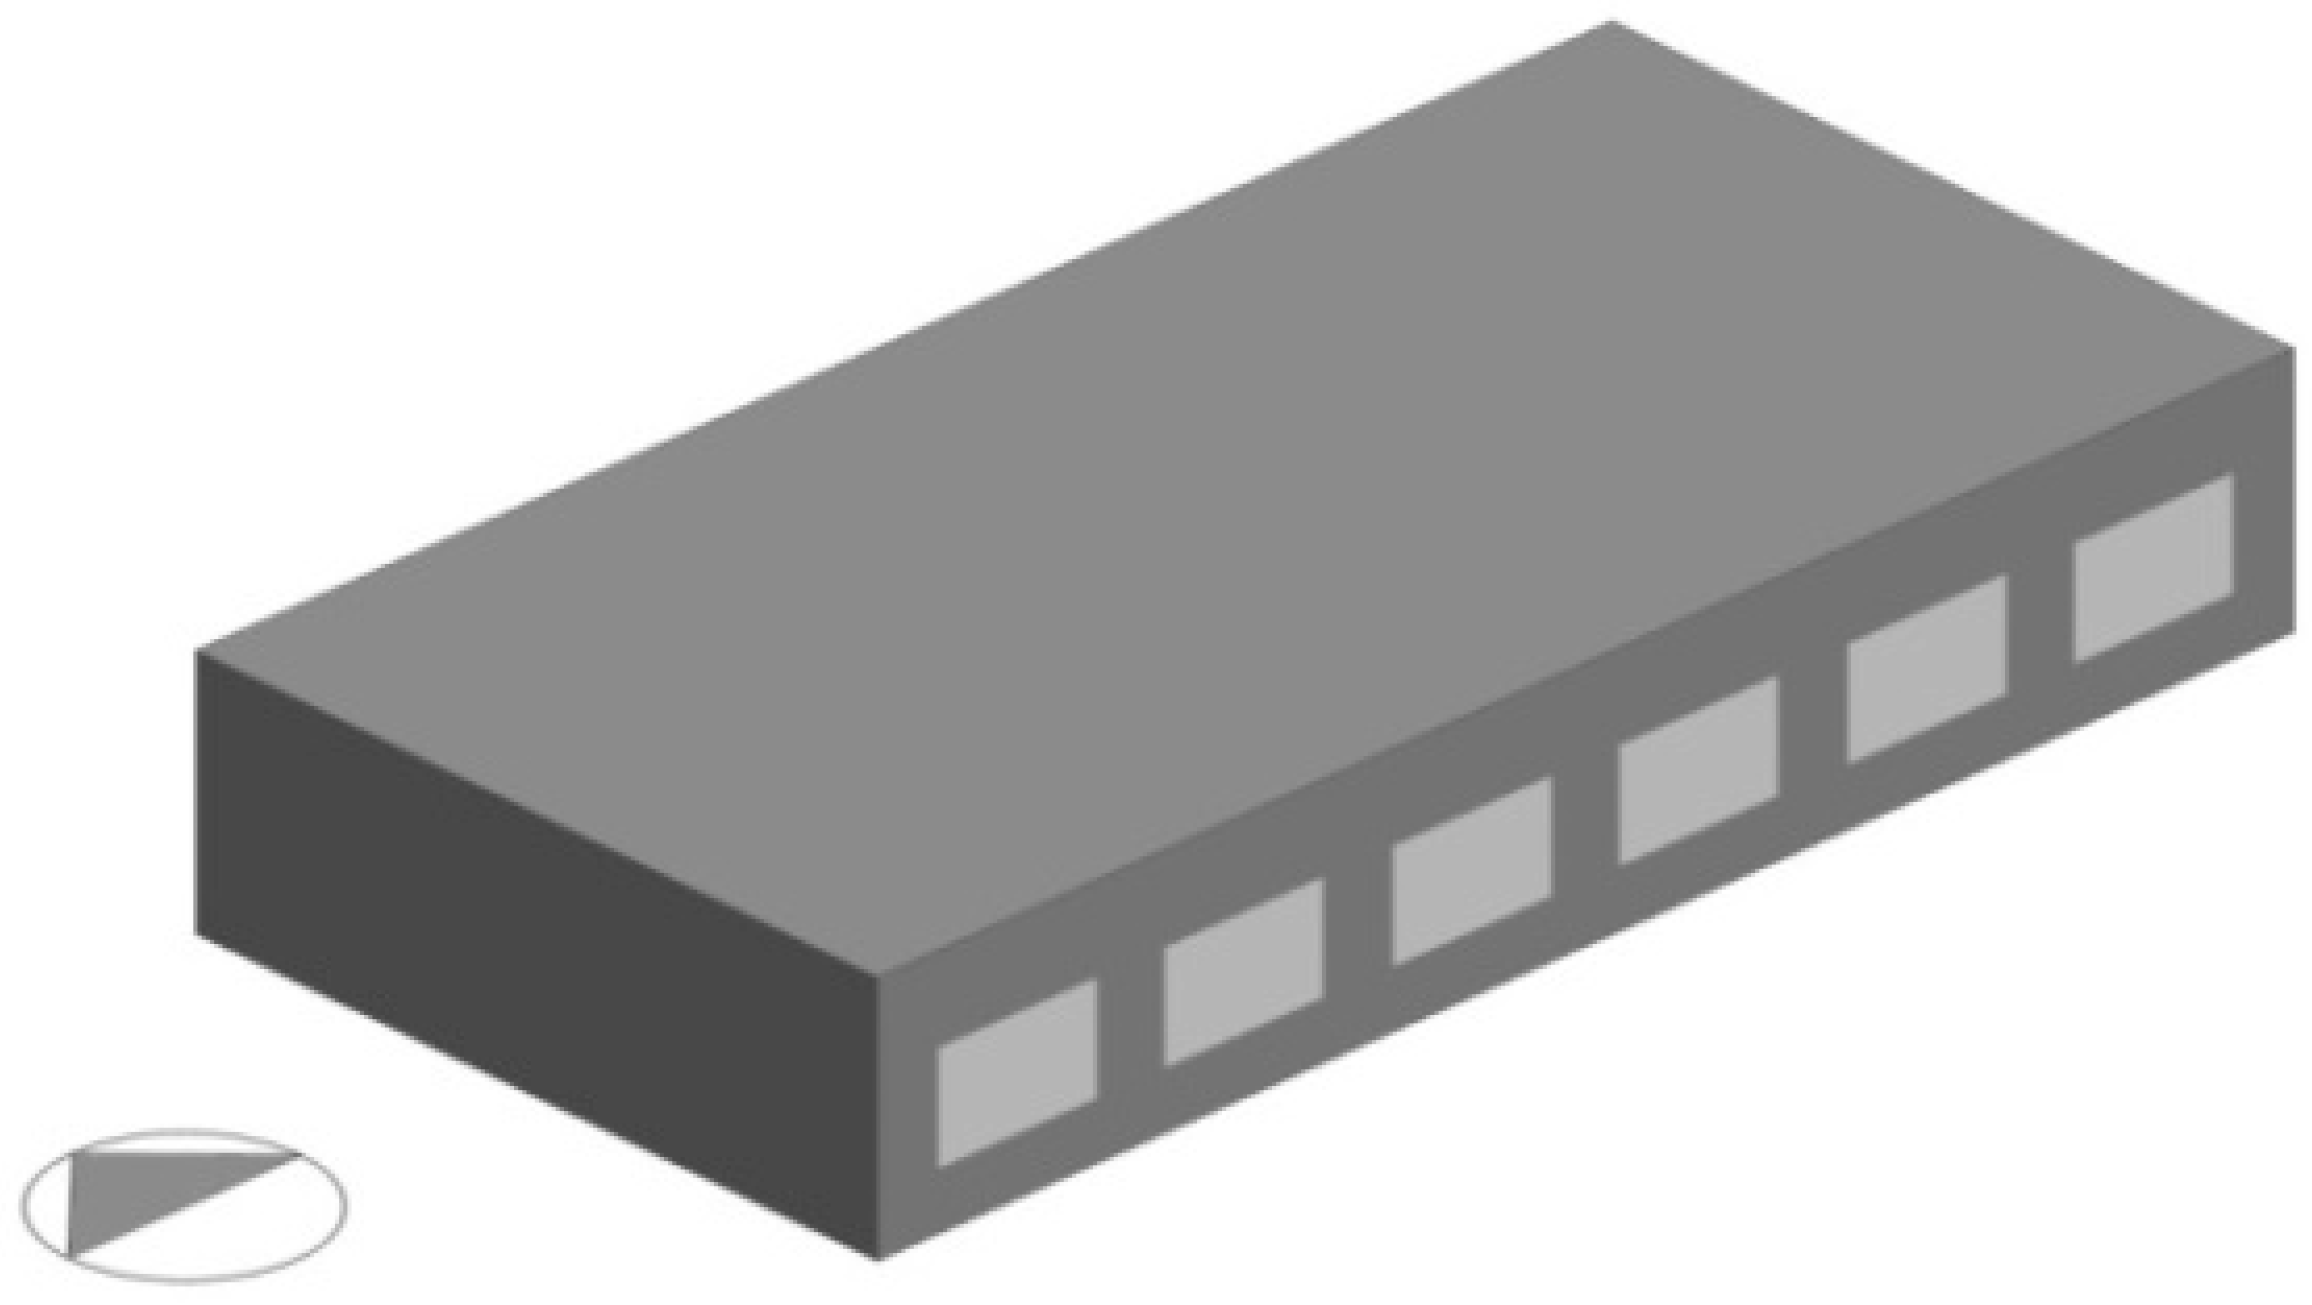
In order to determine the optimum percentage of window size in the external facades of an office building, the building dimensions were considered to be 8 m × 16 m with a height of 3.5 m; this is based on the study of Nasrollahi [
4], in which the optimum percentage of windows for office buildings was determined. This building has an eastern‒western orientation, as illustrated in
Figure 3. In this research, DesignBuilder software [
22] was used to simulate the building. This software has the Energy Plus analysis engine and is able to calculate the solar heat gain and energy consumption related to lighting, heating and cooling load. The simulated building in the DesignBuilder software is represented in
Figure 3. The lighting level has been considered 400 Lux based on the ASHRAE standard.
In the simulation of the building, based on the ASHRAE standard, the heating setpoint was considered 22 °C, and the cooling setpoint was considered 24 °C. The characteristics of the building from the aspect of orientation, occupancy rate, etc. are also represented in
Table 2.
In the simulated building, for double-pane glass, the thickness of each pane is 3 mm, the thickness of the air layer between is 6 mm, and the thermal transfer coefficient is 3.3 W/m
2K. Also, the window frame was made of Unplasticized Polyvinyl Chloride (UPVC). The materials used in the sample building are represented in
Table 3.
Simulation
The percentage of windows area in the four north, south, east, and west facades of the building has been investigated from 0% to 100% with a 10% step. In order to determine the optimum percentage of a building facade, at first all facades were considered windowless and then the percentage of the window on that facade was changed and the data of solar heat gain, cooling load, heating load, and the annual lighting consumption of each mode were determined.
4. Results and Discussion
After simulating the building, the solar heat gain, cooling, heating and lighting consumption of the building were calculated for the cities of Bushehr, Shiraz, and Tabriz.
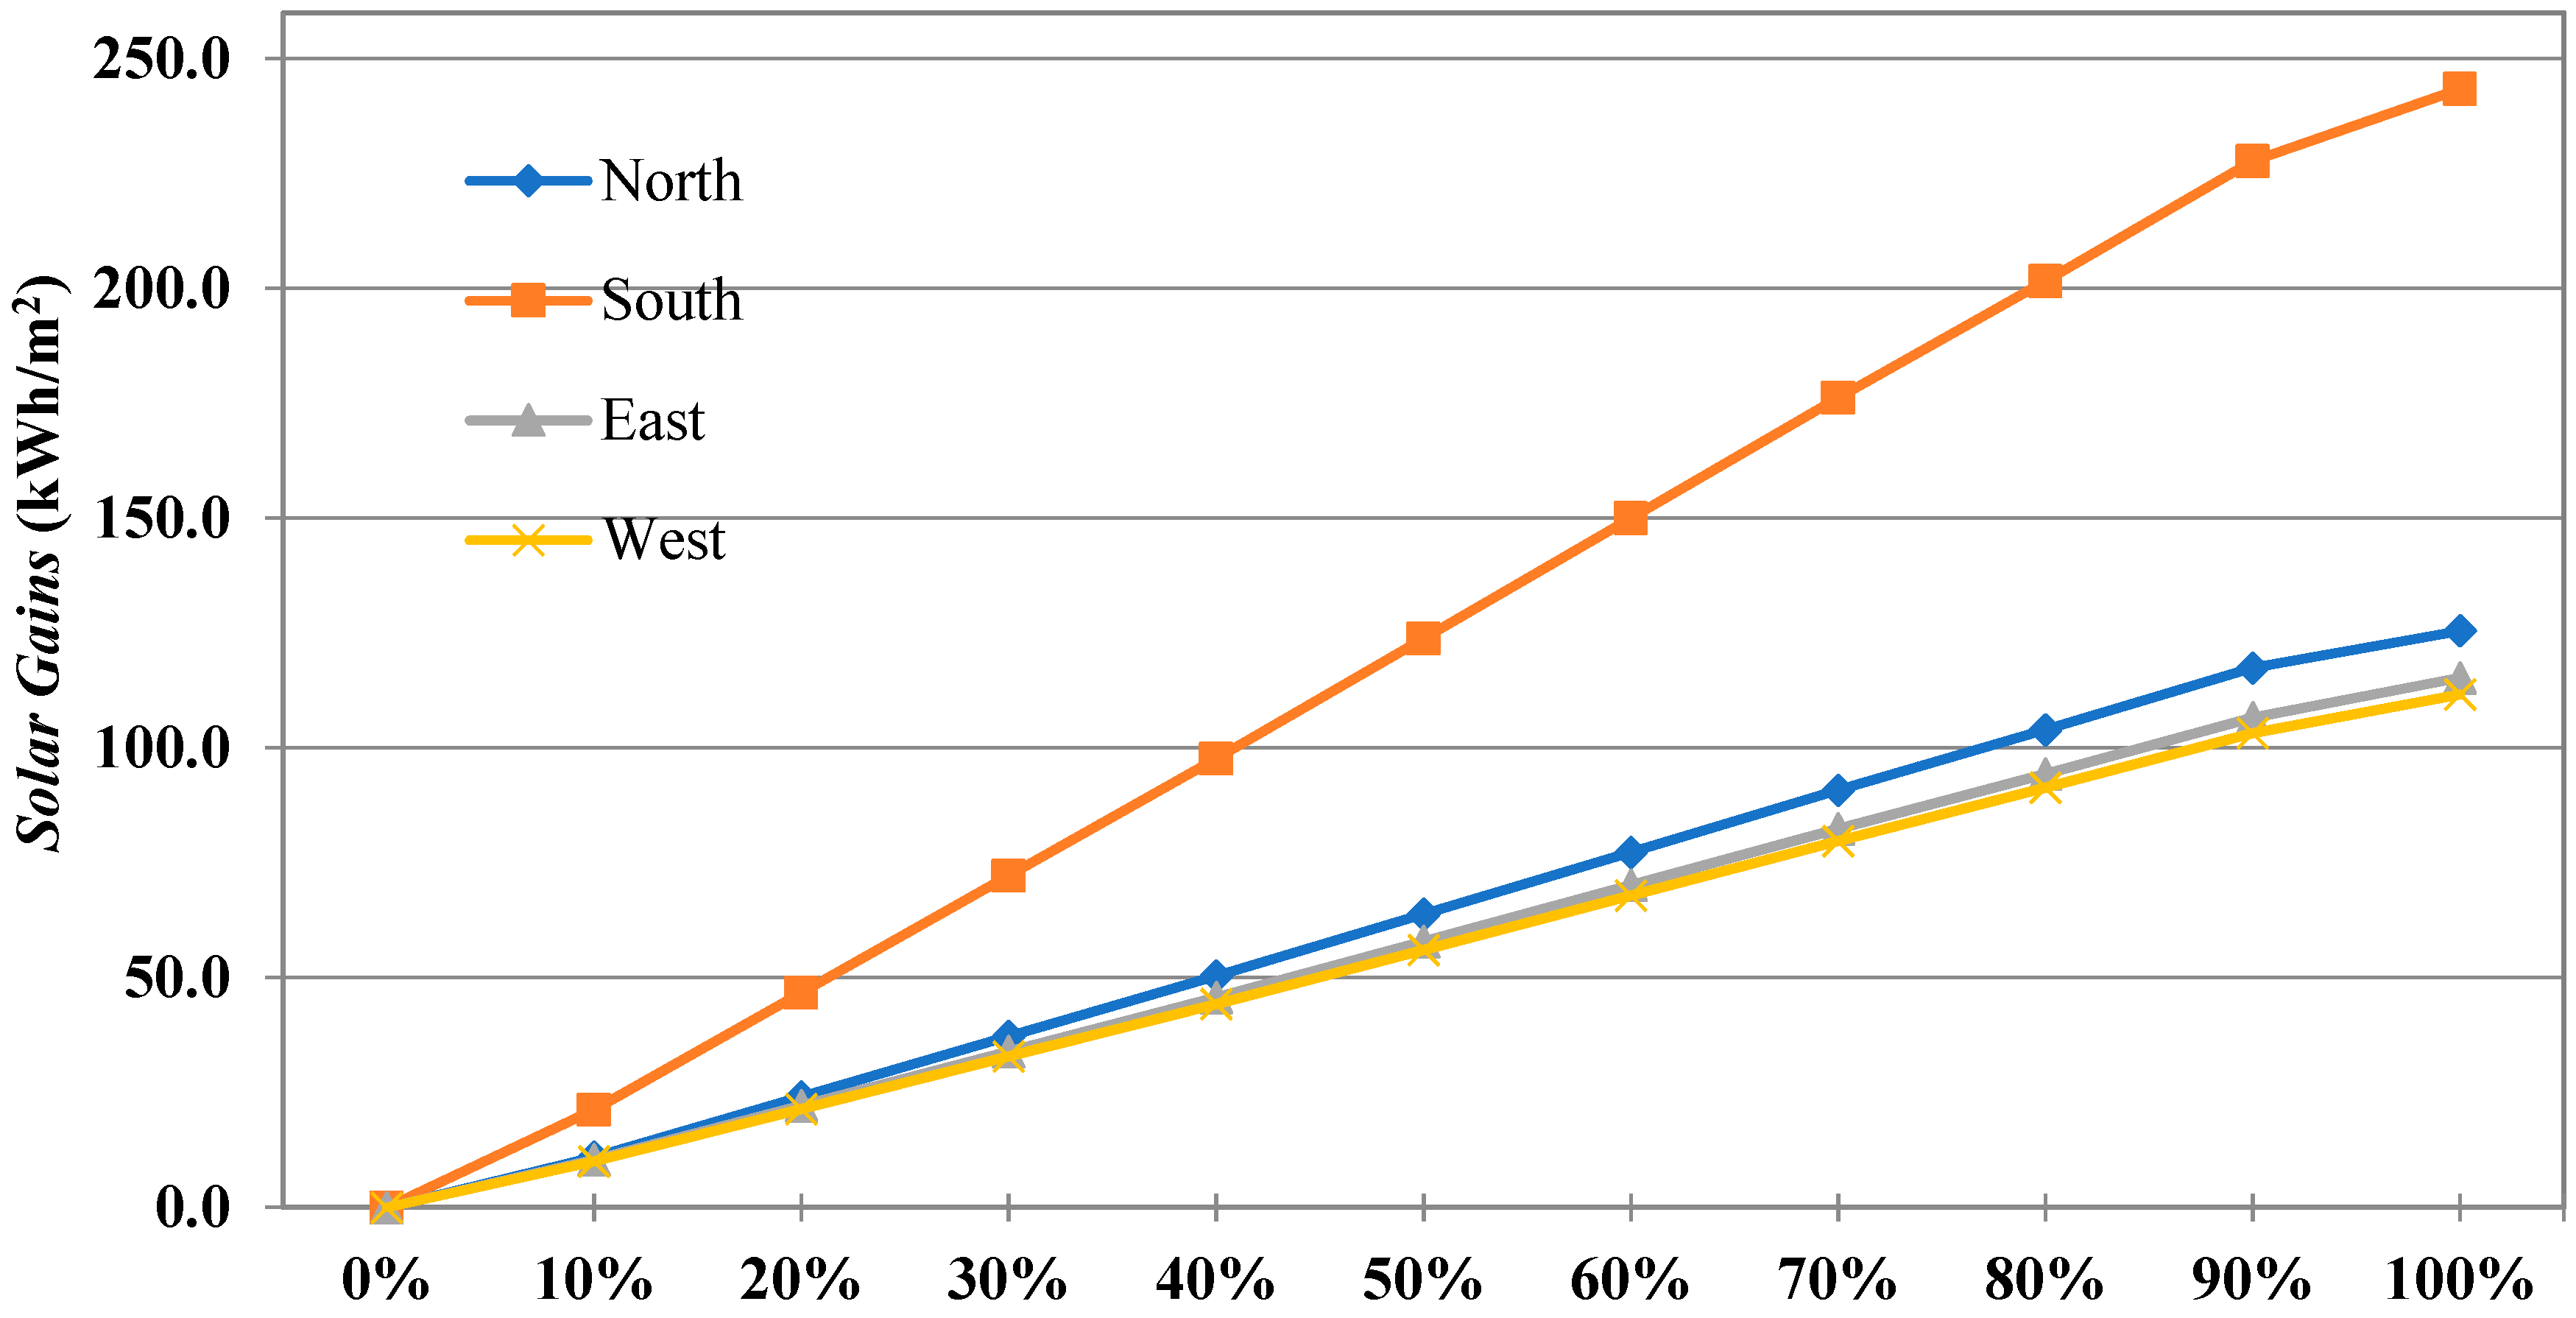
4.1. Solar Heat Gain
Solar heat gain is one of the most important factors associated with the cooling load of a building, which means an increase in the temperature of a space, object, or building that is derived from solar radiation. The amount of solar heat gain increases in continued sunlight or with any mediator material that can transmit radiation or resist it. In addition, the solar heat gain coefficient is one of the most important characteristics of a window, which transmits into the total solar energy of the window and its components includes glass, materials used in the frame, etc. [
23].
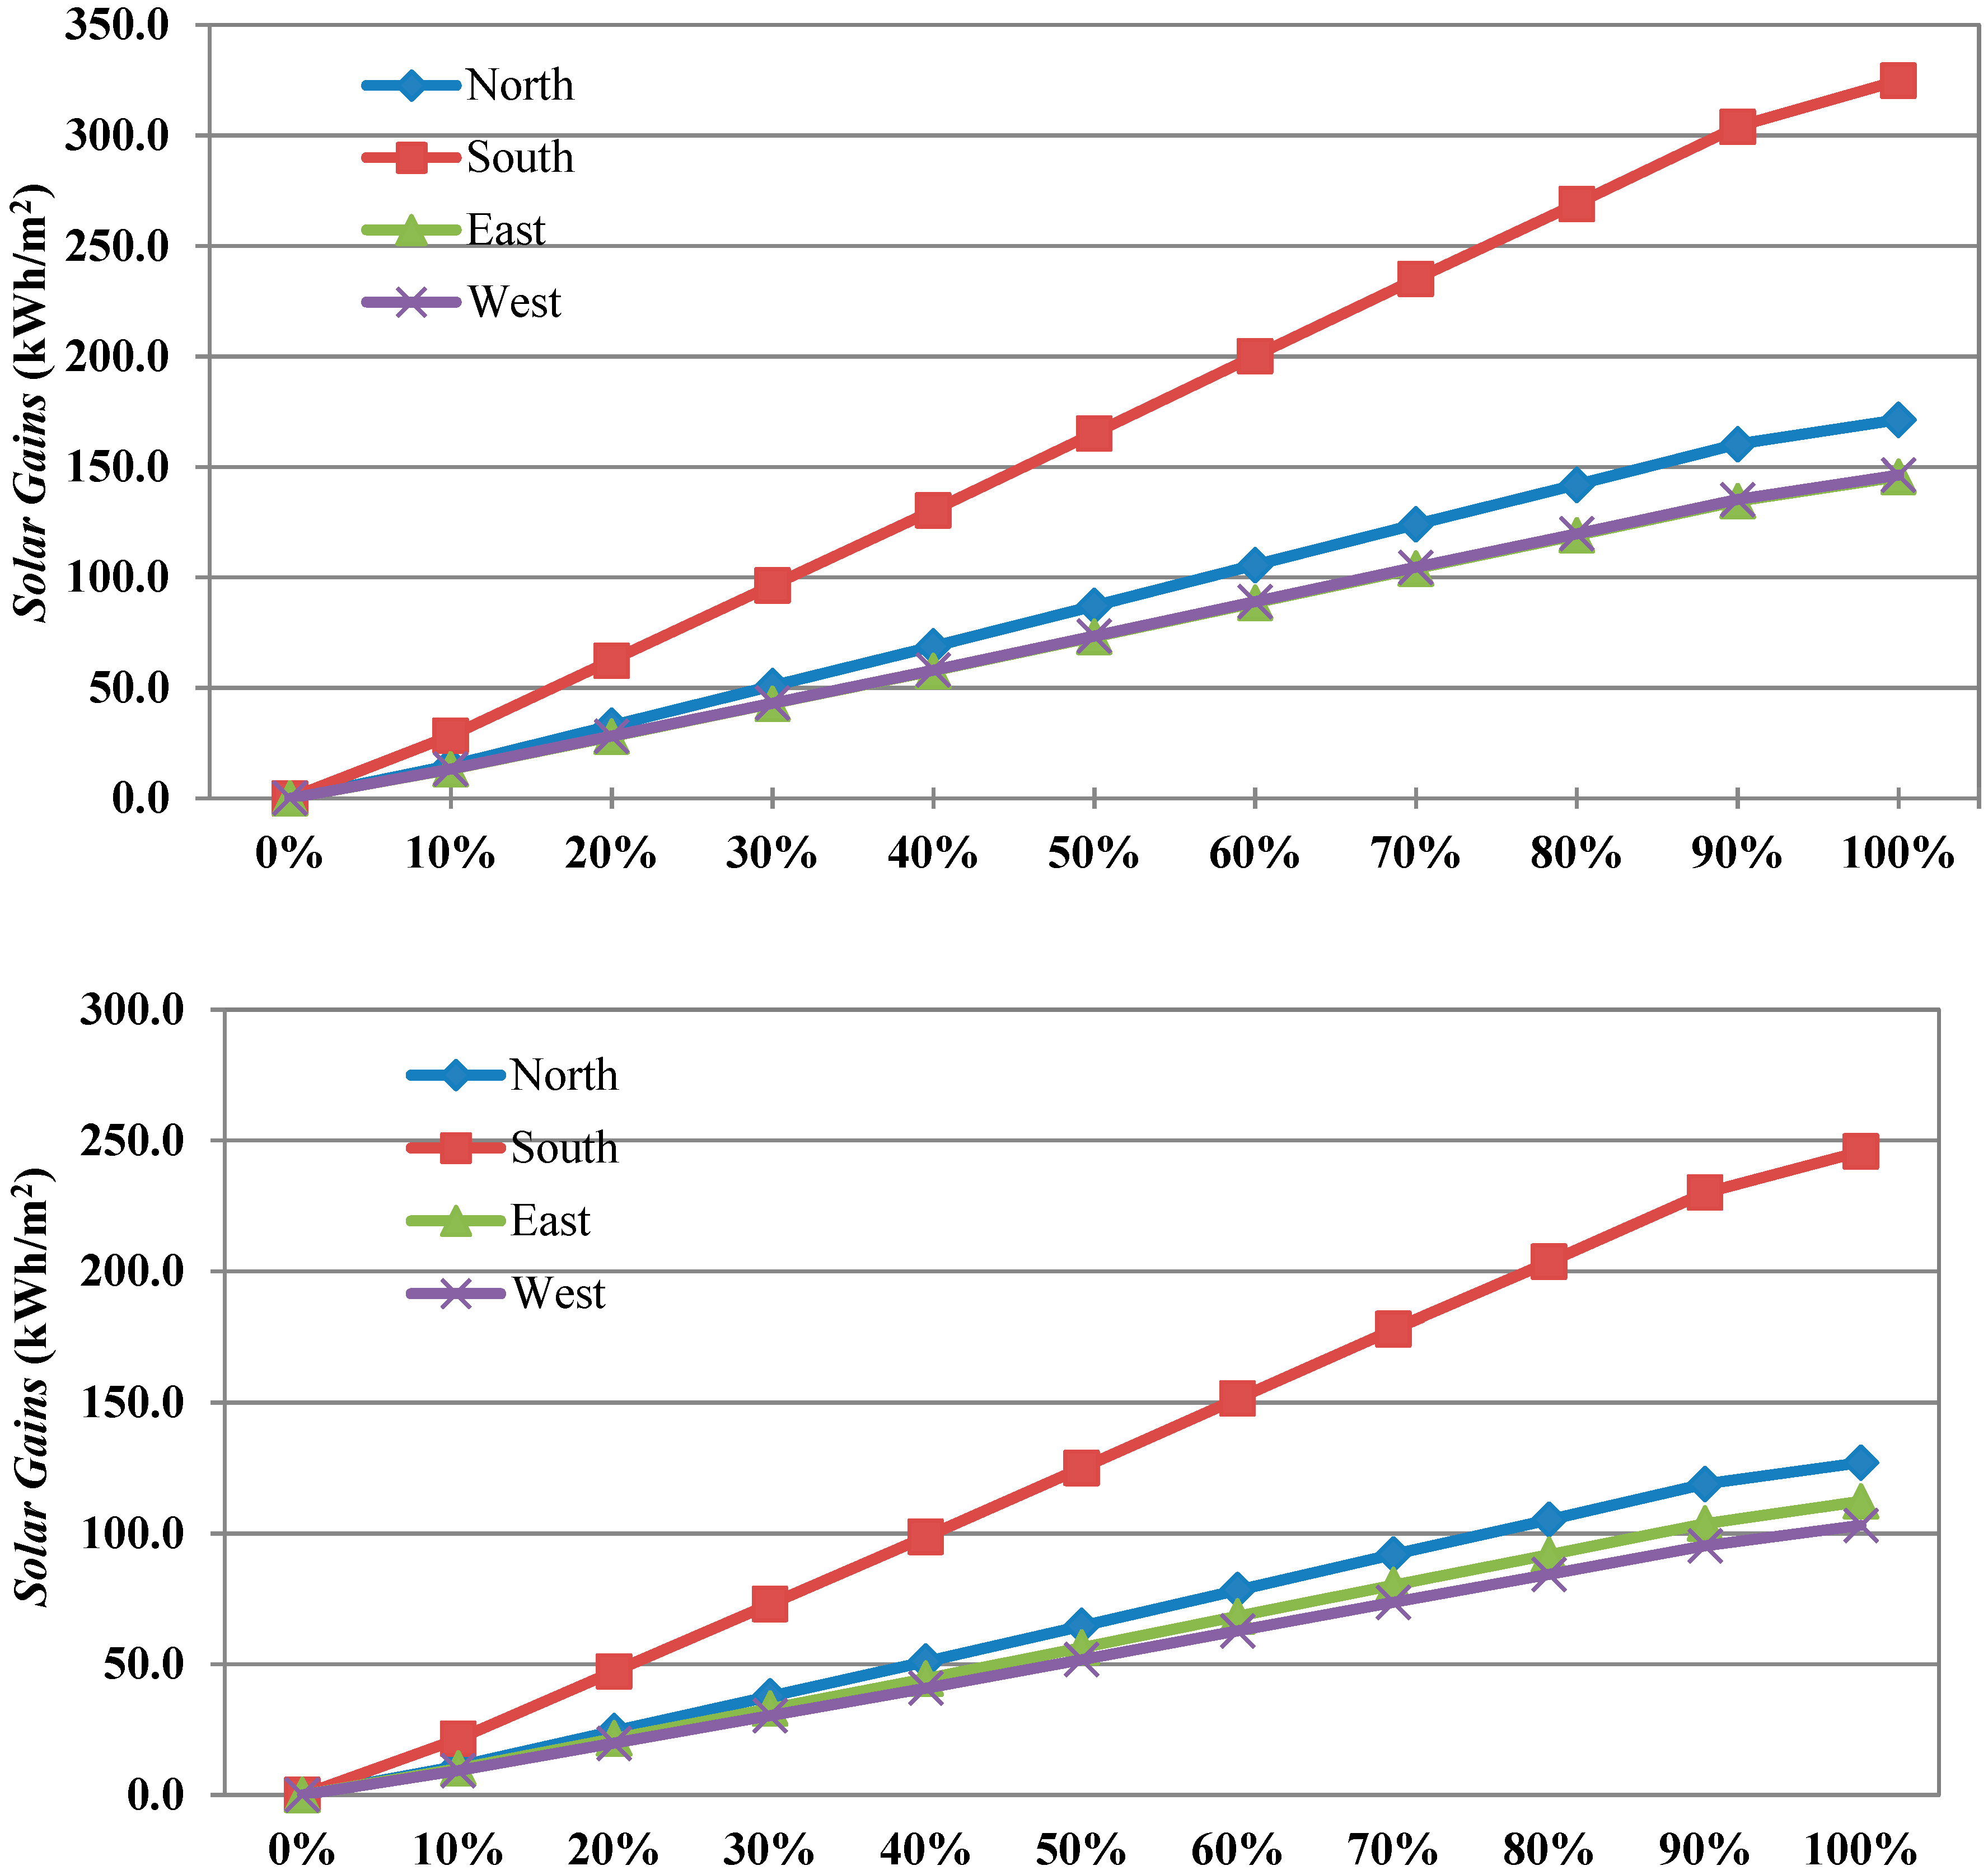
Figure 4 indicates the solar heat gain of the office building with different window percentages for the four facades of an office building in Bushehr, Shiraz, and Tabriz. As illustrated in
Figure 4, as the window percentage increases, the solar heat gain increases because more sun radiation enters the interior.
For Bushehr, the solar heat gain of a building with a 10% window on the south facade of the building was 21.2 kWh/m
2, and this value with 50% WWR reached 123.8 kWh/m
2. At the northern facade of the building, the solar heat gain with 10% of the external window is 10.1 kWh/m
2, and this amount with a 100% window will reach 125.5 kWh/m
2 (
Figure 4). The percentage of solar heat gain for the eastern and western windows is almost equal. The solar heat gain of the building with 10% and 100% windows on the east facade is 10.1 kWh/m
2 and 111.6 kWh/m
2, respectively. Also, the solar heat gain with 10% and 50% windows on the south facade of the building in Shiraz is 28.3 kWh/m
2 and 165.2 kWh/m
2, respectively (
Figure 4). At the northern facade of the building, the solar heat gain with 10% and 100% external windows is 13.3 kWh/m
2 and 171.3 kWh/m
2. The solar heat gain for the percentage of the eastern and western windows is approximately equal. The solar heat gain of the building with 10% and 100% windows on the west facade in Shiraz is 13.2 kWh/m
2 and 146.3 kWh/m
2, respectively (
Figure 4). The solar heat gain of the building with 10% windows at the south facade of the building in Tabriz was 21.4 kWh/m
2 and with 100% windows the solar heat gain increased by 224.4 kWh/m
2. At the northern facade of the building, the solar heat gain with 10% external windows is 9.3 kWh/m
2, and this value at 100% windows is 127.1 kWh/m
2 (
Figure 4). The average solar heat gain yield for the eastern windows is 7% higher than the western windows. The solar heat gain of the building with 10% and 100% windows on the western facade is about 10 kWh/m
2 and 10 kWh/m
2, respectively, and this value for the east windows is 9.2 kWh/m
2 and 103 kWh/m
2.
4.2. Cooling Load
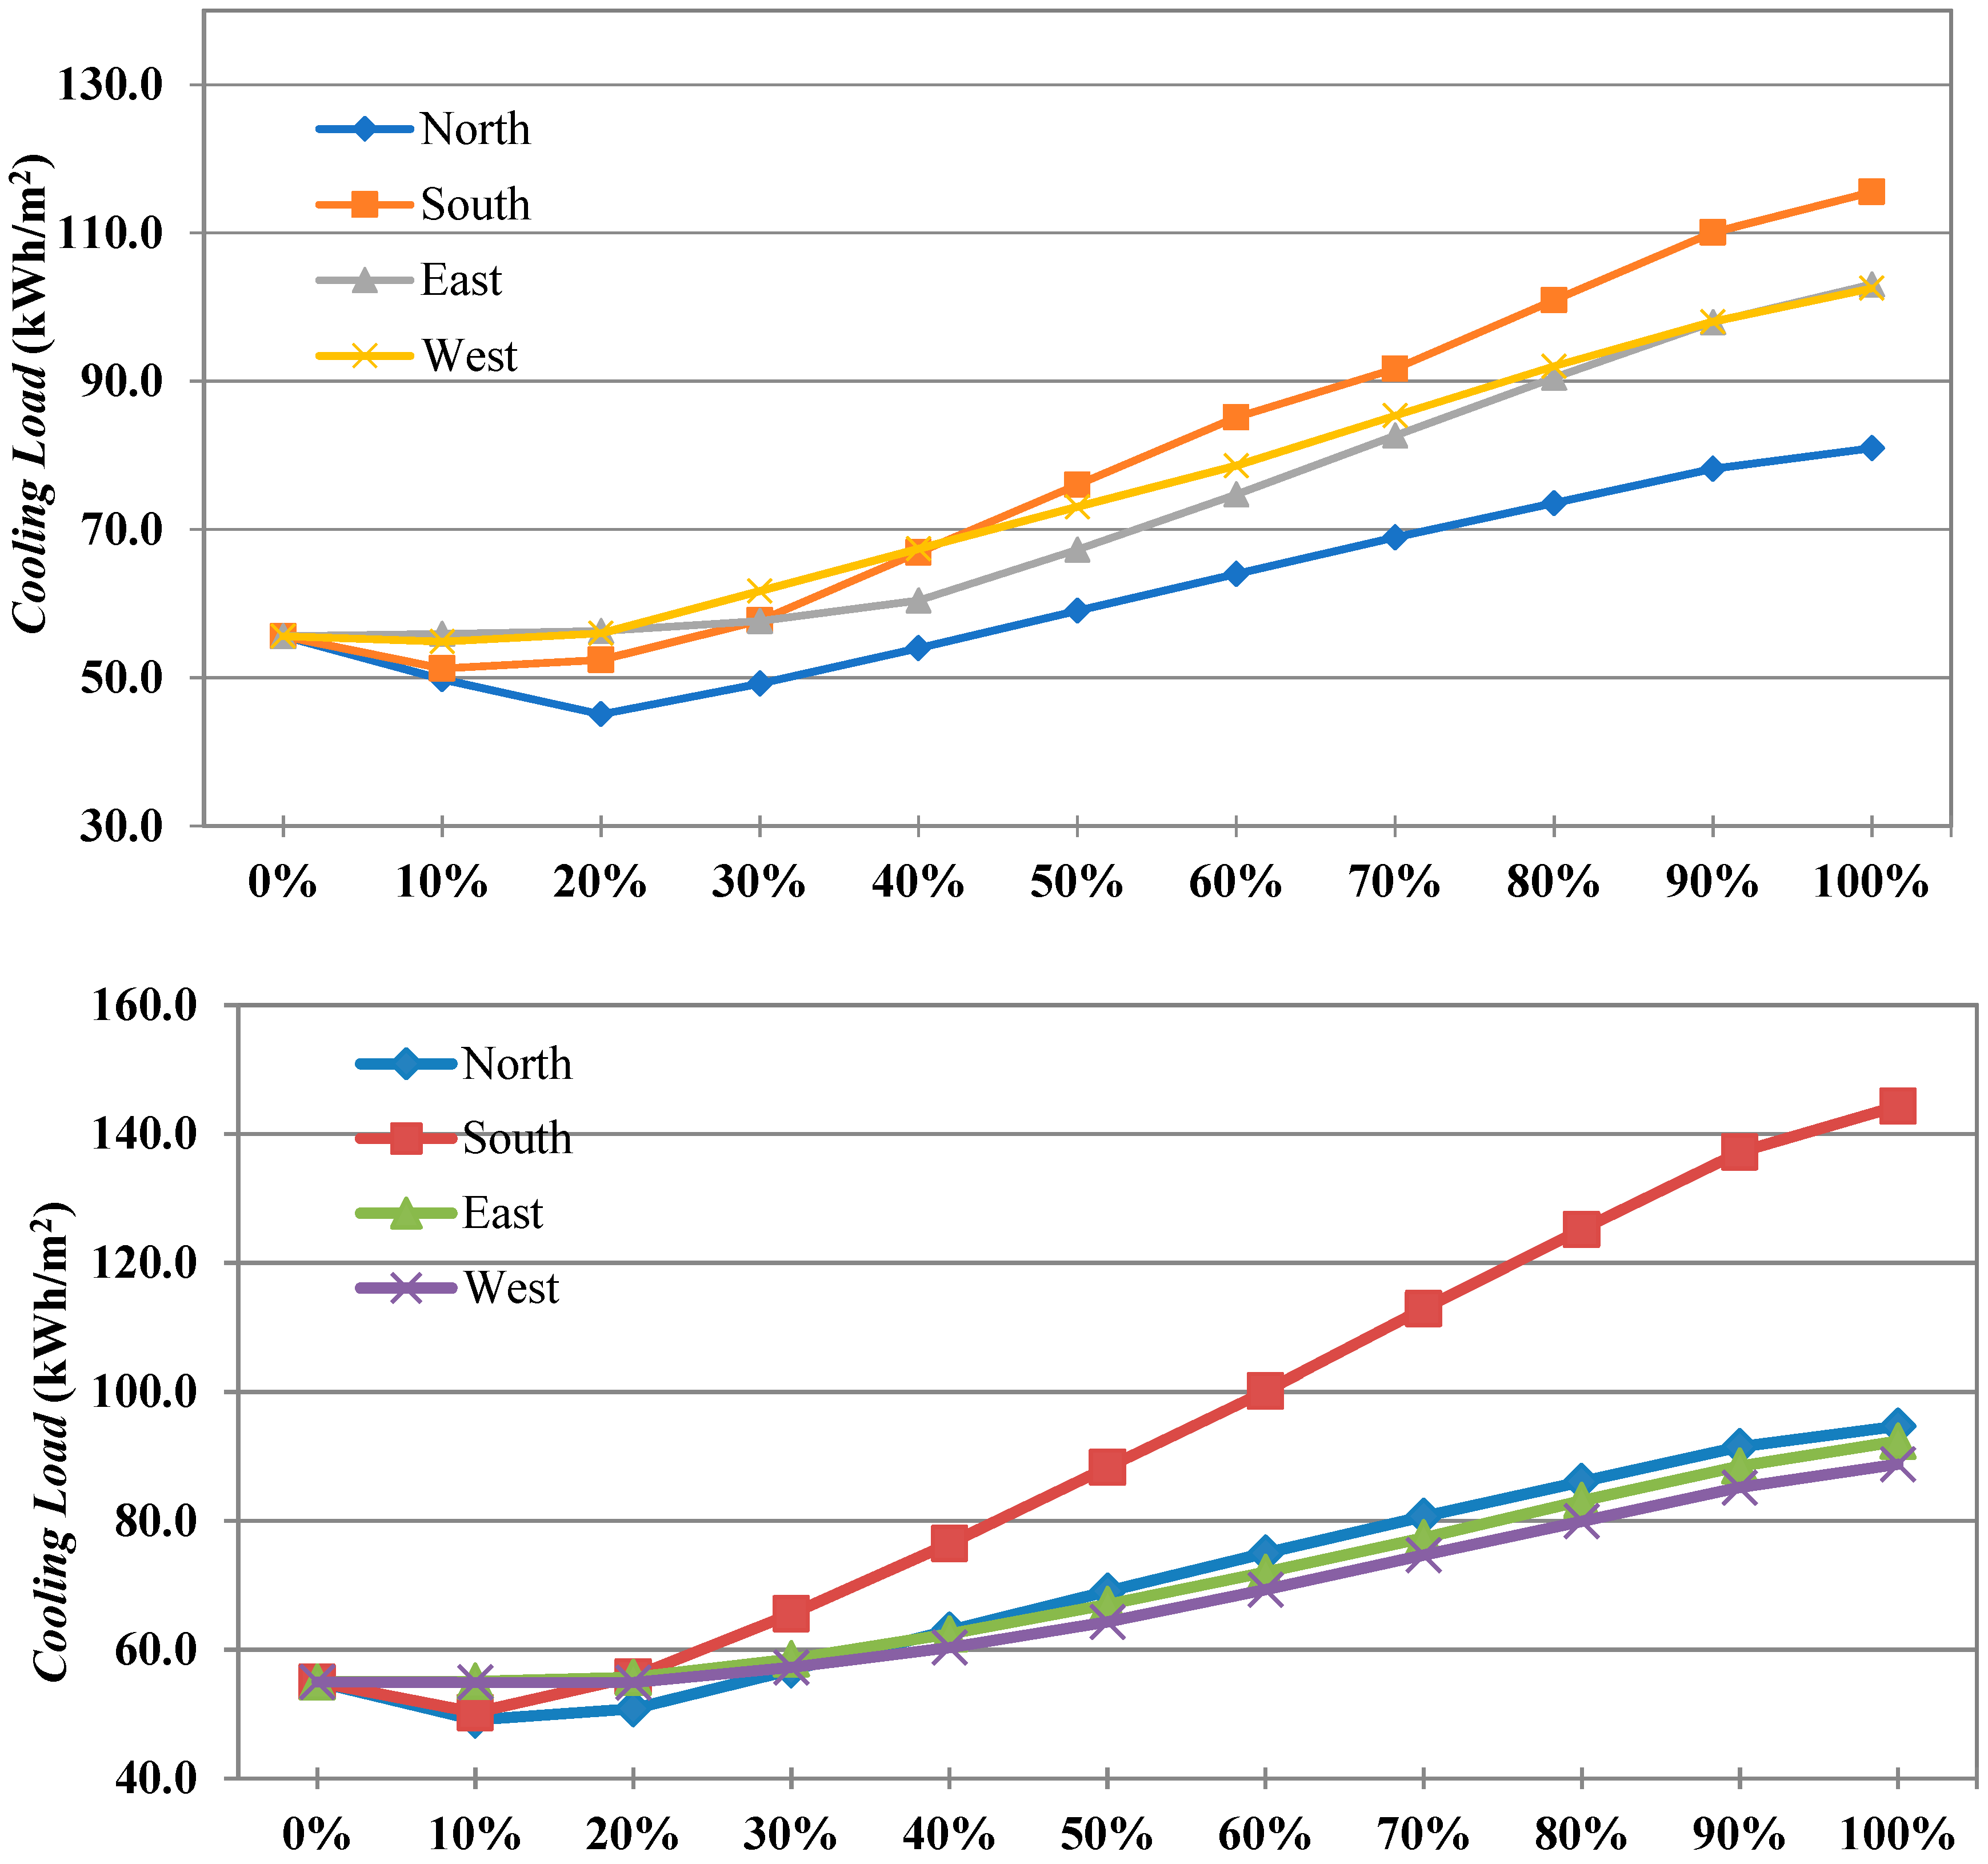
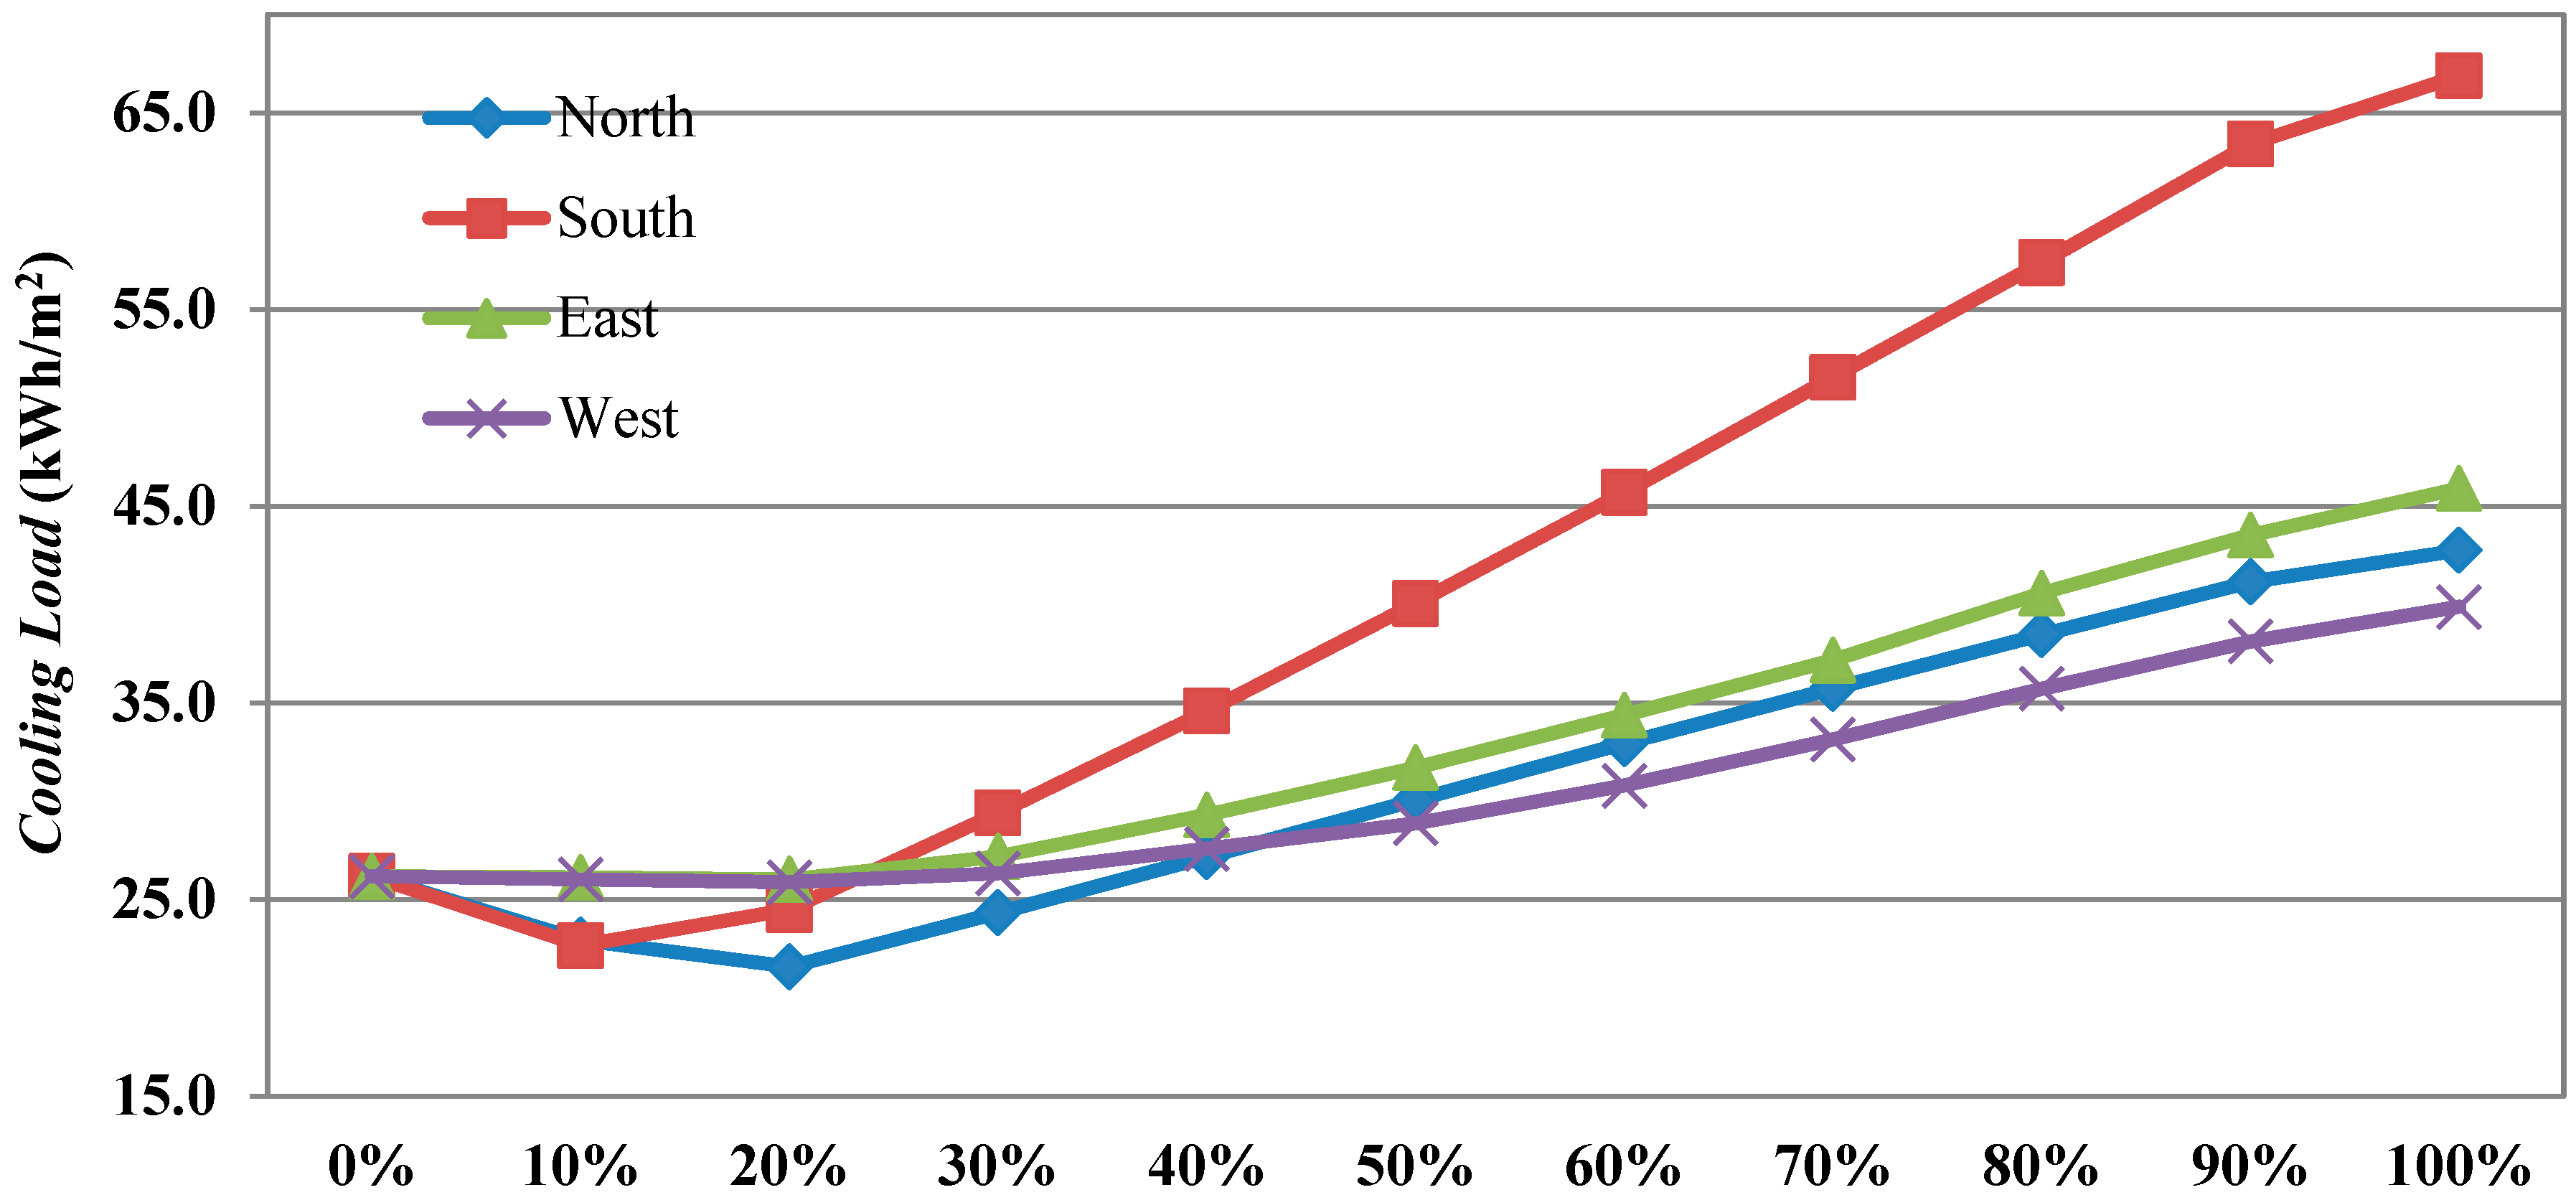
In
Figure 5 the building cooling load has been illustrated with the percentage of windows for the four main facades of the building in the cities of Bushehr, Shiraz, and Tabriz. As shown in
Figure 5, the north facade of the building with 20% external window has the minimum cooling load, which is 45.1 kWh/m
2, and the maximum cooling load belongs to a 100% external window, which is 80.9 kWh/m
2. On the south facade, the windows with ratios of 10%, 20%, and 30%, and with a mean consumption of 57 kWh/m
2, have a minimum cooling load due to the low solar heat gain with these window percentages (
Figure 5). In Bushehr, the eastern and western facades of the 10% and 20% windows, with consumption of 54.9 kWh/m
2, had the minimum cooling load consumption.
In Shiraz the building with 10% and 30% external windows at the northern facade and the southern facade has the minimum cooling load; in addition, the maximum cooling load belongs to the 100% external window. In the south facade, buildings with 10%, 20%, and 30% of window have cooling loads of 50.2 kWh/m
2, 54.9 kWh/m
2, and 65.6 kWh/m
2, respectively. At the north facade of the building also, with 10%, 20%, and 30% of window, the cooling loads are 50.2 kWh/m
2, 50.8 kWh/m
2, and 57.2 kWh/m
2, respectively. In addition, in Shiraz, the eastern and western facades of the building with 10% and 20% and the cooling load of 54.9 kWh/m
2 have the minimum cooling load (
Figure 5).
In Tabriz, the building with 10% to 30% windows on four facades has the minimum cooling load, and the maximum amount of cooling load also belonged to the 100% external window. On the south facade of a building with 10%, 20%, and 30% windows the cooling load is 22.7 kWh/m
2, 24.5 kWh/m
2, and 29.4 kWh/m
2, respectively. At the north facade of the building, with 10% and 30% window, the cooling load is 22.7 kWh/m
2 and 26.3 kWh/m
2, respectively. The cooling load of the building for Tabriz in the east and west facades, for 10%, 20%, and 30% windows, is 25.9 kWh/m
2. Meanwhile, the low amount of cooling load of buildings with 10% and 20% on the south and north facades are due to low solar heat gain (
Figure 5); this in turn is because less solar radiation enters the environment, resulting in a lower indoor temperature.
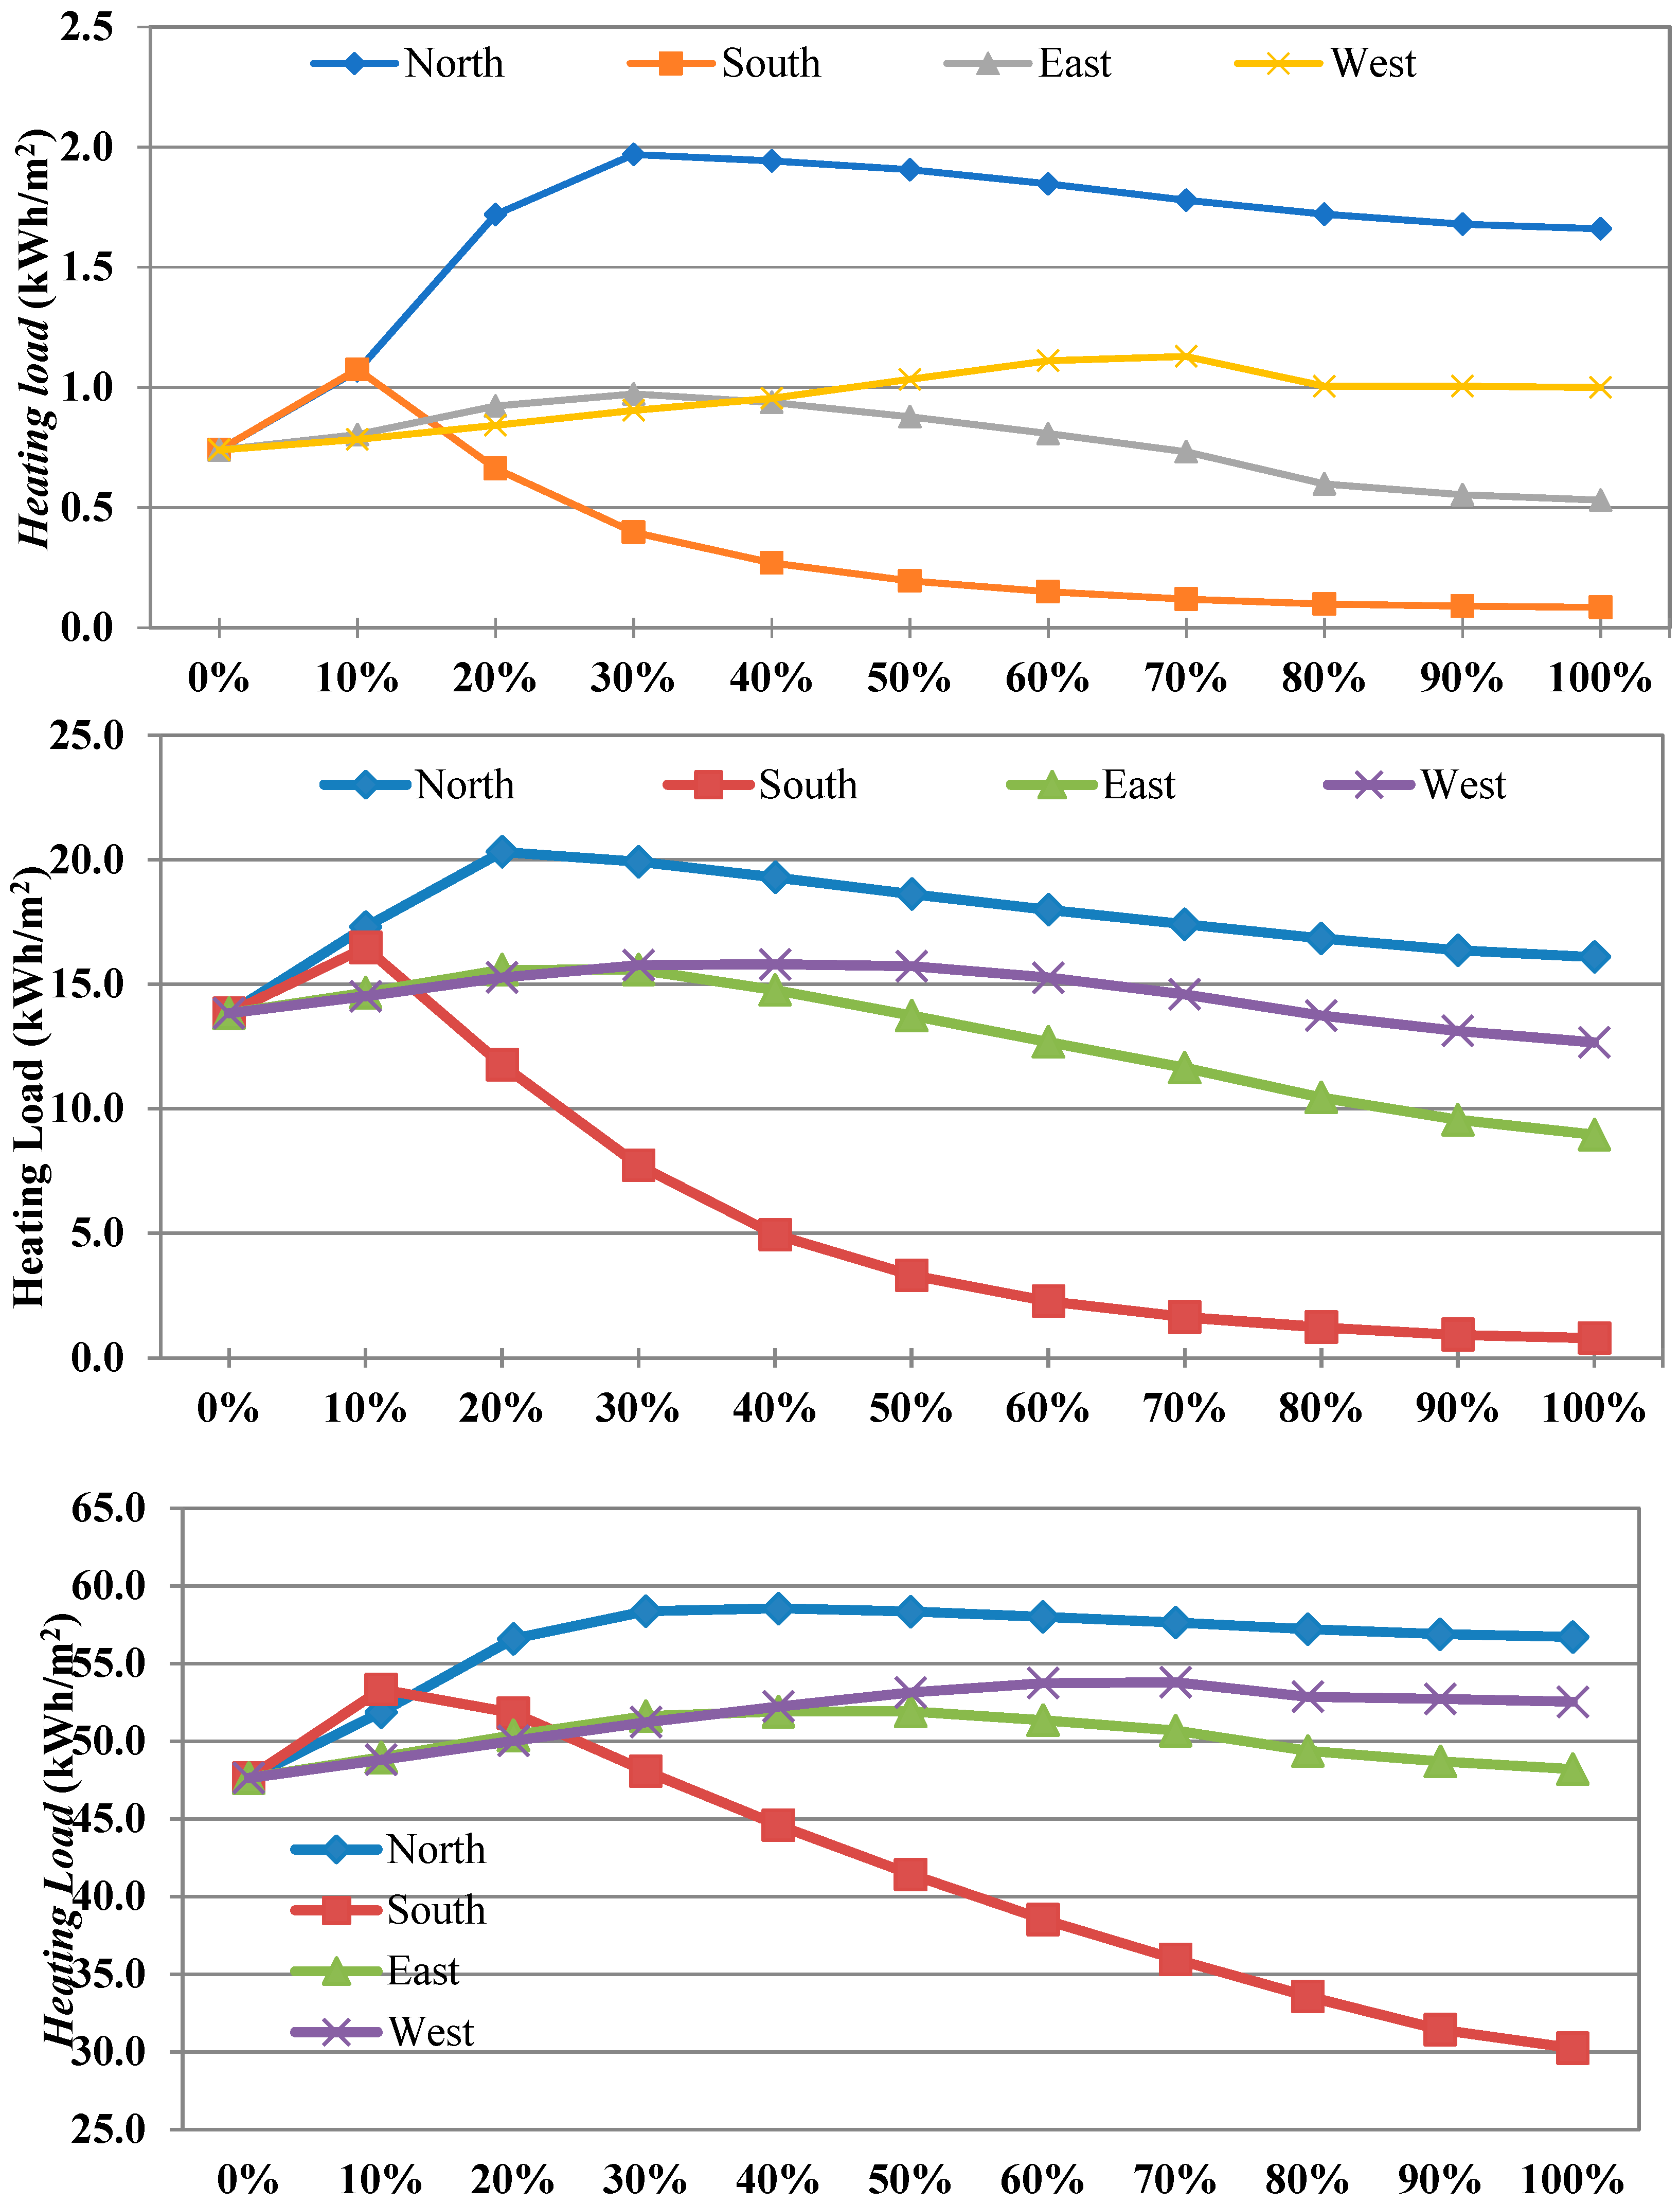
4.3. Heating Load
In
Figure 6, the amount of heating load of the building with the percentages of windows for Bushehr, Shiraz, and Tabriz is indicated. When increasing the window percentage for the buildings in the studied cities, the heating load decreases, because more solar heat enters the indoor environment (
Figure 6) and increases the room temperature. According to
Figure 6, there is a significant difference between the cooling load of the building with 10% and 100% windows, and based on
Figure 6 there is no significant difference between the heating load of a building with 10% and 100% windows. The results are in line with the results of Persson et al. [
7], in whose study it is pointed out that the dimensions of the window do not have a significant impact on the heating load; however, it has a large effect on the cooling load. In addition, according to
Figure 6, increasing the window percentage from 30% to 100% reduces the heating load due to the sunlight, which helps to increase the temperature of the room. Meanwhile, these results are unlike the results of Persson et al. [
7], who mentioned that the larger dimensions of a northern window cause a slight increase in the heating load.
The north facade of the building, with a 30% window and a consumption of 2 kWh/m2, has the maximum consumption of heating load. In addition, the south facade of the building with a 10% window and the consumption of 1.1 kWh/m2 has the maximum heating load; by increasing the window percentage to 50% and 100%, this amount was reduced by 0.2 kWh/m2 and 0.1 kWh/m2. Also, it was revealed that a building with 30% windows on the eastern facade and the consumption of 1 kWh/m2 has the maximum heating load, and this amount with the consumption of 0.5 kWh/m2 is reduced to a minimum by 100% windows. On the western facade of the building in Bushehr, a building with 10% windows and a consumption of 0.8 kWh/m2 has the minimum heating load; it reaches the maximum with a consumption of 1.1 kWh/m2 by a 60% window.
In Shiraz, the northern facade of the building with a 20% window and a consumption of 20.3 kWh/m2 has the maximum annual heating consumption, and with a 100% window it has the minimum heating load, which is 16.1 kWh/m2. The south facade of the building with 10% windows and a consumption of 53.3 kWh/m2, has the maximum heating load and the building with a 100% window in the south facade consumes the minimum amount of heating load, which is 0.8 kWh/m2. In Shiraz, buildings with 30% windows on the east and west facades of and with a consumption of 15.3 kWh/m2 have the maximum heating load and the east and west facades of the building with a 100% window have the minimum heating load with consumption of 9 kWh/m2 and 12.7 kWh/m2.
In Tabriz, the building with 30% window on the northern facade has a consumption of 56.8 kWh/m2, which is the maximum consumption of heating load. In addition, the building with a 10% window and a consumption of 53.3 kWh/m2 on the northern facade has the minimum heating load; this is because a lower amount of heat is transmitted through the windows. Also, the south facade of the building with 10% window and consumption of 53.3 kWh/m2 has the maximum heating load; increasing the window percentage to 100% would decrease this amount to 30.3 kWh/m2. In Tabriz, at the eastern facade, the maximum and minimum heating loads are 40%, with a consumption of 52.5 kWh/m2, and 10% and 48.8 kWh/m2, due to the angle of sun radiation in Tabriz. Also, in the west facade, the maximum and minimum heating load is 70% with a consumption of 53.8 kWh/m2 and 10% with a consumption of 48.8 kWh/m2, respectively.
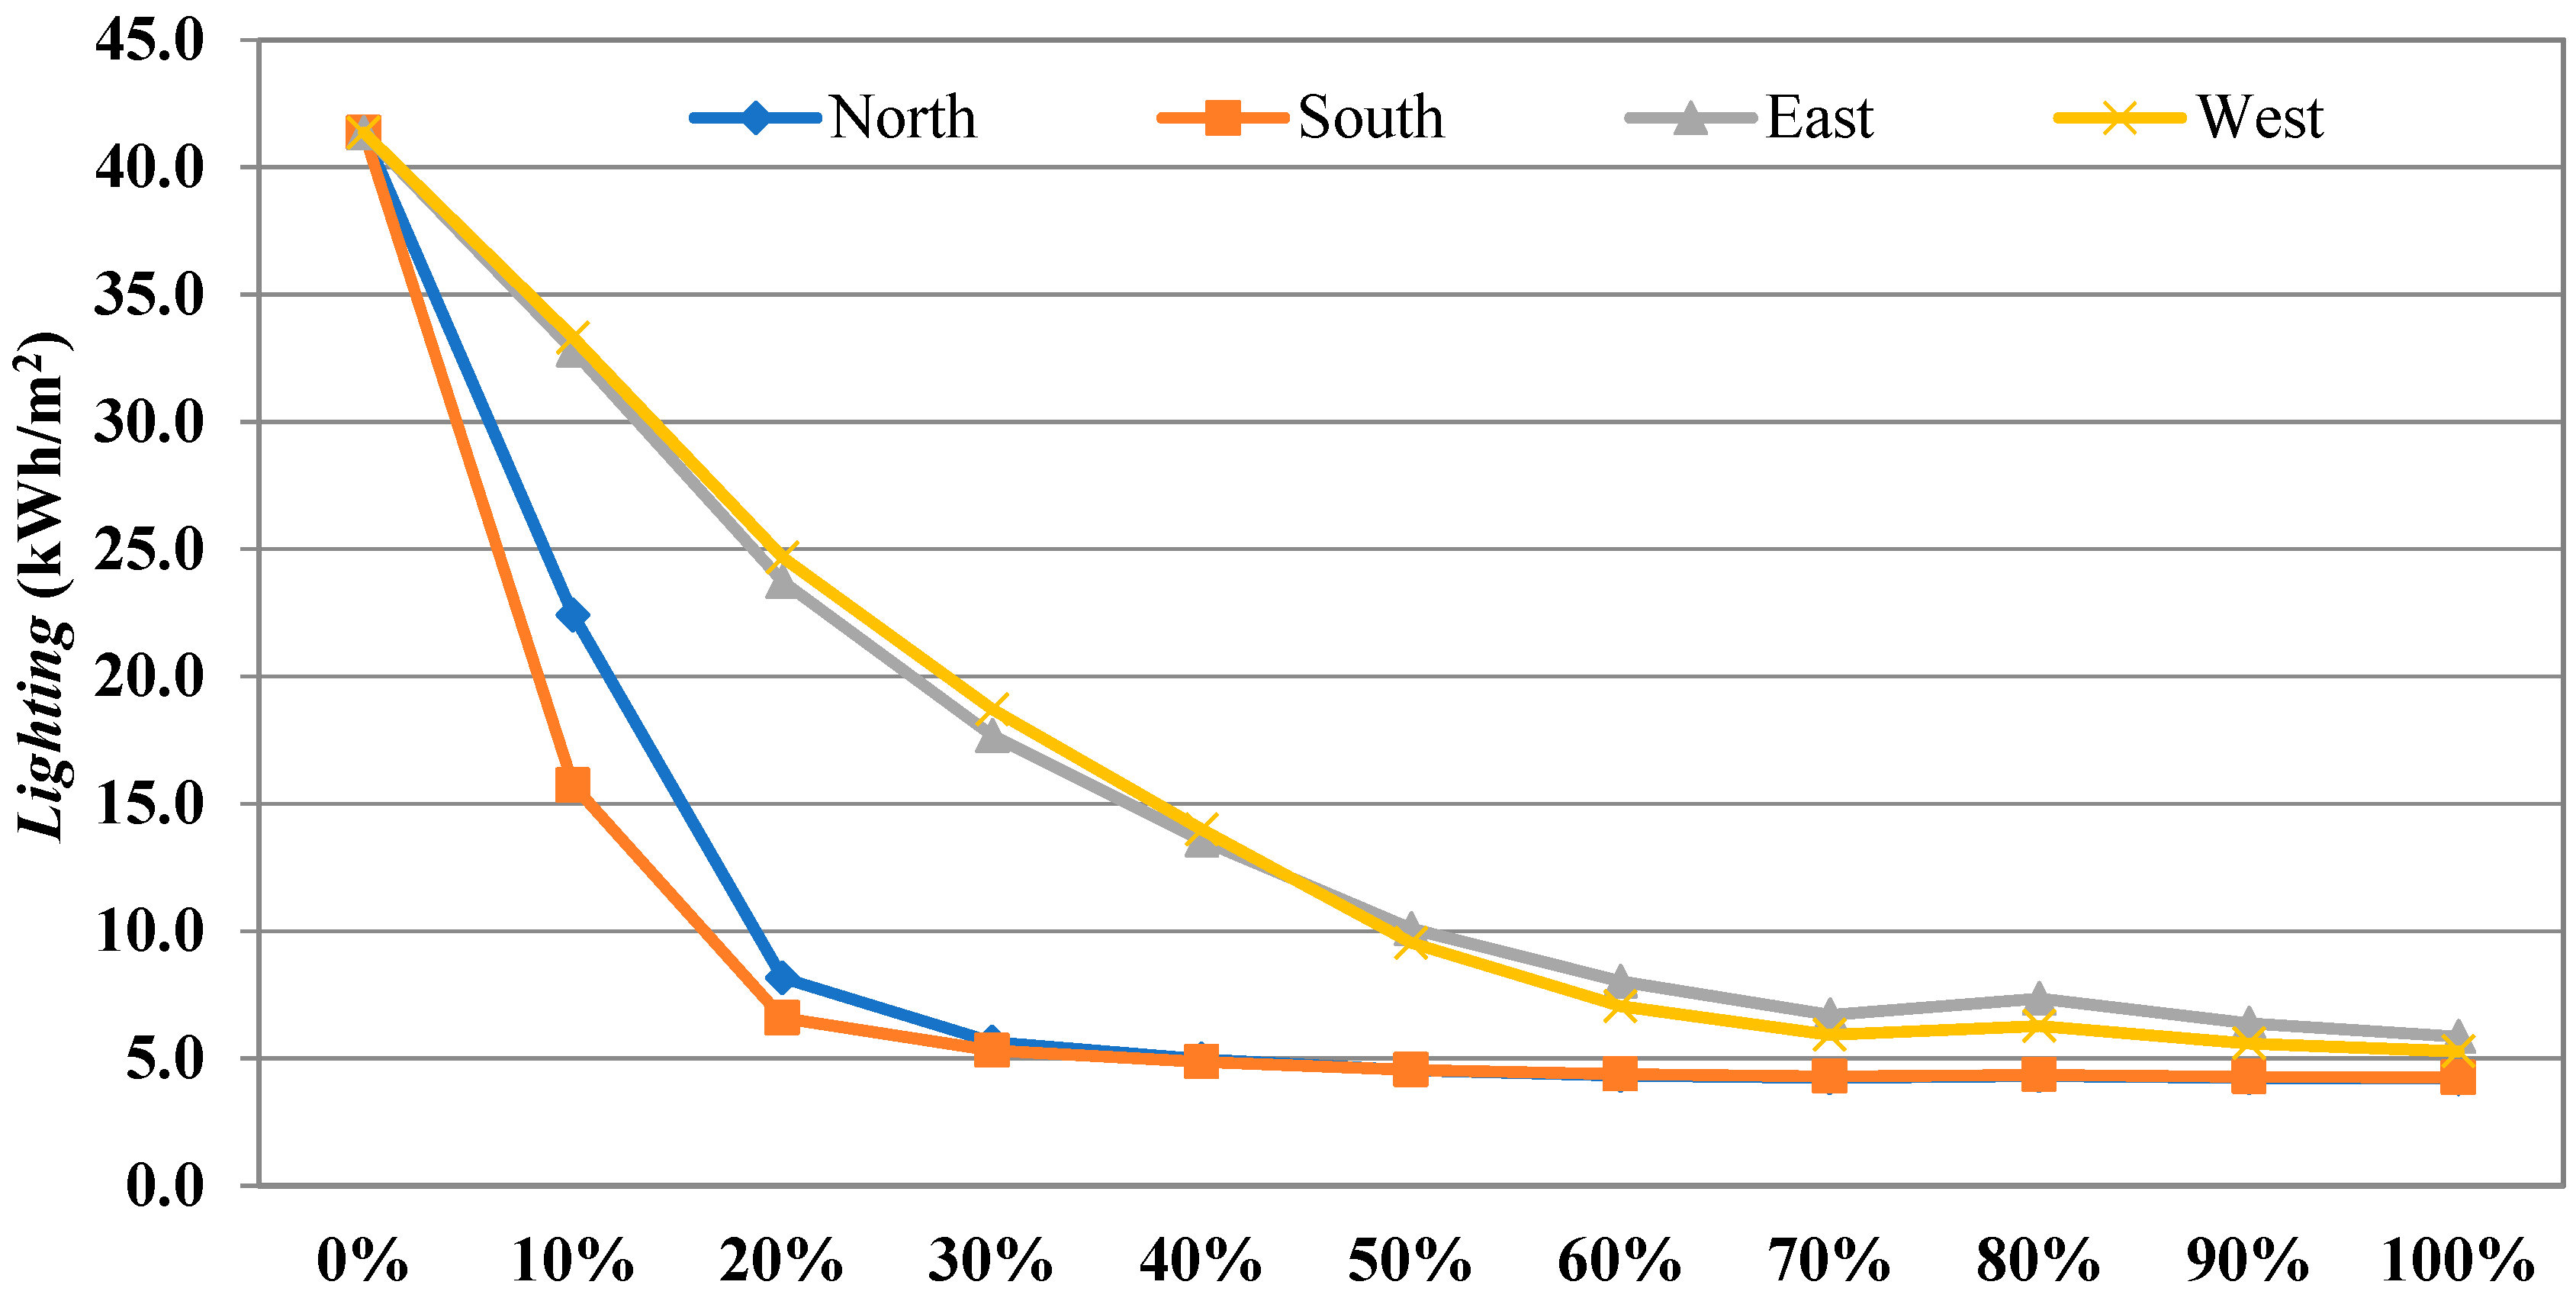
4.4. Lighting Consumption
In
Figure 7, the annual lighting consumption of the building for various window percentages is illustrated for the cities of Bushehr, Shiraz, and Tabriz. According to
Figure 7, when increasing the percentage of windows in all facades, the amount of light consumption decreased because more natural light entered the indoor environment, which leads to a decrease in lighting consumption.
In Bushehr, the annual lighting consumption of a building with 10% windows on the south and north facade is 15.7 kWh/m2 and 22.4 kWh/m2, respectively, while at 30% external windows it reaches 5.3 kWh/m2. In the northern and southern facades, the lighting consumption above the 30% window is almost constant. Also, the annual lighting amount of a building with 10% external windows on the east and west facade is approximately 33.3 kWh/m2, adjusted to 6.9 kWh/m2 with a 60% window.
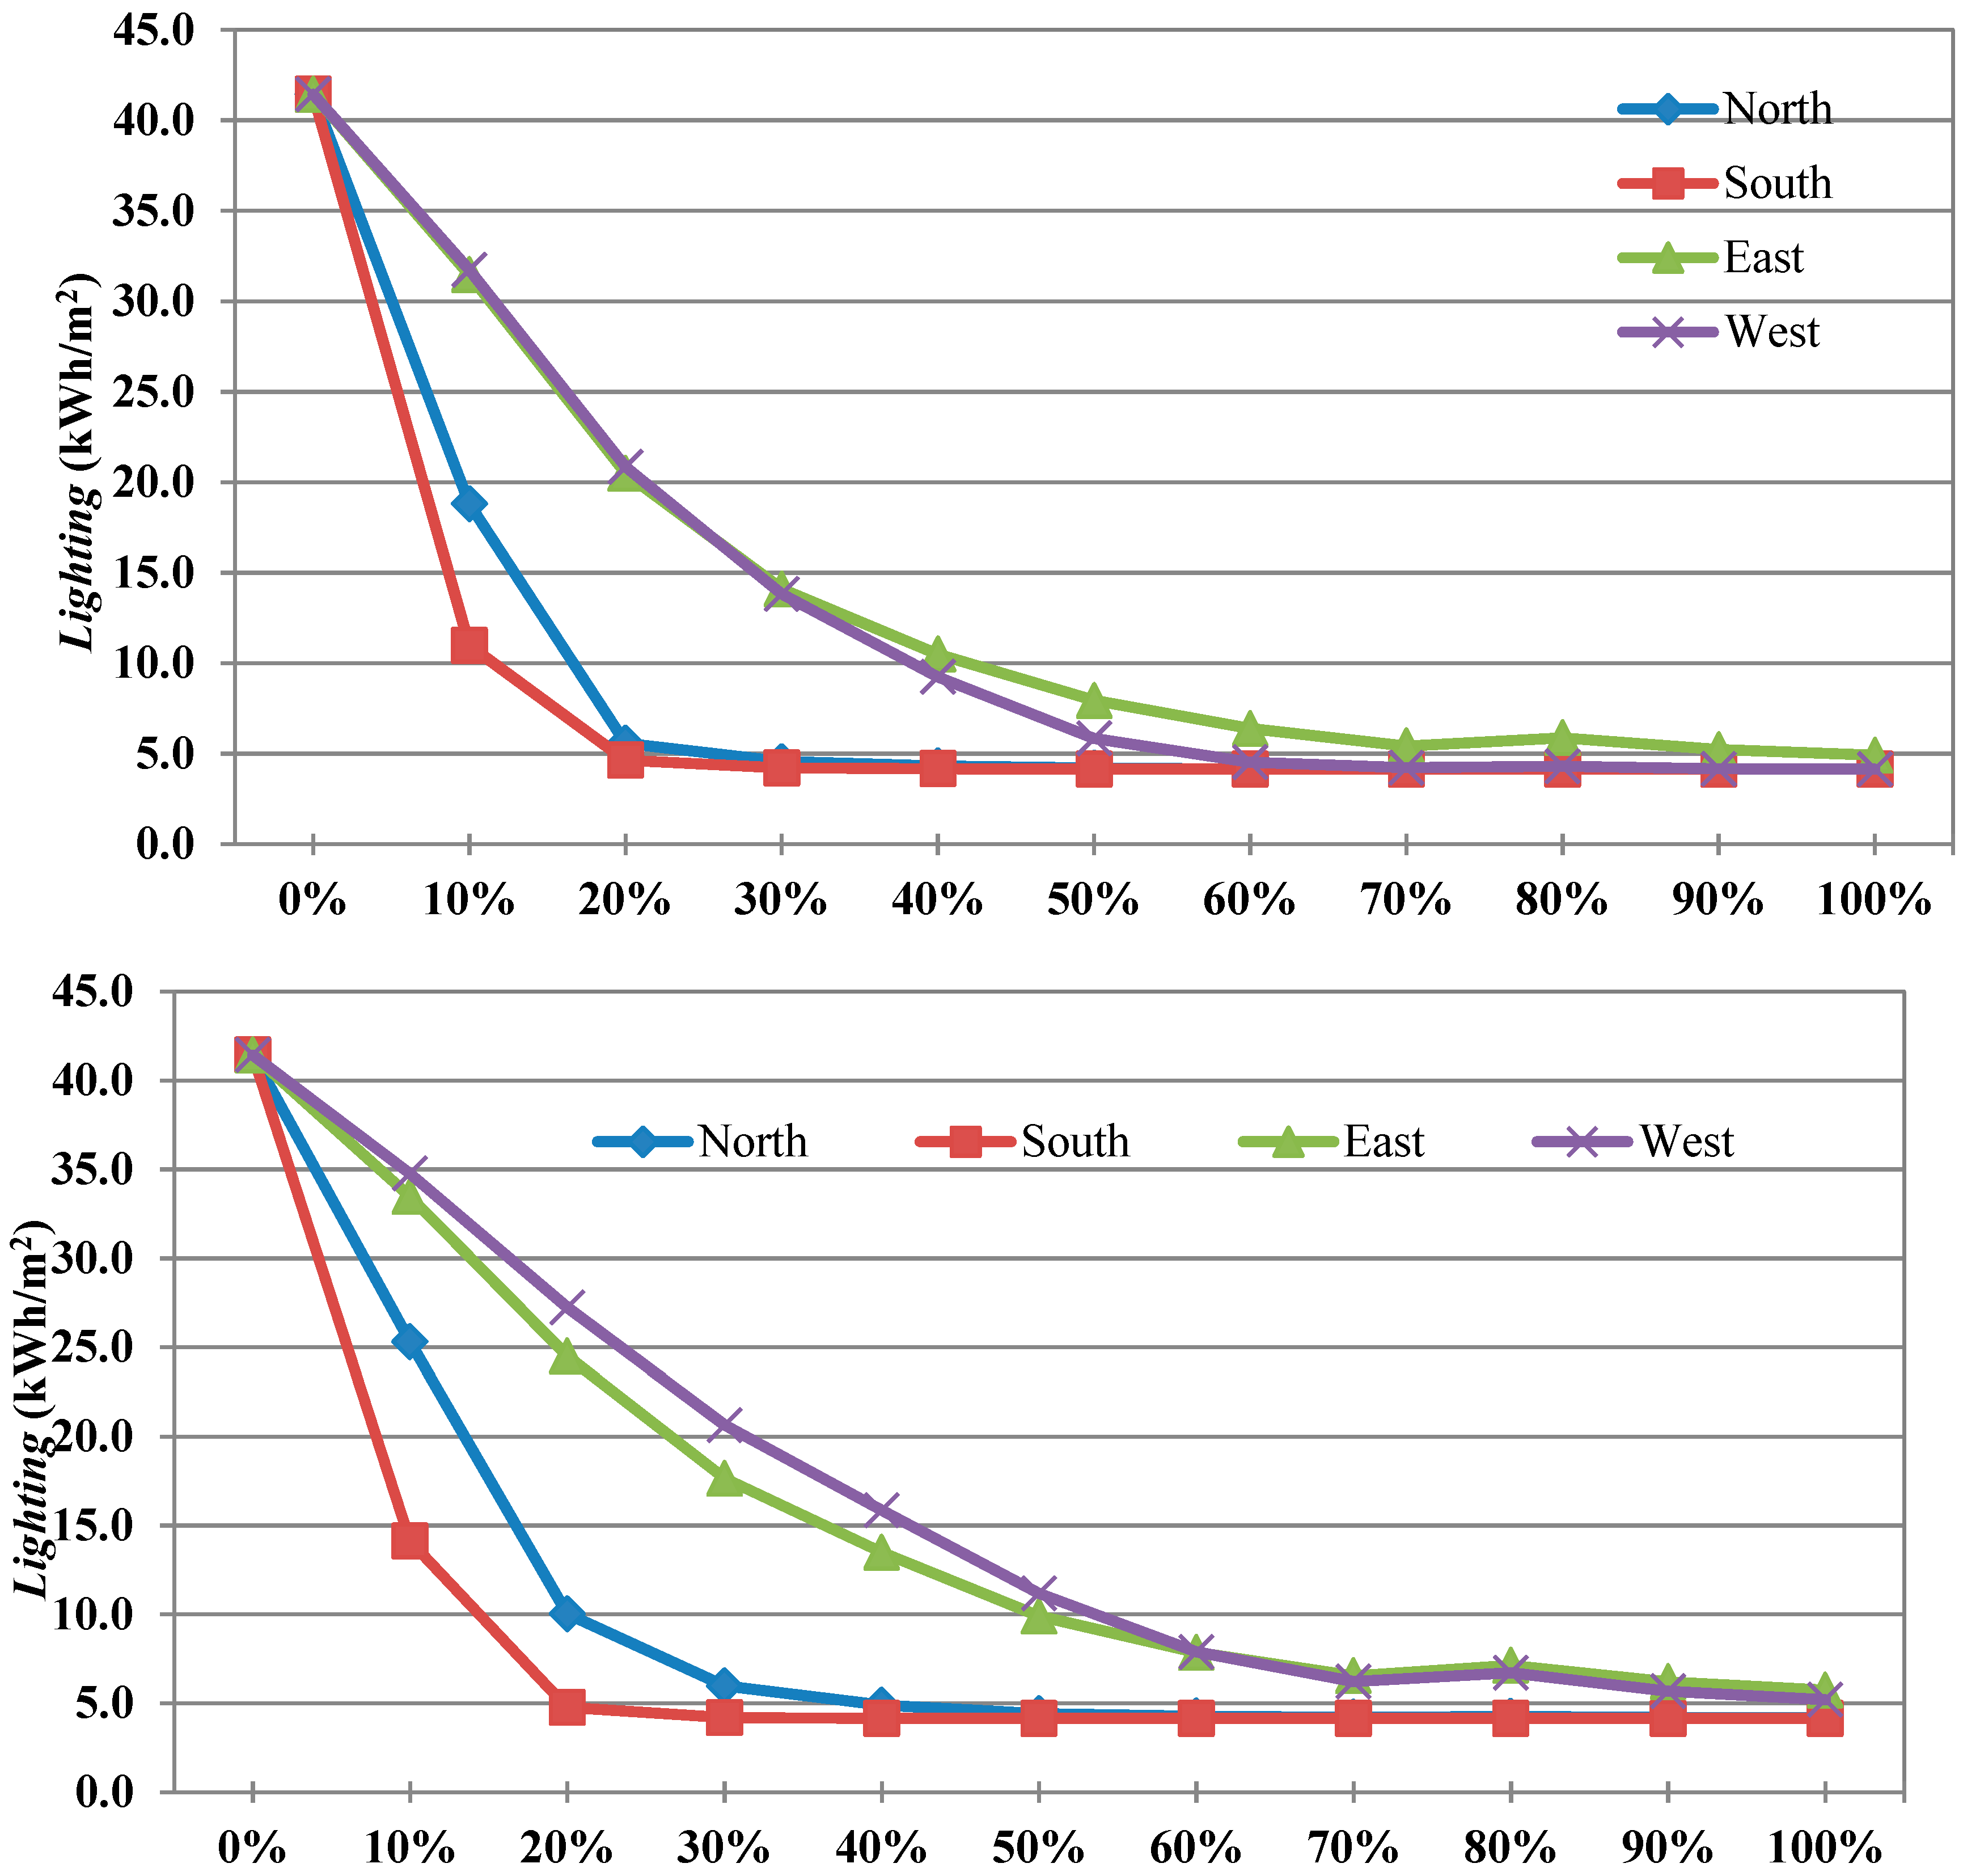
In Shiraz, buildings with 10% windows at all facades have the most lighting consumption. The 10% windows on the north and south facades led to a consumption of 18.8 kWh/m
2 and 11 kWh/m
2, respectively. Also, a 10% window on the east and west facade has consumed 31.7 kWh/m
2. In the north and south facades, windows above 20% have almost the same performance, which causes a lighting consumption of 4 kWh/m
2, and in the east and west facades, windows above 60% have the same lighting consumption and do not significantly change (
Figure 7).
In Tabriz, buildings with 10% windows in all facades have the maximum lighting consumption. The 10% windows on the north and south facades have led to a lighting consumption of 25.3 kWh/m2 and 14.1 kWh/m2, respectively, and have consumed 34.9 kWh/m2 on the east and west facades. In Tabriz, the lighting of a building with a window above 40% on the northern and southern facades is almost the same, which results in a lighting consumption of 4.1 kWh/m2. On the east and west facades, windows above 70% have almost the same lighting consumption, 5.8 kWh/m2.
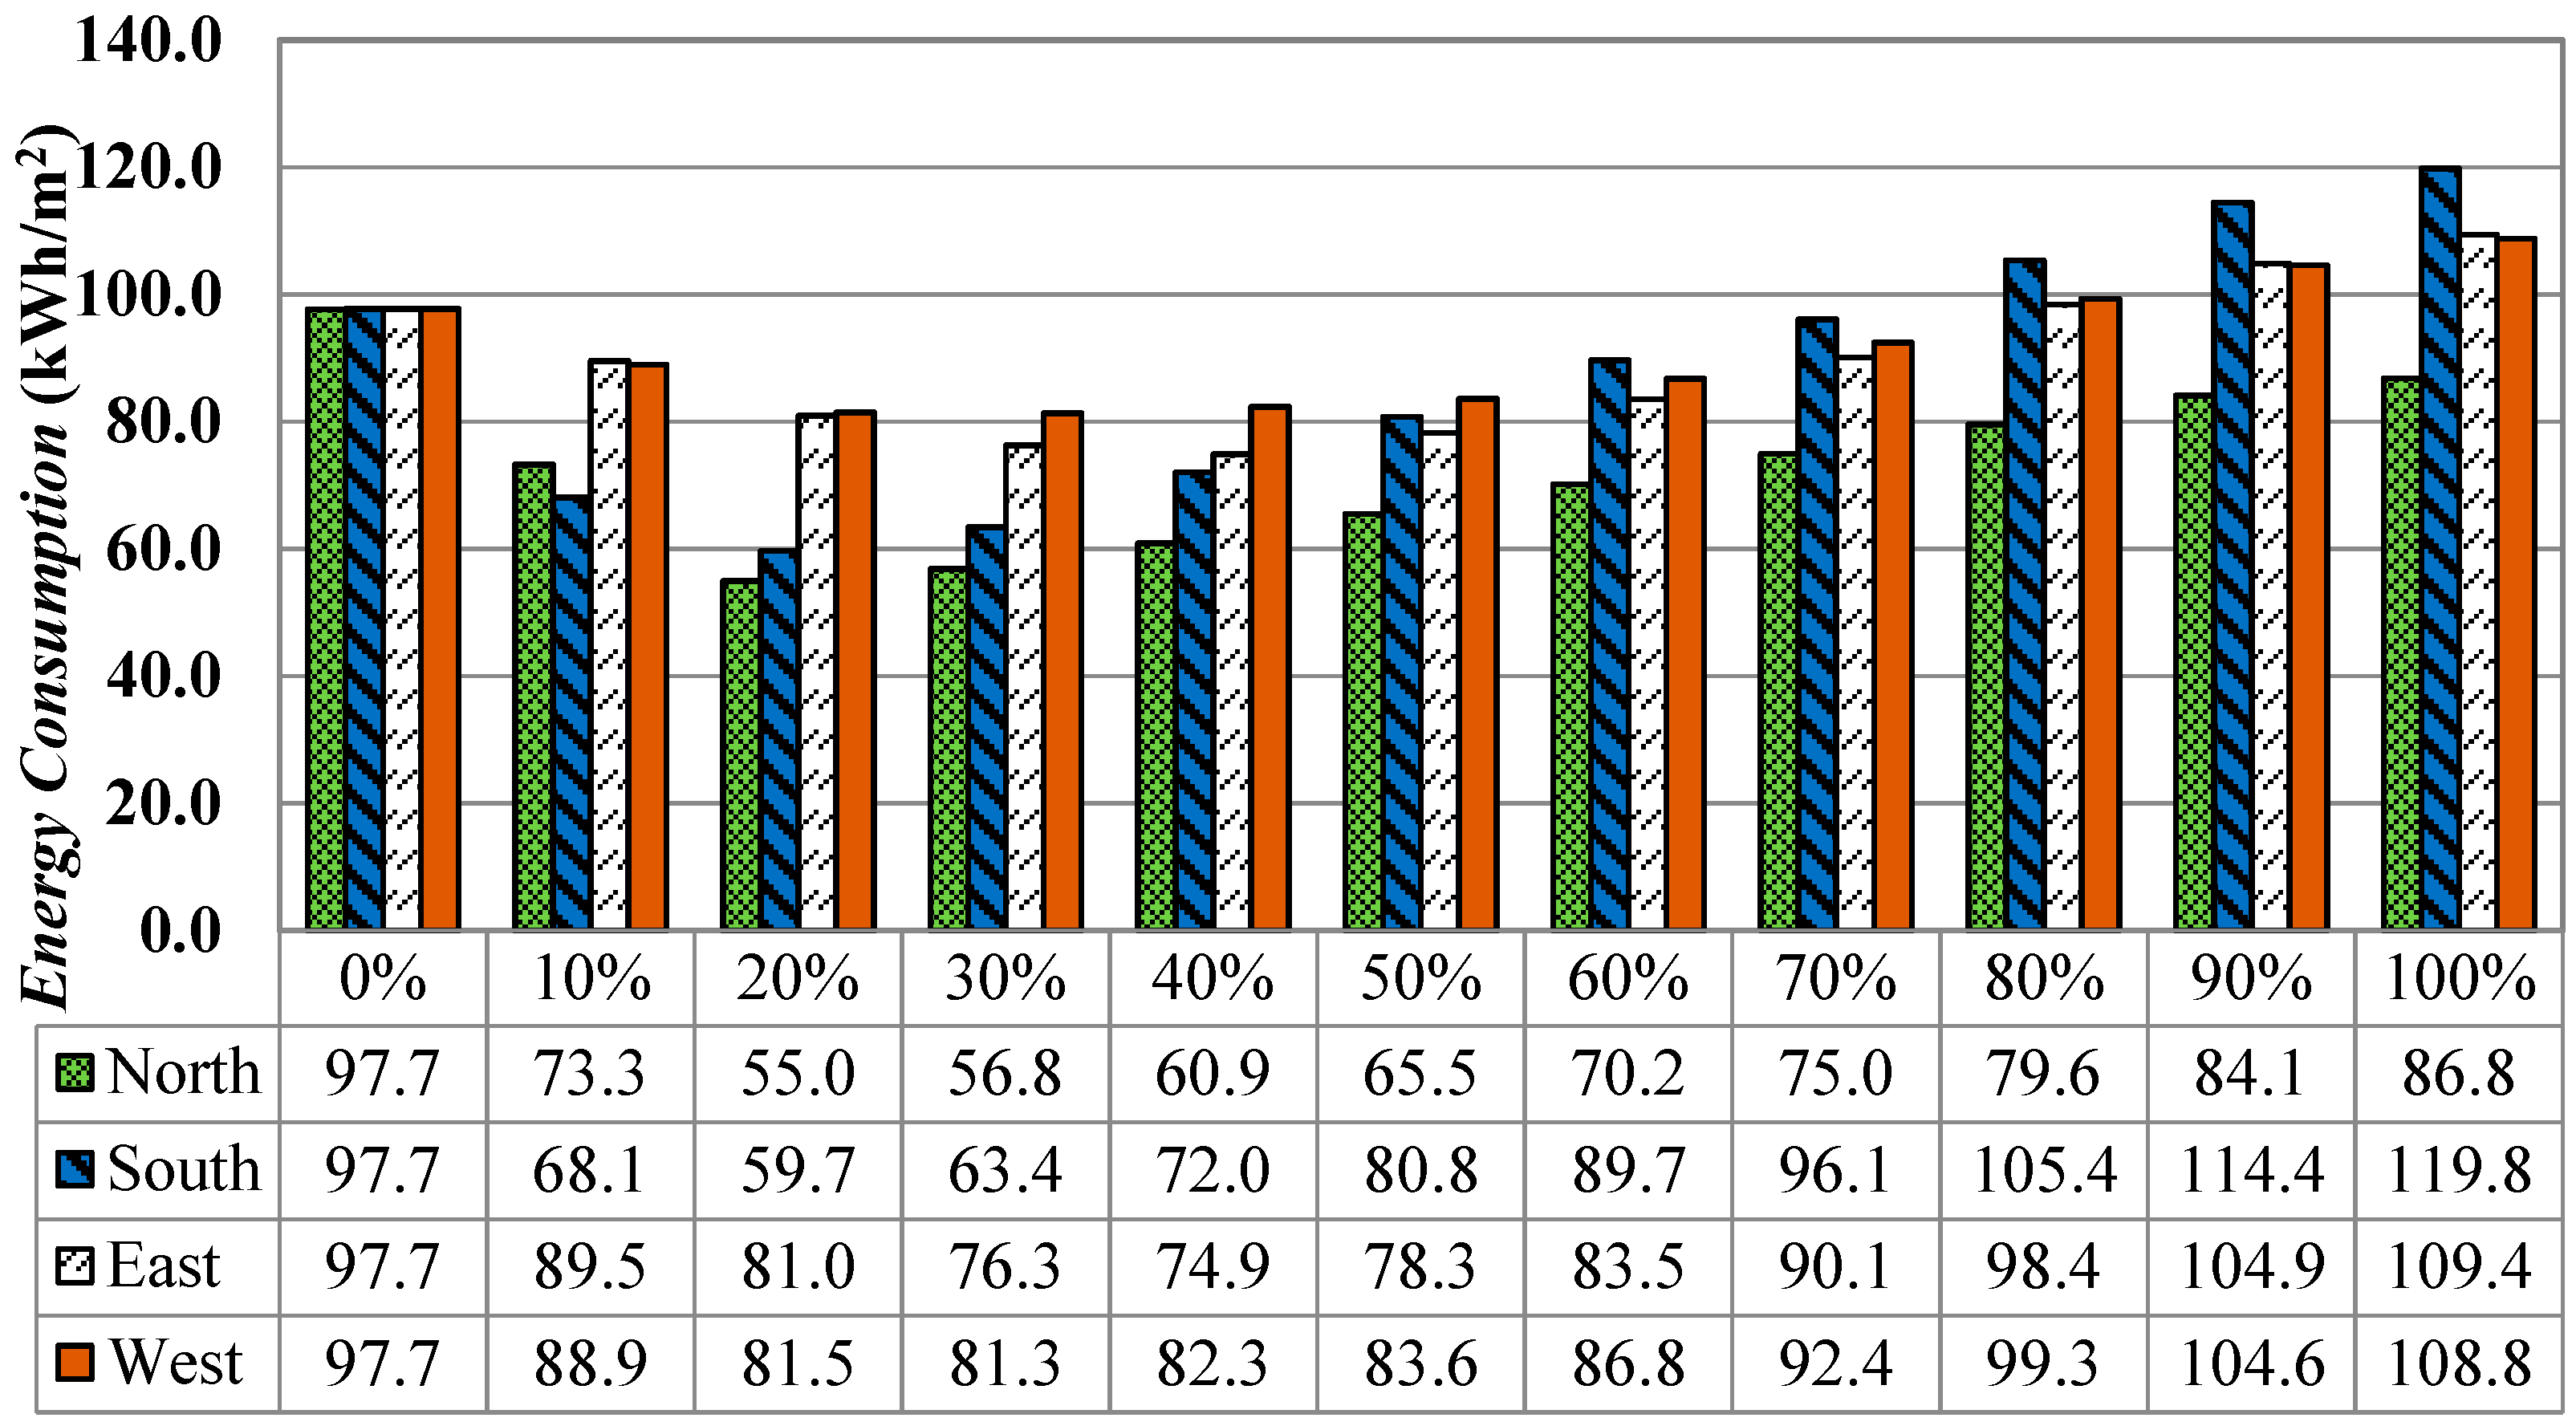
4.5. Total Loads of Cooling, Heating, and Lighting Consumption
In
Figure 8, the total amount of cooling, heating, and lighting consumption of the building with different percentages of windows in the north, south, east, and west facades are shown for the cities of Bushehr, Shiraz and Tabriz.
As shown in
Figure 8 in Bushehr, the building with windows on the northern facade had the minimum energy consumption of 20% to 40%. The building with 20% windows consumes 55 kWh/m
2, and the amount for 30% and 40%, is, respectively, 56.8 kWh/m
2 and 60.9 kWh/m
2. In addition, for the southern facade of the building with window percentages of 20% and 30%, the energy consumption is 59.7 kWh/m
2 and 63.4 kWh/m
2, respectively, which is the minimum annual energy consumption for Bushehr. Also, at the east facade, for 30% and 40% of windows, respectively, the consumption was 76.3 kWh/m
2 and 74.9 kWh/m
2, which is the minimum annual energy consumption. On the west facade, office building with 20% and 30% with a consumption of 81.5 kWh/m
2 and 81.3 kWh/m
2 had the minimum annual energy consumption. Considering the optimum window percentage in Bushehr, the data achieved from the south and west facades are in line with the results of Lee et al. [
12], who estimate the optimum window proportions for the south, east, and west facades in the hot‒humid climate of Indonesia to be 25%. Regarding the 30‒40% optimum percentages of windows on the east facade of the building in Bushehr, it was revealed that these data show a 5‒15% difference from the results of Lee et al. [
12], which, according to the angles and sides of the sun, is different for cities.
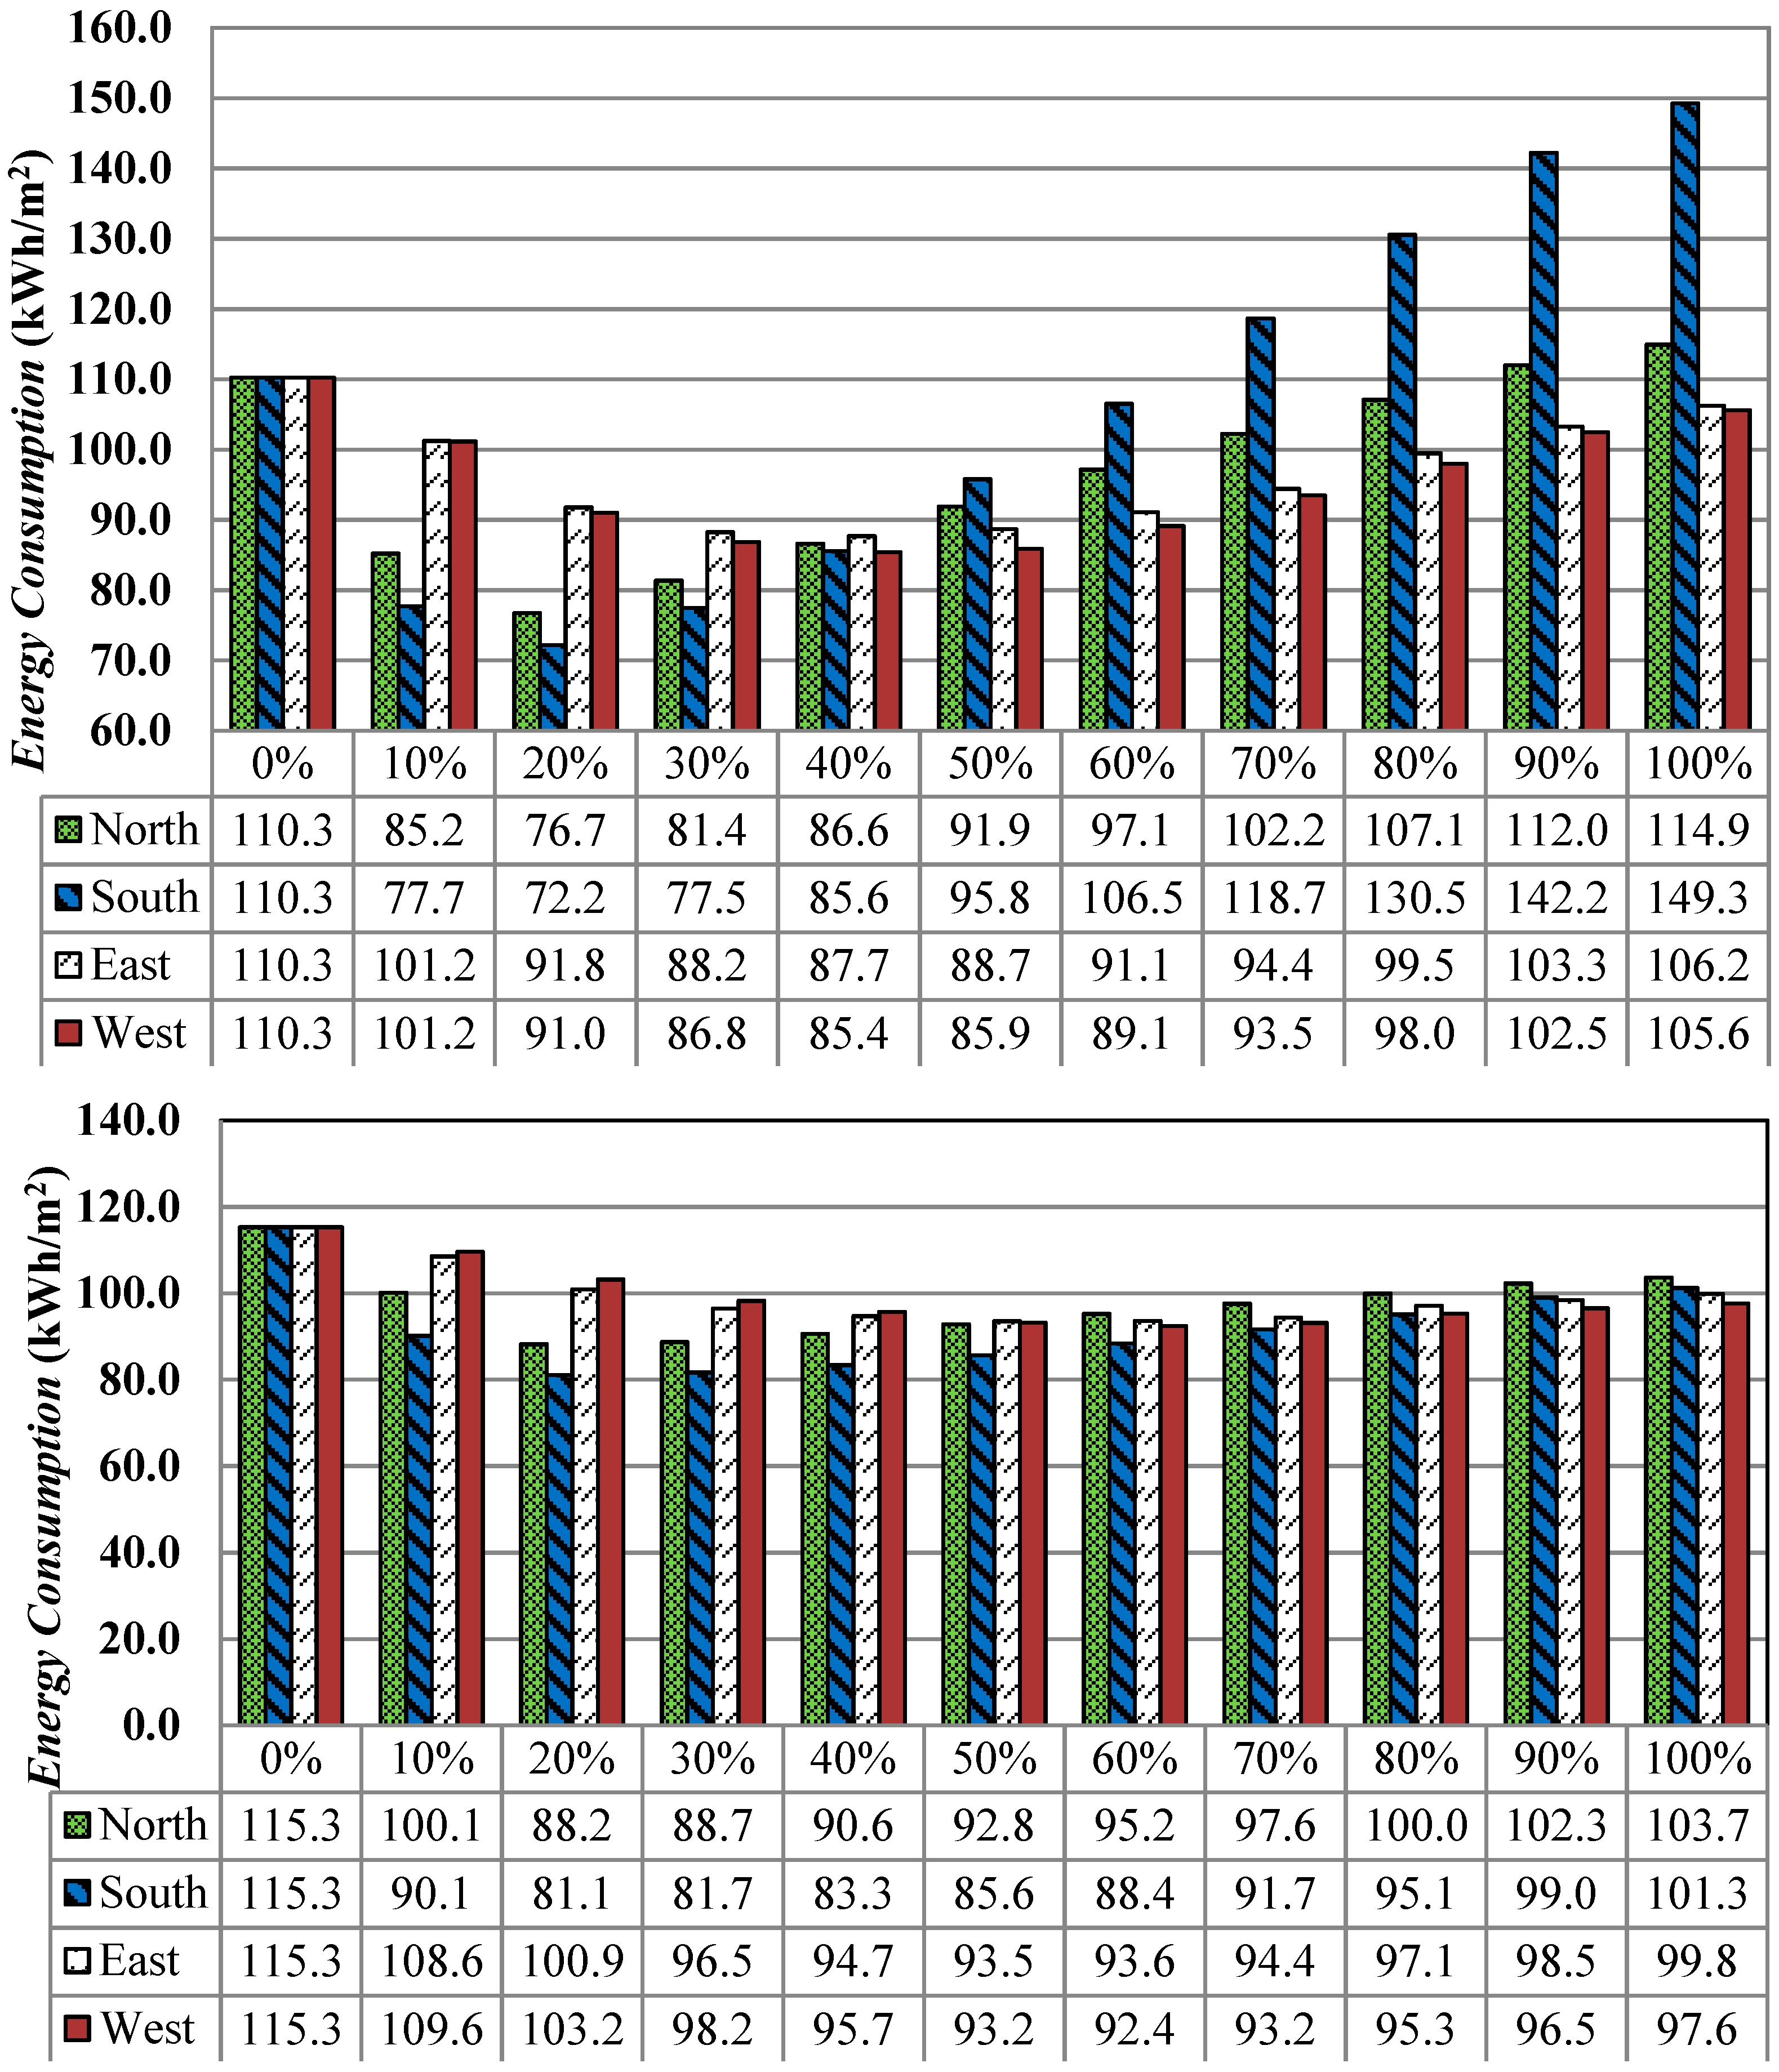
In Shiraz, for a building with 20‒40% windows, the northern facade had the minimum energy consumption. The energy consumption of the office building for the 20%, 30%, and 40% windows on the northern facade is 76.7 kWh/m
2, 81.4 kWh/m
2, and 86.6 kWh/m
2, respectively. In addition, on the south facade of the building, 20% and 30% of the buildings had the minimum annual energy consumption, respectively, of 72.2 kWh/m
2 and 77.5 kWh/m
2. On the east and west facades, the 30–50% window has the minimum annual energy consumption. The energy consumption of the building on the east facade for the 30%, 40%, and 50% windows is 88.2 kWh/m
2, 87.7 kWh/m
2, and 88.8 kWh/m
2, respectively. Also, the energy consumption of the western facade of the building with 30%, 40%, and 50% of windows is 86.8 kWh/m
2, 85.4 kWh/m
2, and 85.9 kWh/m
2, respectively. The results of this study for Shiraz with an optimality of 30–45% windows is in line with the research of Goia et al. (2013) and Košir et al. (2017) [
8,
9] due to the optimum 50% windows. Also, the results of this study for Shiraz on the southern facade were in line with the research of Marino et al. (2017) [
14], which revealed that the optimum window proportion for all facades was 23.5%, but for the east, west, and north facades there was a difference of 6.5‒26.5%.
In Tabriz, the minimum building energy consumption for the northern facade is 20% and 30%, respectively, which are 88.2 kWh/m
2 and 88.7 kWh/m
2 (
Figure 8). Additionally, the south facade of the building had the minimum energy consumption of buildings with 20‒60% windows. The energy consumption of buildings for 20%, 30%, 40%, 50%, and 60% of the southern facade is 81.1 kWh/m
2, 81.7 kWh/m
2, 83.3 kWh/m
2, 85.6 kWh/m
2, and 88.4 kWh/m
2, respectively. Also, the east facade with 50% and 60% windows, respectively, and with a consumption of 93.5 kWh/m
2 and 93.6 kWh/m
2; and the west facade with 60% windows and a consumption of 92.4 kWh/m
2 had the minimum annual energy consumption (
Figure 8). The results of the research for the southern facade in Tabriz were in line with the study of Goia (2016), in which the optimum window proportion for the cold climate of Europe is considered to be 30‒45%. However, the data from this study for the north, east, and west facades in Tabriz show a discrepancy of 15‒25% from the results of Goia (2016), due to the difference in latitude and longitude because of the height and side of the sun and its radiation patterns.
5. Conclusions
In this research, the optimum percentage of windows for the north, south, east, and west facades of an office building was determined for Bushehr (with a hot‒humid climate), Shiraz (with a hot‒dry climate), and Tabriz (with a cold climate). Moreover, the same type of building, with the same electrical setup, mechanical setup, and materials, was used in all climate zones to standardize the research. A simulation was conducted through DesignBuilder software, and the solar heat gain, cooling load, heating load, and lighting consumption of the building were calculated in different states. All the software parameters were set to thermal comfort and energy savings based on ASHRAE standard; in DesignBuilder the operative temperature and setpoint were inserted separately and these values are not the same so it would be clear that the software automatically and dynamically set the default values.
This means that the recorded operative temperature and setpoint are not equal. For the purposes of this paper, we only dealt with energy savings issues. A summary of our results is as follows:
In Bushehr, at the north facade of the building, window percentages of 20‒40% gave the minimum energy consumption. In addition, the south facade of the building with a 20% and 30% window and with energy consumption of 59.7 kWh/m2 and 63.4 kWh/m2 had the minimum annual energy consumption in Bushehr. Also, the east facades, with 30% and 40% and consumption of 76.3 kWh/m2 and 74.9 kWh/m2, respectively; and the west facade with 20% and 30% and consumption of 81.5 kWh/m2 and 81.3 kWh/m2, respectively, have the minimum annual energy consumption.
In Shiraz, the building with 20‒40% windows on the north facade had the minimum energy consumption. In addition, at the southern front of the building, 20% and 30% windows had the minimum annual energy consumption of 72.2 kWh/m2 and 77.5 kWh/m2, respectively. On the east and west facades, 30‒50% windows had the minimum annual energy consumption.
In Tabriz, the building’s minimum energy consumption for the northern facade with 20% and 30% windows is, respectively, 88.2 kWh/m2 and 88.7 kWh/m2. The southern facade of the building had the minimum energy consumption at 20‒60% windows. Also, the east facade, with 50% and 60% windows and consumption of 93.5 kWh/m2 and 92.4 kWh/m2, and the west facade with 60% windows and consumption of 92.4 kWh/m2, had the minimum annual energy consumption.
Hence, due to the high consumption of energy in the building sector and because half of the energy used in buildings is wasted through the windows, the results of this study revealed the optimum window percentages for office buildings in the investigated climates of Iran. For future research, it is suggested to investigate the optimum glass in the climate of Iran and determine its type for different climates.


