Article

Vitória Bay Pollution Study in the Frame of the TAGUBAR Research Project: Geochemistry of the Sediments of Espírito Santo Bay

1
Department of Environmental, Computer, and Statistics Sciences (DAIS), University of Venice, INCA-VEGAPARK via delle Industrie 21/8, I 30175 Marghera, Italy
2
Archives of Sustainability (ArcSos), University of Venice, Palazzo Moro Cannaregio 2978, I 30123 Venice, Italy
3
CNR-ISMAR, Sede di Venezia, Castello 1364/a, 30122 Venice, Italy
*
Author to whom correspondence should be addressed.
Environments 2018, 5(12), 139; https://doi.org/10.3390/environments5120139
Submission received: 26 October 2018 / Revised: 30 November 2018 / Accepted: 14 December 2018 / Published: 18 December 2018

Abstract

:
The Espírito SantoBay is located in Espírito Santo state in the eastern part of Brazil. It is surrounded by the city of Vitória on one side and by the Atlantic Ocean on the other. Superficial sediments of Espírito Santo Bay were analyzed at 12 (western shallow silt sediments) + 8 (eastern sandy sediments and relatively deep sampling stations) = 20 uniformly distributed sampling points, where geochemical analysis was performed. Nineteen elements were analyzed: Mo, Cu, Pb, Zn, Ag, Ni, Mn, Fe, As, U, Th, Sr, Cd, Sb, Bi, V, Cr, Ba, and Al. This selection was made based on the most representative heavy metals present in this area and according to the results obtained from the geochemical analysis. Their concentrations were compared with metal contamination benchmarks such asscreening quick reference tables (SQuiRTs), effects rangelow (ERL), effects range median (ERM), threshold effects levels (TELs), probable effects levels (PELs), and apparent effects thresholds (AETs). The results indicated that there was no particular pollution condition able to alter the condition of any part of this water body. The authors conclude that the Espírito Santo Bay is only moderately polluted, and some elements are virtually absent.

1. Introduction

The Tangential Guanabara Bay Aeration and Recovery(TAGUBAR)project derives its origins from a Brazilian government decision to tackle the planning and management challenges related to the restoration of some degraded aquatic ecosystems such as the Guanabara (state of Rio de Janeiro) and the Vitória-Espírito Santo (state of Espírito Santo) bays. This was performed by using the successful outcomes of a previous Ministry of Foreign Affairs and Direttore Generalealla Cooperazioneallo Sviluppo (i.e., Directorate General for Cooperation and Development) (MFA/DGCS) cooperation program involving Project NIKE in Vitória (Espírito Santo Bay). Such a relevant multiyear collaboration between Italian and Brazilian scientific institutions allowed the exchange of acquired methodologies and of the corresponding databases. The general objective of the program was to contribute to the economic and social development of the population living around Guanabara, Vitória, and Espírito Santo bays while promoting the conservation of their natural resources. This objective was supposed to be achieved by consolidating local authorities’ ability to plan and implement a reconditioning program within a systemic management framework in severely polluted ecosystems. The proposed project was named TAGUBAR (following the pattern of the VENICE’s logical framework),was developed by IDEAS (an institution belonging to the University of Venice, Italy), and was applied to Guanabara Bay.

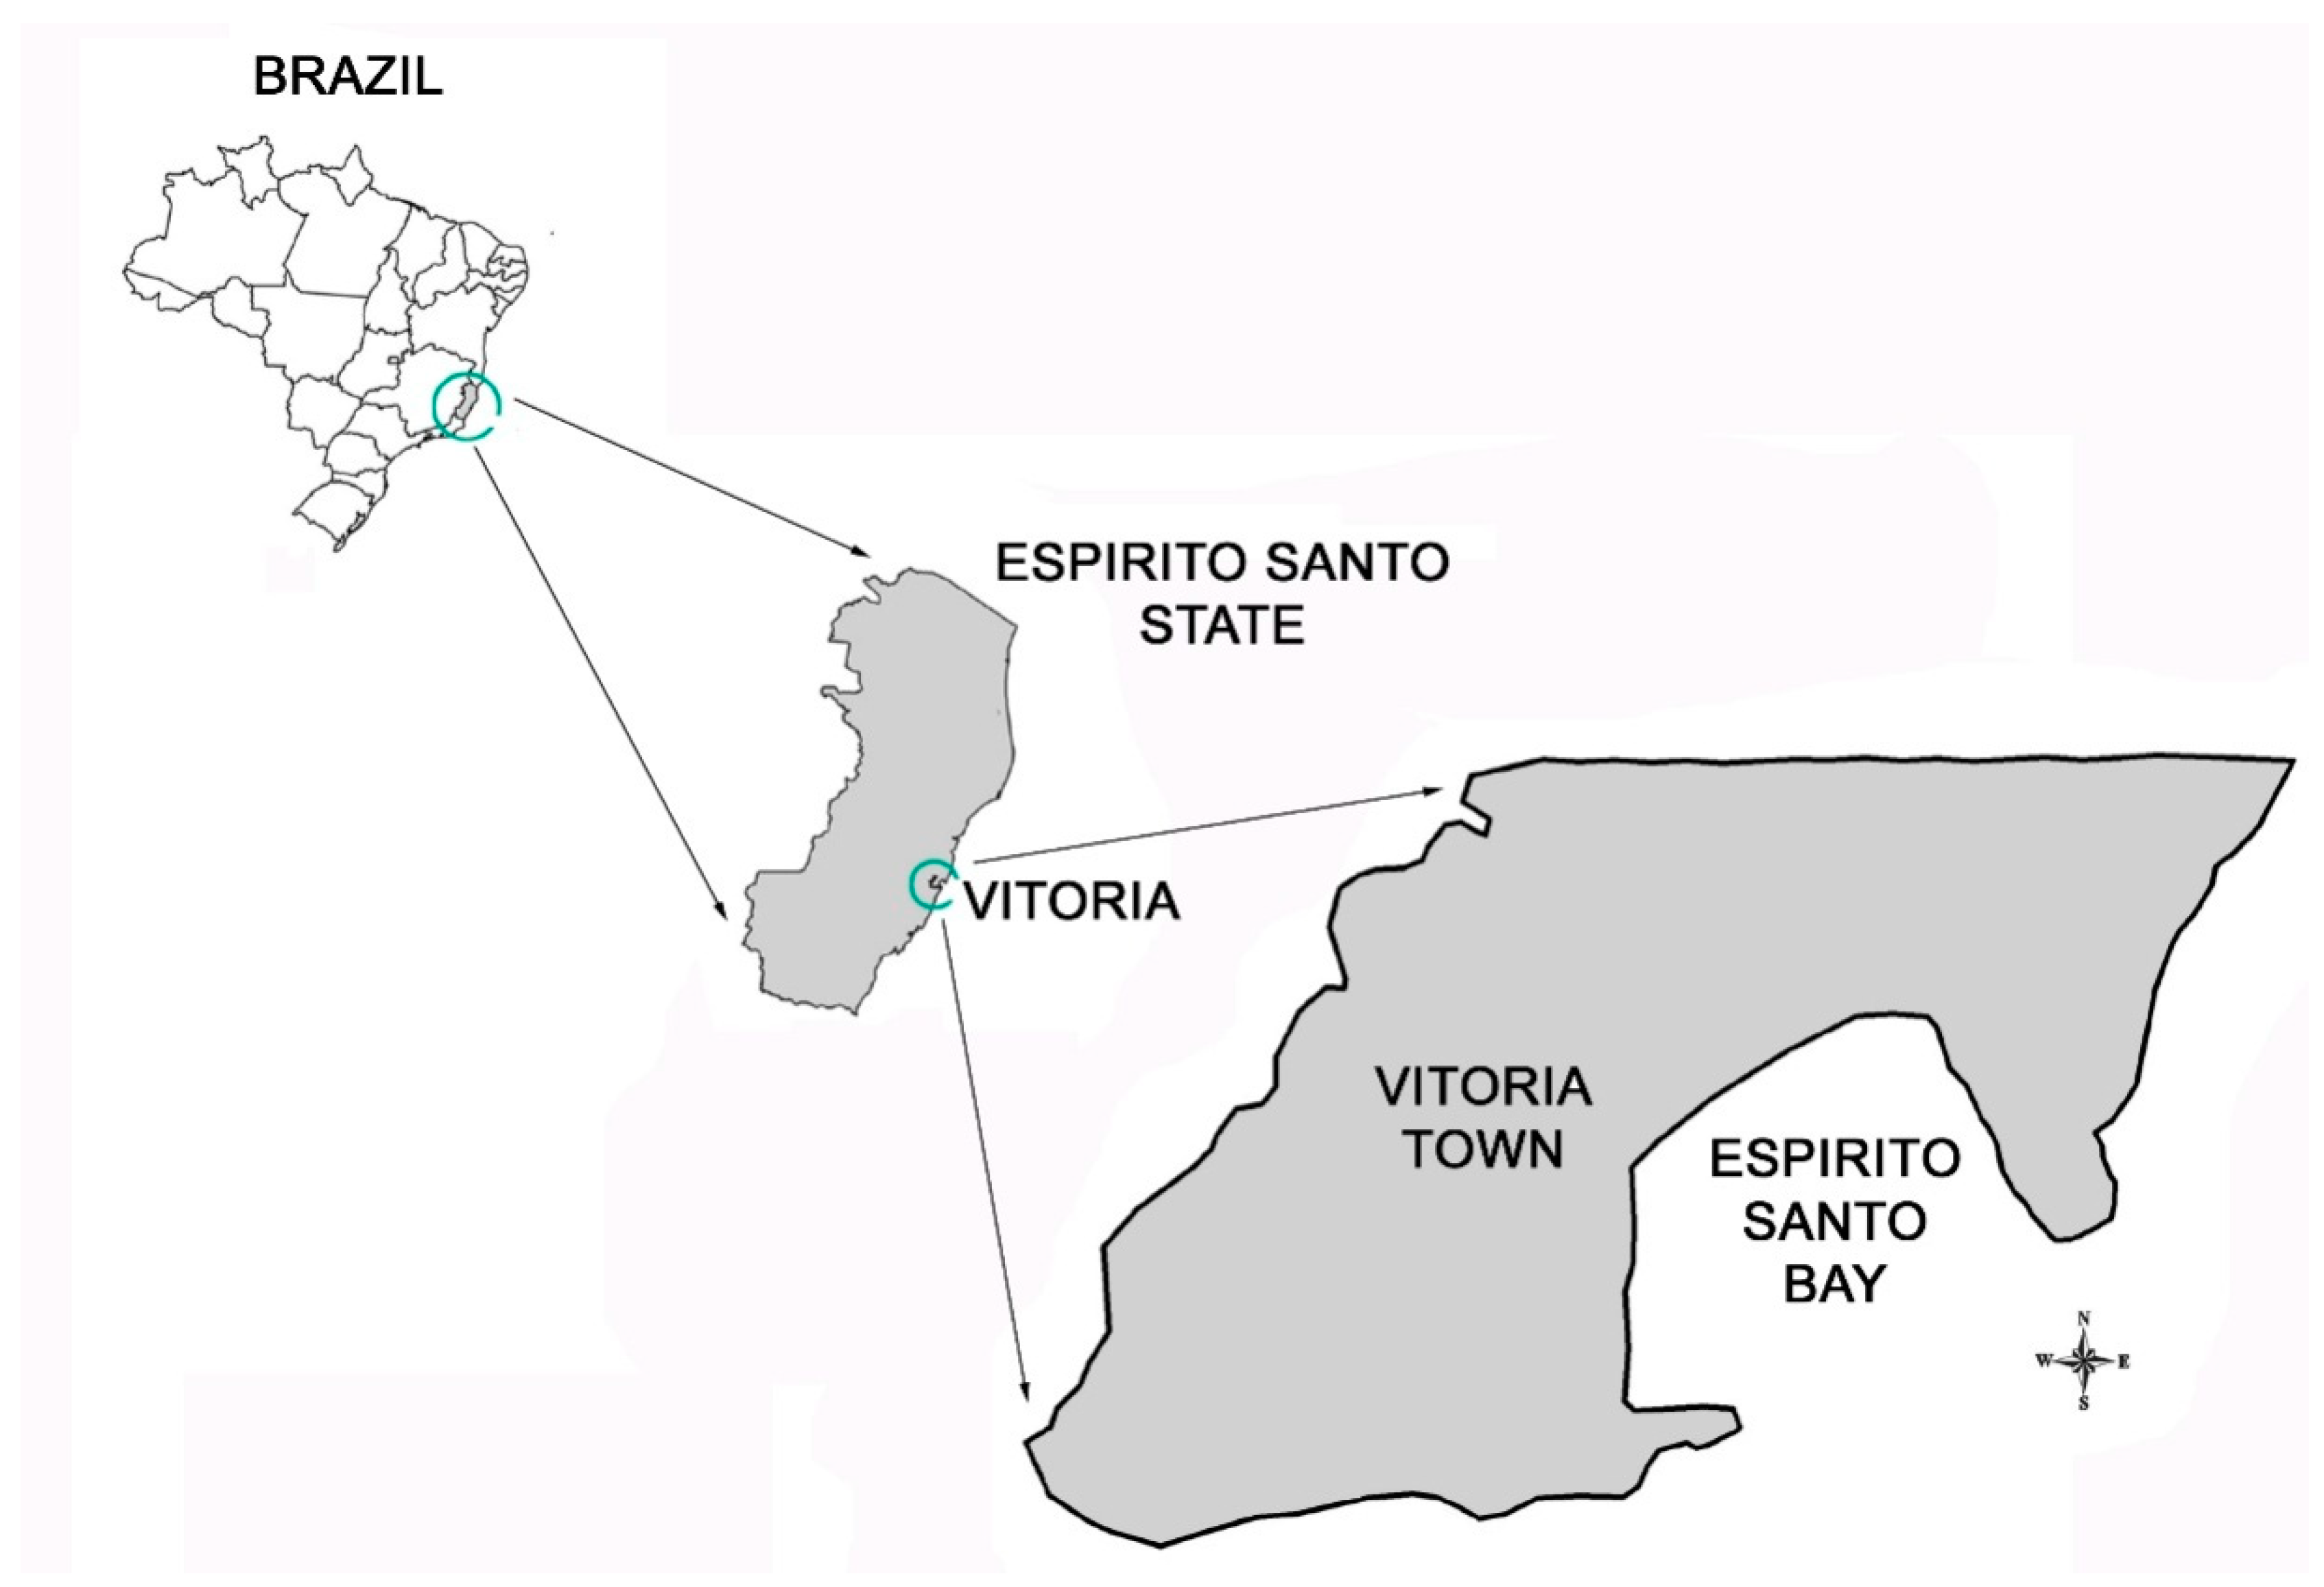
2. The Study Area: The Main Physical and Geographical Aspects of Vitória Bay

The city of Vitória was founded in 1535 and originally was called Vila Nova (“New Town”) do Espírito Santo. Today, it is sort of a miniature Rio de Janeiro and is the capital of the state of Espírito Santo, located in the eastern part of Brazil (Figure 1).
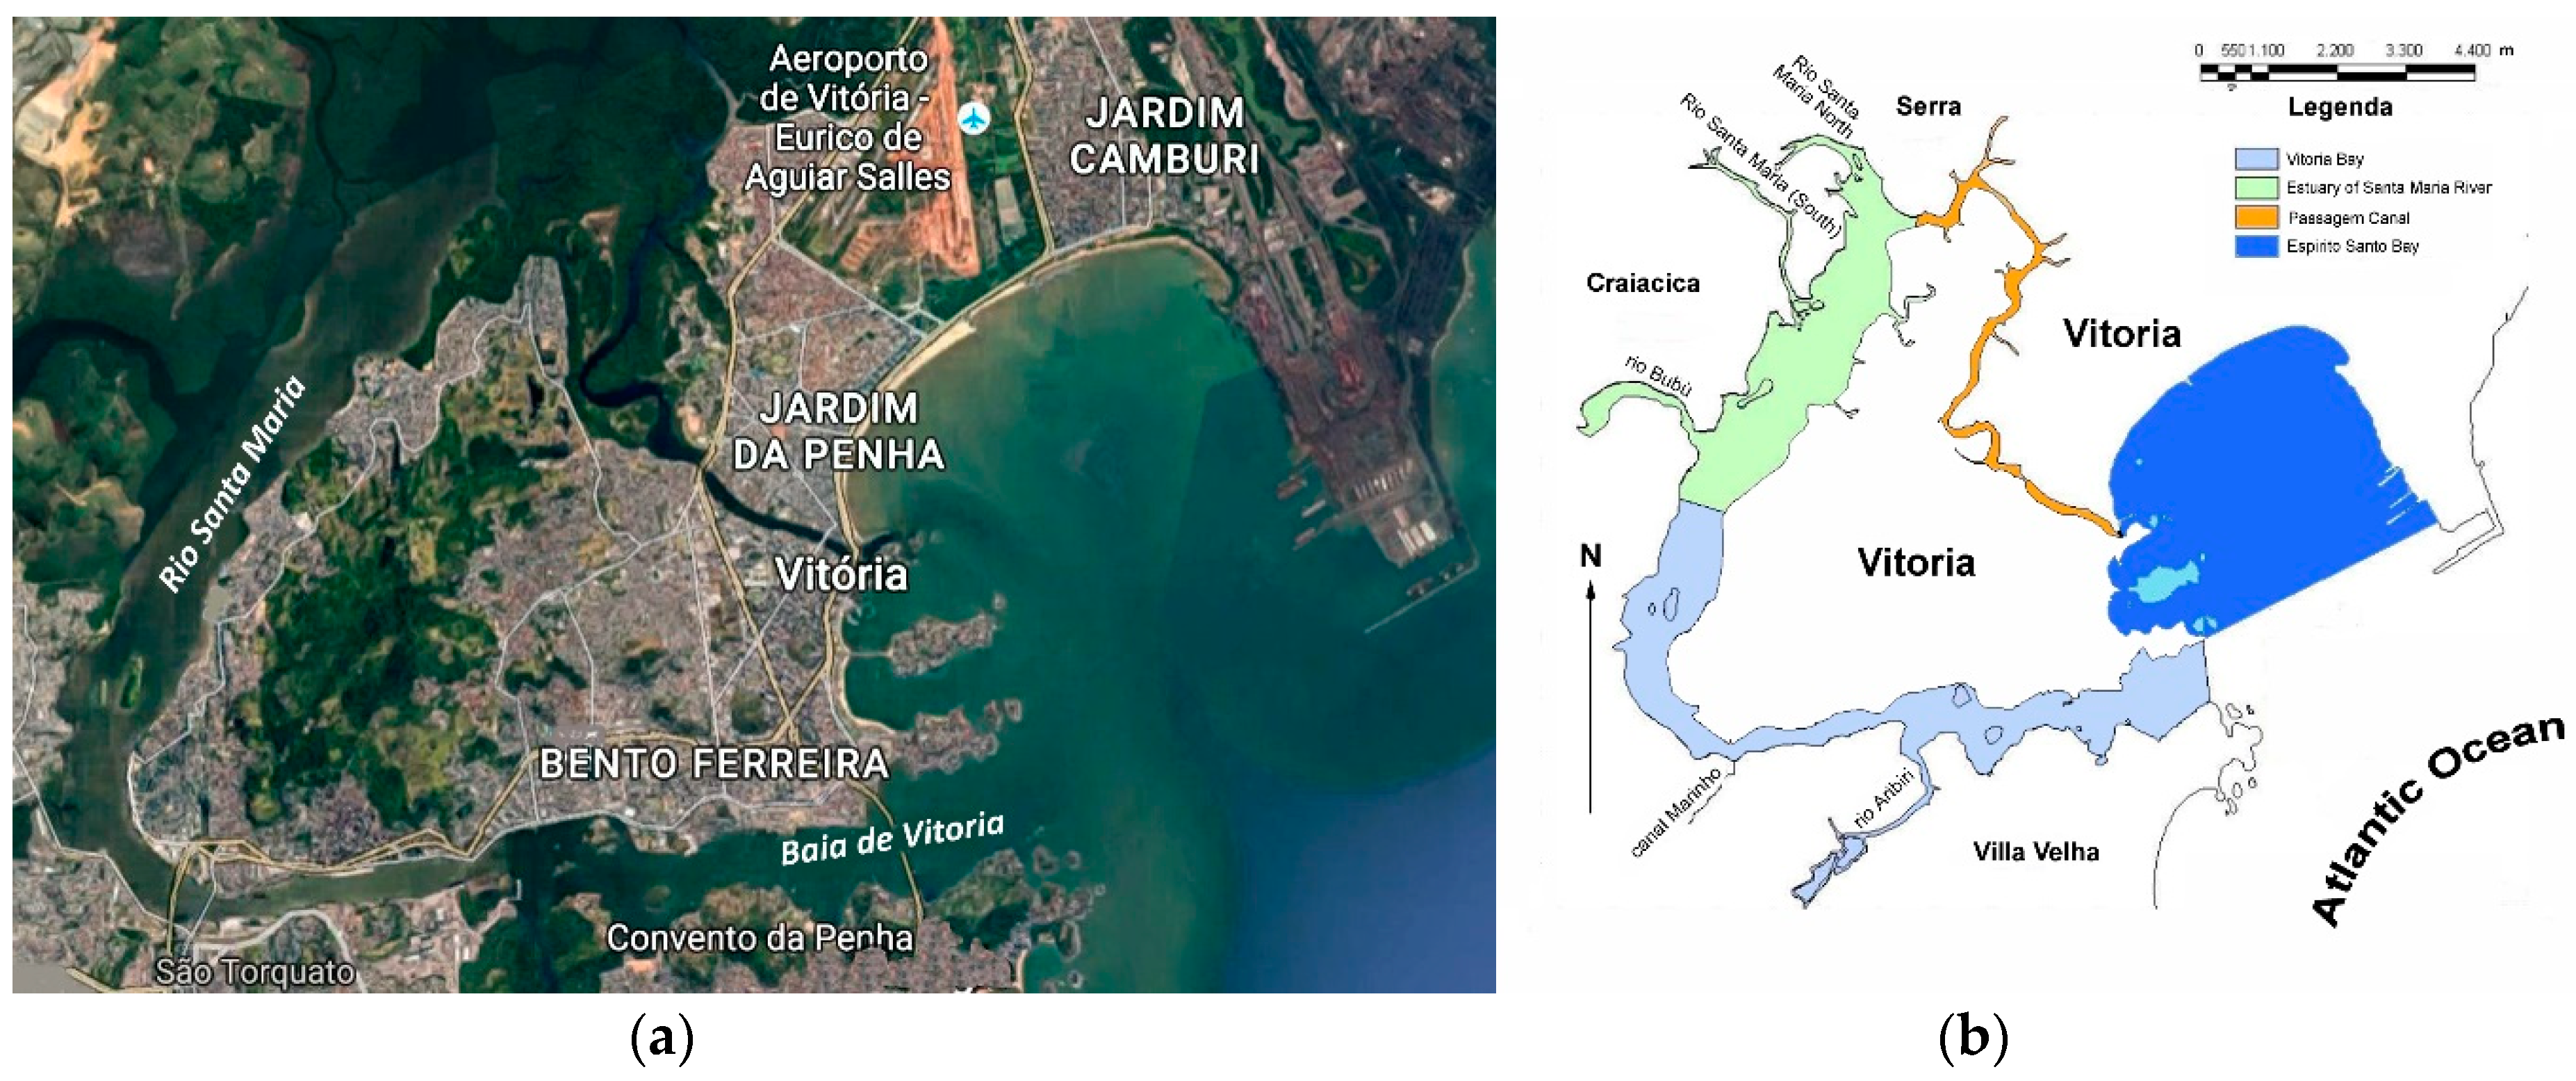
The city of Vitória lies on an island in front of the coast (
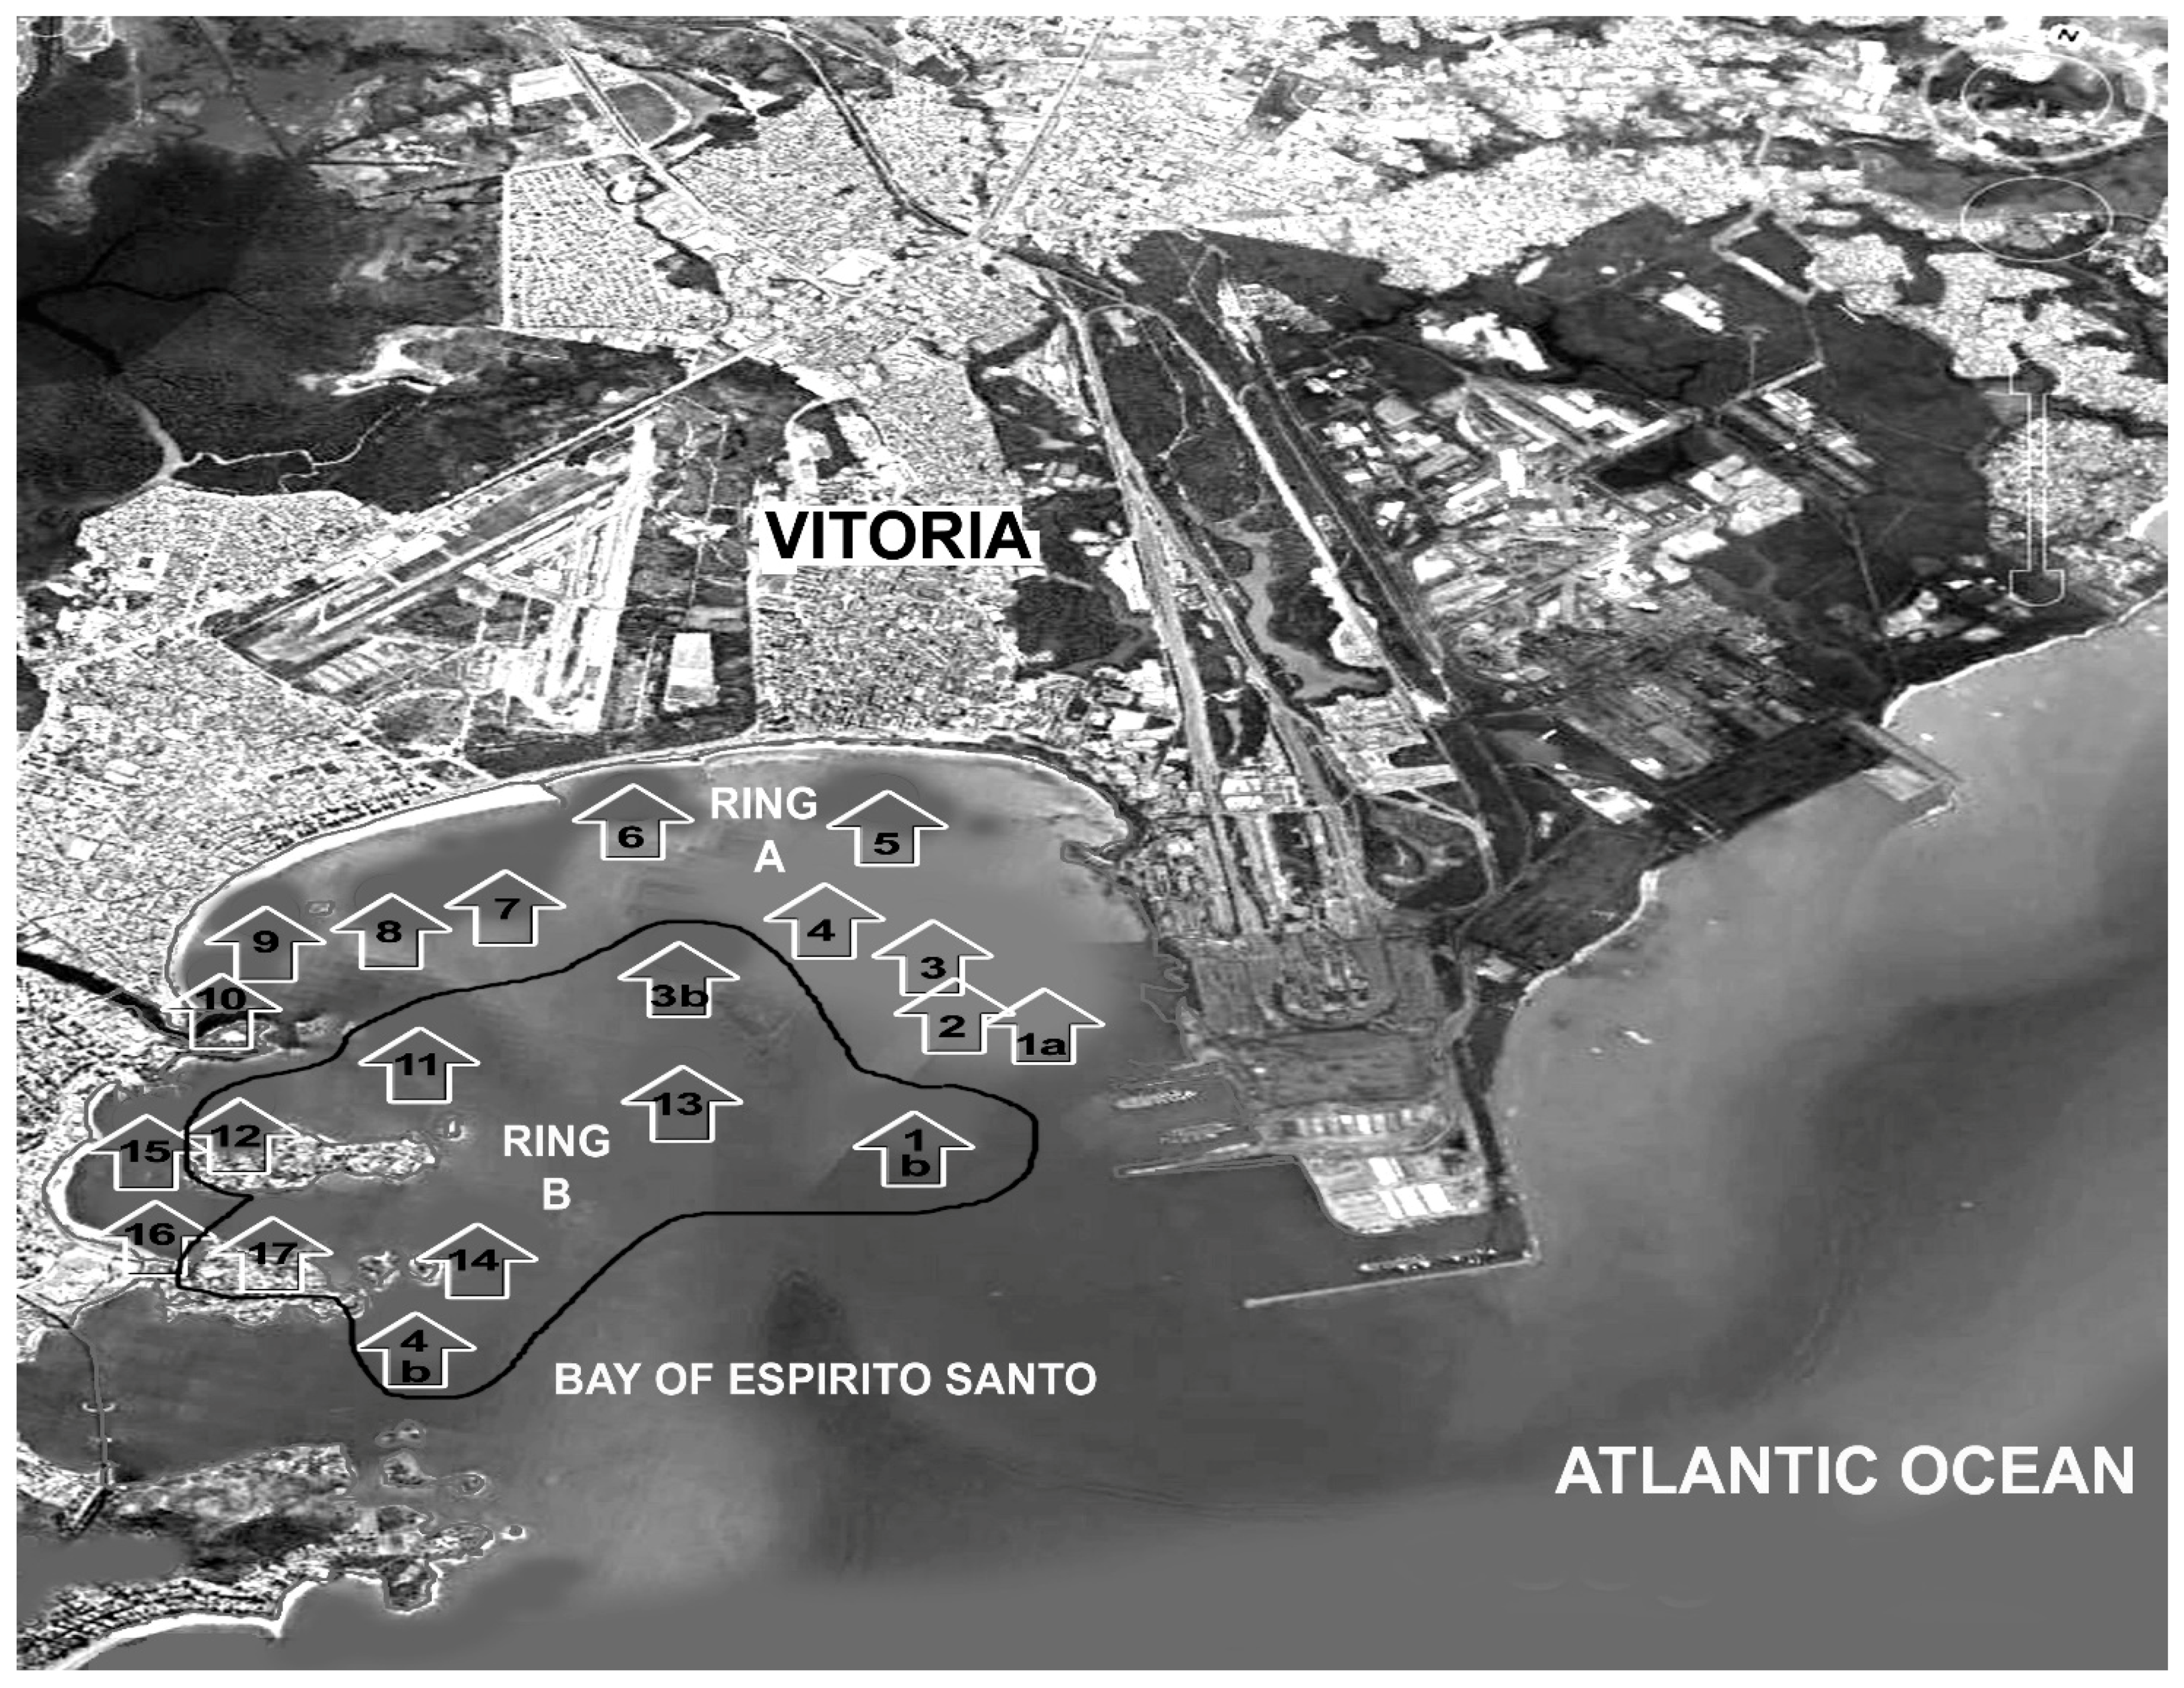
Figure 2).
Both the bay shore and the oceanfront are surrounded by shallow mountains. There are flat areas near the beach, and the central business district is limited to a cove of 5 km in the inland. It is connected to the mainland by a bridge.
Vitóriaconstitutes an important commercial center of the state, with exports of sugar, coffee, lumber, rice, and manioc. Nowadays (2018), it has a population of about 360,000inhabitants, and its bay is one of the most industrialized regions in the state of Espírito Santo. As a result of urban growth, large quantities of raw industrial and urban sewage containing heavy metals enter the estuarine system [1,2,3].
The Espírito Santo Bay presents a high degree of exposure to tides, winds, and waves. In the north, it is surrounded by Tubarão Mountain, and in the south by Moreno do Moreno Mountain and Camburì Beach, the most renowned beach of the municipality of Vitória. Anthropic influence contributed heavily over the decades to a decrease of the mangrove area around the island of Vitória [4], as well as in the proximity of the communities of Sao Pedro, Caieiras, Santo Antonio, and Maria Ortiz. Carmo [5] and Jesus [6,7] have suggested that the main causes of such a decrease could have been landfills, industries, and port activities.
Currently, mangroves occupy an area of only 18 km2, which represents 20% of the total mangroves present in the state of Espírito Santo [4]. The northwestern part of the estuary system includes the mouth of the Santa Maria River (4 km2 of mangrove), BubùRiver (3 km2), and Lameirao Island (municipal biological reserve, 4.9 km2) [6]. From a naturalistic point of view, it is the most preserved area, and it displays a high mangrove density [4].
Vitória Bay receives inputs from the rivers Aribiri, Bubu, and Santa Maria. The farmslocated in the estuaries of these rivers provide to the market considerable amounts of fish and shellfish used for human consumption. Therefore, the evaluation of the contamination of the marine environment by heavy metals has becomeurgent [2,3,7,8]. Vitória Bay is protected from the ocean waves while the tidal waves cross the entire bay, rising up above the Santa Maria Delta and entering the Canal da Passagem (Pass Channel). It presents extensive shallow waters where mangroves flourish [4]. Its southwest-northeast SW–NE orientation favors the prevailing winds in the region.
The Canal do Porto (Port Channel) is an integral part of the Bay of Vitória, as it is the main channel of connection between Espírito Santo Bay and Vitória Bay. It is a region greatly altered by landfills and dredging activities, and (as is suggested by its name) it is the access channel to the Port of Vitória, justifying it being treated separately with respect to the Bay of Vitória.
The surroundings of Espírito Santo and Vitória Bays are characterized by a high rate of urbanization and industrial activities, especially regarding tourism infrastructures (big buildings and hotels) and shipping activities, which can be considered indicative of fast city growth. The presence of large ships and boats can be observed, especially at the end of the Canal do Porto, as a consequence of trading with American and European countries.
The area is characterized by the presence of hilly islands (granite composition) that are densely vegetated. Some of them are also getting densely populated due to the facilities offered by transportation and good communication with the mainland. On the other hand, the surroundings of the Canal do Porto, at least a large part of them, are populated by dense mangrove flora that are considered to be a good water and sediment depurator [4,9]. Mangroves also represent a marine environment rich in life and biodiversity [4]. The natural reserve “Lameirão” is located in this area. The presence of small houses can also be noticed in some parts along the Canal do Porto, which most probably belong to the fishermen living in this area, who benefit from fish and mollusks characteristic of this kind of vegetation [8]. In some of these places, it is also possible to see some mangrove “deforestation” caused by house construction [4].
The Canal da Passagem is located in the estuary system of the Santa Maria da Vitória River, in the municipality of Vitória-Espìrito Santo (20°19′ S and 40°20′ W). It can be classified as a coastal plain estuary and, regarding stratification, it can be considered “well-mixed”. At the beginning of Camburì Beach, it connects the Espírito Santo Bay to the northern portion of Vitória Bay, receiving the influence of the tide at both ends, which involves much of the existing mangroves [4]. Its bathymetry is variable, showing both shallow channels that dry at the time of the ebb tide and locations as deep as 7 m. Its average width is about 80 m, with the smallest width, 35 m, under the Passage Bridge [10,11]. It is a shallow, windy channel with extensive mangrove areas [4]. It is characterized by curious hydrodynamic behavior caused by the baro tropic convergence of the tidal waves, resulting from the meeting of the tidal fronts that propagate through the different channels. It receives a large supply of domestic sewage, mostly untreated [1]. The rest of the domestic sewage comes from several neighborhood treatment plants of Vitória, such as Companhia Espírito Santo Santana de Saneamento (CESAN), André Carlone, Camburì, and Nova Palestina [1]. Then, it reaches Espírito Santo Bay during the ebb tide [3]. Because the sewage treatment is largely insufficient, this makes the partially treated sewage the main contributor to the degradation of the water quality [1,2,3,10]. The sediments of this region present the highest levels of organic matter as compared to the rest of the estuary. At the innermost points of the canal, the sedimentation rate is high because of small flow velocity due to the presence of mangroves [4,12]. The inversion of flow direction, as a consequence of the tide, favors the deposition of loamy sediments and organic matter [12,13].

3. Materials and Methods

3.1. Sampling Points

Sampling points were uniformly distributed along Espírito Santo Bay and part of Vitória Bay, with special emphasis on the Canal do Porto. The type and location of each station was previously determined according to the characteristics of each bay.
Depending on the location and characteristics (depth) of the sampling sites, two boats were used for this campaign. The first boat used for the sampling at Espírito Santo Bay was fully equipped with a professional navigation system, including an accurate GPS and an echo sounder. The other boat used for sampling at the canal (shallow waters) contained a portable GPS in order to know the correct coordinates of the sampling points. In this case, water depth was measured by a professional echo sounder. For each sampling point, regardless of the type of station, the following data were always recorded: Geographic coordinates (longitude, latitude), water depth, time, and type of sediment.
The sediments were collected, mixed carefully to obtain homogeneous samples, frozen, and then immediately transported to the laboratory for analysis. The samples were dried in a nitrogen atmosphere to avoid oxidation and were stored in sealed glass containers. This procedure was previously tested in our laboratory [14,15,16].

3.2. Sediment Sampling Stations

Sampling consisted of the collection of sediment and water samples for geological, chemical (water and sediments), and biological analysis [17]. Briefly, sampling activities comprised the collection of bottom sediments 0.30 m deep using a Van Veen grab with a capacity of approximately 5 L. Just one launch of the grab was adequate to collect enough amount of sample. All sediment samples were then deposited on a plastic tray and well mixed until homogenization (Figure 3).
The sediment samples collected in this type of station were analyzed geologically (grain size, mineralogy, and geochemistry analyses) [18] and chemically (on sediments). The sediment samples deposited on the plastic tray were then stored in plastic containers for geological analysis and glass bottles for chemical analysis. A bigger container was used for storing samples for mineralogical and grain size analysis [18], whereas for geochemical and chemical analysis, smaller bags and jars were used.
Different types of sediments were found in the bay sampling points, such as sand, mud, and mixed mud + sand (Figure 4a,b).
In more detail, in Figure 4b the sediment (before mixing the sample) looks heterogeneous because it is possible to see the black mud (bottom) and the clearersand (top), whereason the left of Figure 4 the sediment appears homogeneously black. Different sediments could have been an indication either of the different activities taking place in the surroundings (such as urban vs. industrial discharges) or of the different hydrodynamic situations typical of that specific site, influenced by marine currents or bottom morphology.
As can be seen in Figure 5, two different areas can be clearly identified: RING A (EXTERNAL), made of 12 stations (i.e., stations 1a, 2–10, 15, and 16) close to the coast and therefore rich in organic matter, and RING B (INTERNAL), made of 8 stations (i.e., stations 1b, 3b, 4b, 11, 12, 13, 14 and 17), where the sandy component prevailed.

3.3. Metal Contamination Benchmarks

The five benchmarks we used were: Threshold effects levels (TELs), effects range low (ERL), probable effects levels (PELs), effects range median (ERM), and apparent effects thresholds (AETs) [19,20,21,22].
ERL and ERM are measures of toxicity in marine sediment. ERL indicates the concentration below which toxic effects are scarcely observed or predicted, whereas ERM indicates the concentration above which effects are generally or always observed. AET is defined as the sediment concentration of a given chemical above which statistically significant effects (e.g., sediment toxicity) are always observed. AET may be more sensitive than PEL or ERM, since these last ones incorporate several endpoints in their determination. Despite us reporting five benchmarks, special emphasis was given to TEL and AET, as the first is the most protective and the second has the most statistically meaningful value. Unfortunately, for some elements, TEL, ERL, PEL, and ERM were not defined. Particularly, they were not defined for aluminum, barium, iron, manganese, nickel, antimony, and vanadium.

3.4. Geochemical Analysis Instrumentation

For geochemical analysis, inductively coupled plasma emission spectroscopy (ICP-ES) methodology was used. Nineteen elements were analyzed: Mo, Cu, Pb, Zn, Ag, Ni, Mn, Fe, As, U, Th, Sr, Cd, Sb, Bi, V, Cr, Ba, and Al. Hg was excluded from our study, because it is well known that its presence in this area is consistent with the background level. For all of the elements, concentrations are here expressed in μg/g (micrograms per gram of dry sediment), except for Fe and Al, which are reported in % (by dry weight) form. Twelve elements were selected as the most important and most appropriate to be either representative or trace indicators of the level of chemical pollution, and therefore they are deeply analyzed and discussed in the 2D diagrams that follow. These elements were Ag, Al, As, Ba, Cr, Fe, Mn, Ni, Pb, Sb, V, and Zn. This selection was made on the basis of the results obtained from the geochemical analysis. In addition, 17 elements (Ag, Al, Bi, As, Cd, Cu, Fe, Pb, Mn, Mo, Ni, Sb, Sr, Th, U, V, and Zn) were selected to be represented by 3D diagrams in order to detect possible pollution sources.

4. Results and Discussion

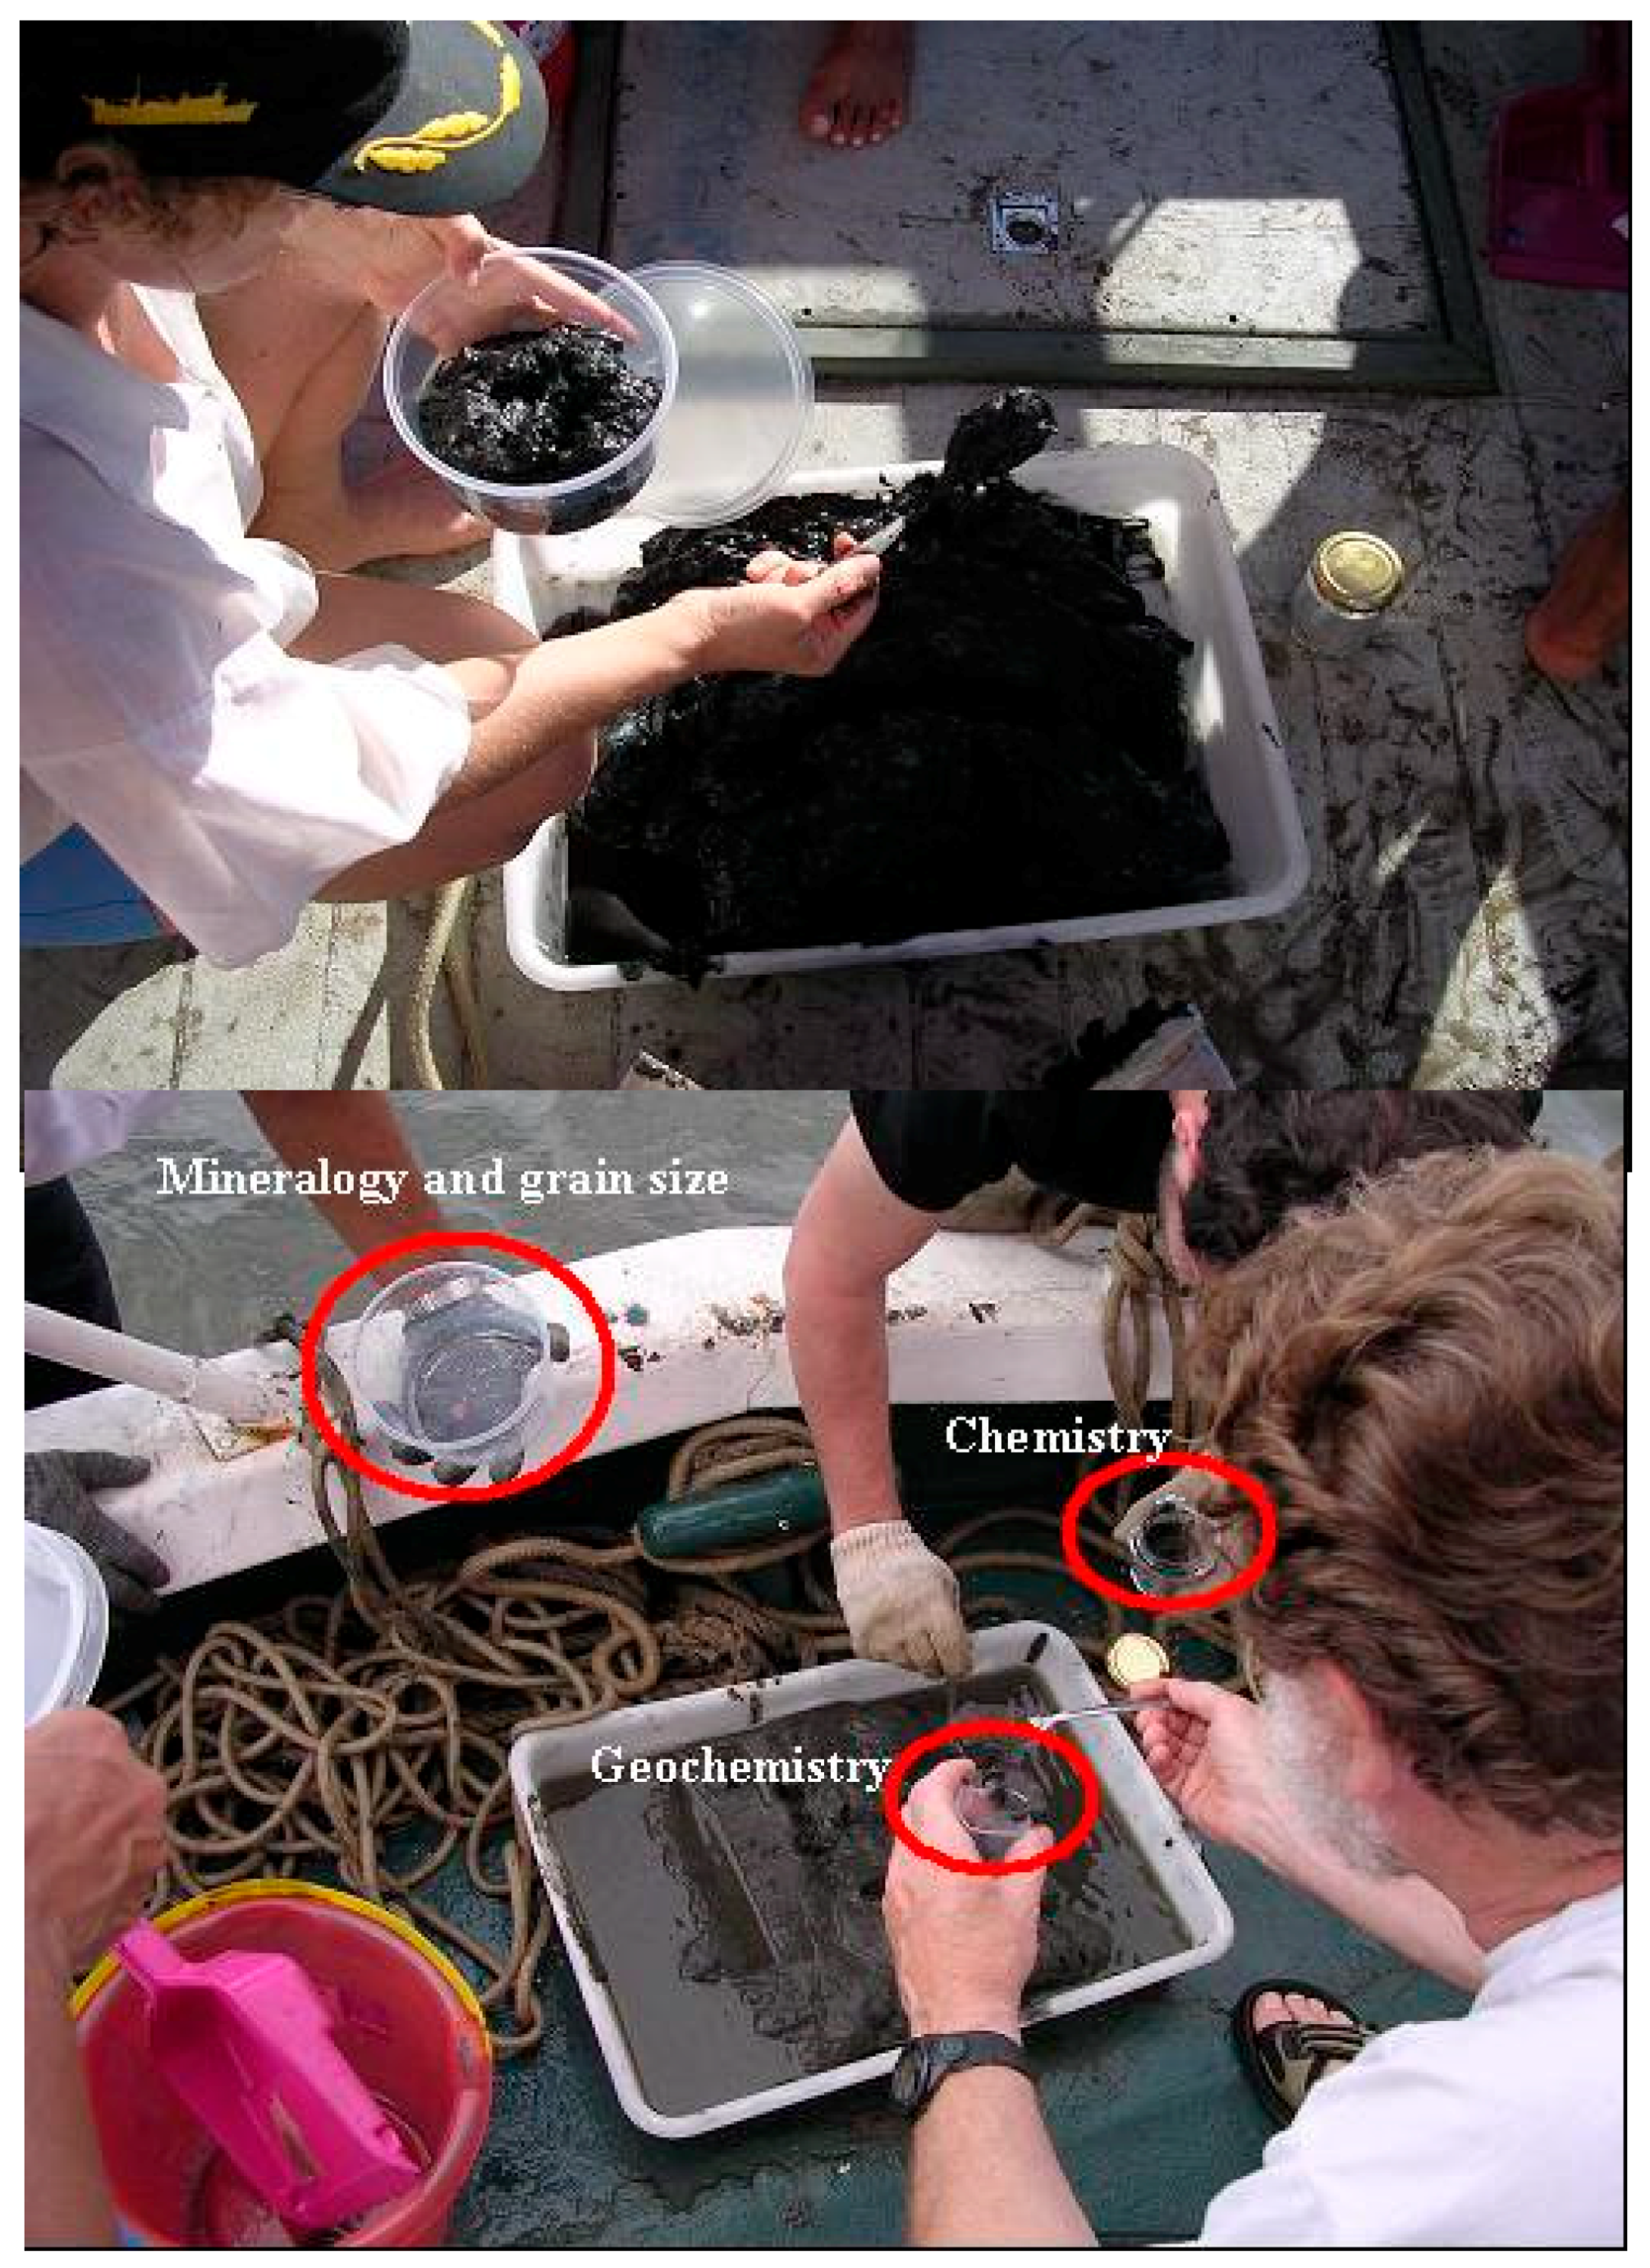
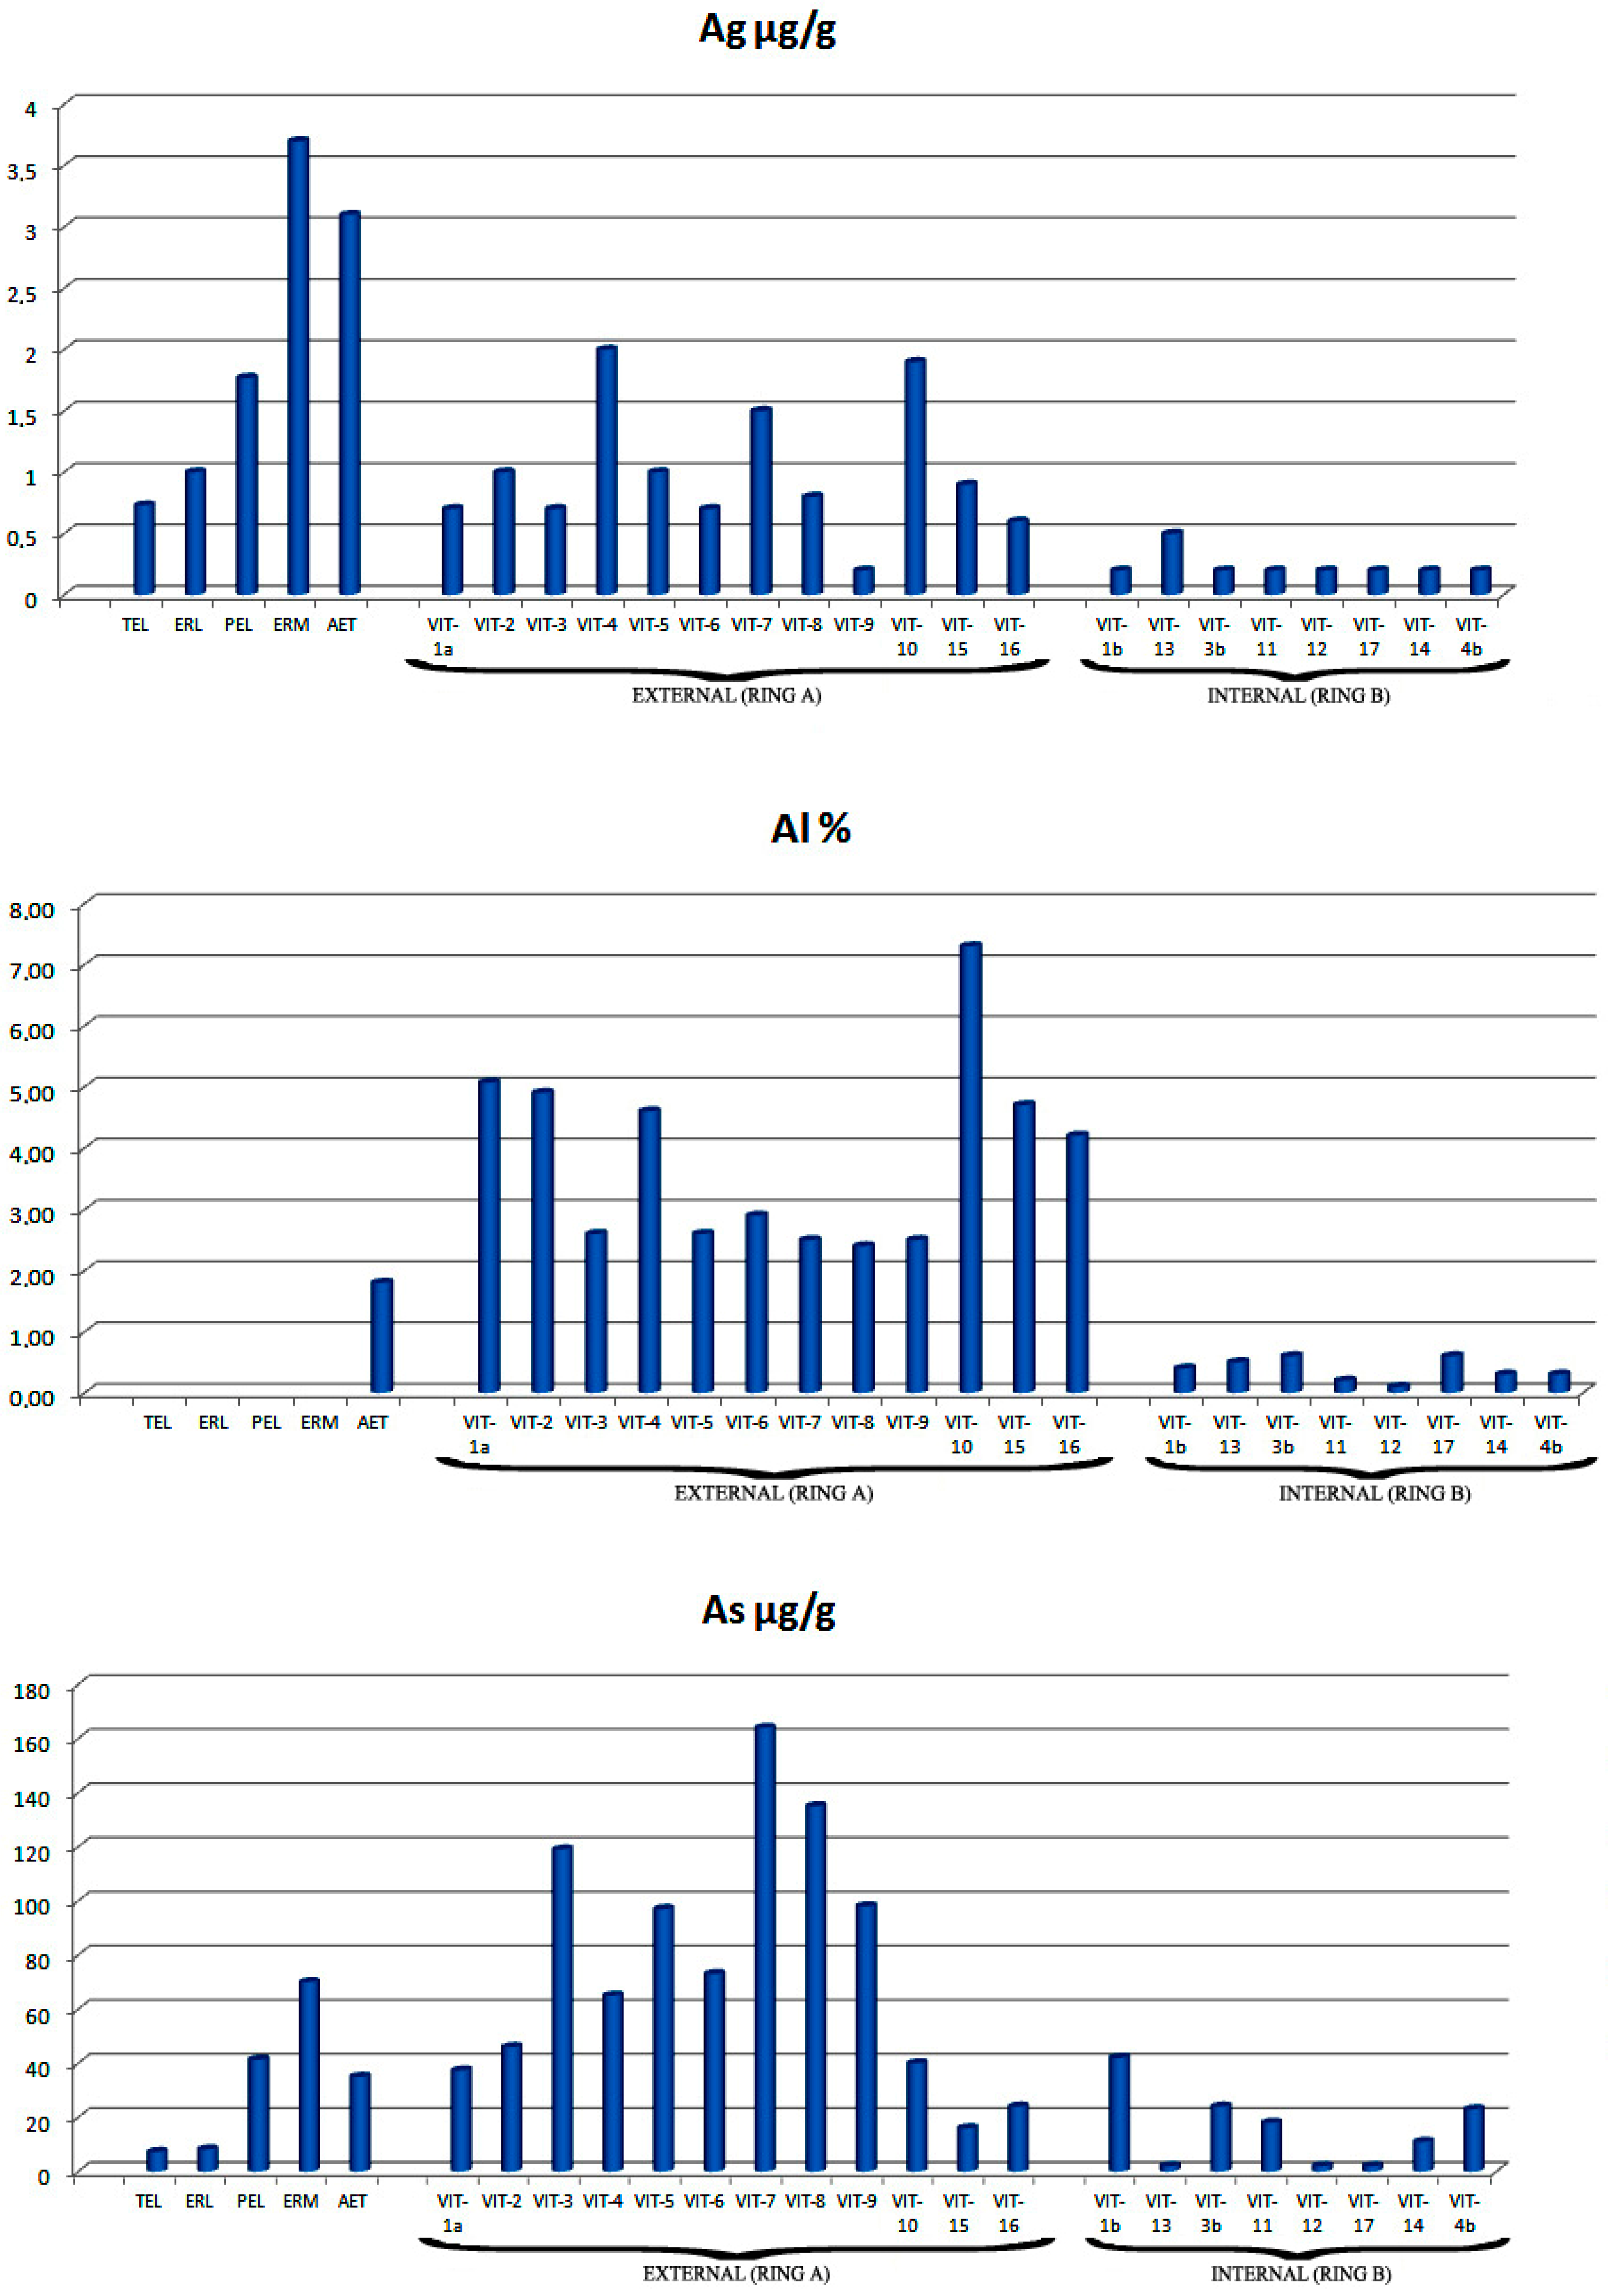
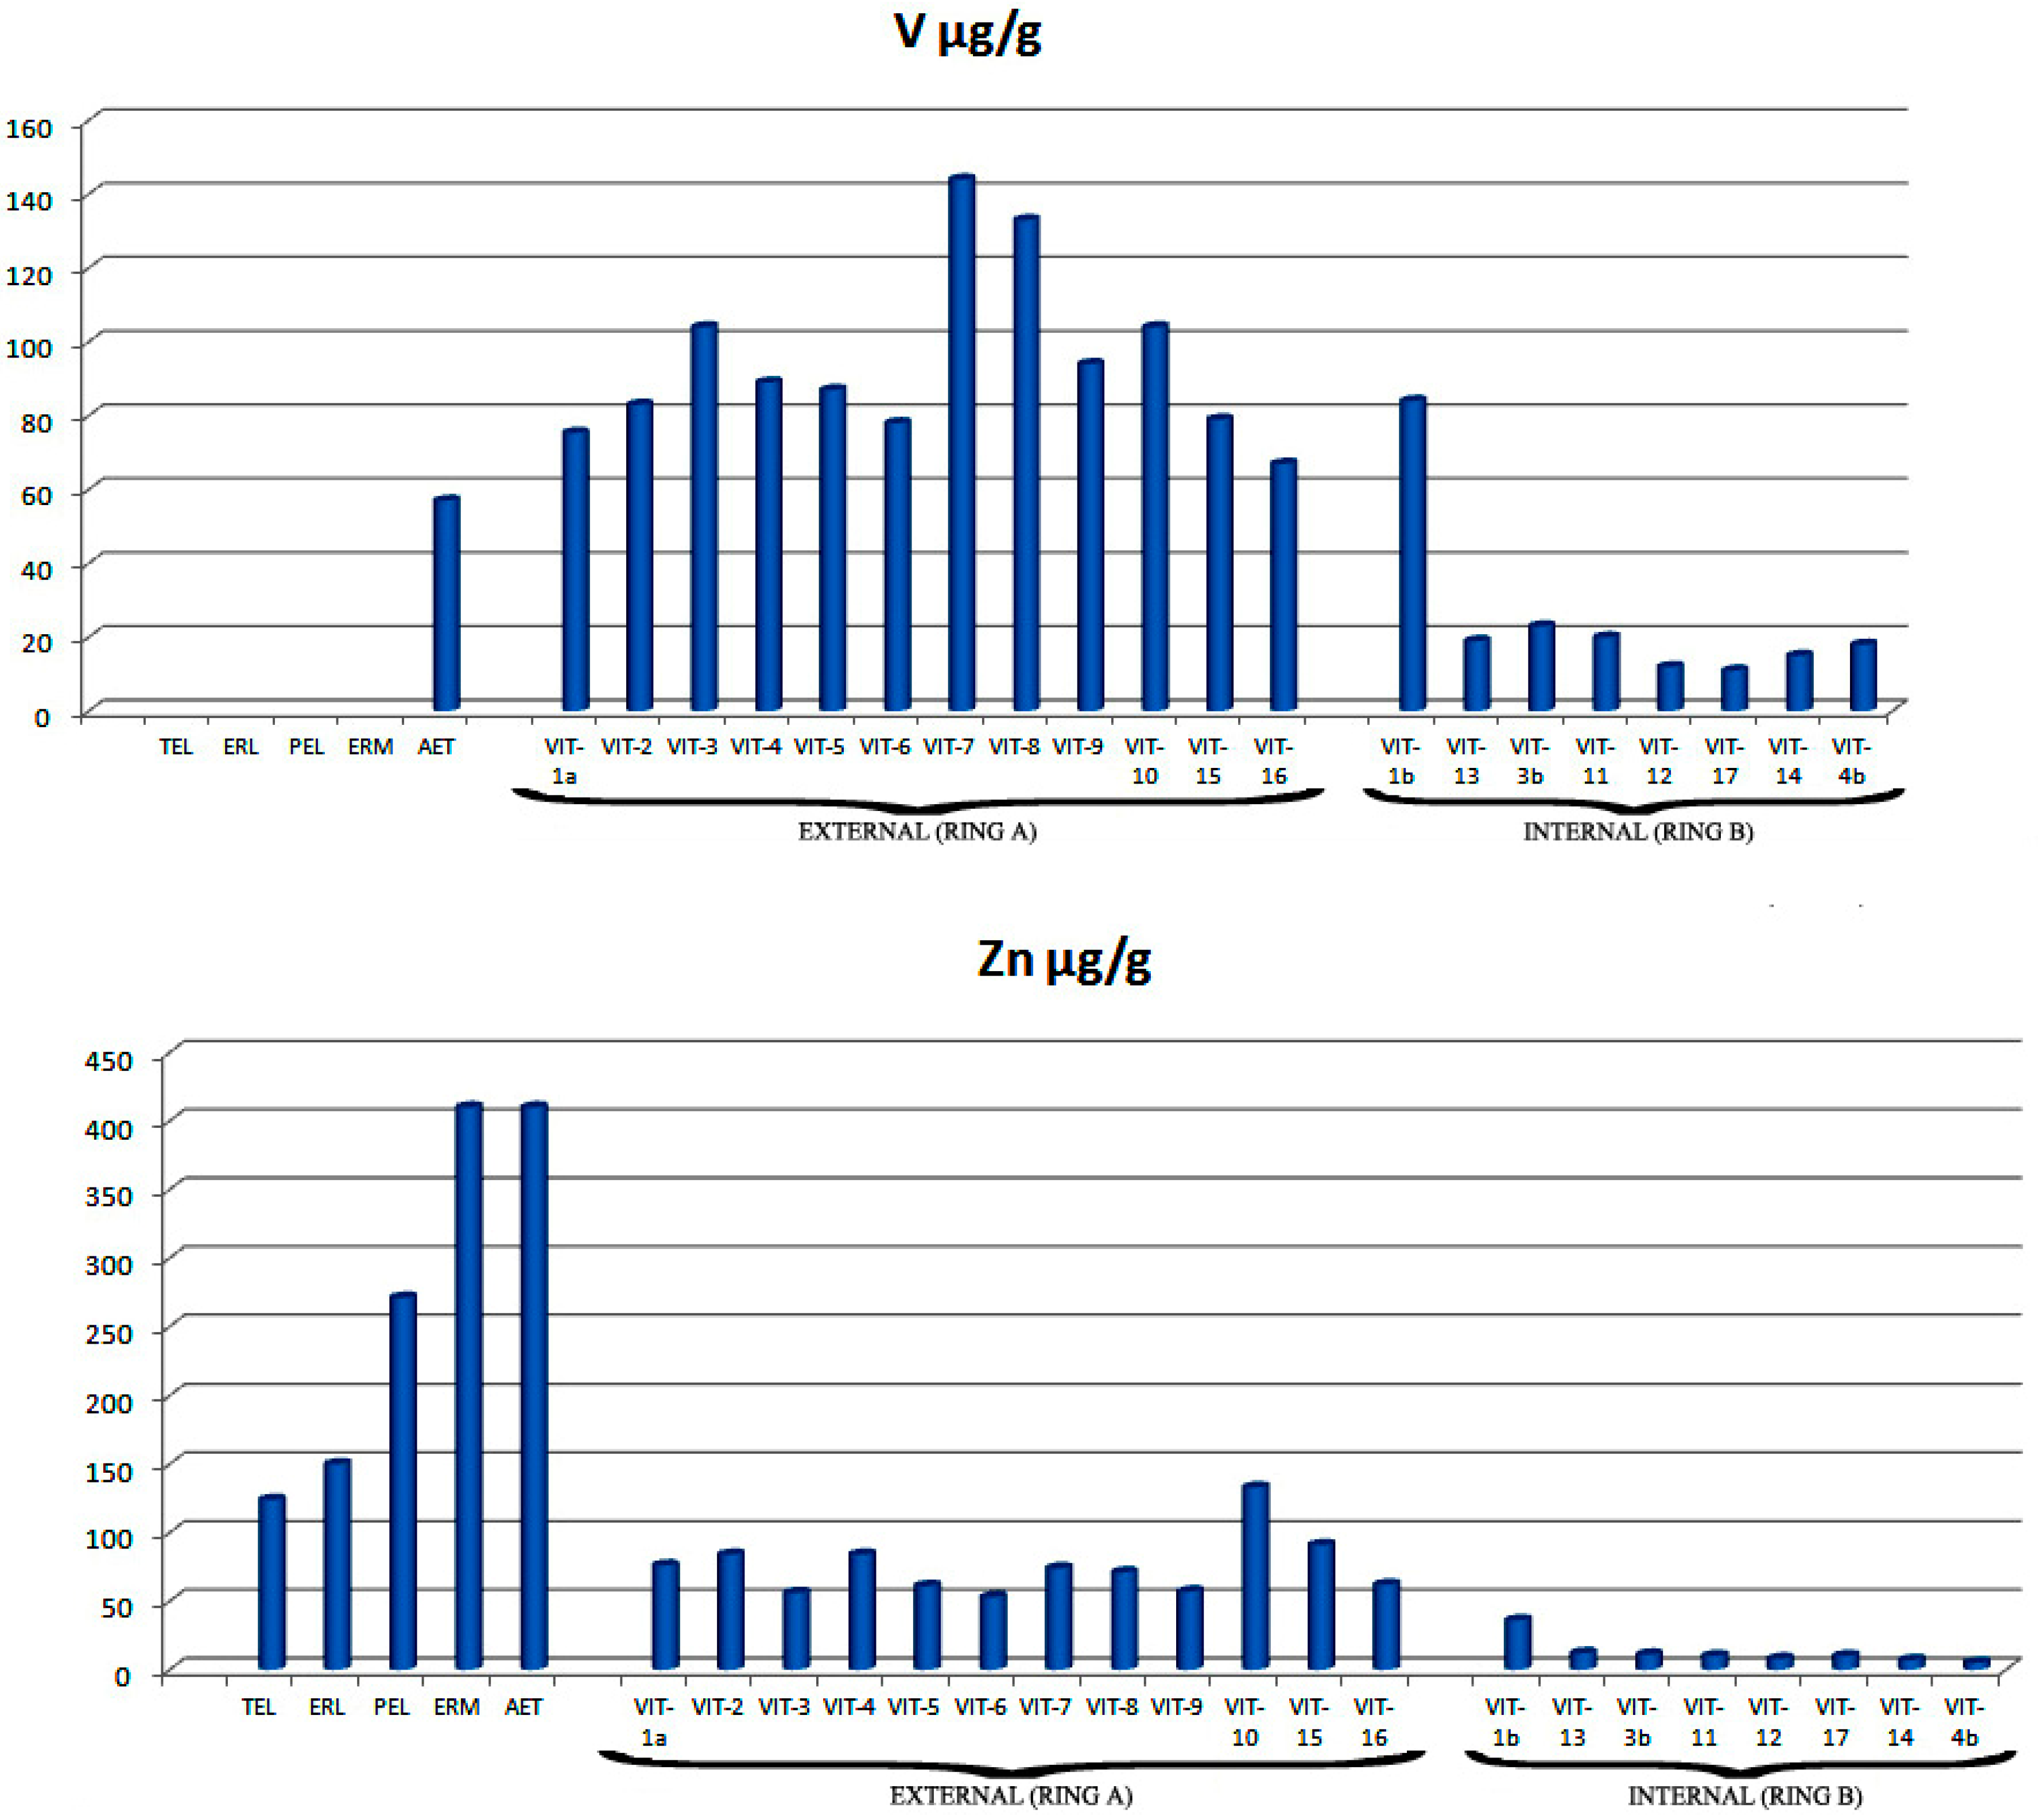
The following two figures illustrate metal distribution using two different sets of diagrams: 2D and 3D diagrams. The first group of diagrams (Figure 6) shows (in two dimensions) the different metal concentrations (μg/g or %) present in the sediment of each station (stations were named “VIT-“, after “Vitória”). Each of these diagrams is subdivided into two parts, left and right. The concentrations measured in each station (on the right) were compared to the five quality aforementioned bench marks (on the left). In addition, sampling stations were grouped according to their geographical distribution, as depicted in 
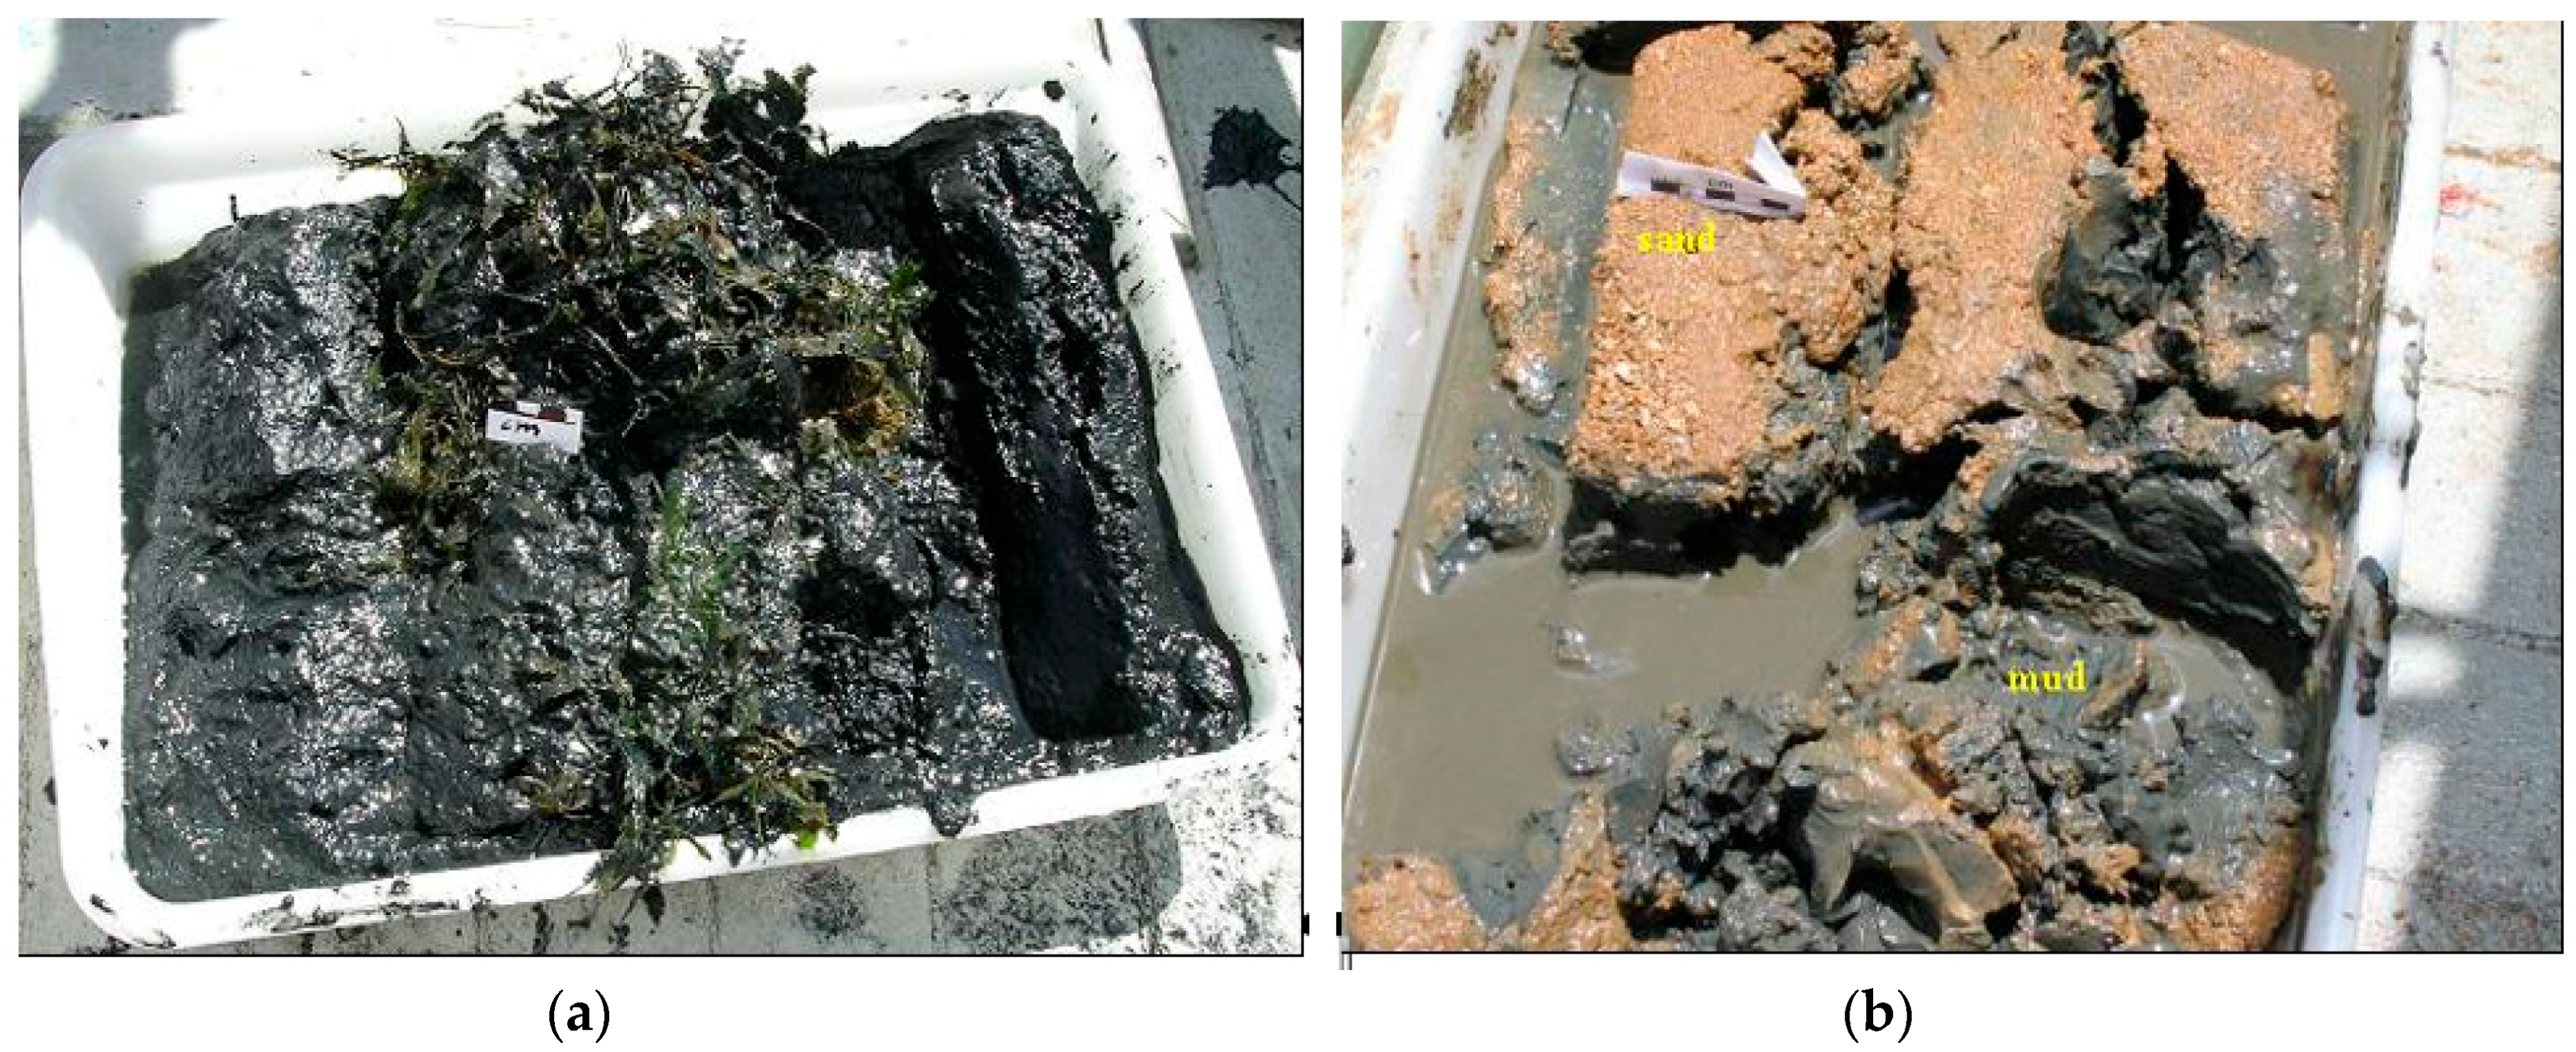
Figure 5. Those belonging to the EXTERNAL side of the ring, named RING A (stations VIT-1a, VIT-2, VIT-3, VIT-4, VIT-5, VIT-6, VIT-7, VIT-8, VIT-9, VIT-10, VIT-15, andVIT-16), were close to the coast and were rich in organic matter, whereas the sandy component prevailed for those belonging to the INTERNAL part of the ring inside RING B (stationsVIT-1b, VIT-13, VIT-3b, VIT-11, VIT-12, VIT-17, VIT-4b, and VIT-14).
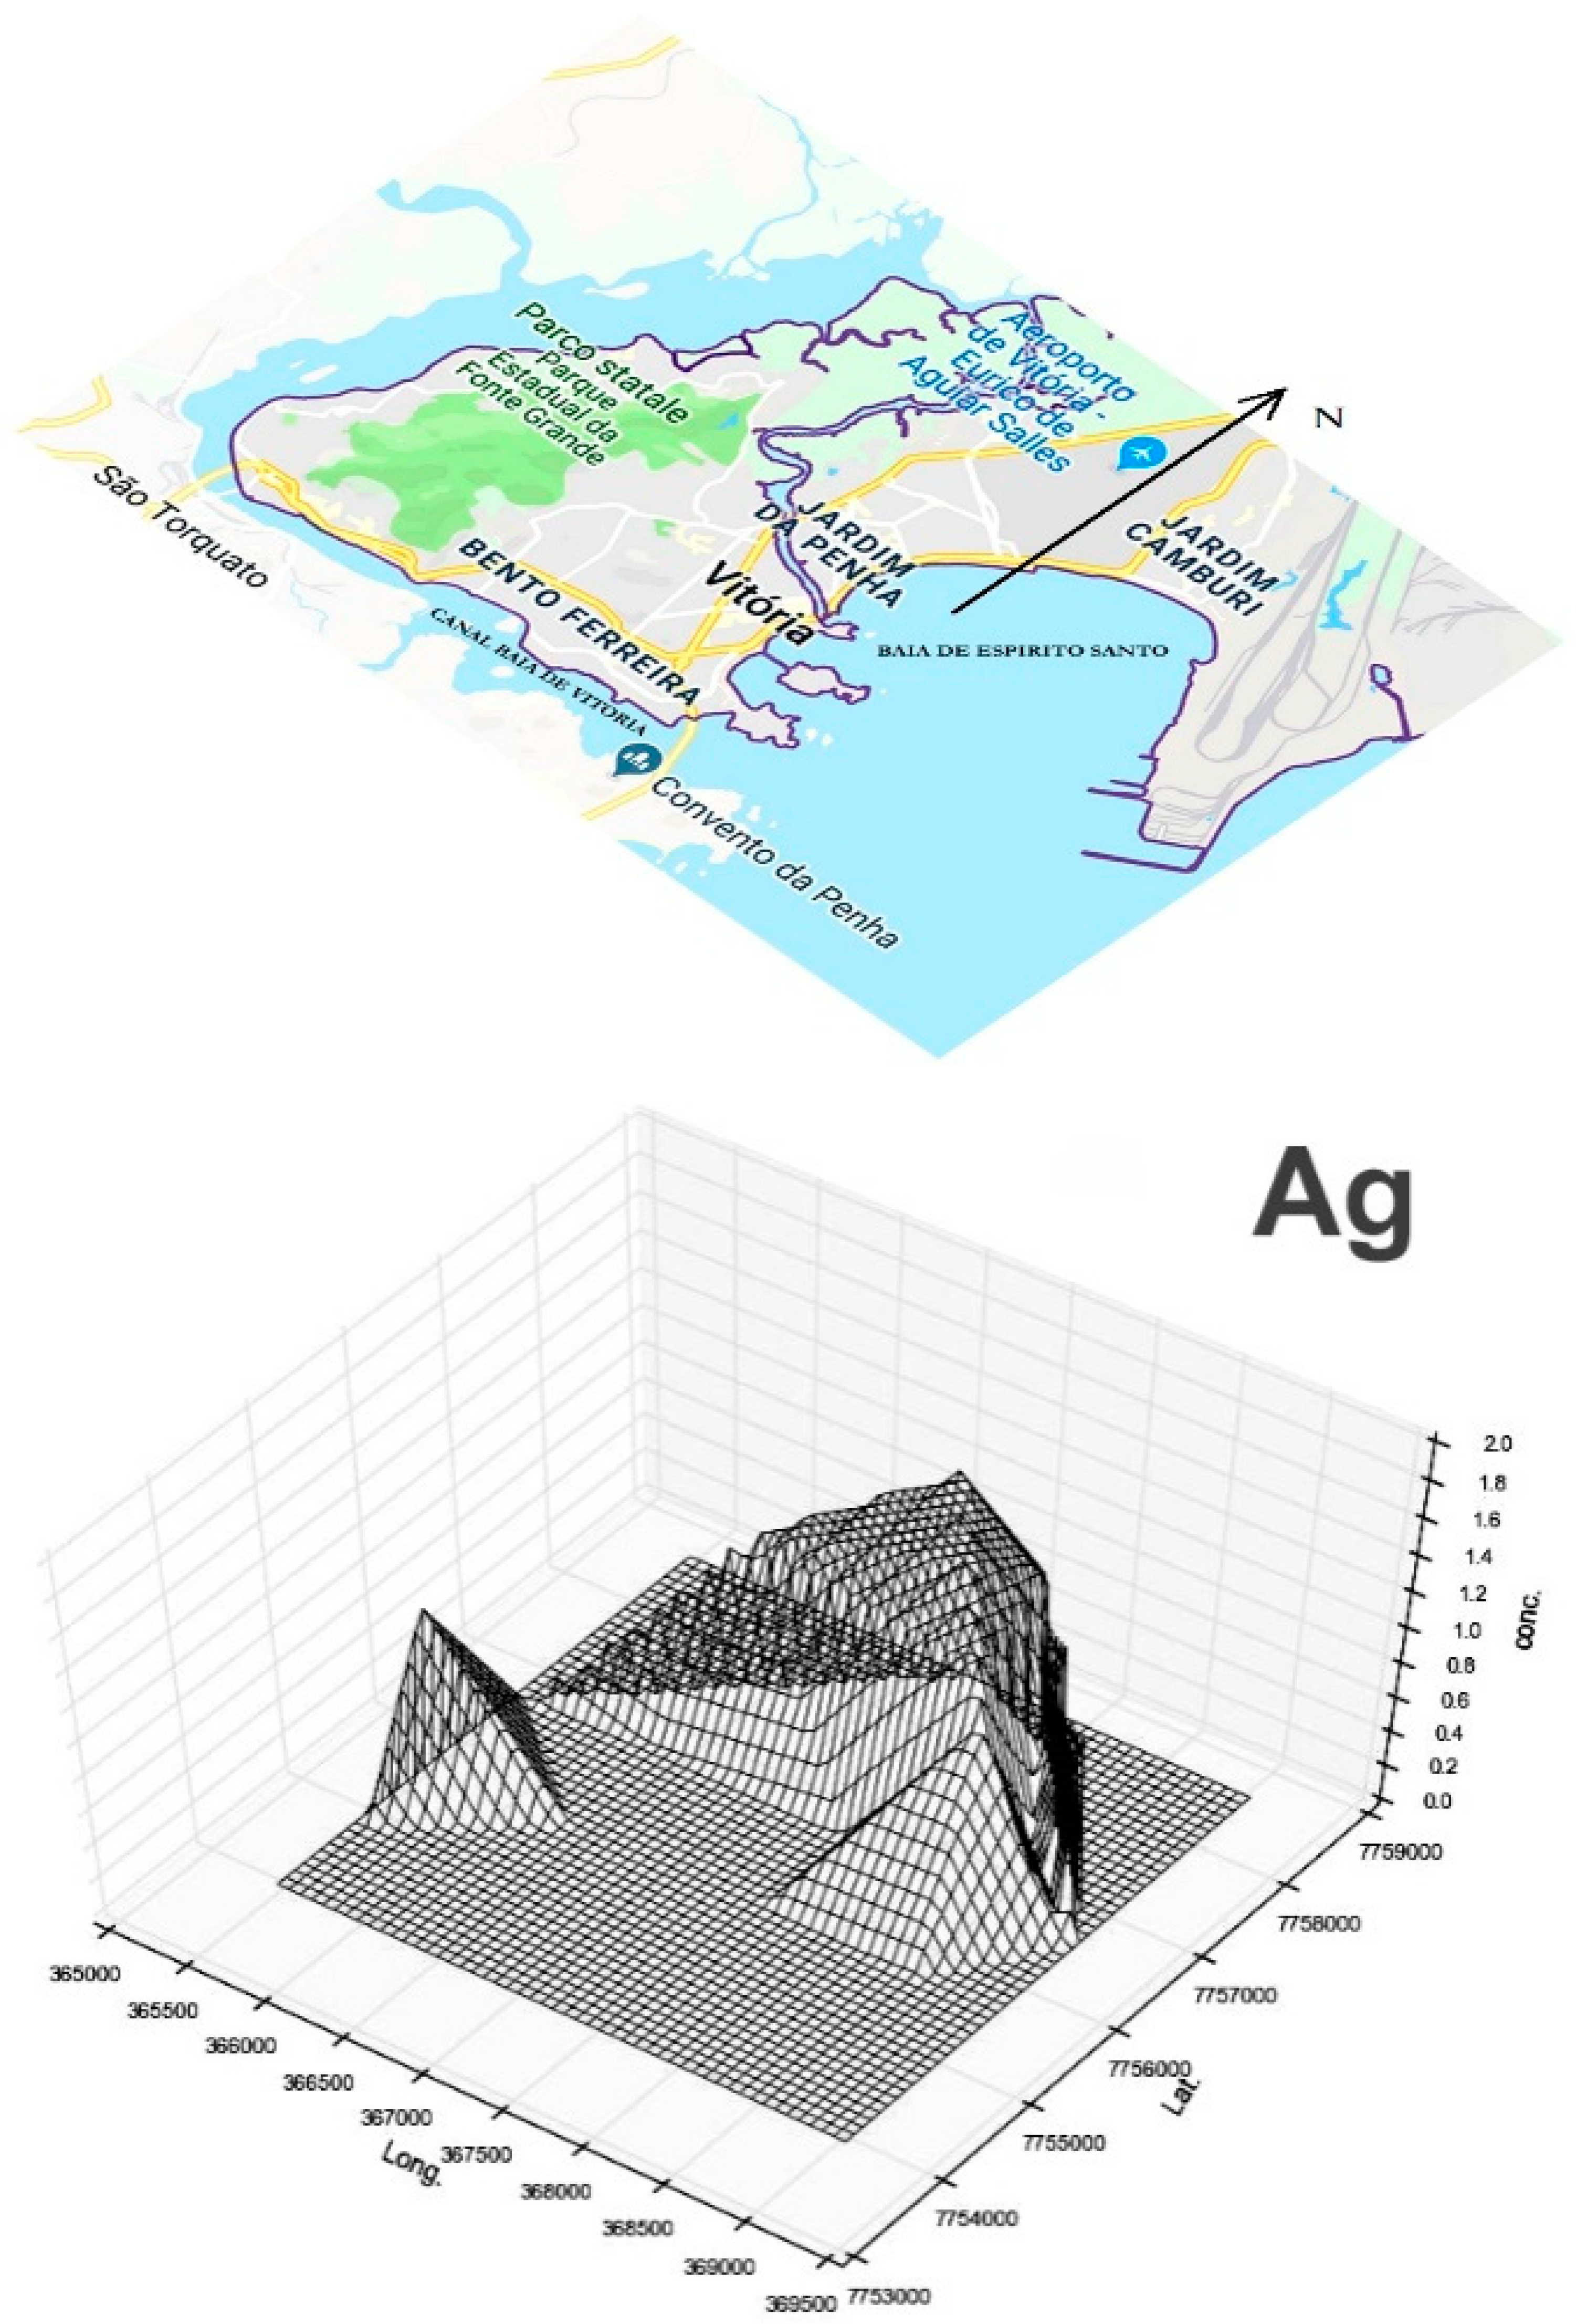
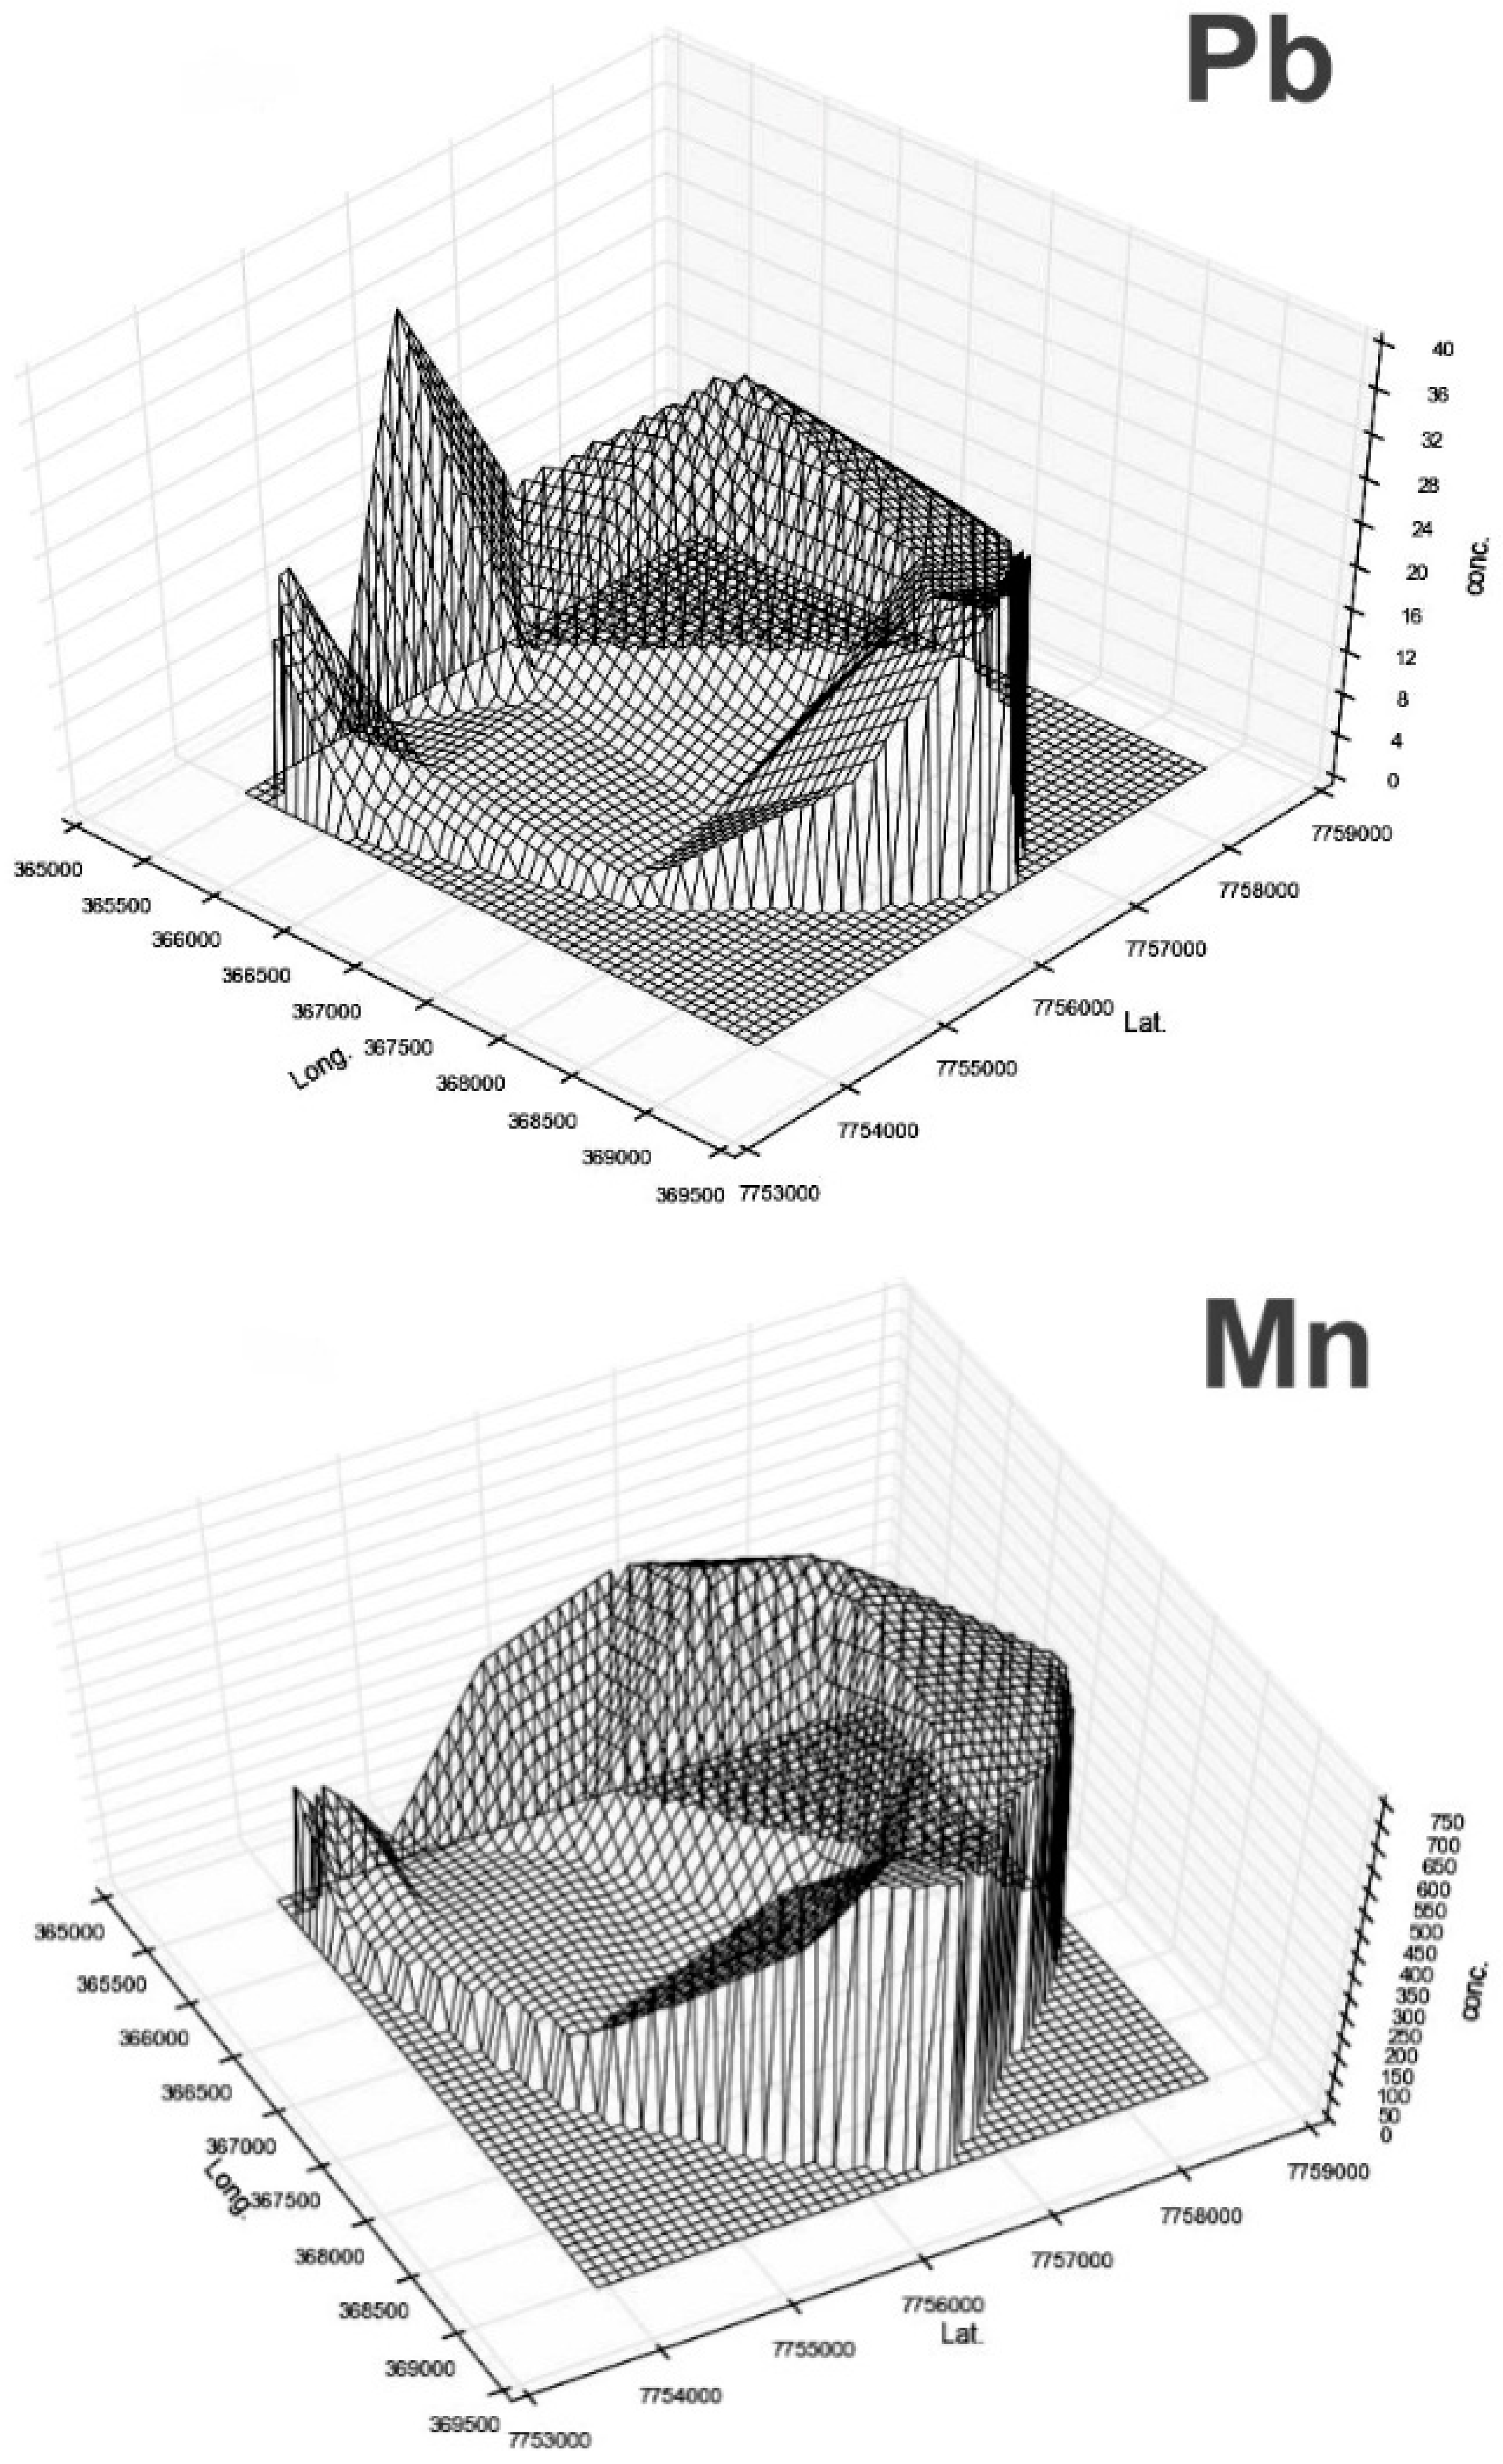
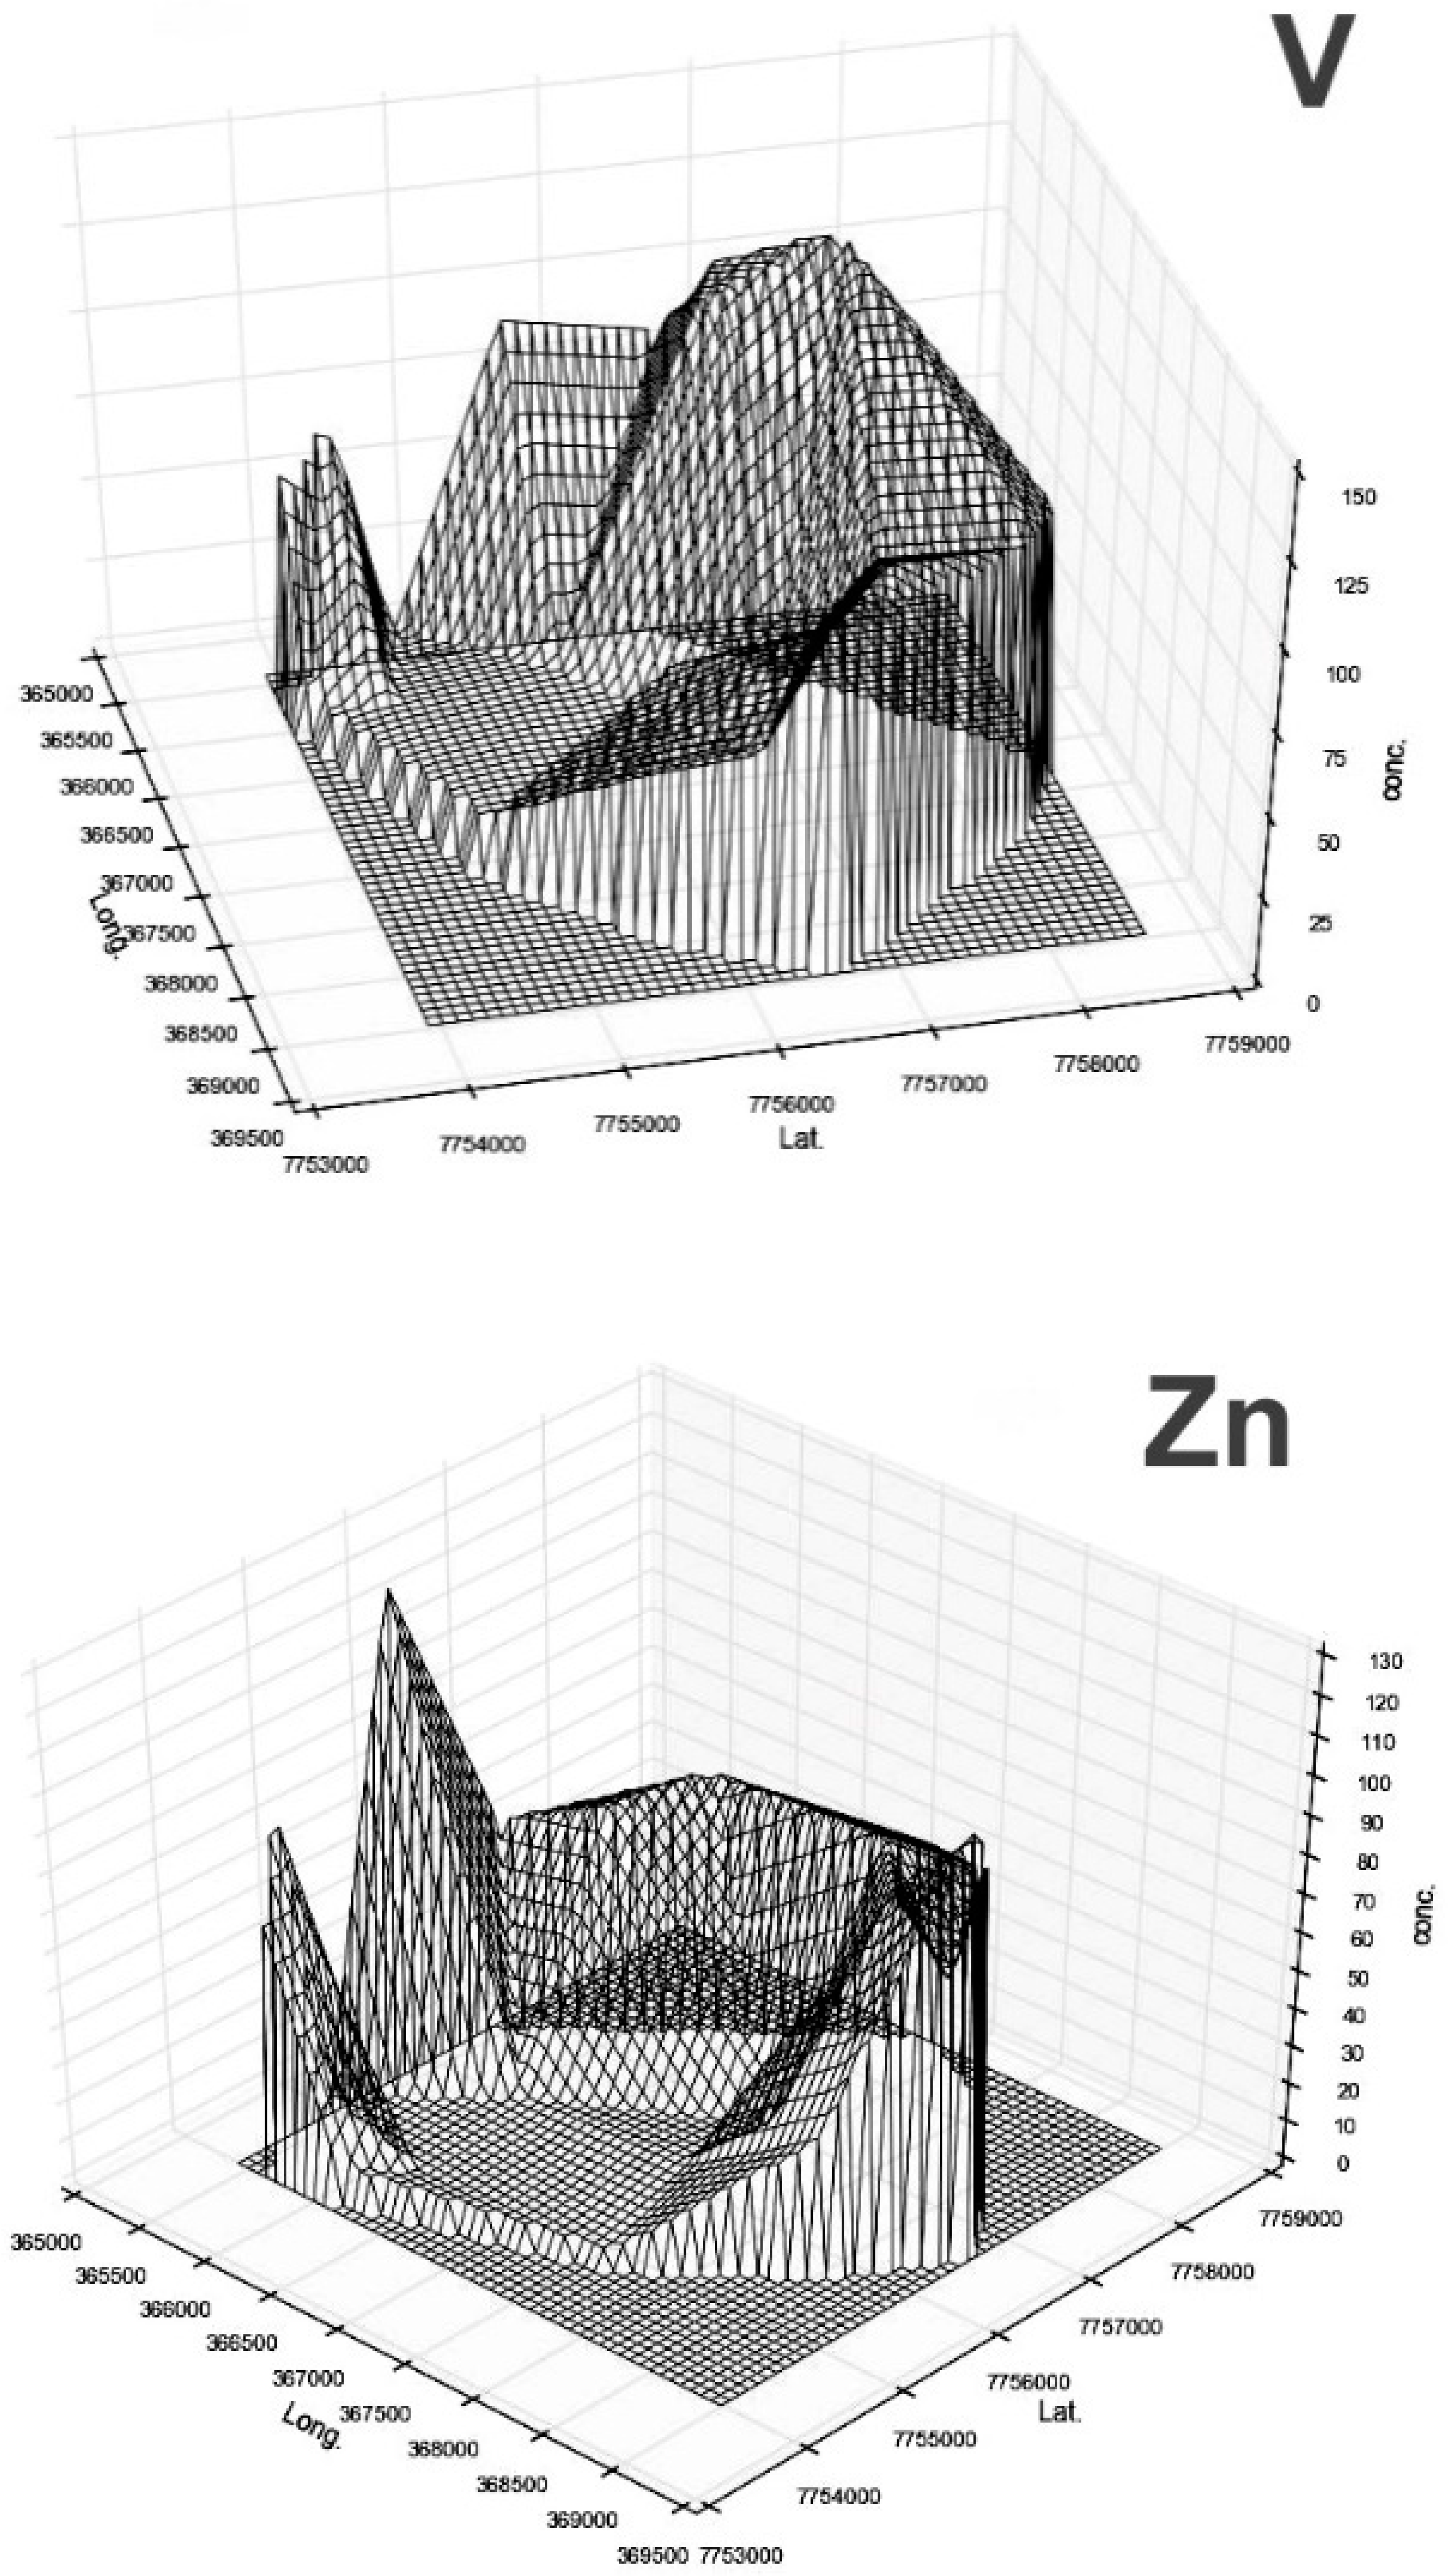
The second group of diagrams (Figure 7) reports in three dimensions on the z axis the concentration (μg/g or %) of the 17 considered elements (Ag, Al, Bi, As, Cd, Cu, Fe, Pb, Mn, Mo, Ni, Sb, Sr, Th, U, V, and Zn) against geographical coordinates (longitude on the left and latitude on the right), so that the prevailing contaminated spots became evident.
From the two-dimensional diagrams presented in Figure 6, it is possible to see that only 6 out of the total 12 reported elements showed regular behavior that would allow a rational interpretation. In more detail, six elements (arsenic, barium, manganese, copper, antimony, and vanadium) suggested that potential pollution sources could be located between station 6 and station 8, with station 7 probably being the closest to the actual contamination source. As far as manganese and iron, it seems that there could have been a substantial contribution from sources located very close to the industrial area, where specific metal industrial processing is normally carried out.
On the other hand, metal industrial processing did not seem to contribute significantly to arsenic concentration, which is probably more dependent on Canal de Passagem and Canal de Camburì inputs. However, this appeared to be bizarre, because it required that this element gets to the Baia de Espírito Santo through the Canal de Passagem, an area densely populated by mangroves, which normally should be a priori chemically uncontaminated [9]. Therefore, such results should be more deeply analyzed in the future, taking into account the hydrodynamics of the involved ecosystem as well.
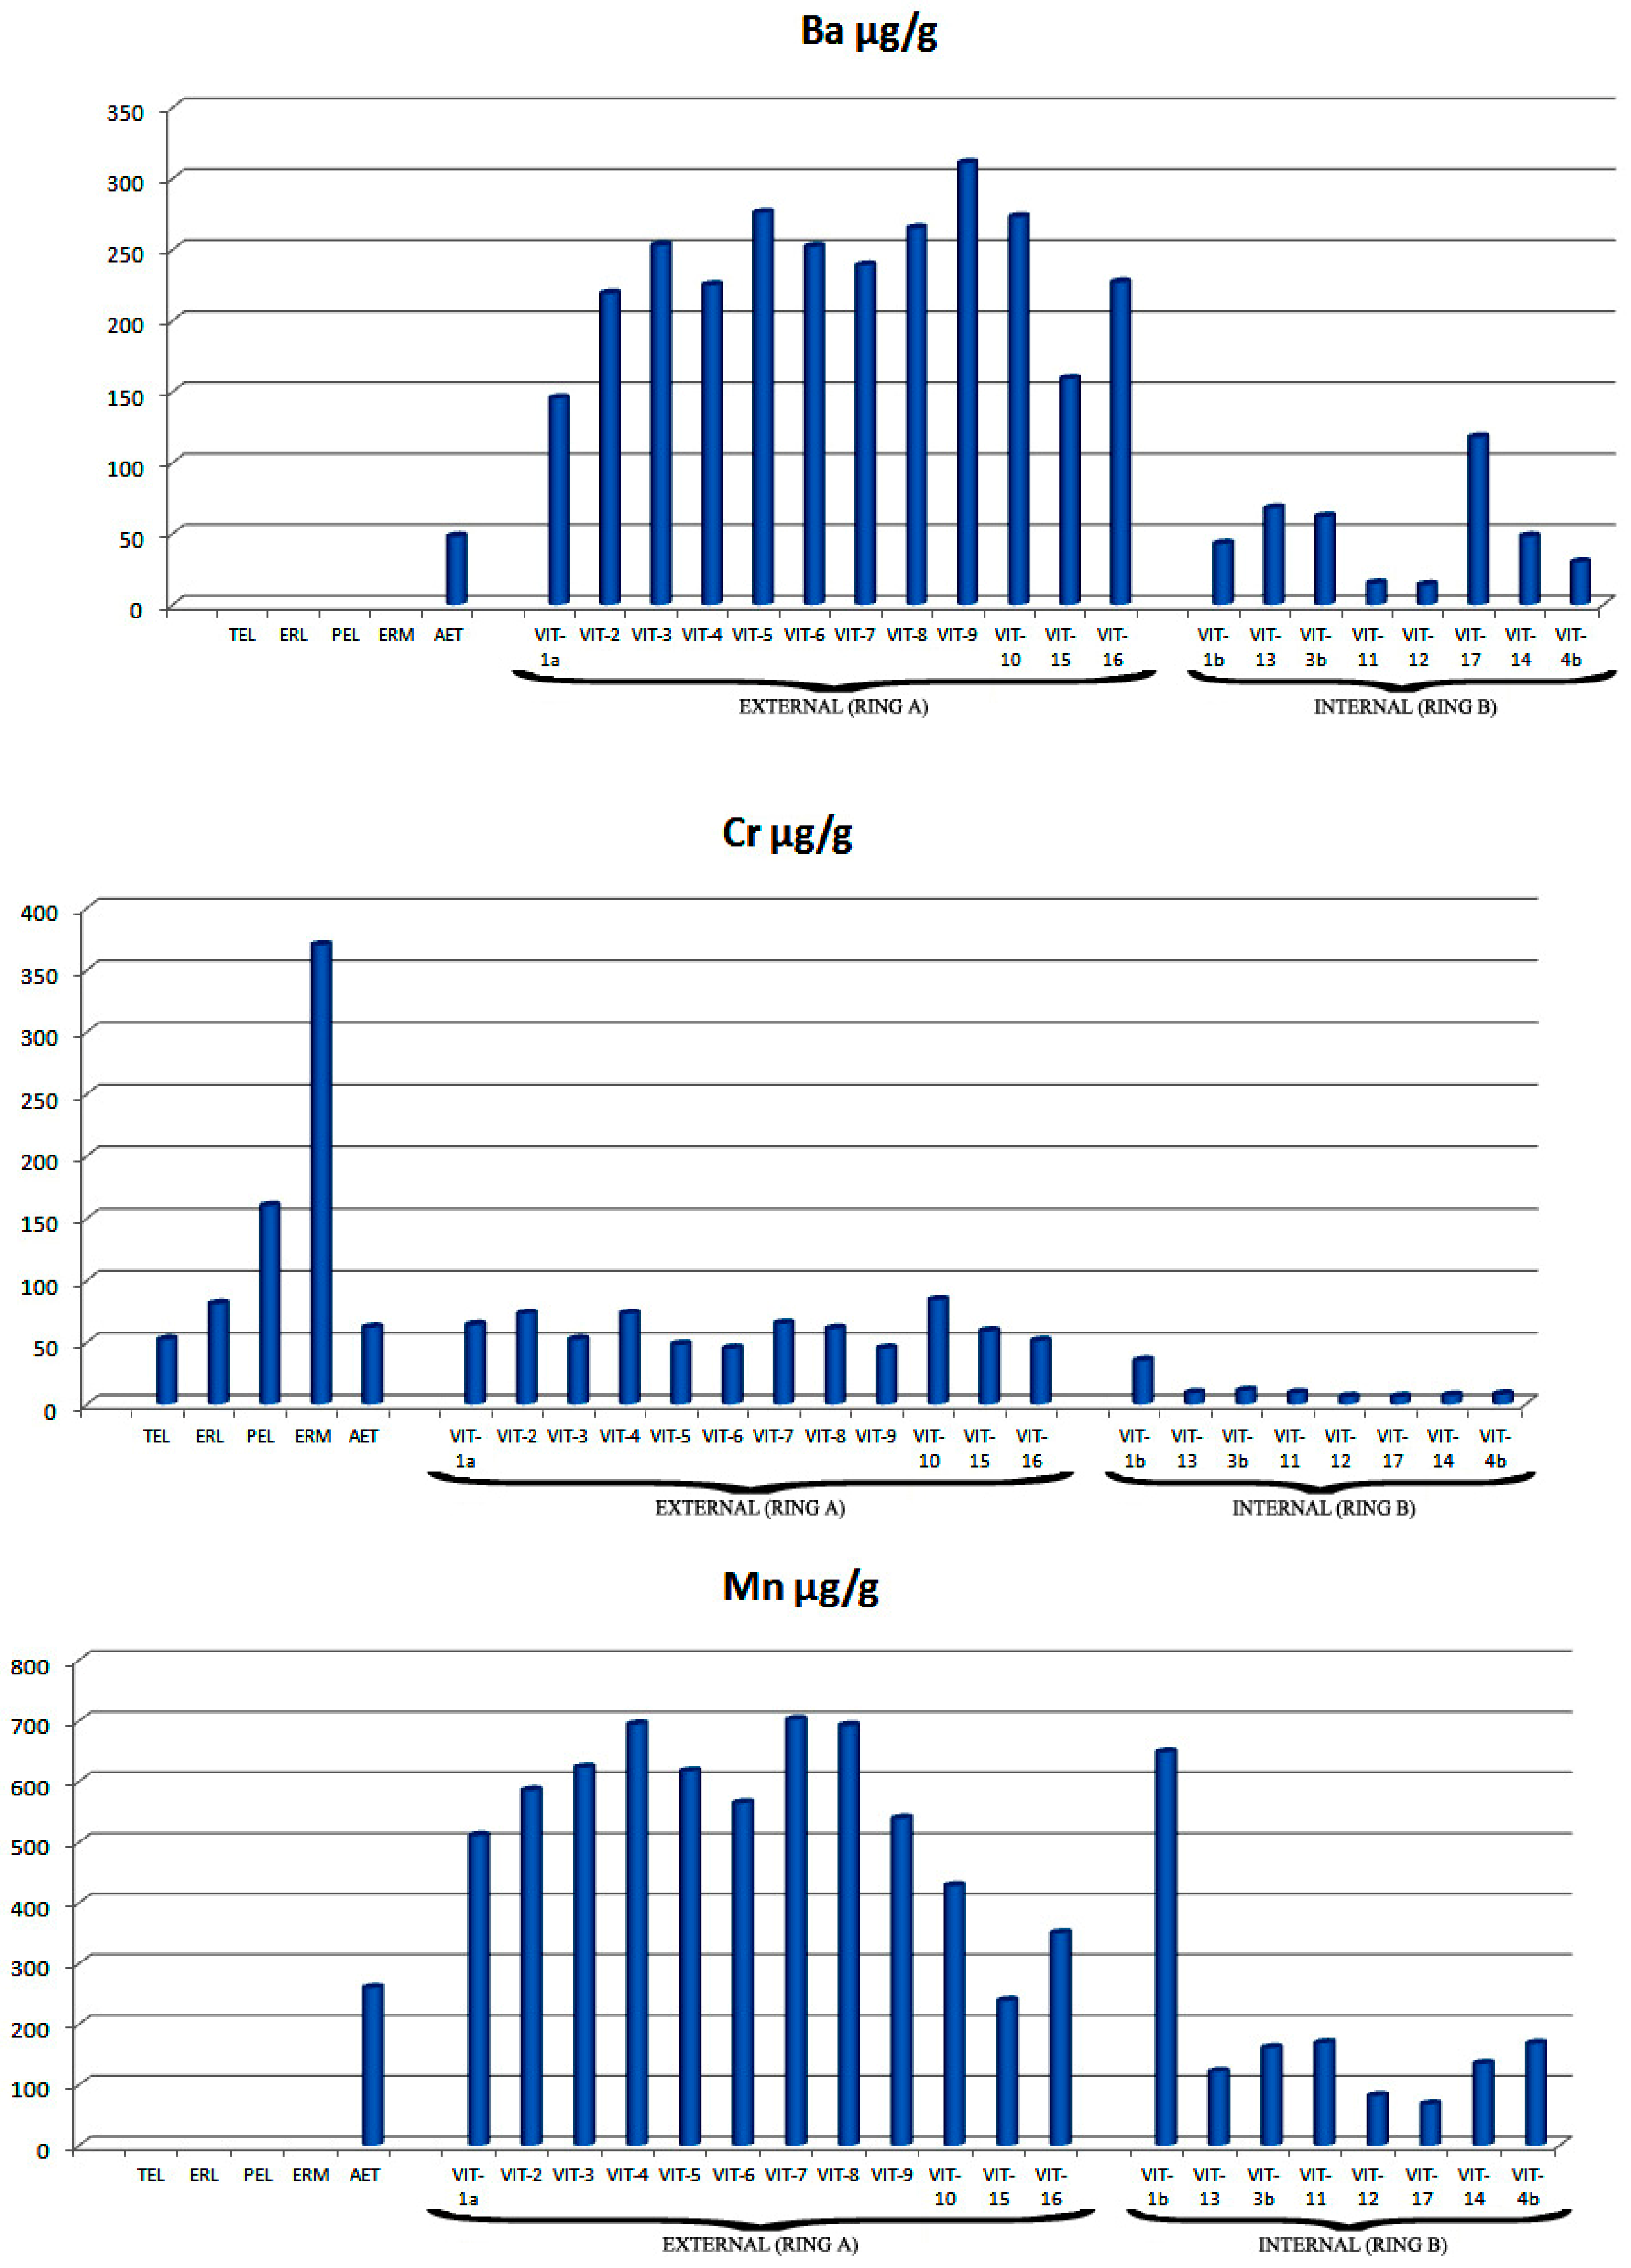
A deeper analysis of the bi-dimensional diagrams reported in Figure 6 suggested what might be the origin of the inputs of the polluting metals discharged in the bay. Particularly, it was possible to identify at least four main potential sources of pollutants, which, briefly, were named α, β, γ, and δ, corresponding to the Espírito Santo Bay regions of the southeast (see, for example, station VIT-4b, but also VIT-17), the east and northeast (see, for example, stations VIT-8, VIT-9, VIT-10, VIT-11, and VIT-12, but also VIT-15 close to the Ilha do Frade bridge), the north (see, for example, stations VIT-5, VIT-6, and VIT-7), and the west and southwest (see, for example, stations VIT-1a, VIT-1b, and VIT-2), respectively. The source α represented, on the one hand, the pollution coming out from (and collected by) Vitória Bay, and on the other hand that coming from the urban discharges of the Vitóriacity suburbs such as Bento Ferreira, Jesus de Nazareth, Praia do Suà, Santa Helena, and Santa Lucia, and also from Centro de Vila Velha. As far as β, this source described the Canal de Passagem outputs, but also those coming from Vitória city quarters such as, again, Santa Lucia, and also Praia do Canto, Jardim de Penha, and Ilha do Frade. The pollution originating from the activities located along Camburì Beach and the Jarim de Camburì urban site was monitored by γ stations. Lastly, the Tubarão harbor area pollution situation was illustrated by δ. In this contest, Ba showed a large and high peak along β (stations VIT-8, 265 μg/g; VIT-9, 311 μg/g; VIT-10, 273 μg/g; VIT-15, 159 μg/g), a secondary peak along γ (stations VIT-5, 276 μg/g; VIT-6, 252 μg/g; VIT-7, 239 μg/g), and sharper peaks along δ (station VIT-3, 253 μg/g) and α (station VIT-16, 227 μg/g). On the other hand, Cr displayed practically only one interesting peak, namely that corresponding to station VIT-10 (β direction, 84 μg/g). The picture was completed by two peaks corresponding to stations VIT-2 (73 μg/g) and VIT-4 (73 μg/g). As far as the other elements, they will be discussed later, when 3D diagrams are addressed.
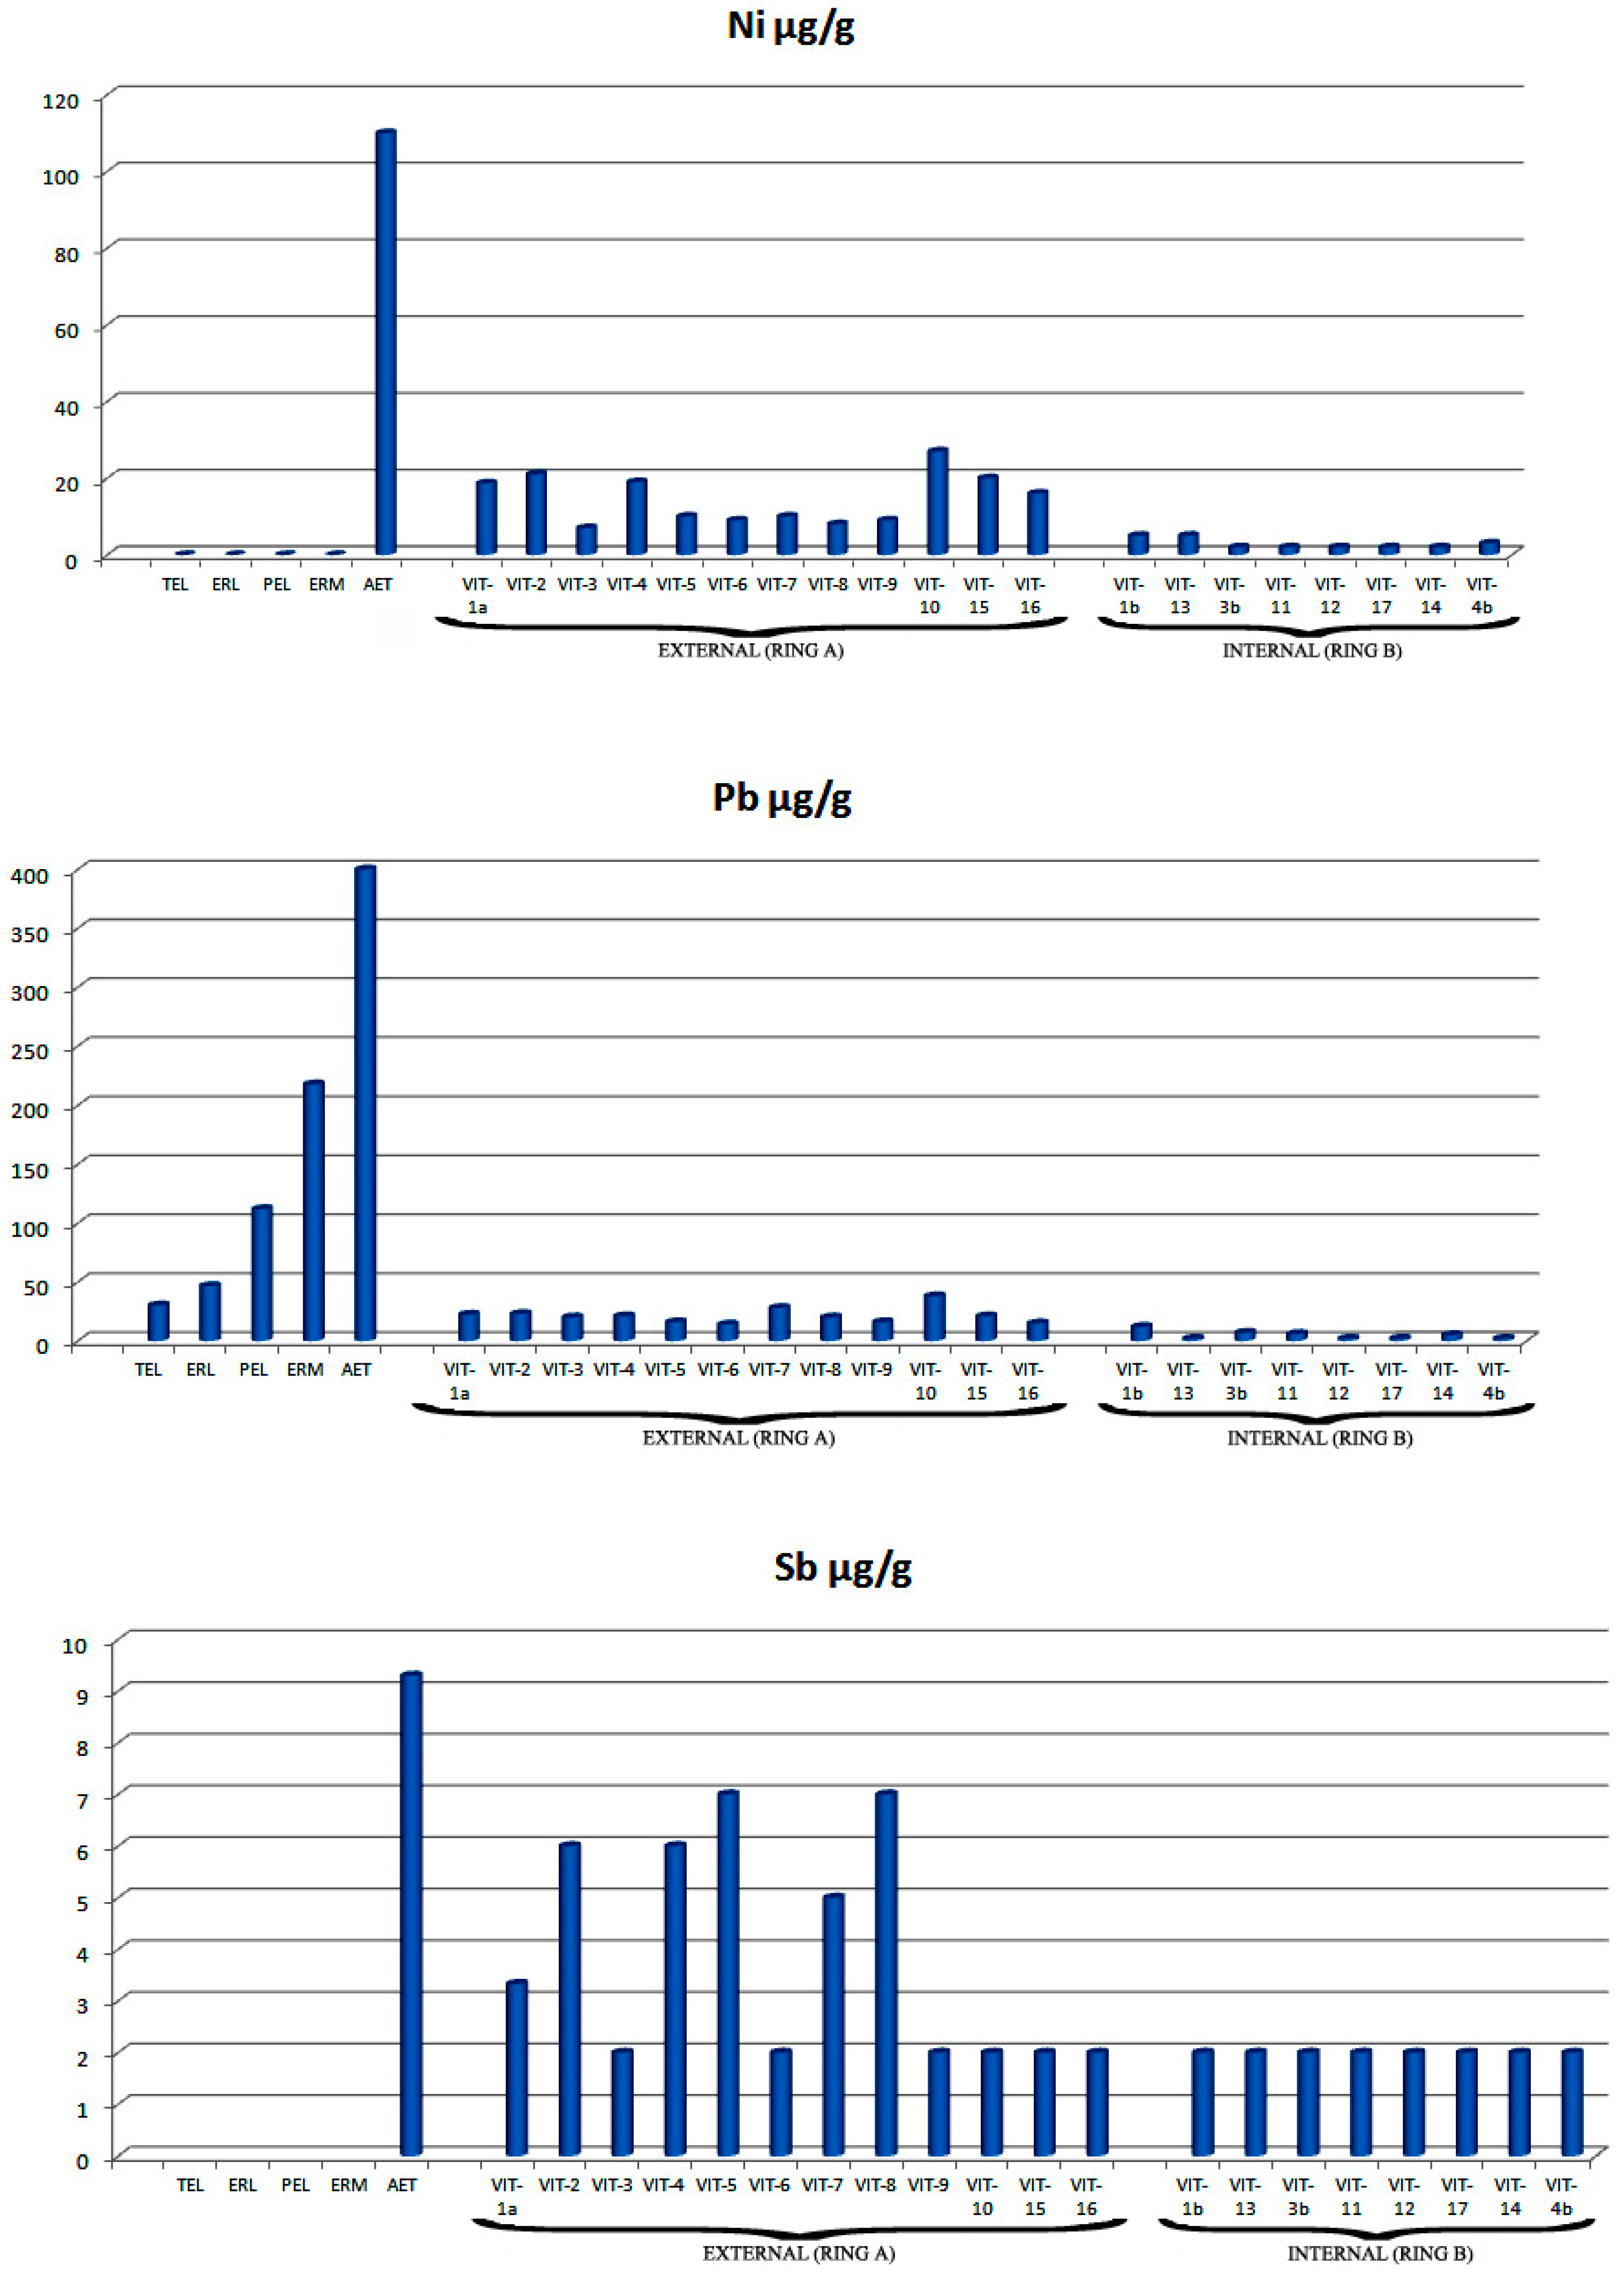
In terms of environmental impact, specifically in terms of AET and TEL benchmarks, experimental data put in evidence that the safety value AET, with the exception of very few stations (such asin the case of As and Mn), constantly surpassed the measured concentrations for all stations located within RING A for aluminum, arsenic, barium, manganese, and vanadium, whereas inside RING B, only in a very few cases did this happen, for barium, arsenic, manganese, and vanadium. However, it is interesting to note that TEL (for those elements where TEL was defined) was surpassed within RING A by elements such as silver, arsenic, and chromium, whereas it was only sporadically reached by lead and zinc. On the contrary, in RING B, only arsenic presented values that sometimes exceeded that threshold.
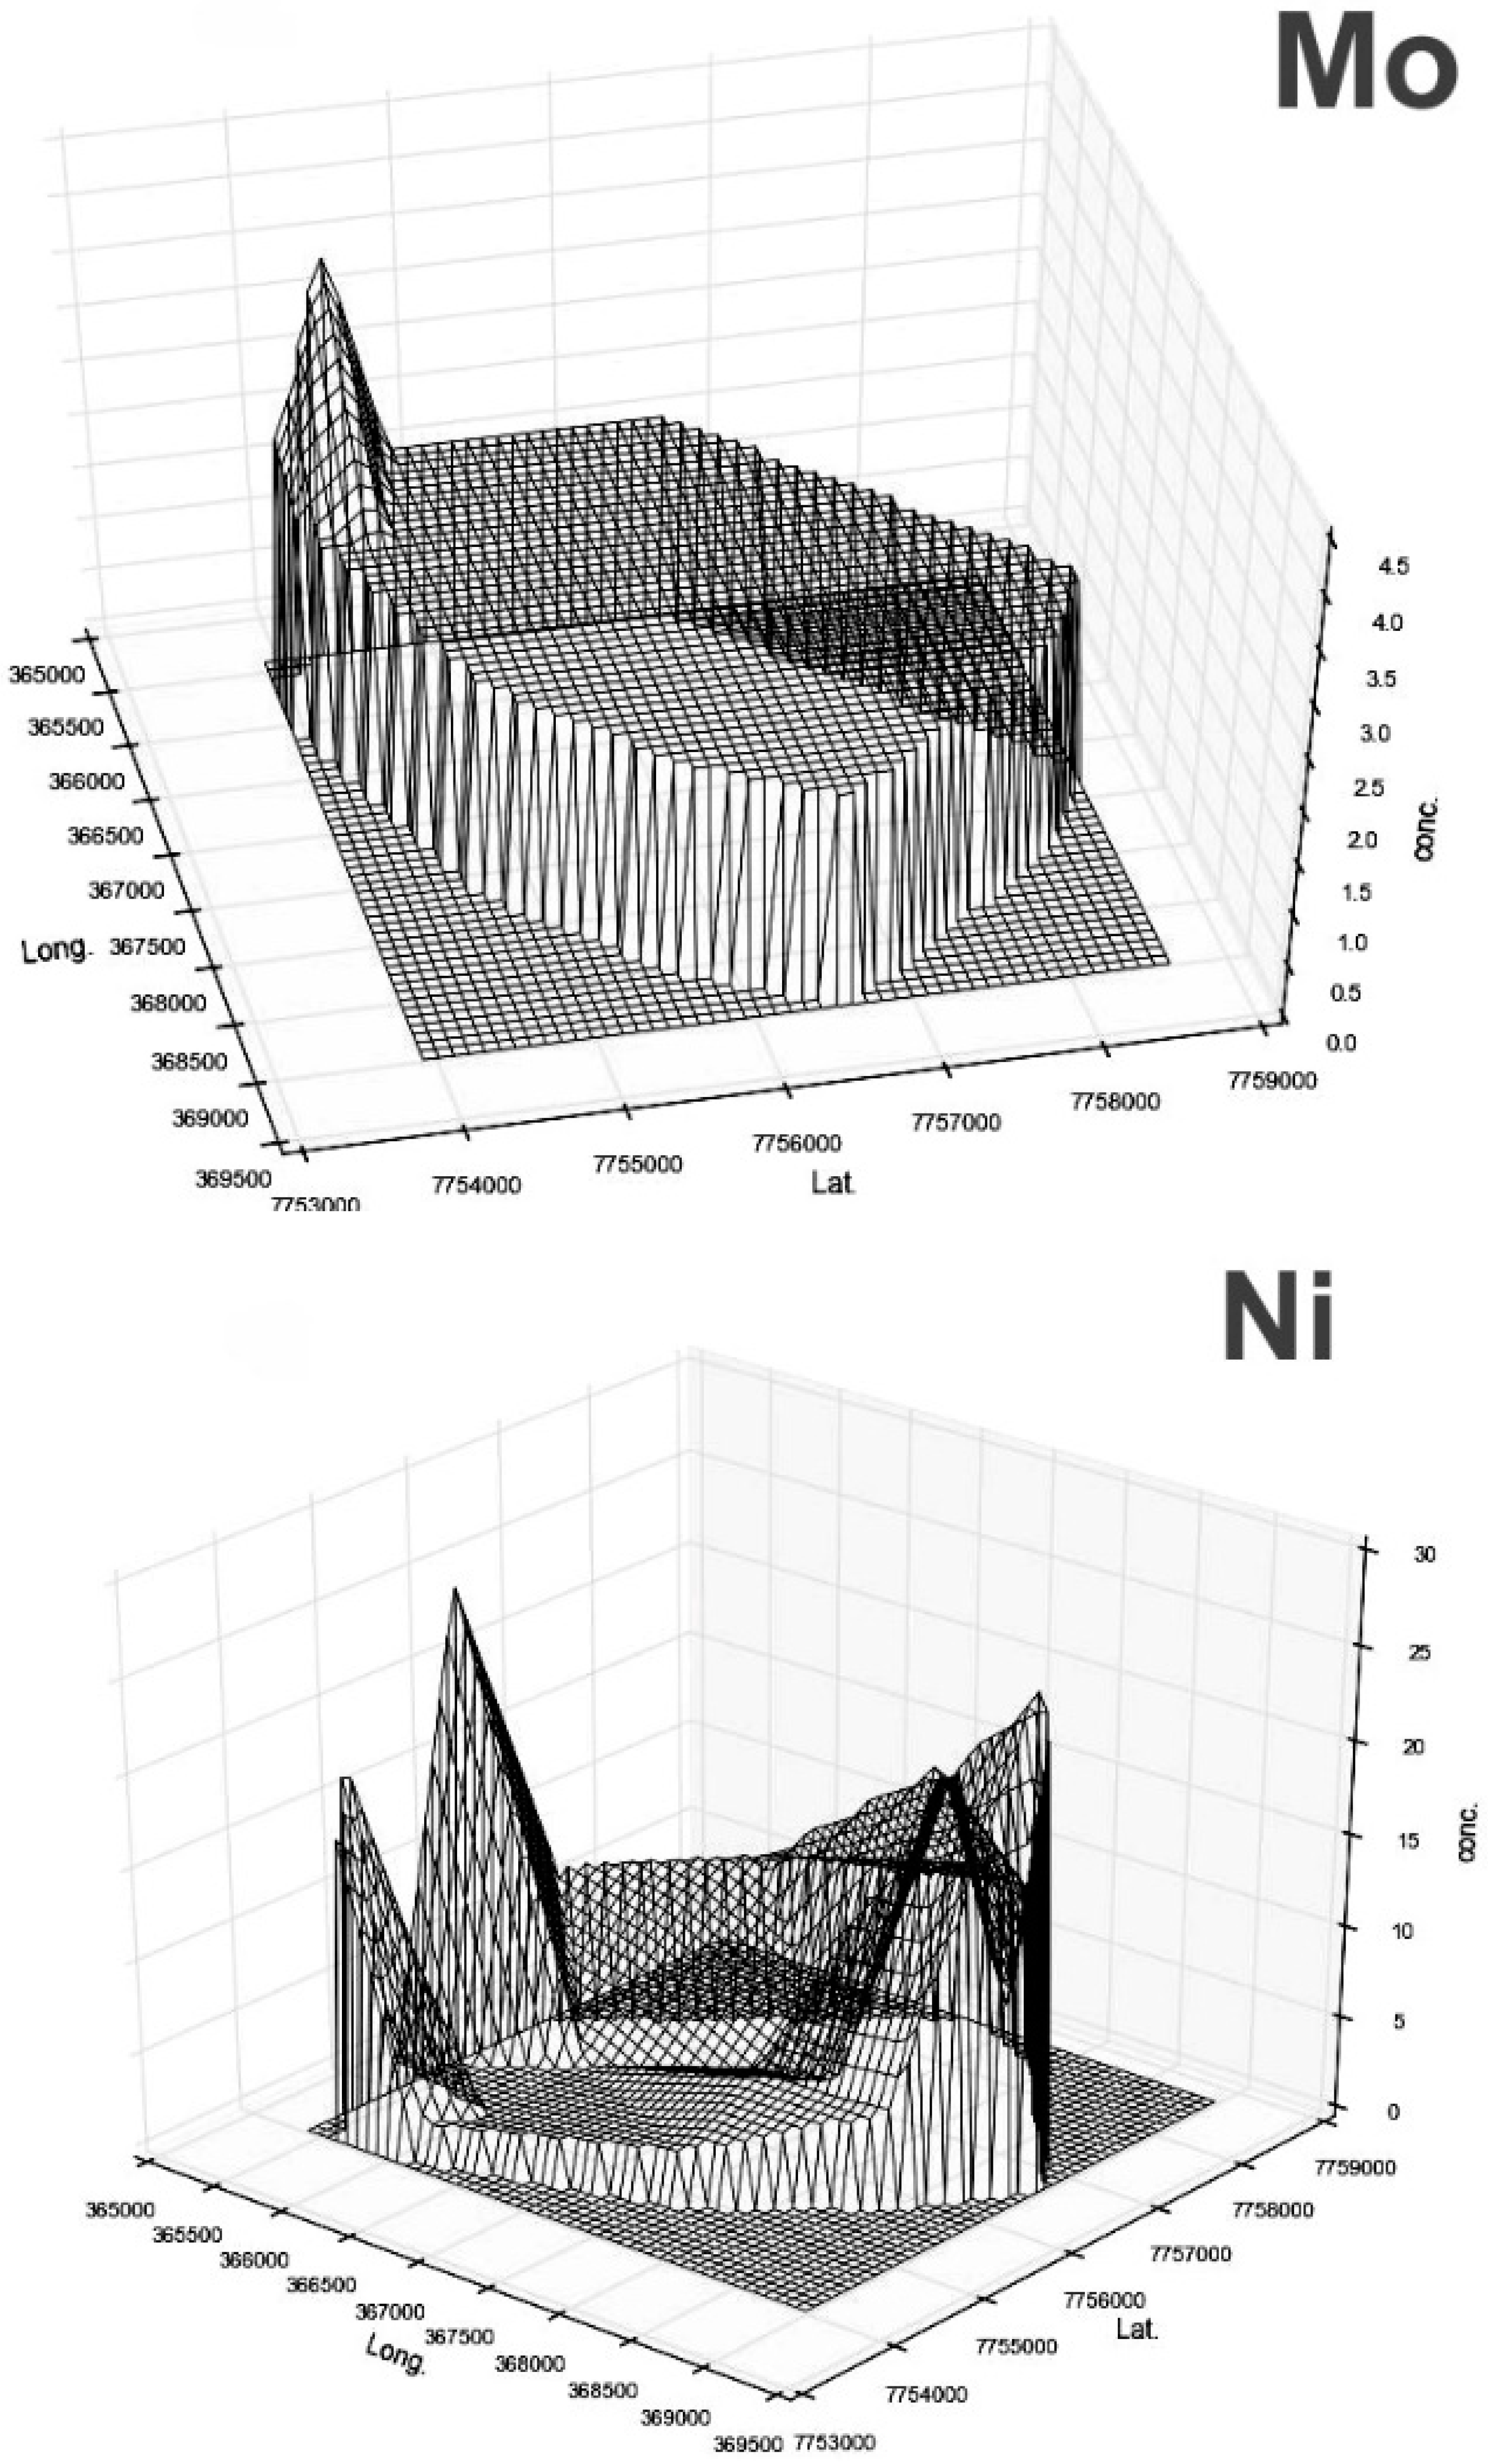
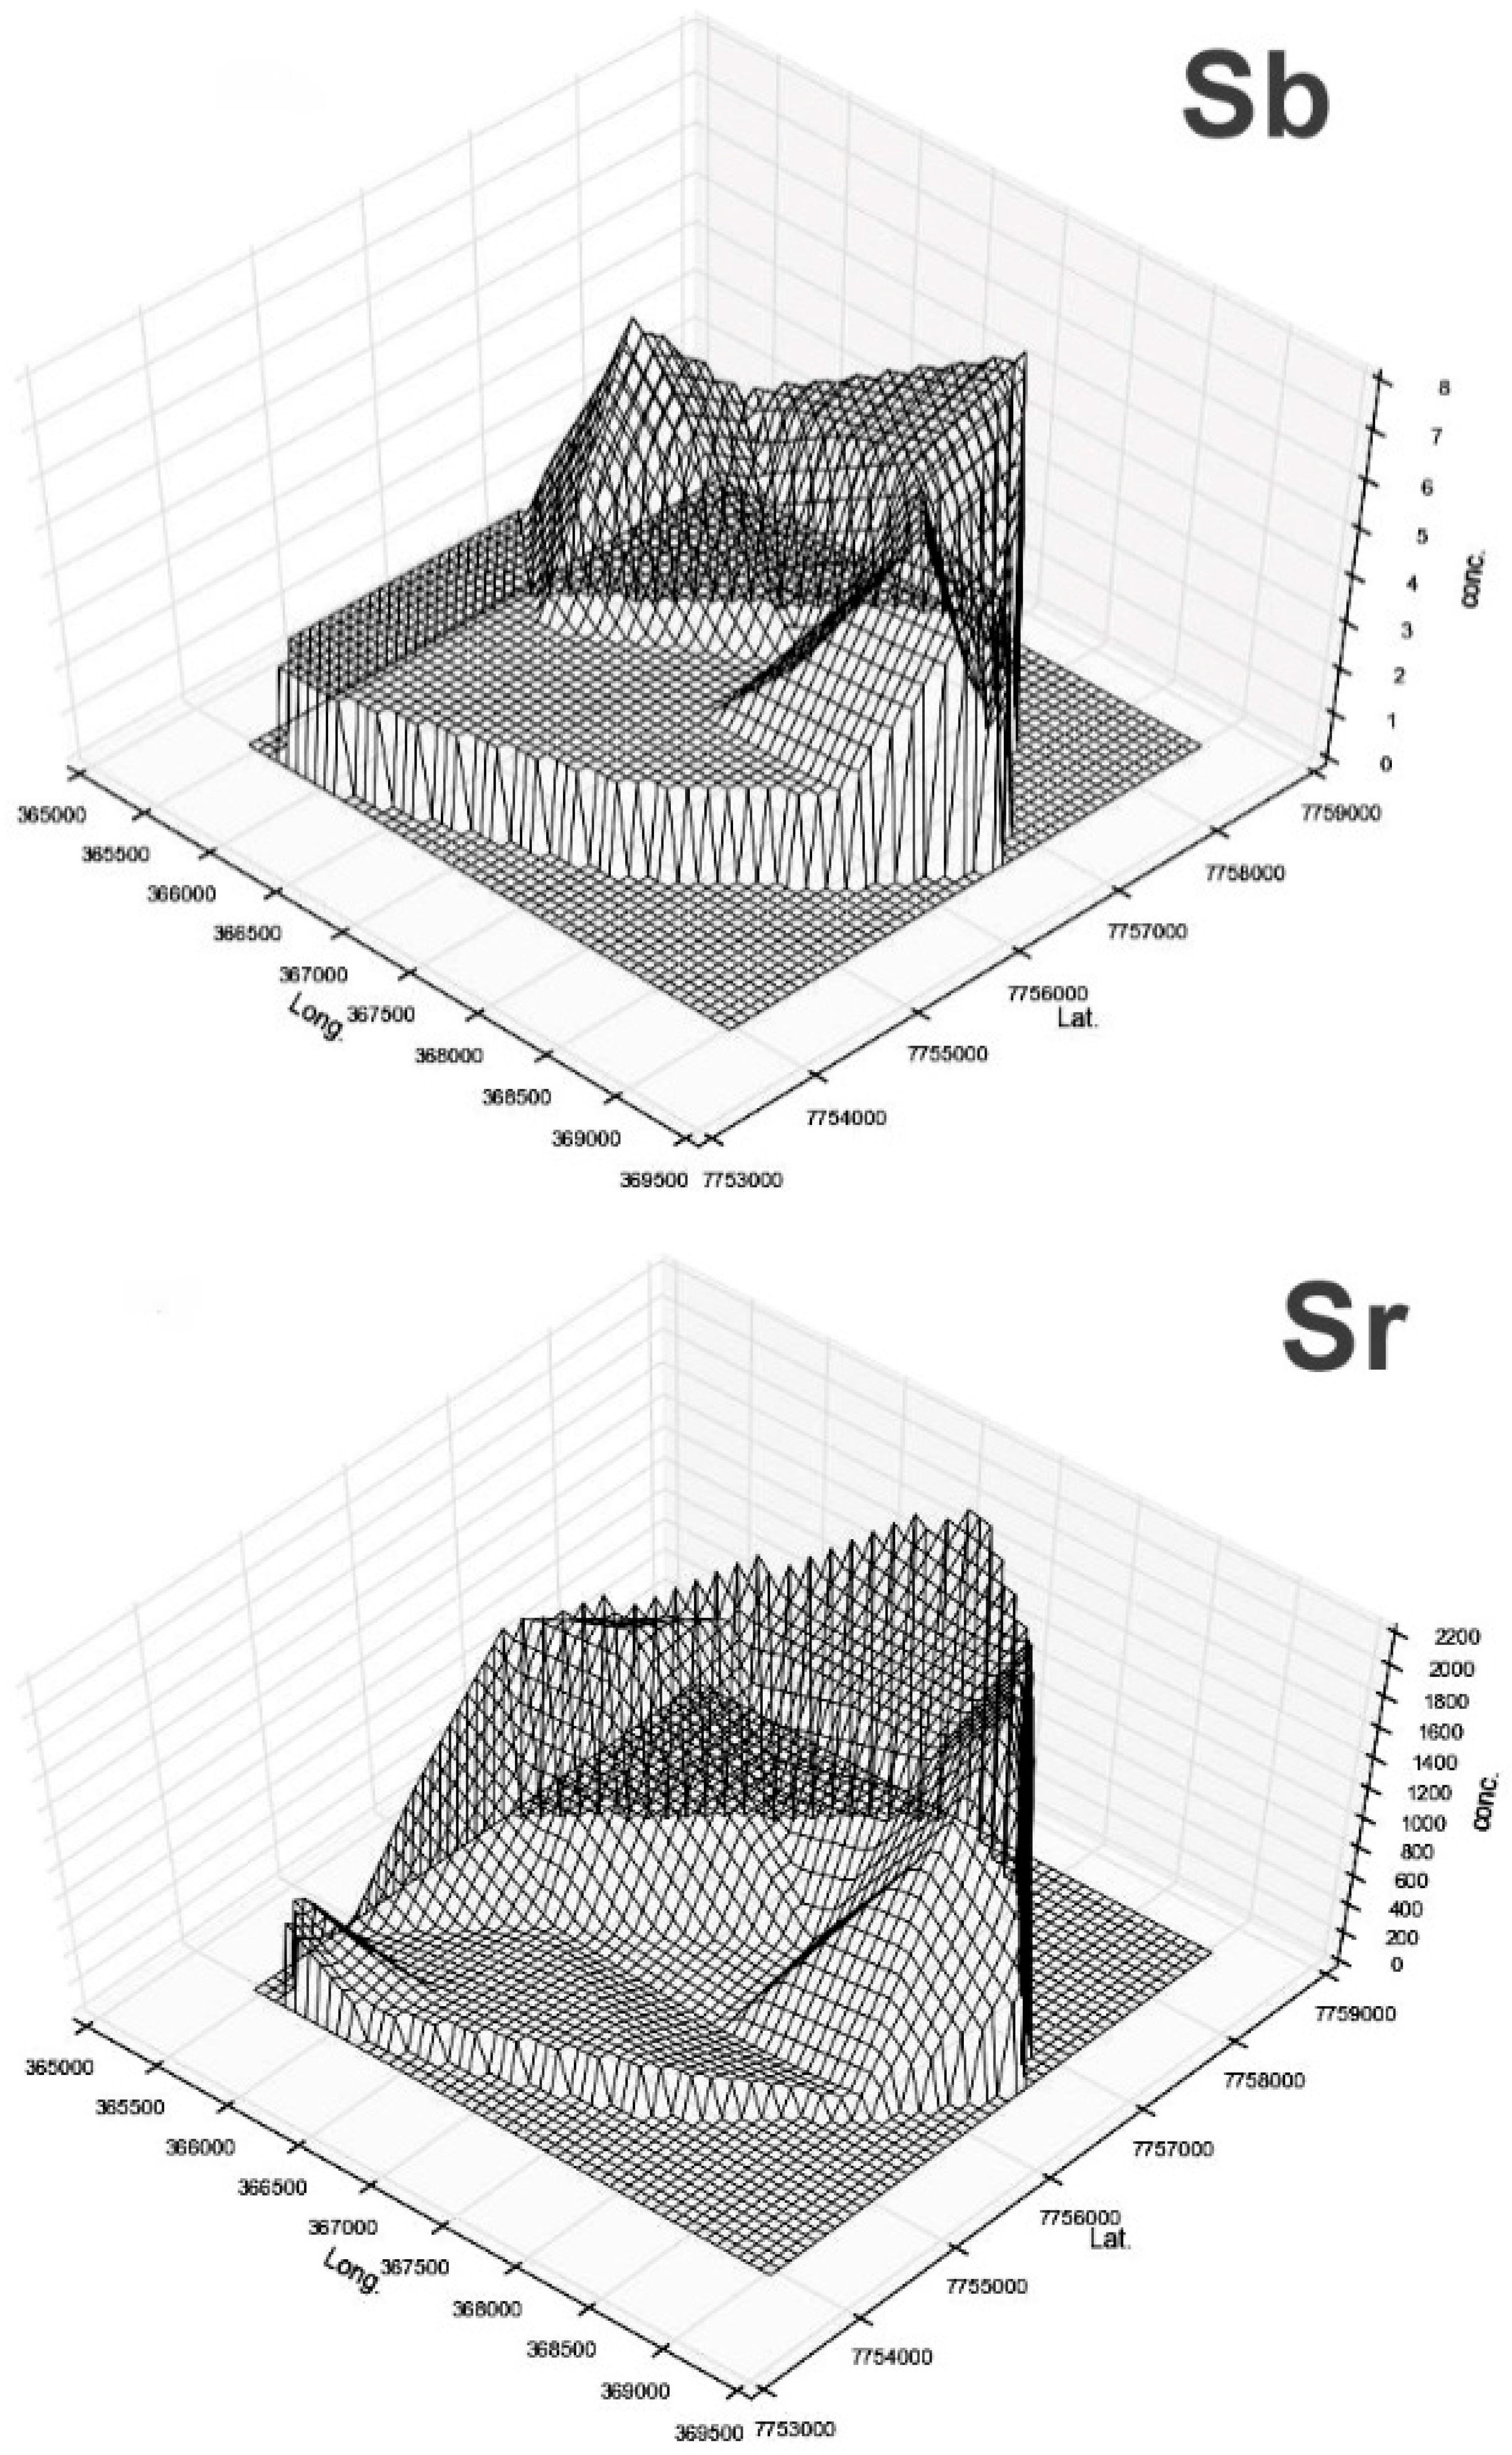
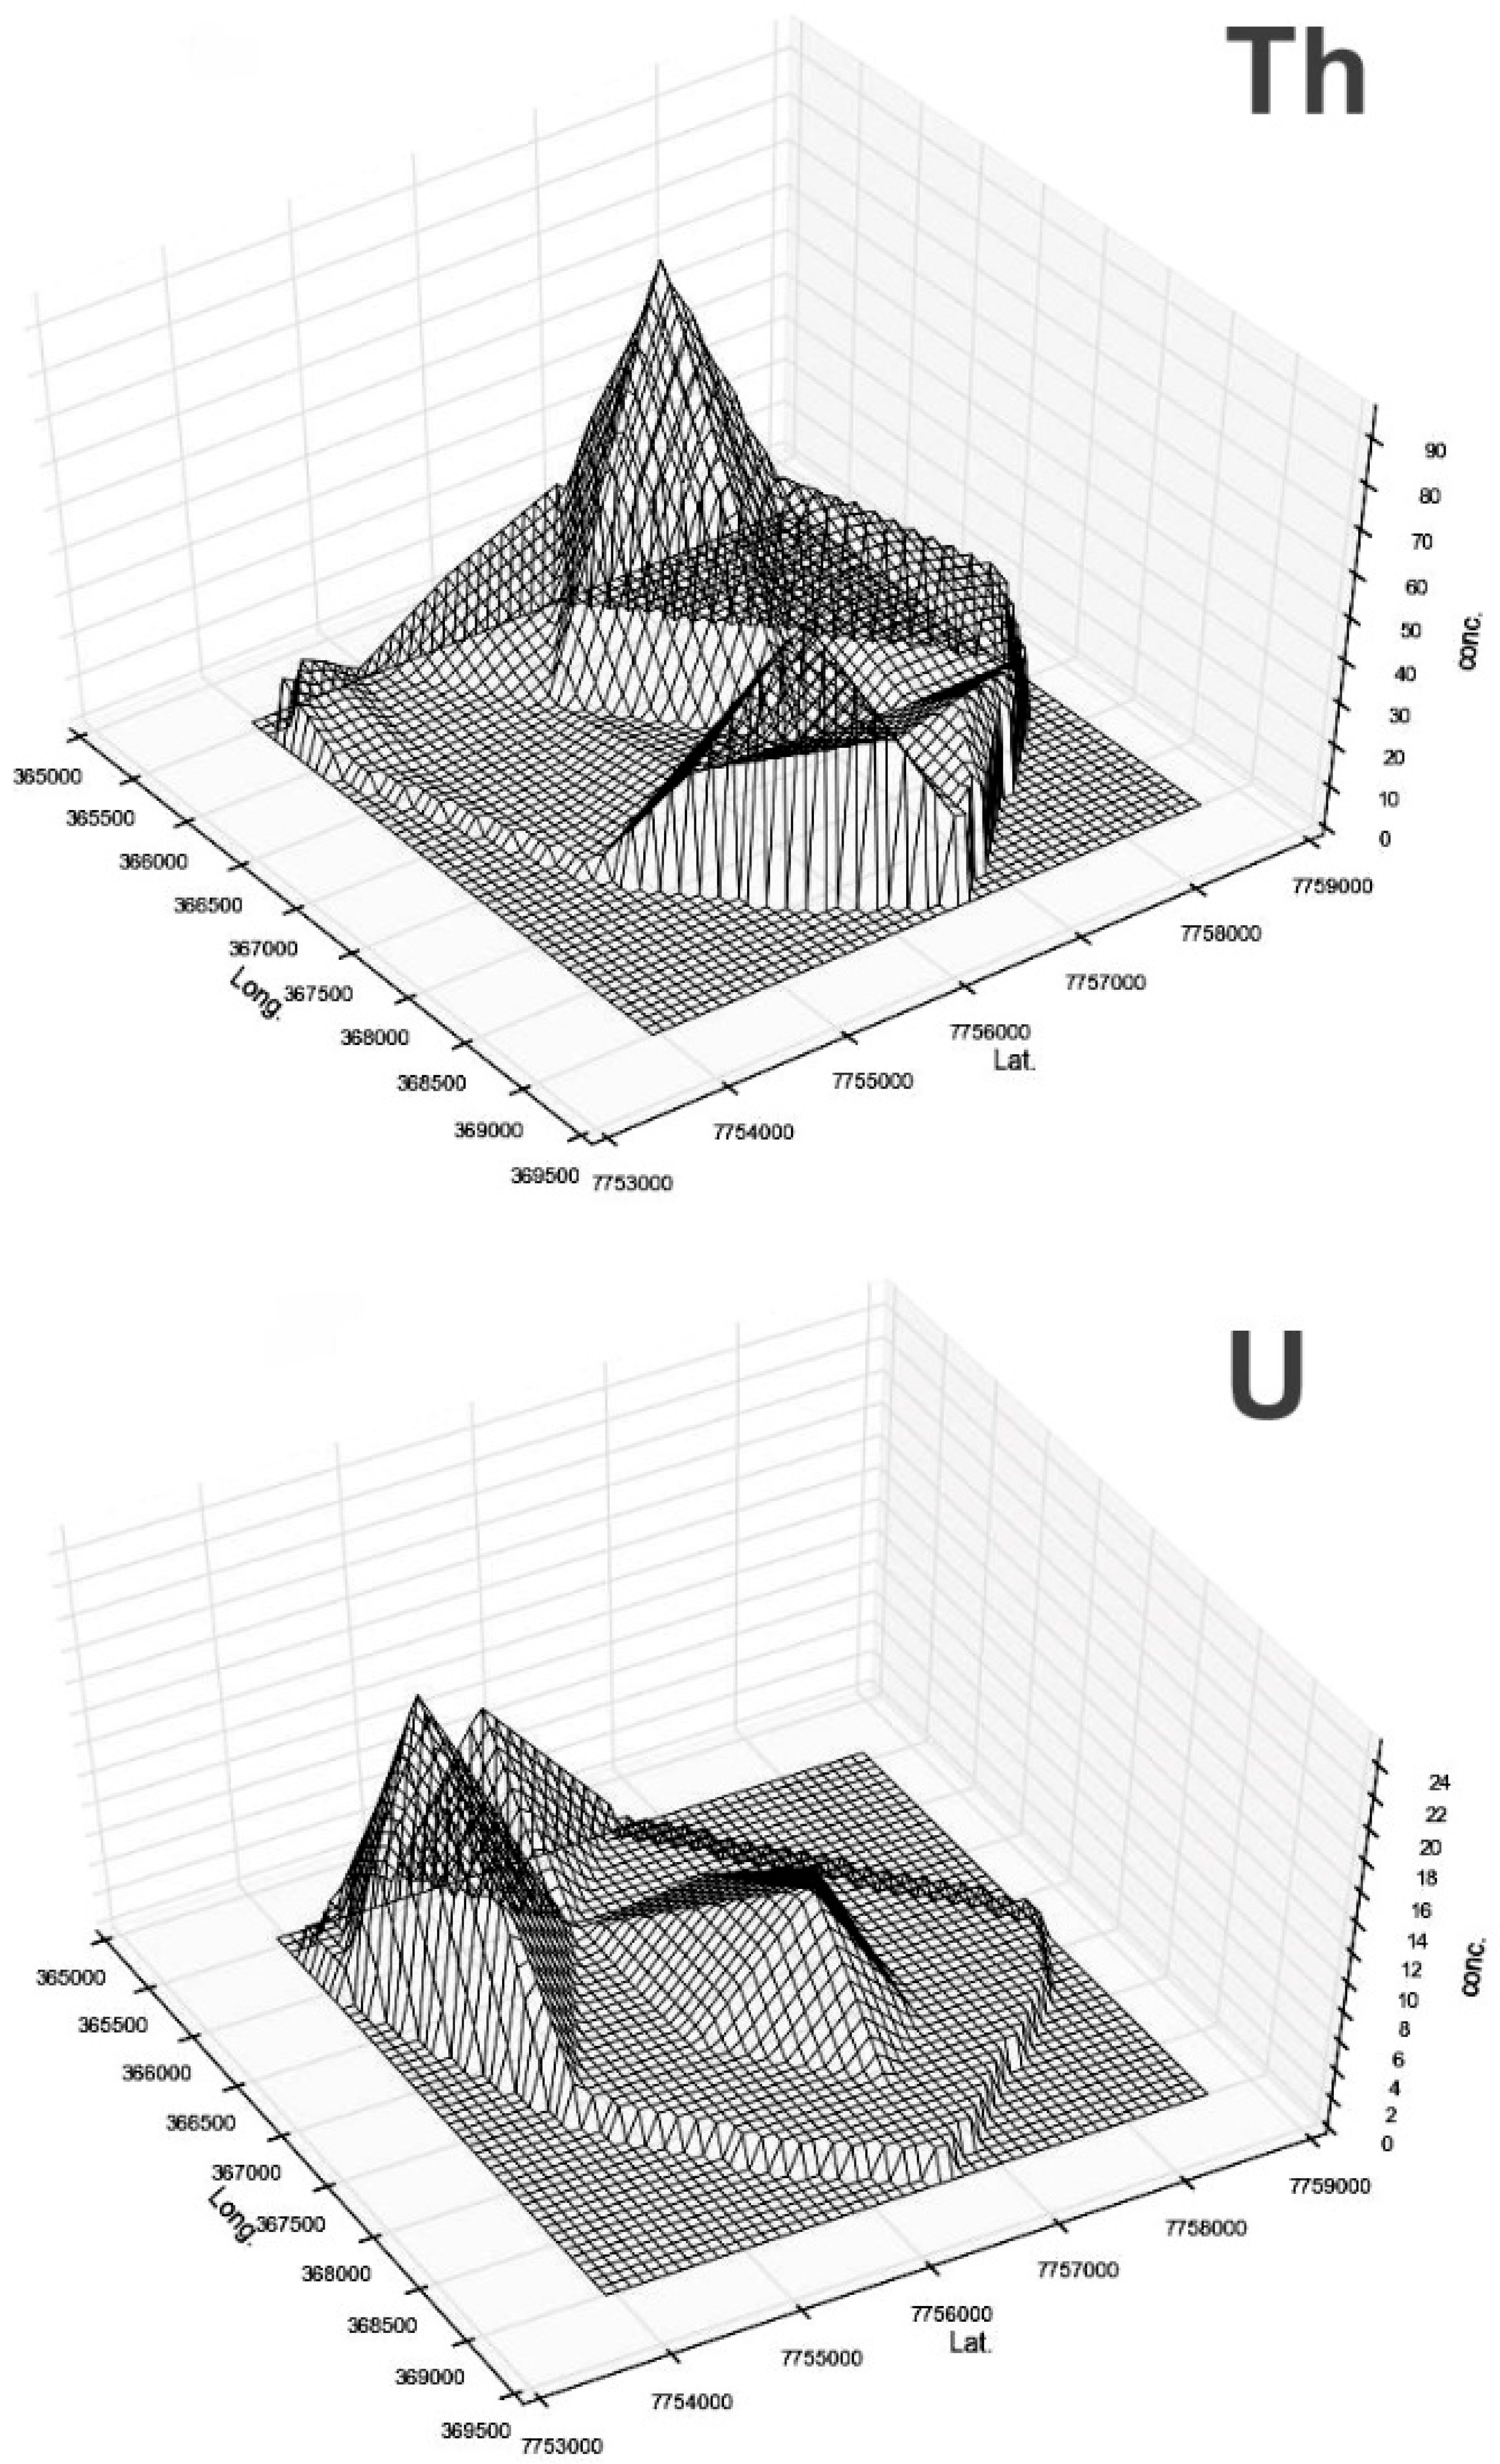
Tridimensional diagrams (
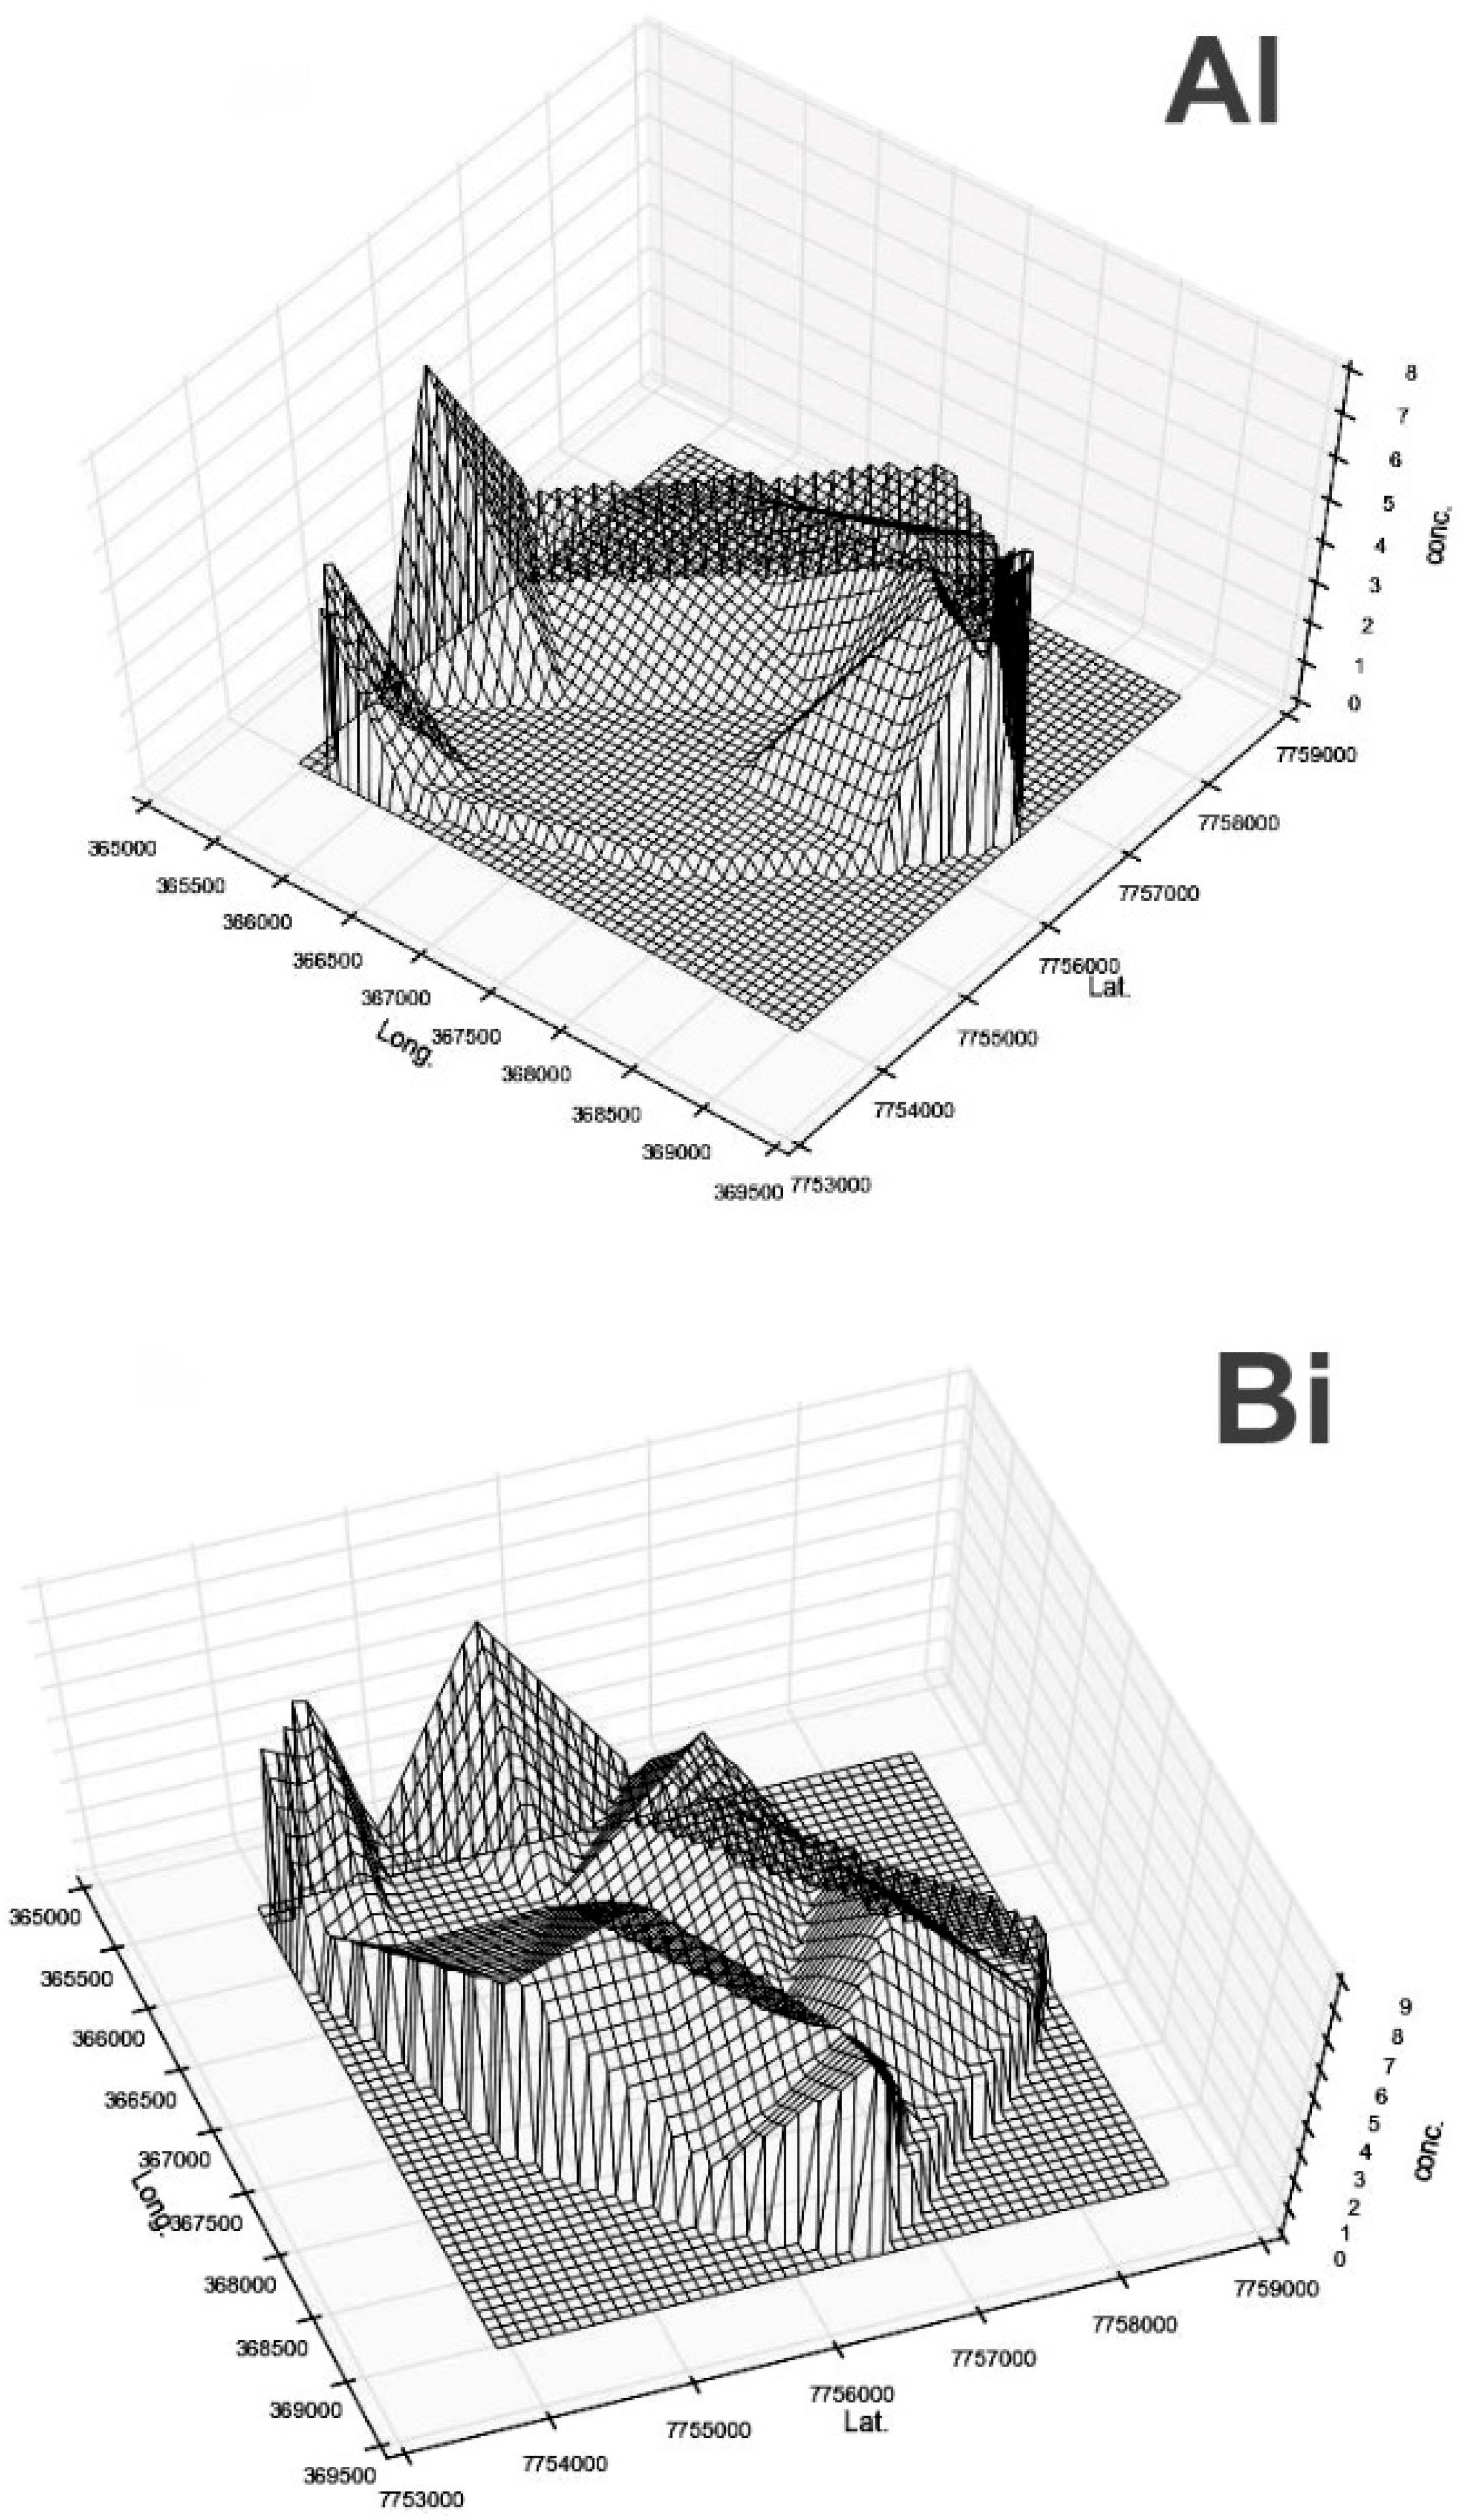
Figure 7) showed that the most relevant immissions concerned 10 out of the 17 elements: Silver, aluminum, bismuth, copper, lead, molybdenum, nickel, vanadium, uranium, and zinc. They seemed to come from the southwest (i.e., from the final portion of Vitória Bay and from Canal de Passagem).
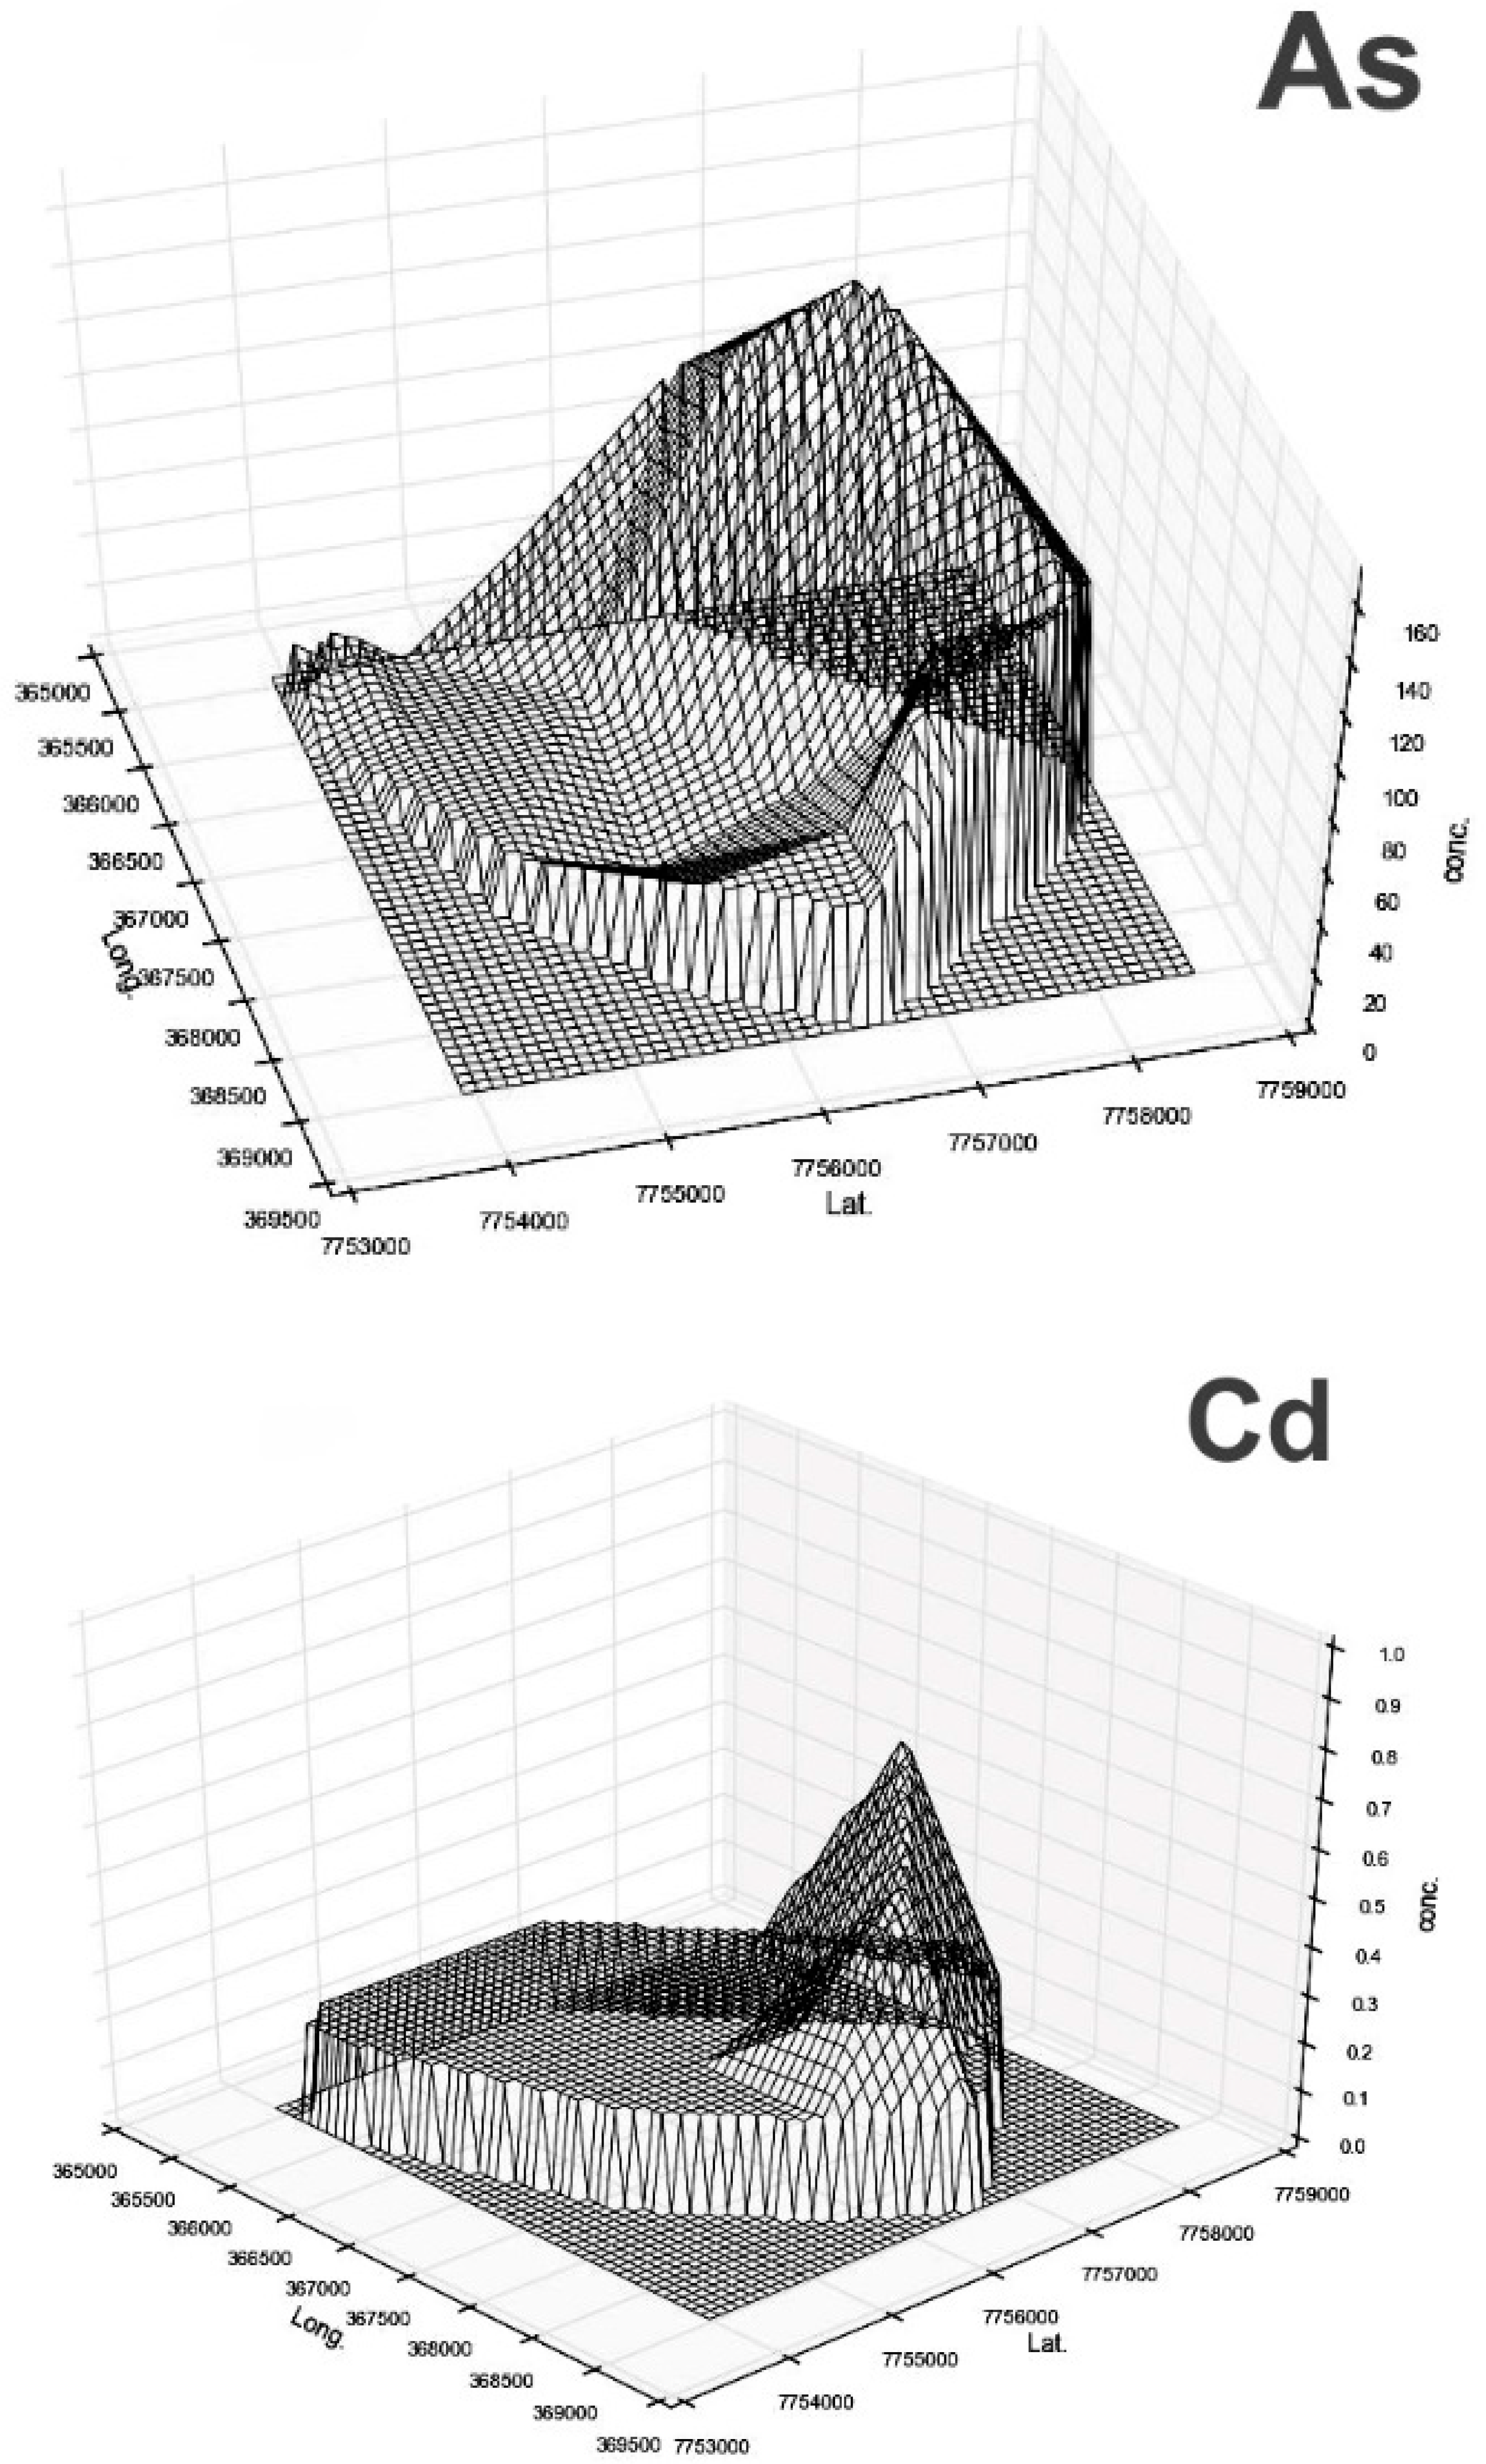
These were followed by the Camburì Beach (north) immissions, which concerned arsenic, cadmium, manganese, antimony, strontium, and vanadium. Finally, in the Tubarão harbor area (northeast), where several industries are located, it was possible to detect clear indications concerning the immission of cadmium, iron, nickel, antimony, vanadium, and zinc. Apparently, in several cases there were multiple streams with no clear predominance of one of them over the others. This could be observed in the cases of silver, aluminum, bismuth, lead, nickel, antimony, and zinc. In some cases, it seemed possible to spot a single immission point, such as, for example, for cadmium and thorium (northwest) or for molybdenum (southwest).
In more detail, silver showed three main peaks: The highest concentration (2.0 μg/g) corresponded to station VIT-4 (i.e., the γ region). A second peak (1.9 μg/g) could be detected at VIT-10, which was in the β zone, whereas in γ (VIT-7), the third highest peak (1.5 μg/g) could be found. All of these peaks appeared quite well separated by deep valleys. The opposite could be observed in the case of Al, where some peaks were interconnected. To be more precise, whereas the two peaks located on α (VIT-16, 4.2%) and β (VIT-15, 4.7%, and VIT-10, 7.3%, merged together) were clearly resolved, and vice versa from β to δ (VIT-2, 4.9%, and VIT-1a merged together) through γ (VIT-4, 4.6%), there was no solution of continuity of a smooth plateau, such as an amphitheater, that connected the β peak to a shallow hill present in δ. A similar “amphitheater shape” could be seen in the case of As, too, from α to δ: VIT-4 (65 μg/g), VIT-9 (98 μg/g), VIT-8 (135 μg/g), VIT-7 (164 μg/g), VIT-6 (73 μg/g), VIT-5 (97 μg/g), and VIT-3 (119 μg/g). This arch had the highest peak (VIT-7) on the γ/β area, whereas on δ there was a secondary peak (VIT-3). Also, Fe was characterized by an arch, this time connecting β with δ (VIT-8, 7.4%; VIT-7, 8.1%; VIT-5, 7.2%; VIT-4, 13%; VIT-3, 7.9%; VIT-2, 12%), with the highest peak in γ (VIT-4). On the other hand, in α (VIT-16, 3.8%), there was an isolated small peak. A similar isolated but very small peak in α was present in the case of Mn (VIT-16, 350 μg/g). Then, again, an amphitheater, this time of an almost constant height (in the range of VIT-9, 539 μg/g; VIT-7, 702 μg/g), interconnected β with δ, and therefore no highest peak clearly emerged from the ridge. A completely different situation could be noticed for Ni, where four sharply resolved peaks showed up inα (VIT-16, 16 μg/g), β (VIT-10, 27 μg/g), γ (VIT-4, 19 μg/g), and δ (VIT-2, 21 μg/g). Two main peaks well separated by deep valleys could be seen around α (VIT-16, 15μg/g) and β (VIT-15, 21 μg/g, and VIT-10, 38 μg/g) in the case of Pb. The arch connecting β with two other peaks located in δ (VIT-2, 23 μg/g, and VIT-3, 20 μg/g) showed its maximum in β (VIT-7, 28 μg/g). Sb displayed three peaks (VIT-8, 7 μg/g; VIT-5, 7 μg/g; VIT-2, 6 μg/g), none of which was clearly overwhelming the others, with β (VIT-8) and γ (VIT-5) well resolved, whereas the third peak, δ (VIT-2), was partially joined to γ by a ridge. A similar smooth look could be observed for vanadium. The peak located in α (VIT-16, 67 μg/g) was well separated from a mountain range, beginning in β (VIT-15, 79 μg/g) and ending in δ (VIT-2, 83μg g), and showed an apex in β (VIT-7, 144 μg/g), which represented the absolute maximum, and another peak in δ (VIT-3, 104 μg/g). The Zn profile was characterized by three peaks (VIT-16, 62 μg/g; VIT-10, 133 μg/g; VIT-2, 84 μg/g). The peaks present in α and β were deeply separated by a valley, whereas an arch connected the maximum located in β (VIT-10) with δ. In the same VIT-10 station, Bi showed its maximum as well (8 μg/g), but many more peaks were present: One in α (VIT-16, 6 μg/g), two in β (VIT-10 and VIT-8, 6 μg/g), and another in γ (VIT-4, 7 μg/g), all of them well resolved. A ridge partially joined γ with δ (VIT-1a, 7 μg/g), whose peak was, at least in part, merged with a peak centered around station VIT-13 (7 μg/g). This last one was clearly separated from α, β, and γ. It should be underscored that station VIT-13 was in the very middle of Espírito Santo Bay, which made Bi (along with uranium) a sharp exception with respect to all other elements taken into consideration in the present paper, where the center of Espírito Santo Bay was normally unpolluted. A completely different situation could be seen in the case of Cd, which looked rather flat. The only peak present, which was actually located in γ/δ (VIT-4, 0.8 μg/g), decayed smoothly to δ but sharply to γ. Four peaks characterized Cu, a small one in α (VIT-16, 9 μg/g) that was well resolved with respect to the maximum in β (27 μg/g in VIT-10), another in γ/δ (VIT-4, 11 μg/g) that was totally separated from the former, and the last one in δ (VIT-1a, 18 μg/g), which was partially joined to VIT-4. A really solitary peak (VIT-15) distinguished Mo from all other elements discussed here. Moreover, this peak, located in α/β, was rather low (4 μg/g) with respect to the background (2 μg/g). Vice versa, Sr displayed very high concentrations and five peaks: A little hill in α (VIT-16, 585 μg/g), a very high concentration in the two merged peaks located in β (VIT-8, 1615 μg/g, and VIT-7, 1477 μg/g) and in the maximum centered in γ (VIT-6, 2145 μg/g), and the fourth and fifth peaks, present in δ (VIT-3, 2045 μg/g, and VIT-2, 1342μg/g). Thorium had a hill and two sharply separated peaks (VIT-16, 15 μg/g; VIT-8, 93 μg/g; VIT-1a, 68 μg/g). The main peak was in β (VIT-8), whereas the secondary one was in δ (VIT-1a). Despite being clearly separated, at the same time they were interconnected by a low ridge that showed a partial depression in γ. The small, but well resolved, hill present in α (VIT-16) seemed almost stretched out from β. Finally, uranium was characterized by three well-resolved peaks (VIT-14, 21 μg/g; VIT-10, 12 μg/g; VIT-3b, 10 μg/g). The main peak (VIT-14) was located in α, whereas the secondary one was in β (VIT-10). Similarly to what was seen in the case of Bi, there was an “anomalous peak” in the middle of Espírito Santo Bay, specifically in the VIT-3b station.
Obviously, the aforementioned discussion was necessarily limited by the approximation of the graphic elaboration and by the relatively limited number of sampling stations chosen to adequately depict the different typology of sediments. However, an analysis of the sediment typology would nicely explain why the center of each 3D diagram looked almost always (with the exception of Bi and U) flat and homogeneous (i.e., the RING B plateau). Most probably, this could have been due to the prevailing sandy component of the sediment: Sand would bind metal ions much less efficiently thanthe organic component of the sediment [23], which characterized RING A. In addition, at the state of the art, apart from some coarse resemblance (which might have been due to chance), it seemed that there was no similarity in the spatial distribution of the studied elements, so that each of them looked unique. Further study would be necessary to address this point.

5. Conclusions

The goal of this study was not to identify sources or movements of pollutants in the bay, but to investigate the heavy metal pollution status of the Espírito Santo Bay, where heavy metal concentration maps over the area were presented and the concentrations were compared to benchmark values.
On the basis of the aforementioned data reported in the diagrams, it seems possible to conclude that the bay of Espírito Santo presents only a modest contamination level (i.e., below TEL, where this benchmark is defined), due to the elements here analyzed, with some critical values for arsenic, manganese, and vanadium. Particularly, such criticity could be detected in those areas close to the coast. This may have been due to the fact that sediment composition near the coast is such that it allows the pollutants to be bound more tightly to the sediment because of the presence of organic substances such as humic acids or because of the presence of clays that fix the ions to the sediment [23]. On the other hand, some elements, such as arsenic (see Figure 6 and Figure 7) and barium (reported in Figure 6), showed surprisingly high concentrations thatare difficult to explain, especially when taking into account their possible and probable origin, as wasdiscussed above.
According to our understanding, a correct evaluation of the presence of such elements (with the purpose of identifying and then eliminating the possible pollution sources) appears necessary to complete the research. Because it cannot be ruled out that there might be other unknown sources of pollutants as well as hidden sediment movements within the bay, this will spur us to investigate further with new research that will confirm or deny our hypotheses. This will include an appropiate analysis of the ecosystem dynamics, particularly with respect to the bay marine currents, which could transport the pollutants in a different way with respect to those evaluated by the simple model of linear diffusion from potential sources. These results will be used in the frame of the TAGUBAR project. In fact, the MFA/DGCS and the government of Brazil have decided to perform specific parallel research to check the methodology already applied to the Rio de Janeiro Bay with two other different tropical environments and then compare the results obtained. Vitória Bay and Espírito Santo Bay were selected to be used for such a comparison. The results showed that in contrast to the Vitória and Espírito Santo bays, Guanabara Bay suffered higher pollution levels.

Author Contributions

G.P. had the original idea for the study. M.B. was responsible for data collection and data analysis. A.G. drafted the manuscript, and G.P. reviewed it.

Funding

This research received no external funding.

Acknowledgments

We thank the Ministry of Foreign Affairs of Italy, General Direction of the Cooperation to Development (MAE-DGCS), for founding the present research. We also gratefully thank the IUCN Main Office, Geneve, Almeida Paola, Barroso SantarosaMarcio, Brioschi Leonardo Mathias, Correa Leone Gabriel, Cunha NalessoRosebel, DaiapiculaBravimAndreia, Dias Camilo, Jr., Fernandes Fernando, Fonseca Barroso Gilberto, Guillet Alfredo, Kramer Taciana, Loureiro Luiz, Mao Andrea, Oliver James, Paresque Karla, Rocha Schaeffer Lislane, Santarosa Gilberto, Testa Viviane, Vargas Andressa, VerçosaCarvalheira Lucia, Veronez Paulo, Jr.

Conflicts of Interest

The authors declare no conflicts of interest.

References

  1. Lucas, P.S. Influencia de uma Estação de Tratamento de Esgoto Sobre um Sub-Sistema Estuarino (Canal da Passagem, Vitoria, E.S.): Comunidade Fitoplancton ica e Nutrientes. Ph.D. Thesis, Dissertacão de mestradoao Centre de Biotiencias e Biotecnologia da Universidade Estadual do Norte Fluminense, Porto, Portugal, 2002. [Google Scholar]
  2. Haekel, W.; Schroeder, F.; Felsen, V.; Luca Rebello, A.; Moreira, I.; Santelli, R. Cd, Pb, Cu, Cr and Hg in Waters and Sediments of the Guanabara Bay Estuary; GKSS 85/E/21; GKSS-Forschungszentrum Geesthacht GmbH Geesthacht: Geesthacht, Germany, 1985. [Google Scholar]
  3. Luca Rebello, A.; Haerkel, W.; Moreira, I.; Santelli, R.; Schroeder, F. The fate of heavy metals in an estuarine tropical system. Mar. Chem. 1986, 18, 215–225. [Google Scholar] [CrossRef]
  4. Cardoso, G.; Braga, C.; Carvalho, L. Hydrogeological study of mangrove areas around Guanabara Bay, Rio de Janeiro, Brazil. Anuario Inst. Geociencias-UFRJ 2003, 26, 92–100. [Google Scholar]
  5. Carmo, T.M.S. Os Manguezaisao Norte da Baía de Vitória, Espírito Santo; Simpósio sobre Ecossistemas da Costa Sul e Sudeste Brasileira, Cananéia–SP: Cananéia, Brazil, 1987; Volume 1. [Google Scholar]
  6. Jesus, H.C.; Costa, E.A.; Mendonca, A.S.F.; Zandonade, E. Distribução de metaispesados em sedimentos do sistema estuarino da llha de Vitoria-ES. Quim. Nova 2004, 27, 378–386. [Google Scholar] [CrossRef]
  7. Saraiva, E.M. Avaliação da Contaminação por Metais Pesados (Cd, Cr, Cu, Fe, Ni, Pb E Zn) No Manguezal do Rio Santa Maria de Vitória–GrandeVitória/Es, Utilizando Crassostrea Rhizophorae (Guildeins, 1828) E Mytella Guyanensis (Lamarck, 1819) Como Bioindicadores. Master’s Thesis, Departamento de Biologia, Universidade Federal do Espírito Santo, Espírito Santo, Brazil, 2002. [Google Scholar]
  8. Joyeux, J.-C.; CampanhaFilho, E.A.; Jesus, H.C. Trace metal contamination in estuarine fishes from Vitória Bay, ES, Brazil. Braz. Arch. Biol. Technol. 2004, 47, 765–774. [Google Scholar] [CrossRef] [Green Version]
  9. Jesus, H.C.; Anjos, E.E.; Fernandes, L.F.L.; Zandonade, E. Avaliação da Contaminação por Metais Pesadosem Caranguejos e Sedimentos de Áreas de Manguezal do Sistema Estuarino de Vitória–ES; Relatório Técnico-Projeto Facitec/PMV-ES; PMV-ES: Vitória, Brazil, 2003. [Google Scholar]
  10. Castro, M.S.M. Análise da Influência das Águas do Canal da Passagem Sobre o Padrão de Escoamento na Baía do Espírito Santo. Master’s Thesis, Dissertação (Mestrado em Engenharia Ambiental), Programa de Pós-Graduação em Engenharia Ambiental, Universidade Federal do Espírito Santo, Vitória, Brazil, 2001. [Google Scholar]
  11. Rigo, D. Análise do Escoamentoem Regiões Estuarinas com Manguezais–Medições e Modelagemnabaía de Vitória. Ph.D. Thesis, Tese de Doutorado em Ciênciasem Engenharia Oceânica, Programa de Pós-Graduação em Engenharia, São Paulo, Brazil, 2004. [Google Scholar]
  12. Barcellos, C.; Lacerda, L.; Ceradini, S. Sediment origin and budget in Sepeteiba Bay (Brazil)-an approach based on multielemental analysis. Environ. Geol. 1996, 32, 203–209. [Google Scholar] [CrossRef]
  13. Grobberio Franchini Silva, L.J. Modelagem da Hidrodinâmica do Canal da Passagem (Vitória/ES) Utilizando um Modelo 2DH com Mecanismo de Alagamento/Secamento de Planícies de Maré; Monografia Apresentada ao Departamento de Oceanografia e Ecologia da Universidade Federal do Espírito Santo: Espírito Santo, Brazil, 2010. [Google Scholar]
  14. Perin, G.; Fabris, R.; Manente, S.; Rebello Wagener, A.; Hamacher, C.; Scotto, S. A five years study on the heavy metal pollution of the sediments of Guanabara Bay (Rio de Jaeiro/Brazil) and evaluation of the metal bioavailability by means of geochemical speciation. Water Res. 1997, 31, 3017–3028. [Google Scholar] [CrossRef]
  15. Perin, G.; Bonardi, M.; Fabris, R.; Simoncini, B.; Manente, S.; Tosi, L.; Scotto, S. Heavy Metal pollution in central Venice lagoon bottom sediments: Evaluation of the metal bioavailability by geochemical speciation procedure. Environ. Technol. 1997, 18, 593–604. [Google Scholar] [CrossRef]
  16. Perin, G.; Giacometti, A. Short Historical Review of Metal Speciation and Distribution of Five Selected Metals in Adriatic Sea Sediments. Ecol. Environ. Conserv. 2013, 19, 615–625. [Google Scholar]
  17. Perin, G.; Giacometti, A. Vitoria Bay pollution study in the frame of Tagubar research project-preliminary biosystemic approach. Ecol. Environ. Conserv. 2017, 23, 524–535. [Google Scholar]
  18. Bonardi, M.; Tosi, L. Image analysis: A tool for sedimentological investigations. Microsc. Anal. 1995, 1, 37–39. [Google Scholar]
  19. Sediment Benchmarks for Aquatic Life; EPA: Washington, DC, USA, 2011.
  20. Sediment Quality Guidelines Developed for the National Status and Trends Program; NOAA: Silver Spring, MD, USA, 1999.
  21. Buchman, M.F. NOAA Quick Screening Reference Tables; NOAA OR&R Report 08-1; Office of Response and Restoration Division: Seattle, WA, USA, 2008.
  22. Persaud, D.; Jaagumagi, R.; Hayton, A. Guidelines for the Protection and Management of Aquatic Sediment Quality in Ontario; Ontario, Ministry of Environment and Energy: Toronto, ON, Canada, January 1996.
  23. Long, E.R.; Morgan, L.G. The Potential for Biological Effects of Sediment-Sorbed Contaminants Tested in the National Status and Trends Program; NOAA Technical Memorandum NOS OMA 52; National Oceanic and Atmospheric Administration: Seattle, WA, USA, 1990.
Figure 1. Espírito Santo Bay.
Environments 05 00139 g001
Figure 2. Detailed maps of the study area: (a) the physical map shows urban and industrial areas, while (b) details of the different water bodies are reported.
Environments 05 00139 g002
Figure 3. Storage of sediment samples depended on the type of analysis to be performed later on.
Environments 05 00139 g003
Figure 4. Sediments sampled from different stations: (a) Mud, which constituted the bottom part of the sample, looked black, whereas (b) the clearer sand stayed on the top.
Environments 05 00139 g004
Figure 5. Location of the sediment sampling stations in Espírito Santo Bay (Municipio de Vitória, ES). Numbers within the arrows refer to the sampling station numbering. Arrows are oriented in a northern direction. Sampling stations are located at the top of each arrow.
Environments 05 00139 g005
Figure 6. Silver, aluminum, arsenic, barium, chromium, iron, manganese, nickel, lead, antimony, vanadium, and zinc distributions compared to the benchmark values Threshold effects levels (TELs), effects range low (ERL), probable effects levels (PELs), effects range median (ERM), and apparent effects thresholds (AETs), while stations are named “VIT-“, after “Vitória”.
Environments 05 00139 g006aEnvironments 05 00139 g006bEnvironments 05 00139 g006cEnvironments 05 00139 g006d
Figure 7. 3D diagrams of Ag, Al, Bi, As, Cd, Cu, Fe, Pb, Mn, Mo, Ni, Sb, Sr, Th, U, V, and Zn distribution in Espírito Santo Bay diagrams oriented after the bay map (see top-left).
Environments 05 00139 g007aEnvironments 05 00139 g007bEnvironments 05 00139 g007cEnvironments 05 00139 g007dEnvironments 05 00139 g007eEnvironments 05 00139 g007fEnvironments 05 00139 g007gEnvironments 05 00139 g007hEnvironments 05 00139 g007i

