1. Introduction
Noise exposure in large urban areas is one of the most important issues for modern society. In this regard, the European Community set the priority objectives by 2020 [
1] to pursue protection against noise, as specified in the EU Directive 2002/49/EC [
2] and in the General Union Environment Action Programme to 2020.
Direct exposure to high levels of noise can increase the incidence of heart attacks or of diseases such as depression or hypertension [
3]. The direct or indirect effects of constant exposure to relatively low noise levels are yet not completely defined, even though the scientific community is researching it.
Environmental noise is generally addressed in terms of noise exposure, referred to the quantity of sound energy perceived. A different approach considers the study of noise not only from a quantitative point of view, but also from a qualitative one through soundwalks performed in order to study the soundscape, i.e., the “acoustic environment as perceived by people in context” [
4]. A soundwalk is a method to analyze soundscapes consisting of a particular walk inside a specific environment with a microphone recording the sounds. The soundwalks have been recognized as a sociological methodology for identifying and understanding people’s experiences and soundscape [
5], whose assessment allows the evaluation of the relationship between overall, visual and auditory qualities of the environments [
6]. The analysis of the soundscape is a good method to identify quiet urban areas, where people can easily escape the daily stress typical of modern living. The accessibility of natural surroundings has been linked to the benefits of redressing the effects of sensory overload, to wellbeing and to the improvement in recovering rates from illness [
7].
Landscape and external factors affect soundscape and quiet areas, whose protection has been underlined in some studies [
8,
9,
10,
11]. A study demonstrated that soundwalk participants expected to associate a particular soundscape to a particular activity (e.g., relax) and also to obtain certain information within it. This suggested that expectations of soundscape are based on previous experiences in the particular space [
12]. Also the presence of natural sounds, e.g., animals, has a positive feedback for acoustic comfort [
13]. Moreover, an audio input in a mixed audio-visual assessment of environmental representations has a stronger influence than a visual input, as demonstrated with laboratory tests and confirmed by several cases where different sound level values were responsible for the same comfort assessment [
14]. The auditory-visual interaction is also important in the construction of tranquil spaces. Indeed, the soundscape assessment is affected by the essential relationship between audible and visual aspects. Sometimes the perceived visual quality of the environments is more important than perceived auditory quality in the overall assessments [
15]. As a consequence, some studies were focused on the type of sounds that influenced the perceived tranquillity, which is the quality or state of being tranquil, calm, serene, and worry-free [
16,
17]. Adding human sounds seriously degrades the perceived tranquillity [
18]. This happens especially in parks, where human noises influence the eventfulness of perception of the acoustic environment [
19] that is also closely correlated with the aesthetic quality, simplicity and sense of landscape’s enclosure [
20].
Different techniques are used in the studies that investigate soundscapes. Among them, it is possible to list qualitative interviews, rating scales, in situ questionnaires and in-laboratory playback of the field recordings [
12]. To identify tranquil environments, Watts implemented the predicted tranquillity rating (TR), a method based on noise maps, spot readings, noise prediction software and a photographic survey of the natural percentage and contextual features [
21,
22,
23]. A combination of soundwalks, semi-structured interviews, focus groups and a soundscape simulator has been used by Bruce and Davies in order to evaluate the effects of expectation on the perception of the acoustic environment. The authors found that participants’ soundscape, both real and simulated, were affected by expectation in several different ways [
24,
25]. A different method has been used by Preis [
14], who based his study on different approaches in laboratory, presenting four different conditions to the participants: audio samples only, original audio-visual samples, video samples only and mixed audio-visual samples. The general results of this experiment showed a significant difference between the investigated conditions, with a stronger influence of audio respect to the video. Another widely accepted method is the Jeon and Hong one [
26], where the questionnaires are combined with acoustic measurements and GIS techniques to assess the perceptual and physical acoustic environments in various urban settings. Even the European Commission proposed surveys as a method to assess how the citizens perceive the quality of life in their home cities [
27]. Among 79 European cities, in 51 more than 30% of respondents were not satisfied with the noise level, while in 17 cities most of the respondents were dissatisfied. Another study combined the use of noise measurement with the results of some surveys, previously analyzed with a logistic regression model [
28].
A combination of noise measurement and surveys has also been used in the study preliminary to the present one, where the authors approached the quiet areas in the municipality of Pisa [
29]. The study focused on the proposal of a possible measuring instrumentation to be used during a soundwalk. The results showed how the use of a handheld system with binaural headphones improved post-processing analysis of the recorded soundwalks. A type of survey has been proposed to complete this approach and to provide an initial evaluation of the perception of the people in the investigated areas.
The present paper suggests a more accurate questionnaire to assess the different kind of soundscapes in urban environments. In a different way from other studies, the study is especially focused on questionnaires and on the analysis of their results. For this reason, a large number of participants, 614 people, were interviewed in order to see how the acoustic environment is perceived by the individuals and to propose a method based on the perception of tranquillity for the detection of quiet areas within urban ones. The aim of the work is to identify and quantify the effects of the parameters influencing the perception of tranquillity. This could lead to the development of a linear model able to predict the tranquillity perceived in different environments, based on their visual and acoustic characteristics.
Given the time needed and the complexity of in field interviews, a different approach has been searched and tested. Thus, video and audio recordings have been shown in laboratory conditions to 47 people, who answered to questionnaires in a similar fashion to in-field people. Comparisons between the results of the two different methods are shown.
2. Materials and Methods
The study is based on a survey related to acoustic and visual perception of users of urban areas, and took place in the Italian municipality of Pisa, a city highly disturbed by airport [
30,
31] and railway noise [
32], beside the common road traffic noise. The users were interviewed by a single operator inside the areas, using the direct approach of a standardized questionnaire and oral questions.
2.1. Surveyed Areas and Interviews
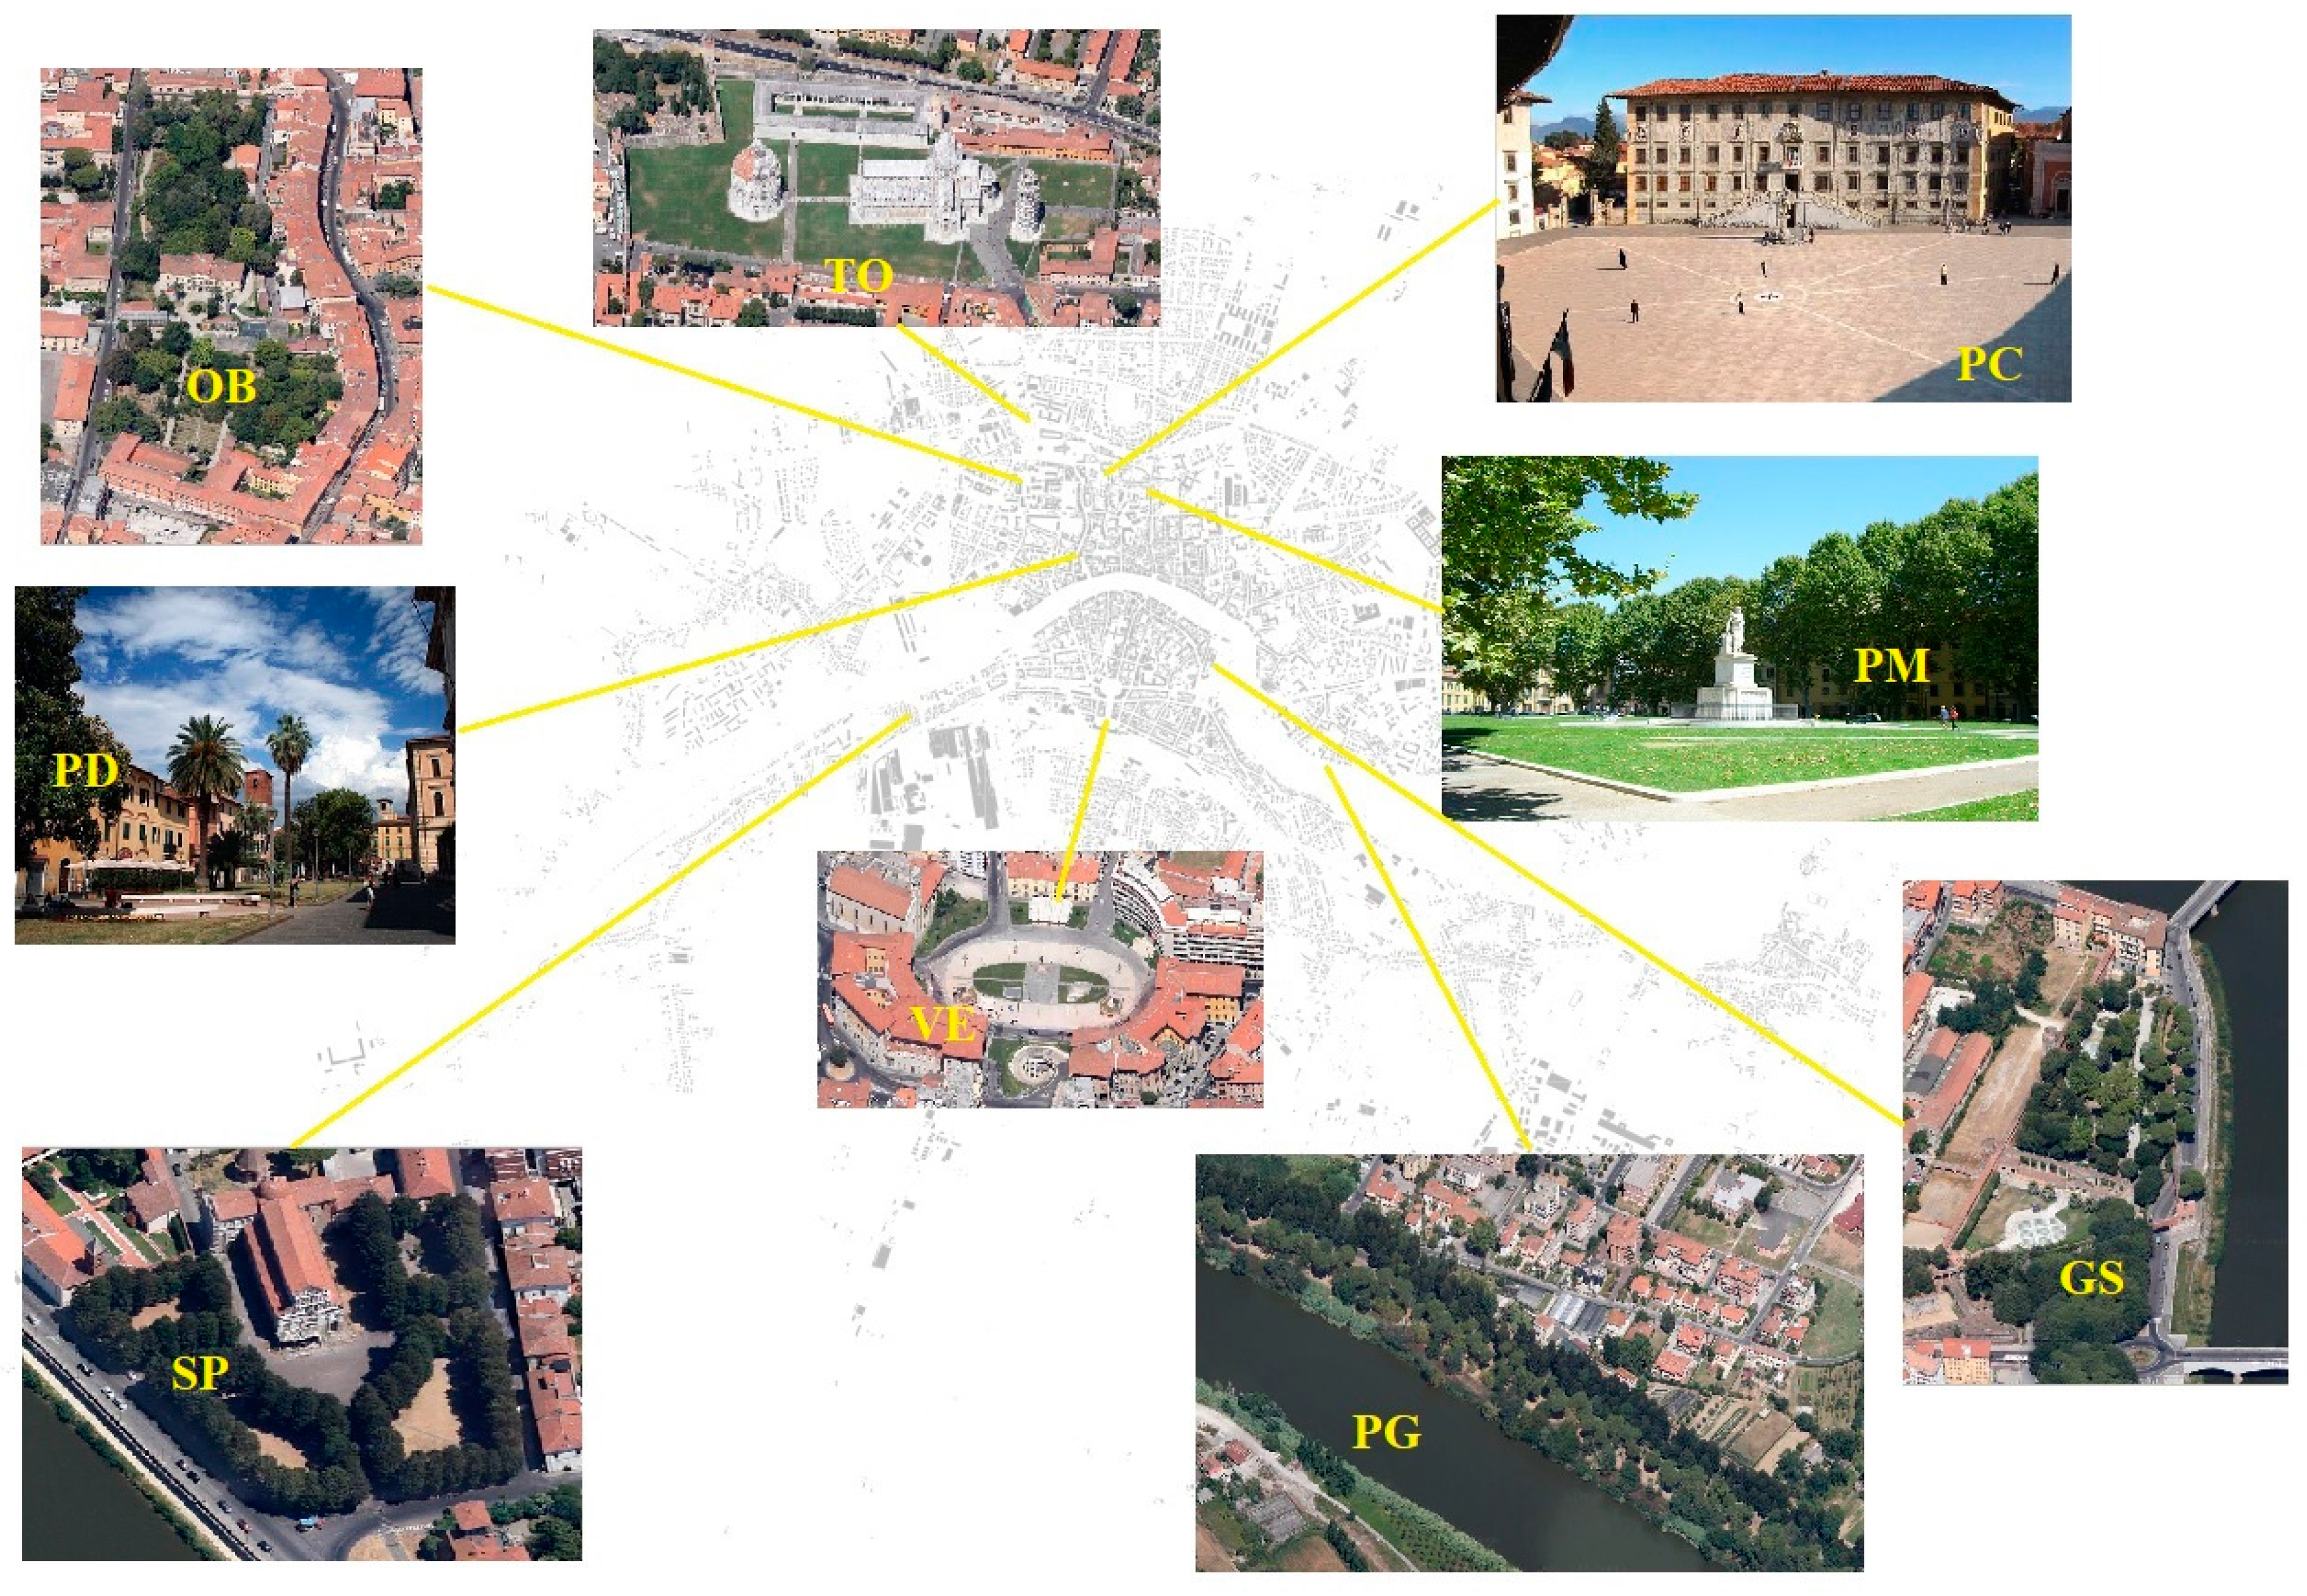
In order to assess different urban zones types, a total of nine areas were identified within the borders of the City of Pisa. Six of them are far from major roads and have natural and/or historical settings, therefore they are eligible quiet areas according to the Directive 2002/49/EC.
A total of 22 interview sessions were performed, divided into three field campaigns over a total period of approximately one year:
- (i)
one autumn campaign between September and October 2011;
- (ii)
one winter campaign from January to February 2012;
- (iii)
one spring campaign between April and May 2012.
Summer was excluded due to the low citizens present in town in this period. The data availability for different seasons and different environmental conditions involved the investigation of weather elements such as air temperature, wind, cloud coverage and drizzle, factors that can influence the perception of the area.
Each survey session lasted approximately 4 h, gathering at least 25 valid questionnaires. A longer session duration would have caused the environmental conditions to change between the first and the last questionnaire.
The interviewed people were randomly selected among users of the nine areas; they were all volunteers and not rewarded in any way. The interviews were standardized, using one single interviewer who ensured that the questions were fully understood by the people interviewed. This procedure ensures that all the interviews were set up by the exact same questions, lasting between 6 and 10 min. The nine areas were selected among the only possible quiet areas in the city, i.e., areas designated for relax and social activities as reported in
Figure 1.
2.2. Questionnaires
The questionnaire administered was a structured one, consistent of three main parts. Each question offered a choice among predefined answers or asked for an evaluation over a 5-terms scale.
Supplementary S1 reports the complete questionnaire.
The first part (A), to be filled by the interviewer, provided a characterization of site and weather conditions. The second and main part (B) focused on site description and evaluation, provided by the interviewer. The description and evaluation of the site (B) consisted of nine main questions.
The third part (C) provided a general description of the interviewee (sex, age class, educational level, sensitivity to noise), their site visit customs (frequency, means used, trip duration) and noisiness of their home place.
A total of 614 valid questionnaires have been obtained from three interview campaigns, in which the participants resulted 45% (276) males and 55% (338) females.
As the study is observational (there was no type of intervention on the participants, but an acquisition of information through a questionnaire), this study was not reviewed by any ethical committee and informed consent was not sought from participant. Parents of people under 18 who participated to the project signed informed consent and this guaranteed the consent to the use of personal data that were treated anonymously.
Table 1 shows the sample distribution by sex and age classes, whereas
Table 2 shows the sample distribution by sex and educational level classified as: I: primary education; II: middle school; III: high school; IV: bachelor/master’s degree; V: PhD. or equivalent.
All the questionnaires have been codified, according to what described in
Supplementary S1, in order to be analyzed and used in the models set up. A summary containing the name, a brief description of the variable used in the models and value range for each question is reported in
Table 3.
2.3. Noise Measurements and Audio-Visual Registrations
The acoustic characterization of the environment has been performed through noise measurements carried out during each interview session, thus allowing a comparison between the noise pollution and the perceptive evaluation given by the users.
The Class 1 sound level meter (conform to IEC 61672-1 [
33]) was placed in the middle of the survey area at 1.5 m height and the microphone was protected with a windshield. Each measure lasted for 45 min, in order to provide a representative sample of the acoustic environment for each interview session. Depending on the site, the measurements were repeated two or three times.
The spurious acoustic events, such as people talking very loudly near the microphone, have been removed by the sound time history. Almost all other sound events, such as children’s laughter, barks, passing aircrafts, have not been removed and have been assumed as representative of their real likelihood in each area.
Three acoustic indicators have been used for each sound level measure: the total A-weighted sound energy LAeq, the A-weighted noise level exceeded for 10% of the measurement time LA10 and the A-weighted noise level exceeded for 90% of the measurement time LA90.
The audio-visual registrations have been carried out using binaural headphones with two-channel recorder and an HD camera in a soundwalk in each area. These soundwalks have been reproduced in a laboratory to a maximum of 3 people at a time. Each person evaluated from 5 to 9 videos, shown in different orders for each group, and filled similar questionnaires as these filled in-site.
2.4. Model Set Up
The data obtained from the socio-acoustic surveys have been analyzed through multiple regressions in R [
34], in order to provide a generalized linear model (
glm) able to predict the scores assigned by the interviewees based on objective and measurable elements.
As fully reported in
Supplementary S2, three main
glm groups have been set up, one for each evaluated subjective element (output): tranquillity (B7), noisiness (B9) and pleasantness (C6). For each of these outputs a first model including all variables (
Table 3), i.e., the answers to each questionnaire, was created in order to carry out a preliminary investigation of which variables are significant and then included in the linear model. In the second phase, the non-significant variables have been gradually removed to obtain the most possible compact model in each case and then provide a wider explanation of the variability of the output. This is performed via an iterative process where the significant elements have been identified in each group and considered in the final model for tranquillity score prediction. This model has the general formula:
where:
TS is the tranquillity score (1 to 5);
X is a constant;
A1, A2, …, An are the elements shaping perception of tranquillity;
α, β, …, ω are quantifiers of the effect of each above elements.
For each output a first attempt has been created including all variables reported in
Table 3.
Subsequently, the influence of the parameters reported in
Table 3 (characteristics of the interviewees—gender, age, and degree of education, habit, meteorological conditions, effect of the detected sound sources, etc.) have been considered singularly in new tight models.
Details on single models and single results are reported in
Supplementary S2. In brief, the overall results show that the correlations between perceived noise and noise data, presence of sound sources and the presence of visual elements are significant. Pleasantness is related to the presence of visual elements and sound sources and also with
LAeq. The tranquillity score is strongly correlated with noisiness and pleasantness, both depending on sound presence, visual elements judged and by noise data. The perceived noise is positively correlated to the
LA10 and
LA90 levels and negatively to
LAeq; the perceived tranquillity is negatively correlated with the
LA10. All correlations were significant (
p < 0.001). With this information, a new model has been built for the prediction of tranquillity.
where:
B7 is the judgment of perceived tranquillity [
1,
2,
3,
4,
5],
B2pos [0, 1] is equal to “1” in the event that at least one of the following sources is heard: people/voices; natural noises; birds singing; music.
B2neg [0, 1] is equal to the value “1” if at least one of the following sources is heard at the site being investigated: road traffic; planes; machinery; facilities or services.
B3neg [0, 1] equals “1” if at least one of the following elements in the site being investigated: transit cars; cars parked; waste; yards.
The coefficients value and the summary of their significance level, as calculated with
glm function, is reported in
Table 4.
The goodness of fit has been evaluated by considering a
pseudo-
R2 value for generalized linear model, particularly with the Nagelkerke method [
35]
pseudo-R2 = 0.38.
The tranquillity prediction model, resulting from data collected during the socio-acoustic surveys in the field, is as follows:
Renaming the variables used, in such a way that they are no longer related to the conventions used during the statistical analysis, the model can be rewritten as:
where:
TS is the tranquillity score, ranges from 1 to 5;
LA10 is the A-weighted statistical sound pressure passed in 10% of the measurement period;
SSP are positive sound sources (voices/steps of people, water or wind noise, bird songs, music);
SSN are the negative noise sources (road traffic, aircraft, machinery, plants or services);
EVN are the negative visual elements (cars in transit, parked cars, garbage, construction sites).
3. Results
3.1. Audio/Visual Preferences
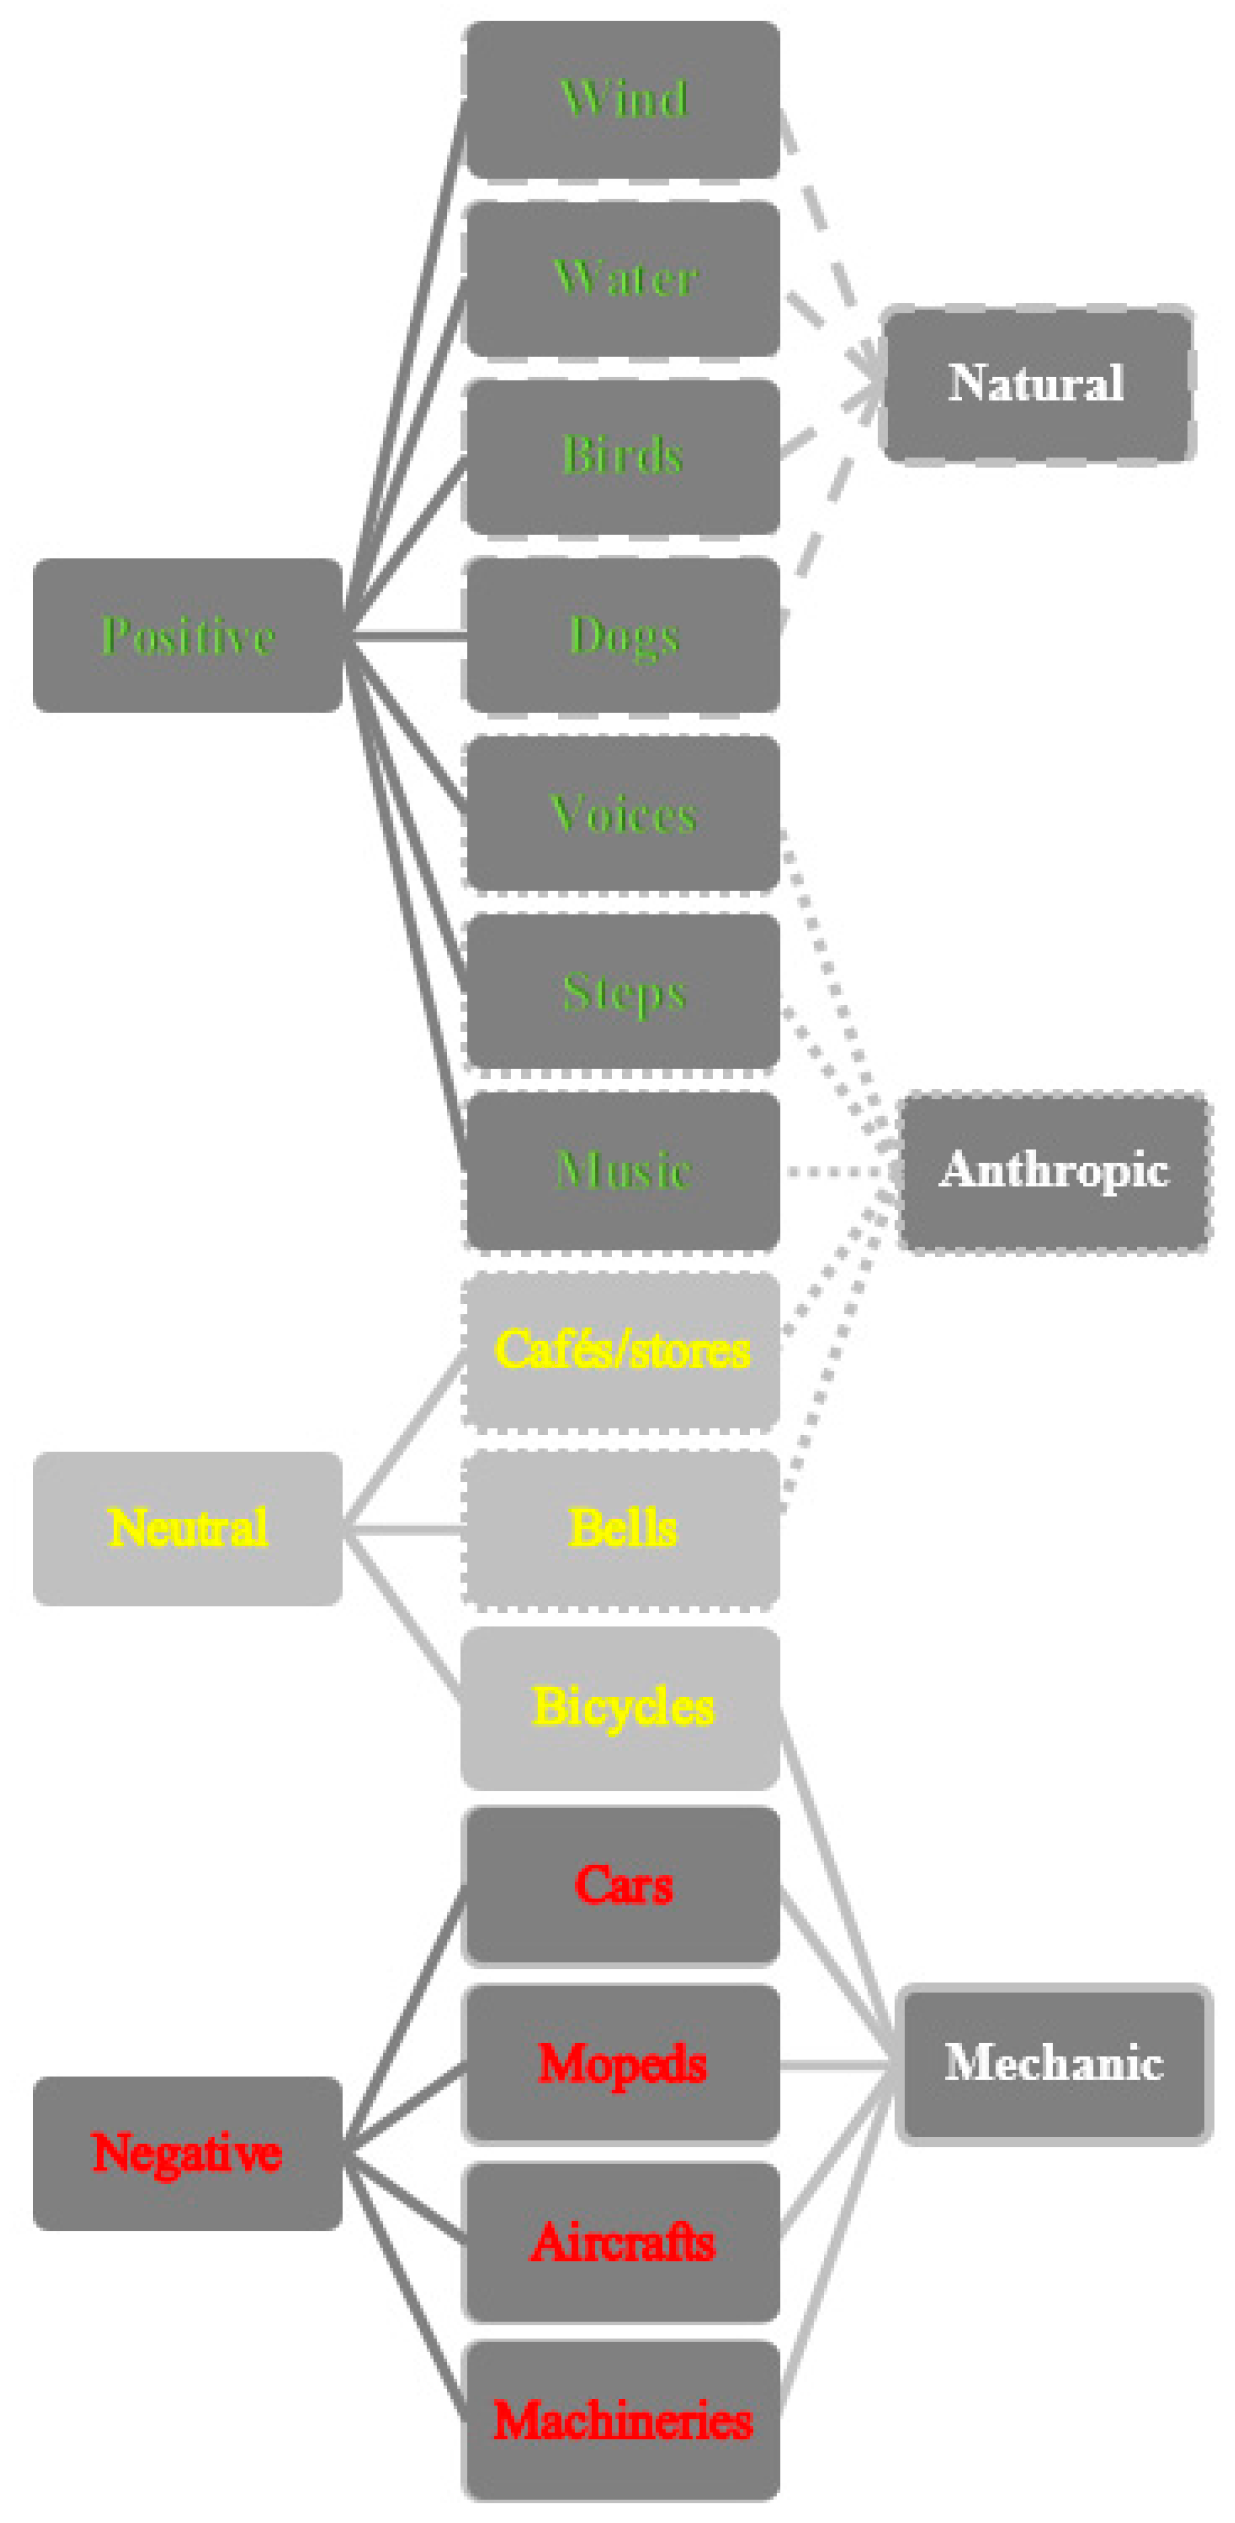
The results of field surveys show that the auditory natural elements have been generally considered positive factors for the site by over the 80% of the interviewees, while the mechanical elements have been generally considered negative factors by over the 90% of the interviewees, as reported in
Figure 2. According to other authors who have conducted studies in other countries [
36,
37], the anthropic elements are regarded partly as positive and partly neutral, depending on the use of the site, which in most cases was relaxing, and if the people’s presence has considered a typical place’s characteristic.
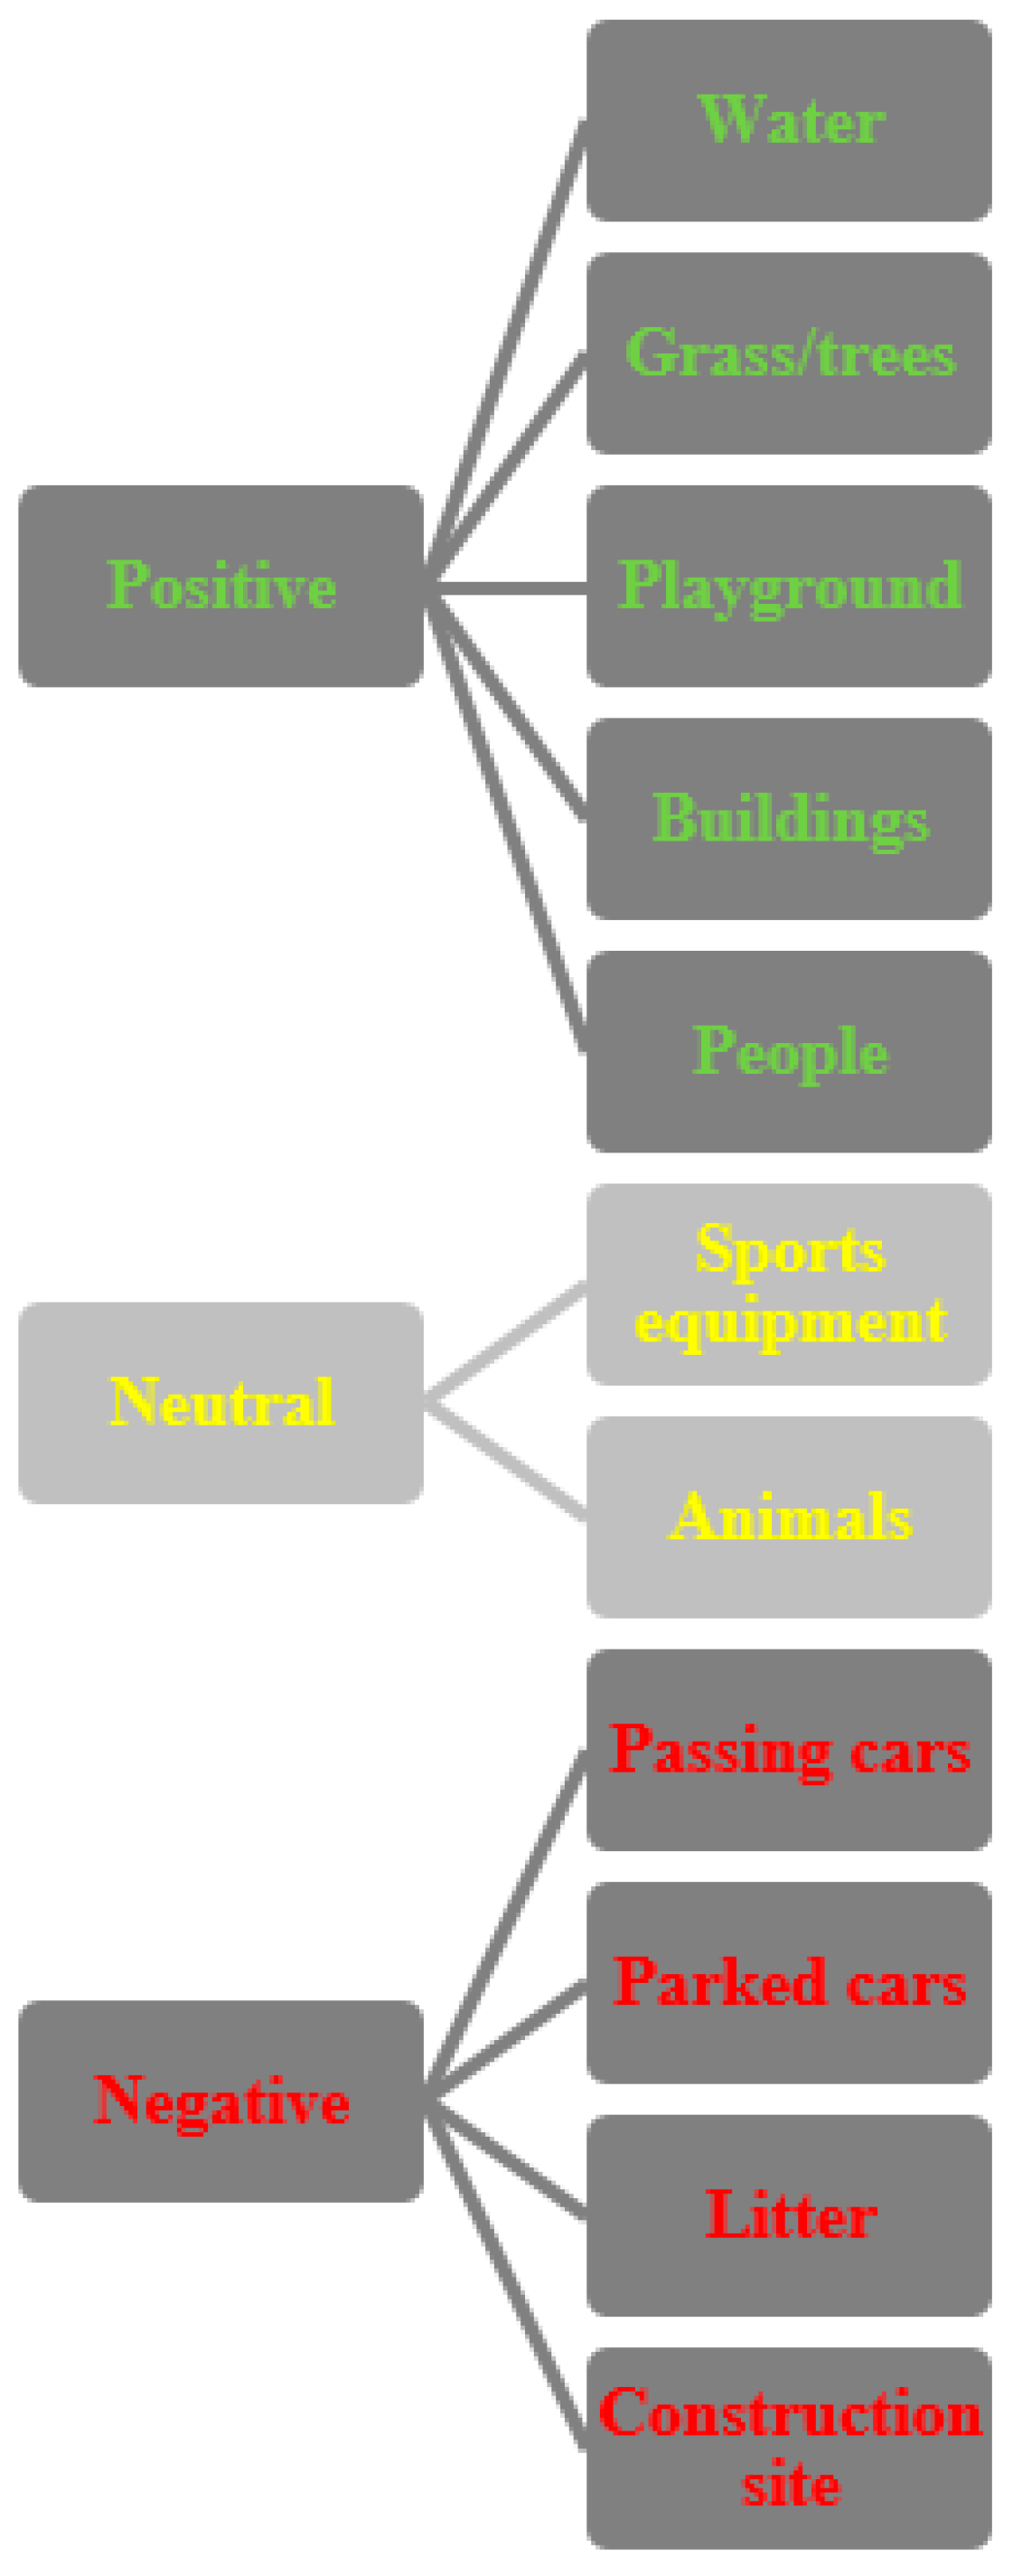
As sketched in
Figure 3, natural elements such as vegetation and water, but also games for children and anthropic elements, resulted as positive visual factor by over 70% of interviewees. On the contrary, cars passing, waste and the presence of the construction site have been considered negative factors by over 90% of interviewees. The presence of animals received all the 3 possible judgment (positive, neutral and negative) in almost equal measure.
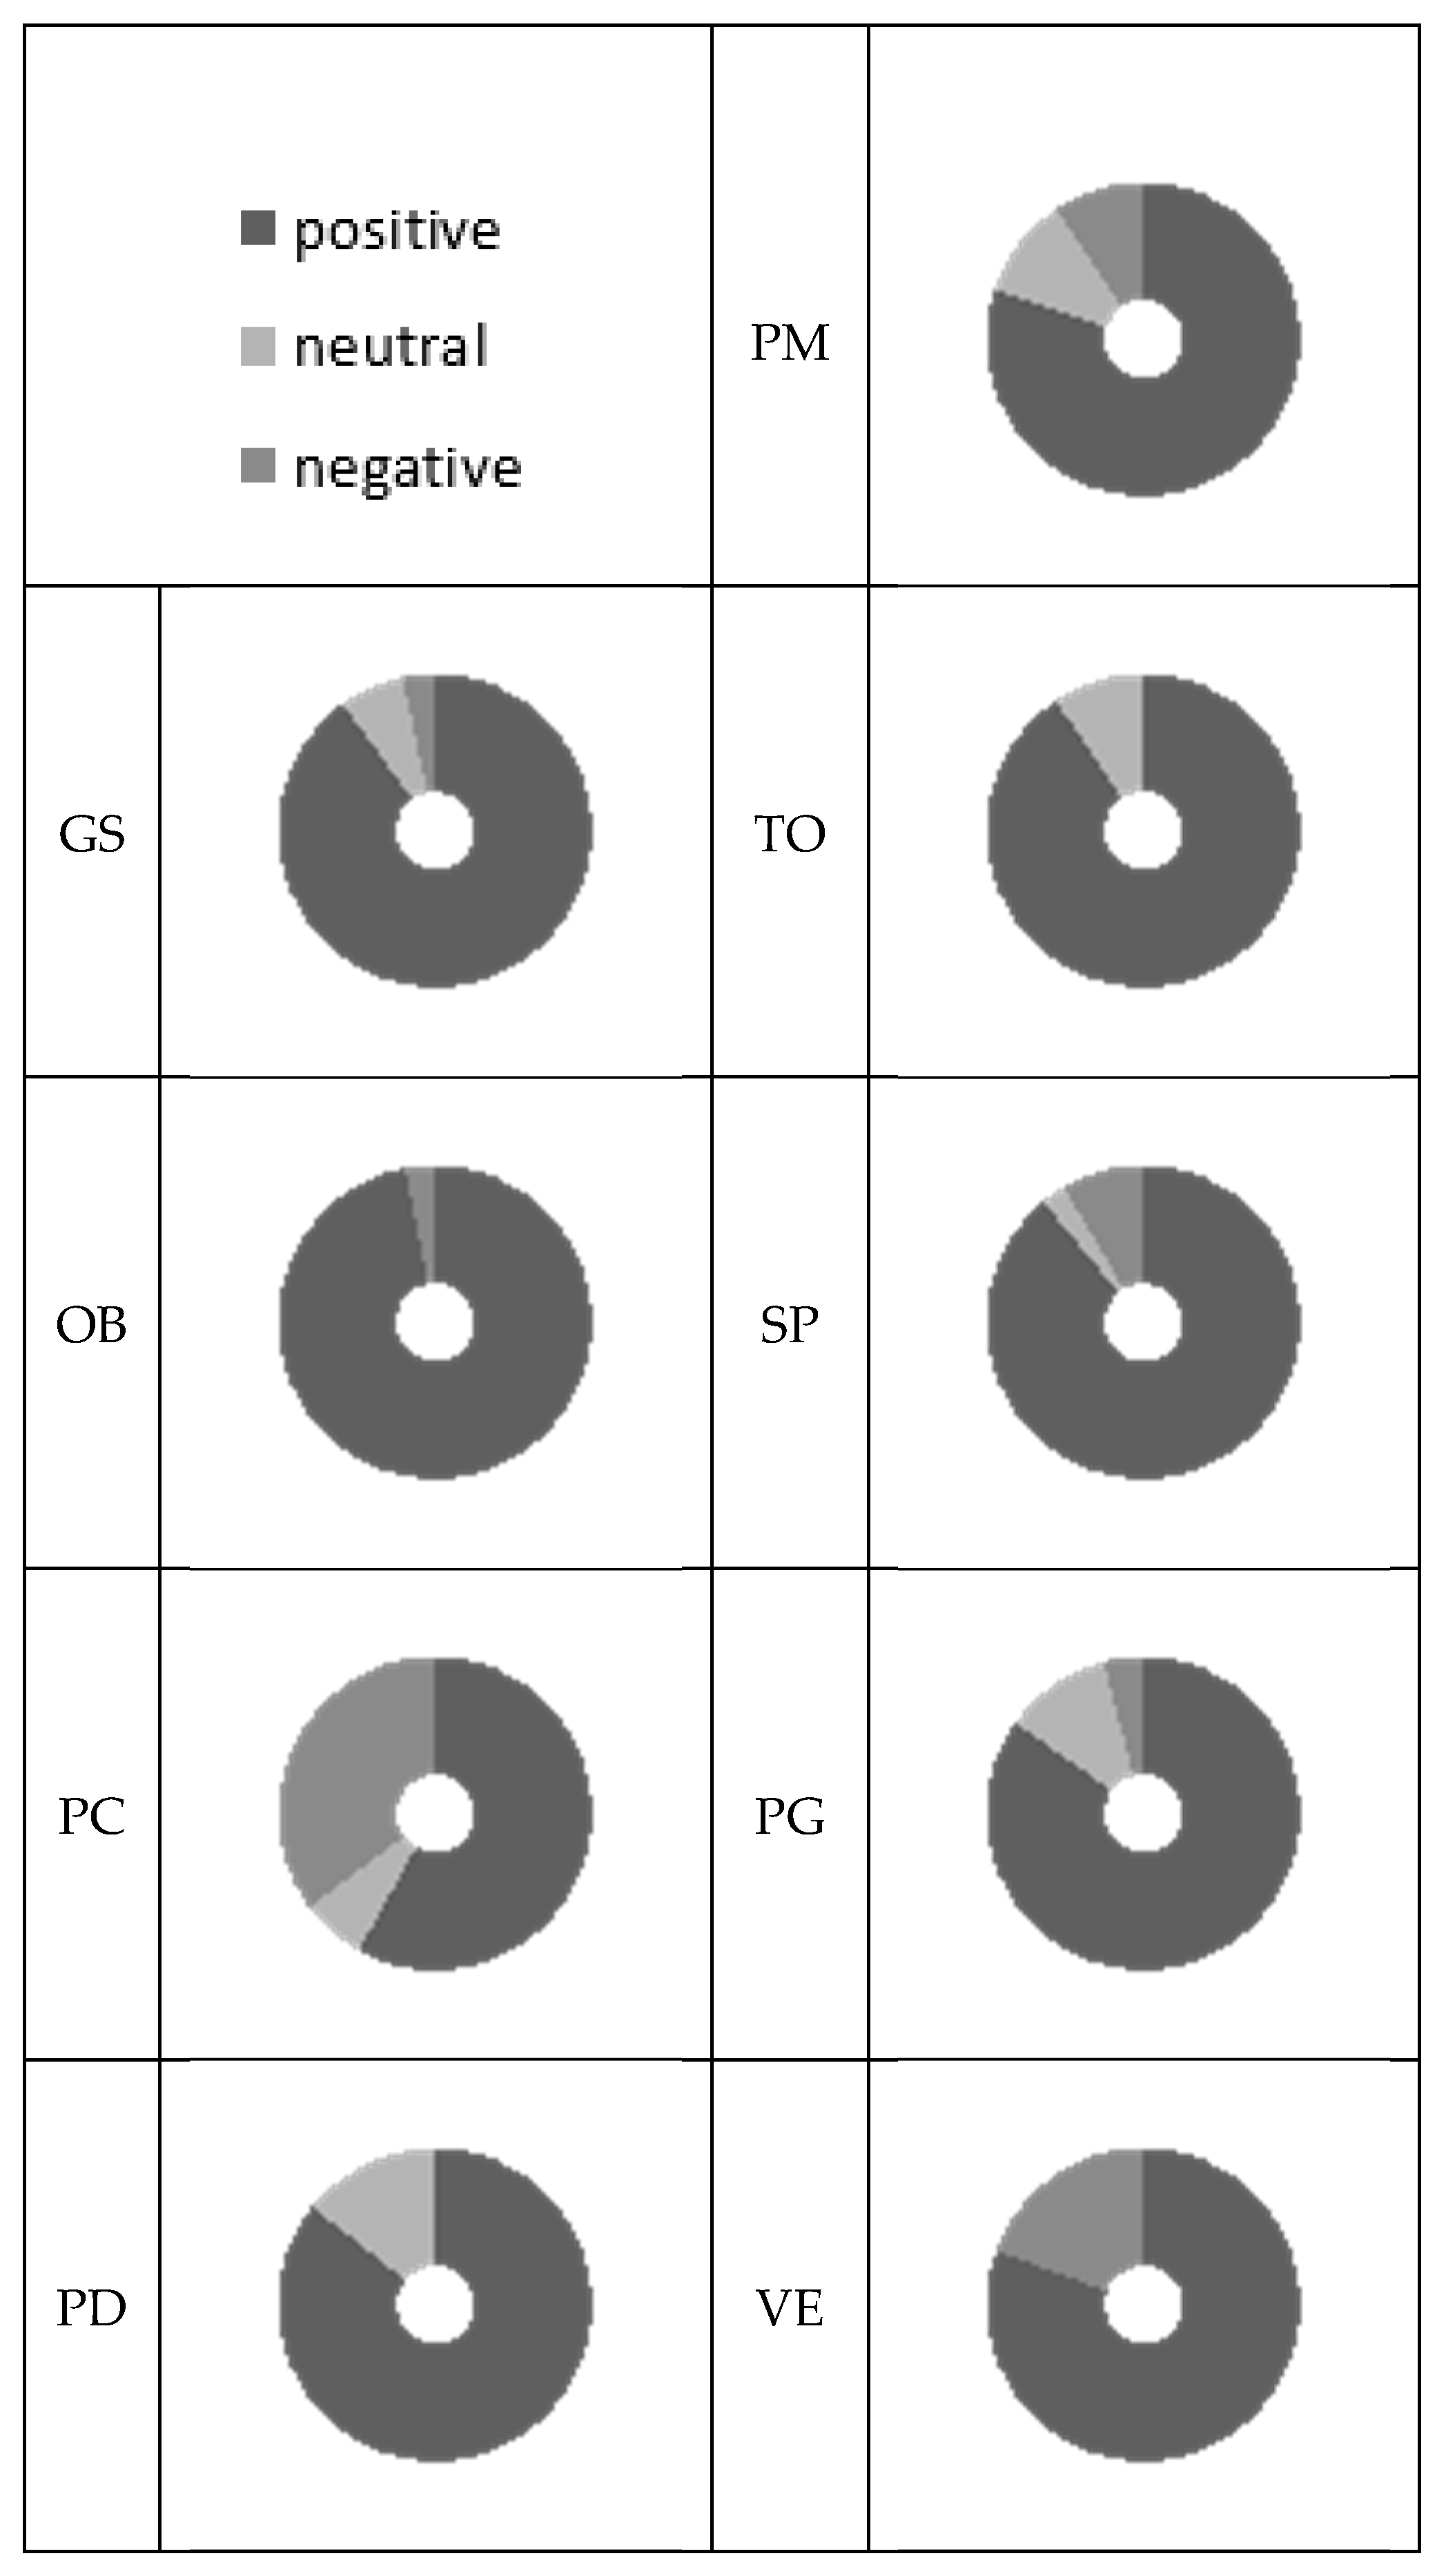
Figure 4 shows preferences in terms of noise (external ring) and visual (internal ring) elements for each area. More positive aspects mean more appreciated area for relaxing activities.
3.2. Noise Characterization
The sound level measurements carried out in the nine sites showed results ranging from 46.2 dB(A) (site OB—Orto Botanico) to 64.6 dB(A) (site PC—Piazza Cavalieri). Indeed, the site OB resulted the quietest area with not a single exceedance of 50 dB(A) level. On the other hand, two sites exceeded the level of 60 dB(A) during all the measurements campaign.
The mean value of noisiness assigned to the nine areas ranged from 2.0 (site OB) to 3.6 (site VE—Piazza Vittorio Emanuele). Only the area PC obtained a noisiness value greater than 3 during all measurements campaign, while sites PM (Piazza Martiri della Libertà) and SP (San Paolo) only during 2 of the 4 measurements campaign. Unfortunately, these values did not show a strong correlation with the data obtained from sound level measurements (R2 = 0.26 compared with LAeq and R2 = 0.27 compared with LA10).
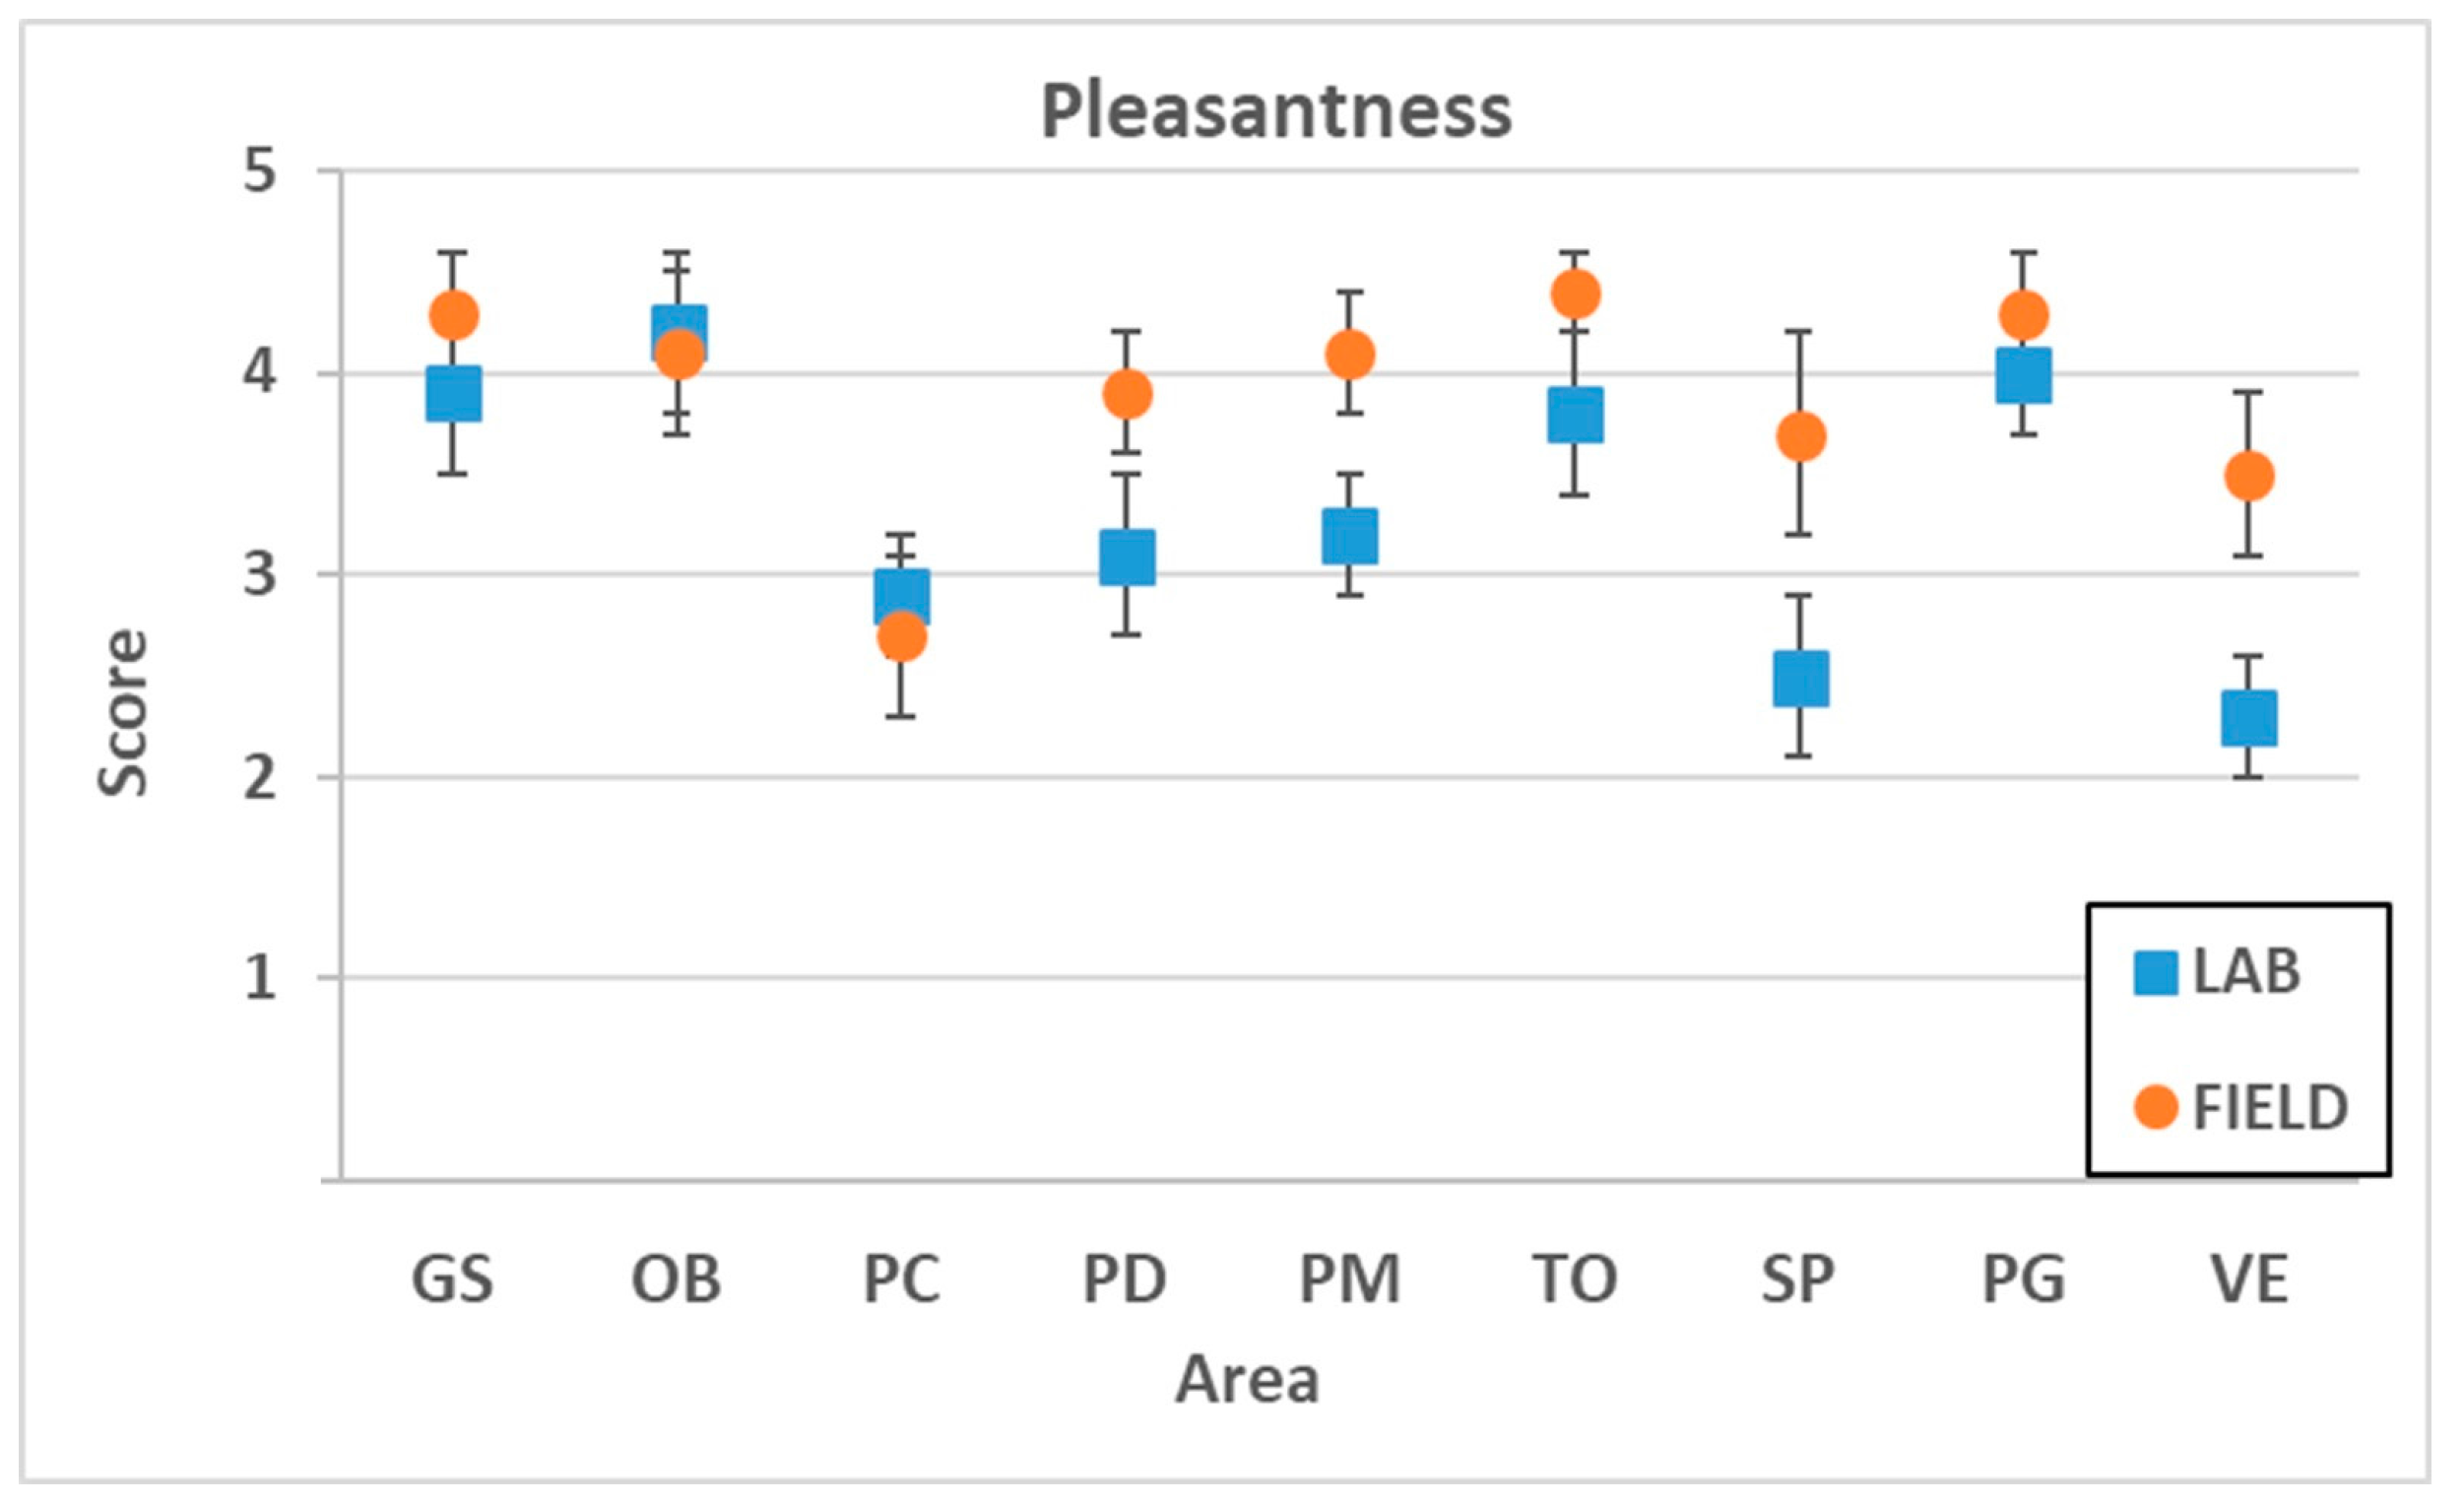
The mean values of pleasantness assigned to the nine areas were generally high, exceeding 3 in all areas except in the site PC where there was a building site. Moreover, 5 of the nine sites had mean values higher than 4.
As reported in
Table 5, the lowest mean values of tranquillity have been assigned to the site PC while the higher one has been assigned to the site OB, in accordance to the sound level measures, but also this values do not show a strong correlation with the data obtained from sound level measurements (
R2 = 0.20 compared to
LAeq, R2 = 0.20 compared to
LA10,
R2 = 0.19 compared to
LA90 and
R2 = 0.01 compared to
LA10 −
LA90).
3.3. Results by Laboratory Analysis
A total of 47 valid questionnaires have been obtained from the laboratory analysis. Interviewed watched 5 of the 9 soundwalks videos, thus any soundwalk has been watched by 26 people. The participants were 60% males and 40% females with a peak in the range between 18 and 26 years.
Table 6 shows the sample distribution by sex and age classes, whereas
Table 7 shows the sample distribution by sex and educational level. The scores obtained in lab analysis are reported in
Table 8.
Following the same trend of the results of the field campaign, higher tranquillity scores have been assigned to sites OB and PG (Piagge), whereas the lowest medium values of tranquillity has been assigned to sites PC and VE, in accordance to the sound level measures. The last two sites have indeed achieved the higher noisiness scores while the first two have achieved the lowest ones and the higher pleasantness scores.
4. Discussion
The use of field surveys proves to be an easy operating method and also a procedure able to engage and stimulate public participation. The face-to-face interview made possible a real-time verification of potential misinterpretations. The socio-acoustic field survey results had little variability repeatable over time. The implementation of more investigative campaigns, during different seasons and weather conditions, tested the feedback constancy over time. The use of multiple regression ruled out the dependence of the tranquillity, noise and pleasantness scores from interviewees’ personal characteristics, such as gender, age and level of education, their sensitivity to noise, the expectations and habits of use, as well as the weather. The results of the survey are correlated with sound measurement data; among these data, the best predictor of perceived tranquillity is the noise indicator
LA10. The sound sources and classification of visual elements method proved to be more effective for the purposes of the linear model construction. This method divides the elements into positive, indifferent or negative, based on the preferences expressed by the respondents. The positive and negative sound sources appear to have both significant and equal influence on the perceived tranquillity, the former increasing it, the latter decreasing it. Visual elements turn out to have only negative effects on the tranquillity score. The linear model outcome, as fully described in
Supplementary S2, have been reported in Equation (2),
Section 2.4. The
pseudo-
R2 = 0.38 obtained with Nagelkerke method is a low value in general, when it is expected to be as high as possible. Anyway, this value can be considered acceptable in a field that attempts to predict human behavior, such as psychology or psychoacoustics, where
R2 values are lower than 50% because humans are simply harder to predict than physical processes.
Each measurement campaign performed in the 9 sites was repeated 3 times. In this way more detailed information about the noise has been gathered, as well as a number of questionnaires between a minimum of 36 and a maximum of 109 for each site. These data were used to reconstruct the distributions of “scores”, which were normal with a reduced standard deviation. On this basis, the response is significantly valid for the measurement site. Thus, the presence of positive and negative noise sources and negative visual elements were the only remaining valuable parameters in the model along with the noise level. These variables arose from subjective evaluations; nevertheless on the basis of a statistically significant sample they gain objective meaning in the measured area. Since the interviewed sample is generic, thus they are not exclusively people resident in Pisa, it seems reasonable to think that the assumption can be extended to other urban contexts similar to the city of Pisa, which is a city characterized by residents, students and tourists, who express a wide variability of the sample. Surely further studies in different contexts are required the extension of the validity of the model. The replication of the study in other realities will provide positive feedback extending its validity.
Starting from literature studies, particularly Watts’, there are sound sources already known to be disturbing in a quiet area context while there are some moderating effects shown to be an attenuator for tranquillity. The model not only provides qualitative information by highlighting the factors that determine the tranquillity of an area, but also a quantitative answer through Equation (2) that establishes a relationship between the significant one. This can be applied to quiet areas, as specified by the European directive END 2002 [
2] (for which there are still no definitive indications and real interest by administrations), or to mitigate negative acoustic and visual effects of areas needing to recover their usability and attraction. On these bases the administrations and public entities could have the tools to improve an area from an acoustic point of view by reducing road traffic, planes, machinery, facilities or services, and negative visual elements, such as transit cars; cars parked; waste; yards; or increase the positive noise sources such as people/voices; natural noises; birds singing; music; as well as of course lowering the noise level. However, above all, the presence of events with sound energy greater than the energy of those sources that, due to their energetic and temporal characteristics, are important for the observer should be avoided. This is a consequence of what came out from the model, where noise was better related to the noise indicator
LA10 instead of
LAeq, confirming what the literature reports about people’s sensitiveness to sound events more than to sound energy distributed over time.
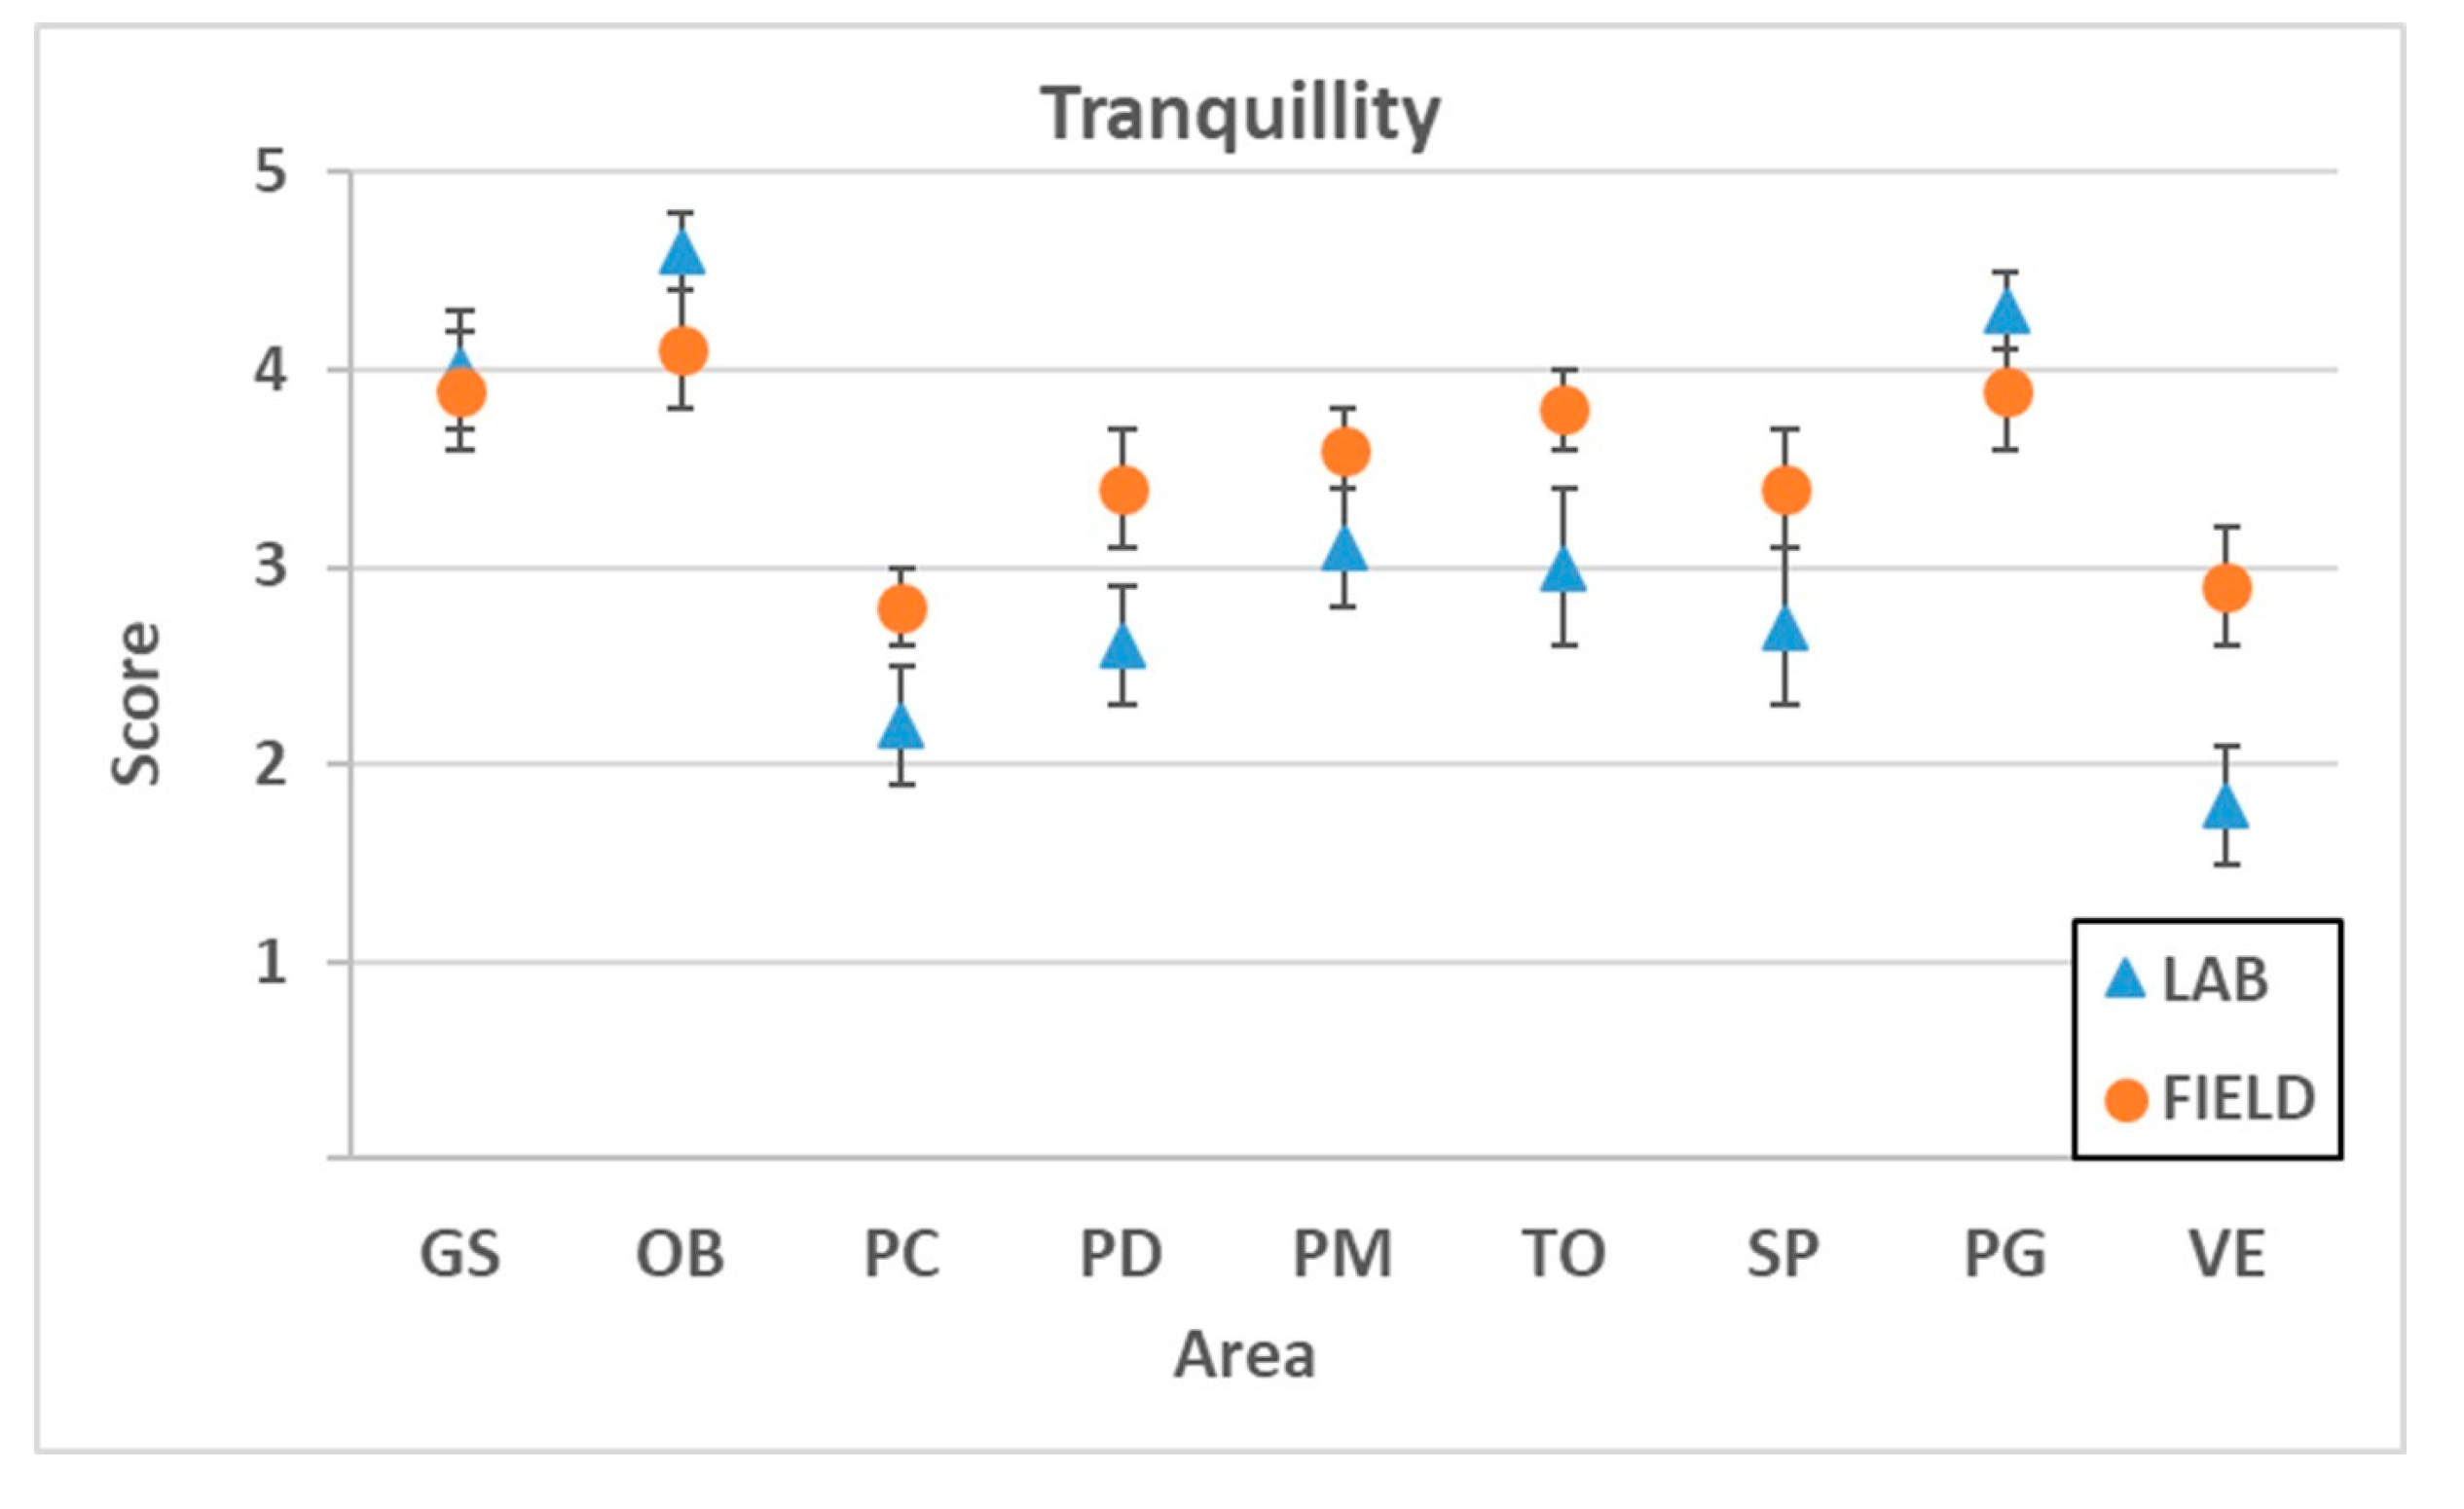
For all the areas, TS, Noisiness and Pleasantness values have been calculated for field and lab measurements and compared in
Figure 5,
Figure 6 and
Figure 7. Vertical bars represent the 95% confidence interval, allowing results to graphically distinguish data significantly (
p < 0.05) different from each other.
Only seven of the nine areas show different TS, but the difference is always lower than 1 point. The observed trend in the data is due to very high value provided in the laboratory, almost always above the value of 3.5, thus the laboratory scores tend to be more positive than the field ones, which vice versa are lower than 3.5.
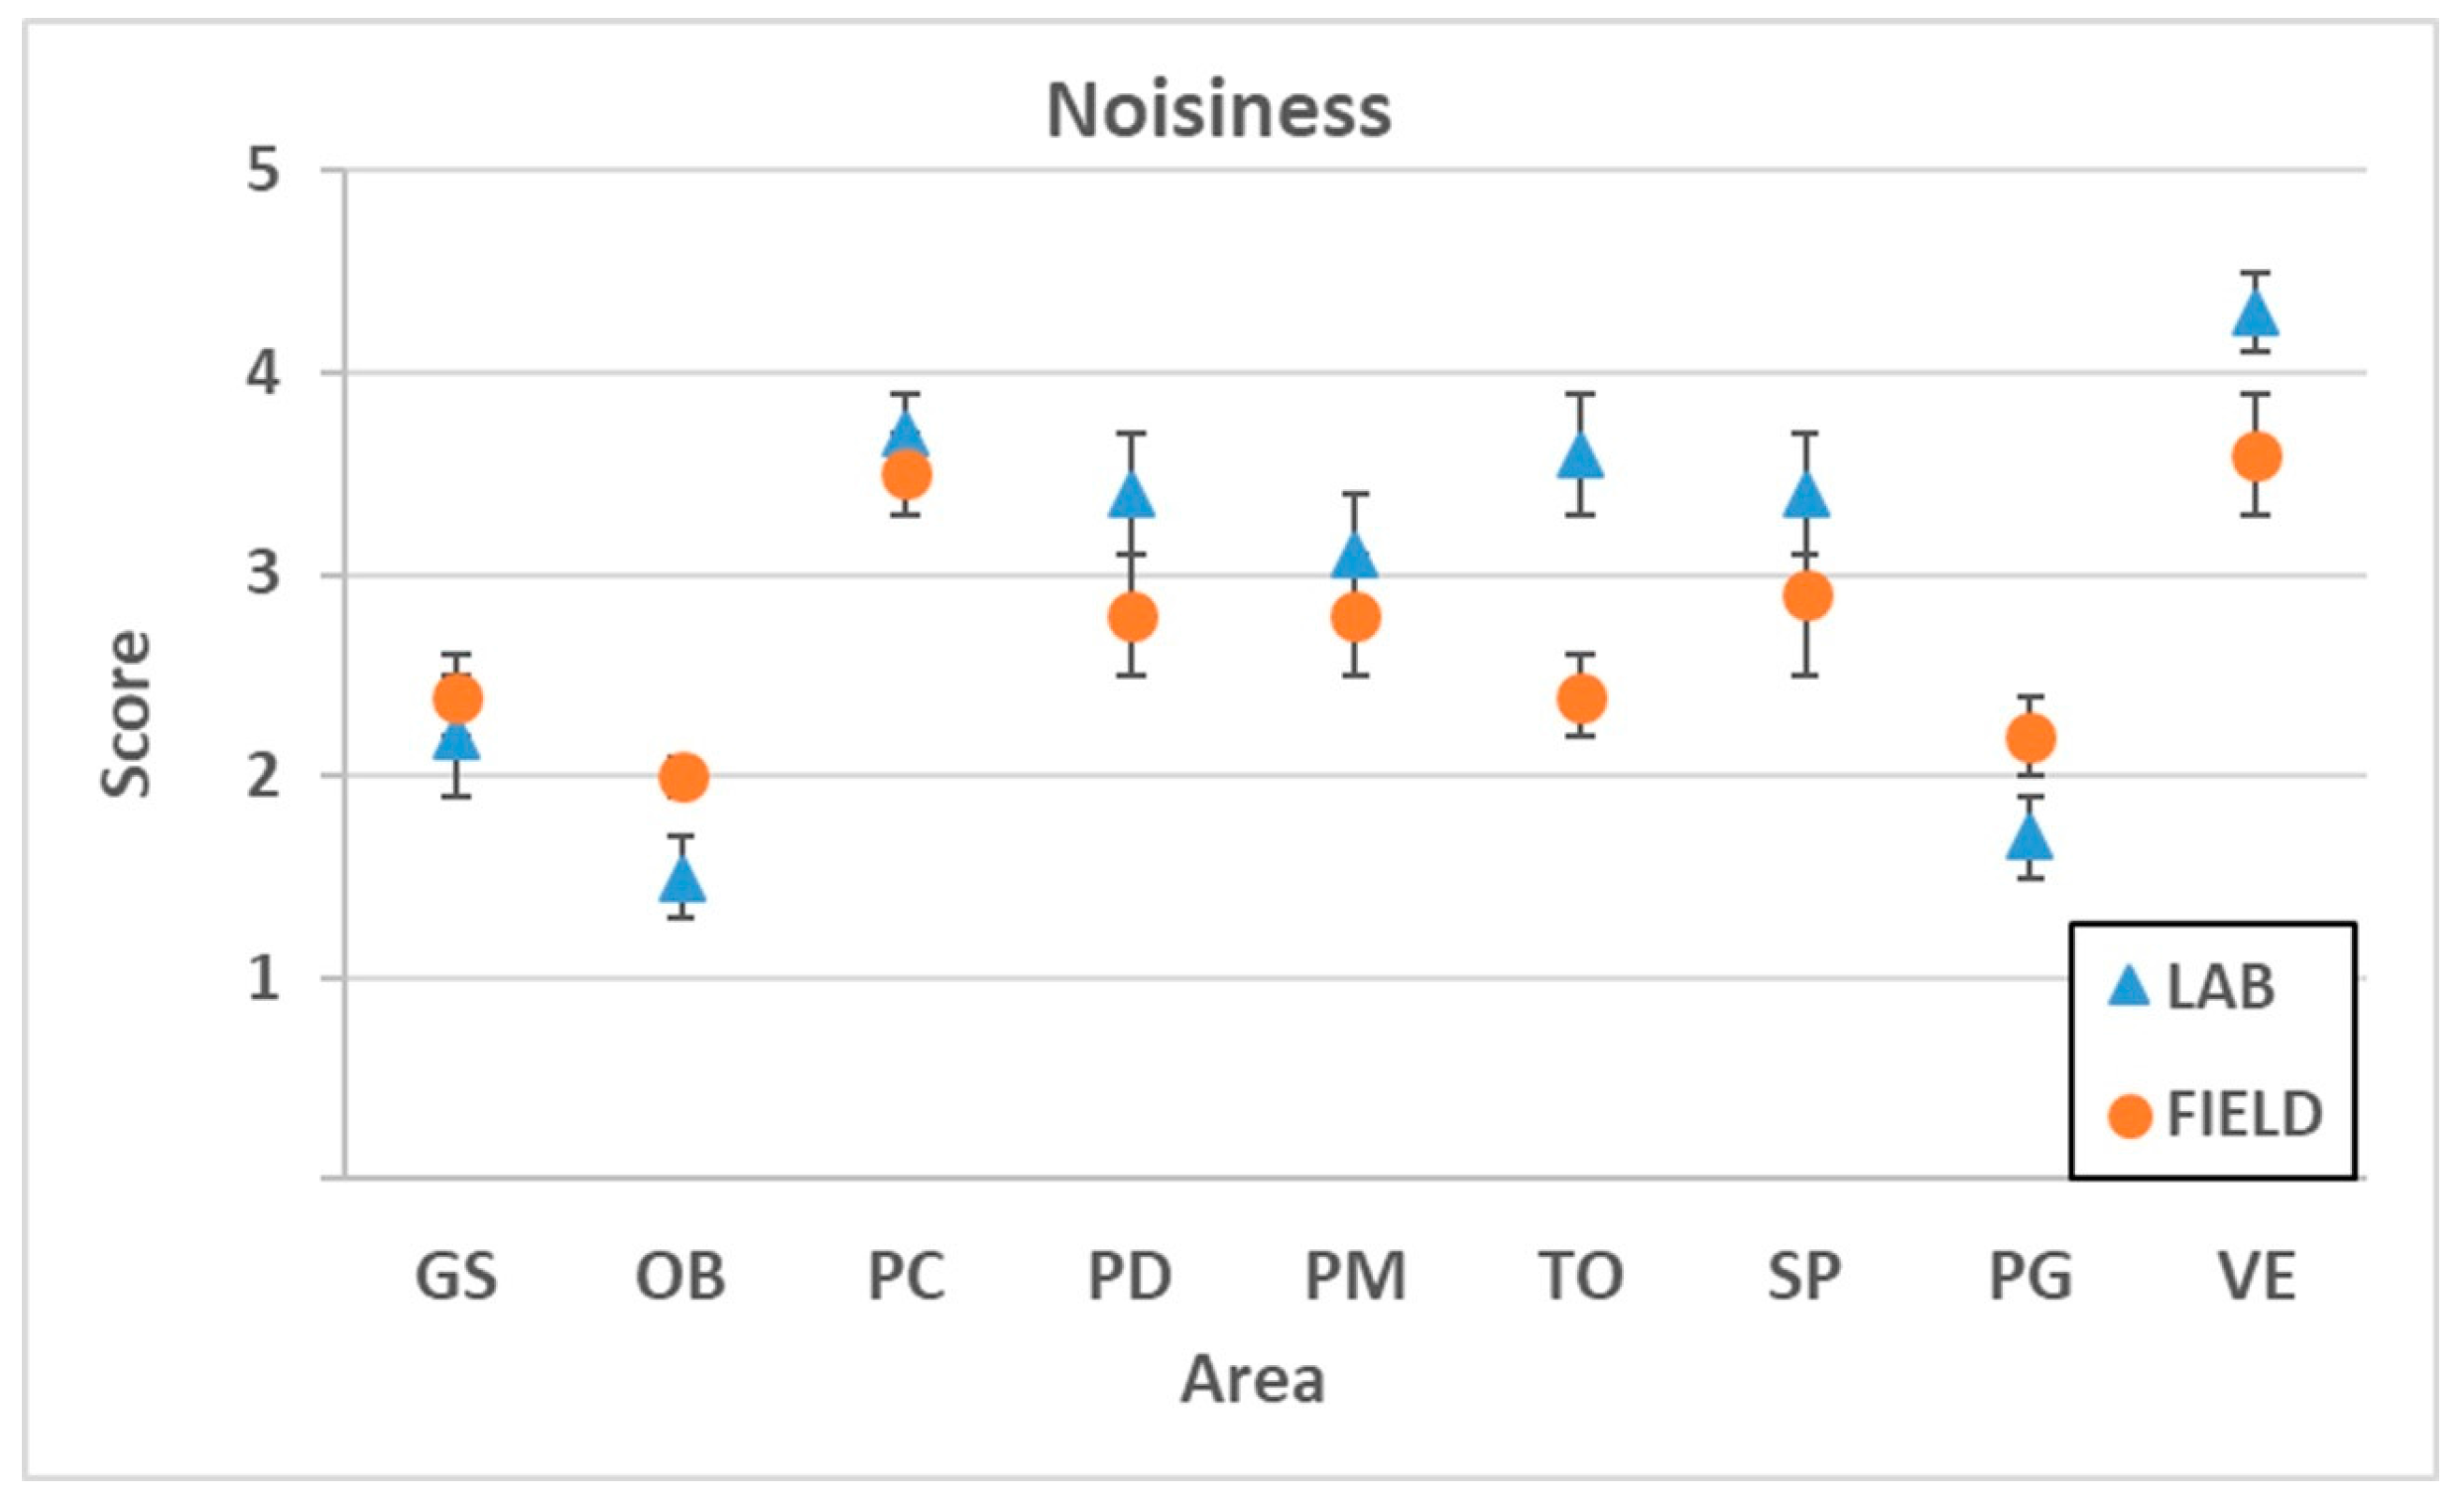
In noisiness comparison, scores obtained by laboratory surveys tend to be lower than those in the field. Only sites OB and PG obtained lower noisiness scores in the field, but not significantly. The same observation is valid also in pleasantness scores, where values obtained in laboratory surveys tend to be lower than those in the field in case of values lower than 2.5, whereas for higher values they tend to be higher than those obtained in the field.
Differently from TS, higher values correspond to more negative judgments, thus the five values of the assessment scale can be conceptually overturned with respect to the central term in order to provide a scale in which, similar to that of TS, higher values are more positive. In this case, the data reversal value is 3.5 and it coincides with what observed about the perceived tranquillity.
5. Conclusions
The linear model built on the basis of data collected through socio-acoustic surveys in field predicts, on a scale from 1 to 5, the perceived tranquillity depending on the statistical level LA10, the sound sources and visual elements.
The perceived tranquillity is negatively correlated to the statistical level LA10 and to the presence of sound sources or negative visual elements. On the other hand, the presence of beneficial sound sources is positively correlated to the perceived tranquillity. However, the effect of the noise level is regulated by the environmental characteristics.
In the scale of five terms used in tranquillity evaluation, positive values have been considered “4” and “5”. On this basis the subdivision of the average values assigned to the areas in the two categories “not quiet” and “quiet” has taken place: the first category includes values less than 3.5, while the second includes values greater than or equal to 3.5. The tranquillity perception in a place is thus only prevented for LA10 > 65 dB(A), according to the model built; below this level, the tranquillity perception can still be high depending on the interaction between sound and visual environmental features.
The perceived tranquillity is proposed, in this work, as an indicator to identify quiet areas in the urban environment, as provided for the European Directive 49/2002/EC. The obtained model allows identification of which areas would get a higher tranquillity score than the threshold value of 3.5 and would be perceived as quiet. Taking advantage of the obtained model, it will also be possible to predict the effect on tranquillity perception by noise mitigation and/or restructuring of urban aggregation areas. The model can be used as a cost-benefit analysis support tool to identify the best solution between the reduction of noise levels and the regeneration of urban areas, referring to the tranquillity perception that users will derive.
The presented work provides results that are necessarily the starting point for further studies. The primary requirements are both the method’s validation in different contexts and the identification of objective criteria to determine the presence or absence of sound sources or visual elements deemed to be positive or negative.
The results identify the determinant factors for perception of quietness and they require further validation procedure, viz. the application of the model to situations not previously investigated to obtain a tranquillity score prediction; the carrying out of other socio-acoustic investigations to confirm this prediction or, otherwise, to bring the necessary changes to the model, taking into account the new results. The extension of this investigation to other cities, with different samples and interviewers, will also contribute to determining whether these factors can influence the results of the study or not and if the perception of tranquillity depends from the agglomeration characteristics in which the study is carried out.
It is also necessary to define an objective method to identify the criteria that interviewees use for defining the three sound sources and the three most representative visual elements of a place. An important issue is the determination of the elements that have no threshold and, therefore, their presence is enough to be considered among the main elements of a site, as in the case of trash; on the other hand, some elements may have a lower threshold, under which their presence is unnoticed. This threshold may be spatial, for example the percentage of greenery in the field of view, time-related, such as the frequency of automobiles or airplanes passing by, referred to the sound level or otherwise.
Through validation of the method in different contexts, the possible improvement of the model and the identification of objective criteria assigning values to the variables contained in it, the results of this work will provide a tool that can predict the value of tranquillity perceived in different urban areas contexts.
The standardized questionnaire in socio-acoustic field surveys has proven to be an effective and efficient method for collecting easy-to-interpret and repeatable data over time. Direct interaction with the interviewer is fundamental to ensure respondents’ understanding. On the contrary, it appears that data collected via the playback of soundwalks in a laboratory environment, although applicable with good video and audio quality is not consistent with field data, providing results with a wide variability. Considering the time required, the efficiency of the in-lab method is considerably lower than field surveys.


