Article

L’Aquila Smart Clean Air City: The Italian Pilot Project for Healthy Urban Air

1
Società Progetti Innovativi srl, Via C. D’Andrea snc, 67100 Bazzano, Italy
2
Department of Industrial Engineering, Information and Economics, University of L’Aquila, Via G. Gronchi 18, 67100 L’Aquila, Italy
3
IsCleanAir srl, Piazza della Manifattura 1, 38068 Rovereto, Italy
*
Author to whom correspondence should be addressed.
Environments 2017, 4(4), 78; https://doi.org/10.3390/environments4040078
Submission received: 12 September 2017 / Revised: 28 October 2017 / Accepted: 1 November 2017 / Published: 3 November 2017
(This article belongs to the Special Issue Air Pollution Control)

Abstract

:
Exposure to atmospheric pollution is a major concern for urban populations. Currently, no effective strategy has been adopted to tackle the problem. The paper presents the Smart Clean Air City project, a pilot experiment concerning the improvement in urban air quality. Small wet scrubber systems will be operating in a network configuration in suitable urban areas of L’Aquila city (Italy). The purpose of this work is to describe the project and show the preliminary results obtained in the characterization of two urban sites before the remediation test; the main operating principles of the wet scrubber system will be discussed, as well as the design of the mobile treatment plant for the processing of wastewater resulting from scrubber operation. Measurements of particle size distributions in the range of 0.30–25 µm took place in the two sites of interest, an urban background and a traffic area in the city of L’Aquila. The mean number concentration detected was 2.4 × 10⁷ and 4.5 × 10⁷ particles/m3, respectively. Finally, theoretical assessments, performed by Computational Fluid Dynamics (CFD) codes, will show the effects of the wet scrubber operation on air pollutants under different environmental conditions and in several urban usage patterns.

1. Introduction

In the last century, human activities have caused the huge increase in atmospheric emissions, mainly due to industrial, commercial and agriculture development, as well as the expansion of urban areas and thus transportation. Consequently, gaseous emissions have grown rapidly, leading to a worsening of the air quality both in cities and in their surrounding areas [1]. Road transportation and heating systems are two main urban sources of atmospheric emissions. Moreover, around urban areas and suburbs, there is a significant contribution to the emissions from industry, farming and agriculture operations [2]. Pollutants originating from traffic and heating have the disadvantage of being densely distributed on the territory; traffic sources are also mobile, and it is easy to understand how difficult mitigation and treatment are.
Urban atmospheric pollution is the result of a mixture of different chemical compounds and particulate matter [2]. There are different pollutant types, depending on chemical composition, reaction properties, persistence in the atmosphere and their impact on human and animal health as well as on some materials (for instance corrosion of steel by acid rain). The main pollutants in urban air are nitrogen oxides (NOx), sulphur oxides (SOx), particulate matter (PM1–PM10), volatile organic compounds (VOCs), heavy metals, carbon oxides (CO, CO2), light hydrocarbons (CH4, C6H6) and other compounds like polycyclic aromatic hydrocarbons (PAHs), attached to particulate matter.
Particulates can form atmospheric aerosols, i.e., the most hazardous because fine particles (size < 2.5 µm) and ultrafine particles (<0.1 µm) are the most detrimental when inhaled by humans [3]. Long-term exposure to NOx and VOCs cause severe damage, especially in children, the very young, elderly and those with respiratory problems [4]. Another problem concerned with air pollution is the phenomenon of acid rain, due to NOx and SOx that react with humidity to yield HNO3 and H2SO4. Some air monitoring stations placed in urban areas have measured pH values of about 3 or less, which is much lower than the normal pH of rain, usually in the range 5–6.5.
According to the European Environment Agency data [5], 90% of the urban population in Europe is exposed to pollutant levels above the threshold considered harmful by the World Health Organization (WHO), with a huge cost in terms of impact and consequences on our environment and health [6]. Furthermore, long-term exposure to the finest PM has been associated with natural-caused mortality, even for concentrations far from the current European annual average limits [7].
Some efforts focused on improving urban air quality: treaties, laws and advice from world environmental conferences and international panels targeted emission reduction, resulting in lowering of the consumption of fossil fuels. Unfortunately, this choice did not result in the expected outcome. For instance, traffic stops for some days during the year and the substitution of less smoky fuels like low-sulphur diesel, methane and liquefied petroleum gas (LPG) are drastic actions put into operation in the past with the aim to reduce emissions, but they did not give the expected results [8].
In the last two decades, strong efforts have been focused on the development of a wide range of devices for removing PM and gaseous pollutants, even indoors [9]. PM can be removed by using mechanical HEPA (high efficiency particulate) air filters or powered electronic air cleaners (e.g., ionizers). However, filters tend to lose efficiency very fast once sorbents are saturated, and thus such devices require frequent maintenance [10,11]. Unit operations and processes for removing organic airborne contaminants include wet and dry scrubbing, condensation, gas-phase carbon adsorption, catalytic oxidation, thermal oxidation, flare, and gas-phase biofiltration. By contrast, filters, cyclones, electrostatic precipitators and wet scrubbers are mainly used for removal of PM and inorganic contaminants like metals. This equipment can improve the quality of indoor urban spaces, but few experimental tests for application in outside urban environments are currently available in the scientific literature. A recent study [12] investigated urban air purification by means of photocatalytic paving elements along a 200 m sidewalk of a Copenhagen central street. However, this application is limited to mitigate nitrogen oxide pollution only; moreover, it represents a TiO2-based passive solution operating under ideal weather and irradiation conditions. The study reports a monthly NOx abatement of 22% achieved at the summer solstice and noon abatements higher than 45%. Other innovative passive mitigation techniques propose the use of photoactivated TiO2 coated layers on building materials [13] or in exterior paints [14,15] in order to oxidize catalytically NOx.
Within that framework, the present work reports the description of a pilot project aimed at testing a new remediation strategy of urban air pollution. The project, Smart Clean Air City, financed by the Italian Ministry for the Economic Development (MISE), is aimed at developing APA (Air Pollution Abatement) technology, which is among that provided by the Horizon 2020 Program (point 7.5 of Annex Decree MISE—22 October 2013) [16]. The strategy is to set up a network of densely distributed, economical and sustainable air pollution absorbers, basically wet scrubber systems, in the urban environment of L’Aquila city (Italy), which may lower pollutant levels at breathable height and may reduce bulk urban-canopy emissions.
In particular, in the first part of this work, the characteristics of the wet scrubber system are reported in addition to the design of a wastewater treatment plant (WWTP) for the processing of water resulting from APA scrubber operation. A brief overview and characterization of the urban sites of L’Aquila, where the pilot experimentation will be carried out, is also presented. In order to characterize the local air quality before the remediation, in the second part of the paper, the results of the extensive experimental campaign of PM concentration monitoring are shown. Moreover, CFD (Computational Fluid Dynamics) theoretical assessments have been performed in order to investigate how the scrubber operation affects the pollutant levels in several urban contexts; in particular, we focused our attention on the deep street canyon case.

2. Materials and Methods

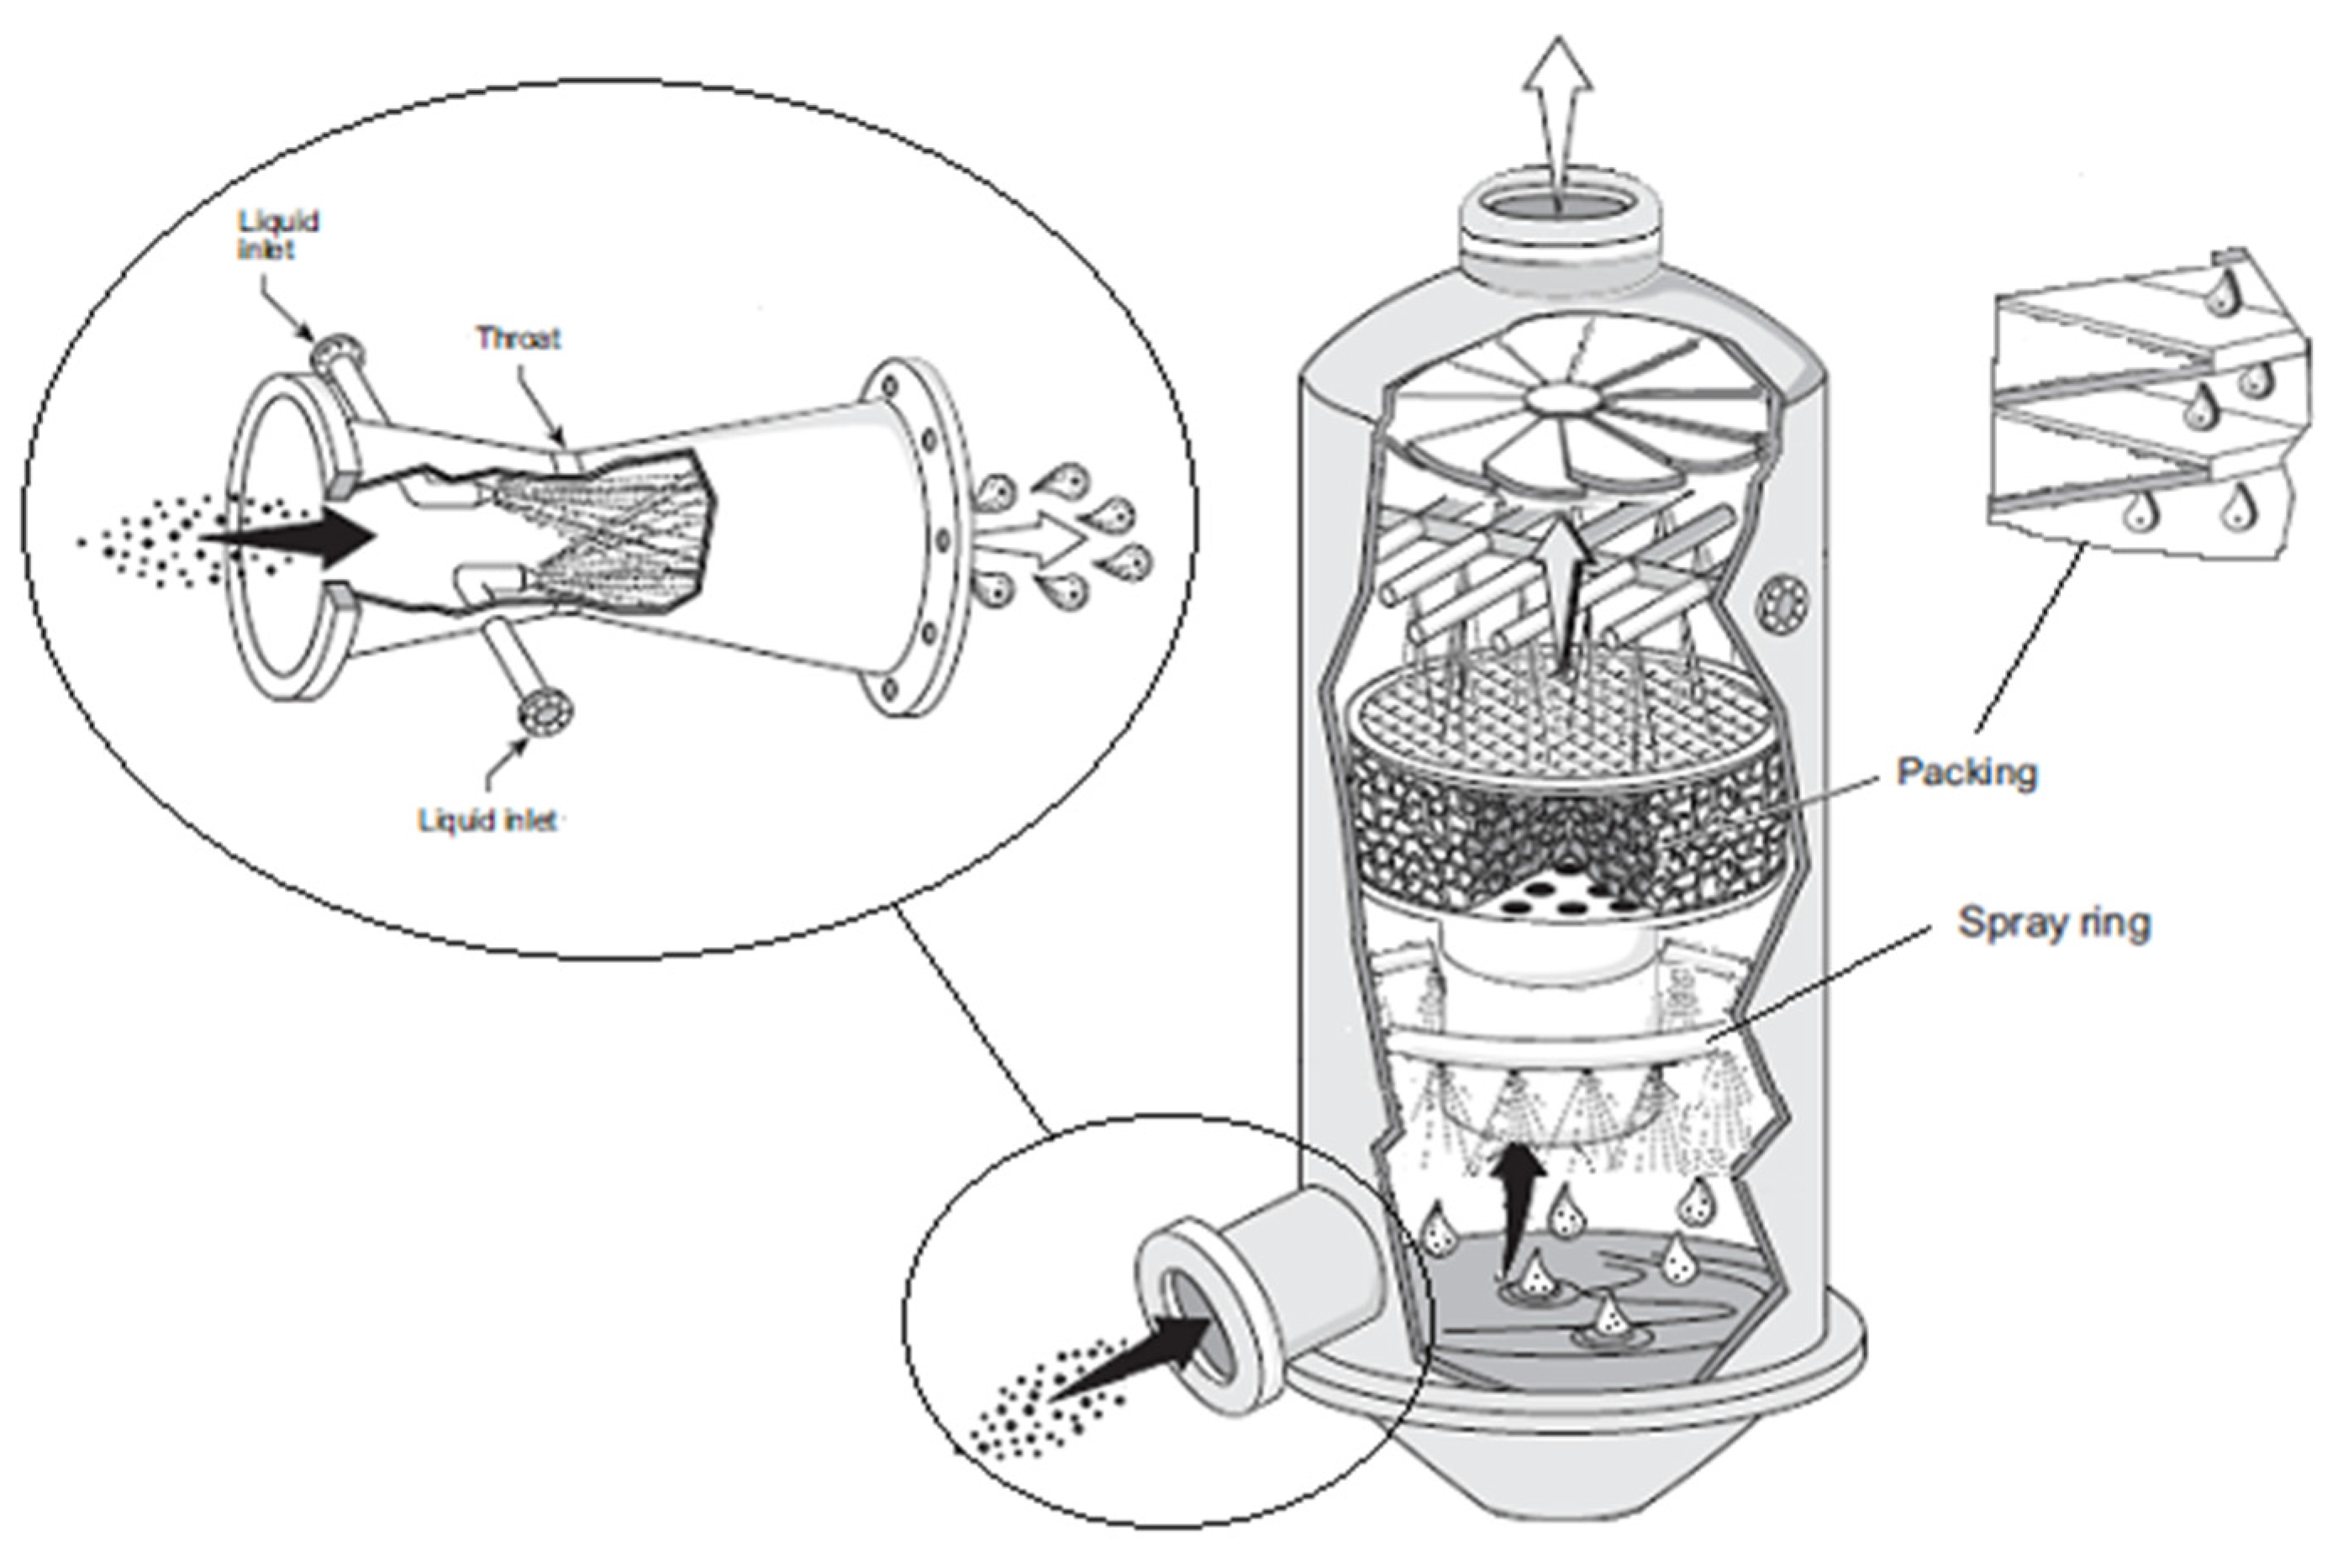
2.1. Description of the Urban Scrubber

The air pollution abatement device that can be installed as a cluster in confined, semi-confined and urban areas is a patented prototype of a small three-stage wet scrubber [17,18]. The operating sketch of the system is shown in Figure 1 [19].
An extractor fan creates an air pressure drop of about 300 Pa inside the system, ensuring an incoming flow-rate of about 2000 m3/h through two inlet paths (vin 20 m/s). The first air processing stage is composed of two weak Venturi ejectors, efficient in the capture of particulate matter (PM) larger than 1 µm in diameter. The relative velocity between PM and the inlet liquid droplets (ranging from 50 to 2000 µm in diameter), sprayed in the throat of the ejectors, is the main parameter that influences the PM capturing process. Furthermore, an increase in the PM capture efficiency is observed, as the droplet size is reduced and the density of droplets increased. The second stage is composed of a small shower scrubber. A spray ring around the container generates a huge concentration of small liquid drops (ranging from 0.1 to 1000 µm in diameter) in order to maximize the interaction between the incoming pollutants flow and the liquid counterflow. This stage is very suitable for the abatement of gaseous pollutants and particulate matter. The gas capture takes place by means of dissolution processes in the liquid drops. For this reason, the solubility of the gas in the liquid is crucial, so that it is possible to add some additives to the liquid in order to increase the gas solubility. The aerodynamic configuration of the system in this stage ensures a high mixing degree between the two phases and a long residence time of the mixture: consequently, this guarantees a satisfactory dissolution of the gas into the liquid. Finally, the third stage is a variable deposition stack where the air flow is forced to pass through a series of wet plates with properly arranged holes. The air flow undergoes a series of alternating compression and expansion phases in order to force the deposition of pollutants onto the wet plate surfaces. Currently, the scrubber requires an electrical power of 550 W, with a resulting noise of 55 dBA/m. The collected wastewater, containing all the atmospheric substances captured in the process, needs to be treated, according to the environmental regulations (industrial wastewater management system or municipal water treatment plants).
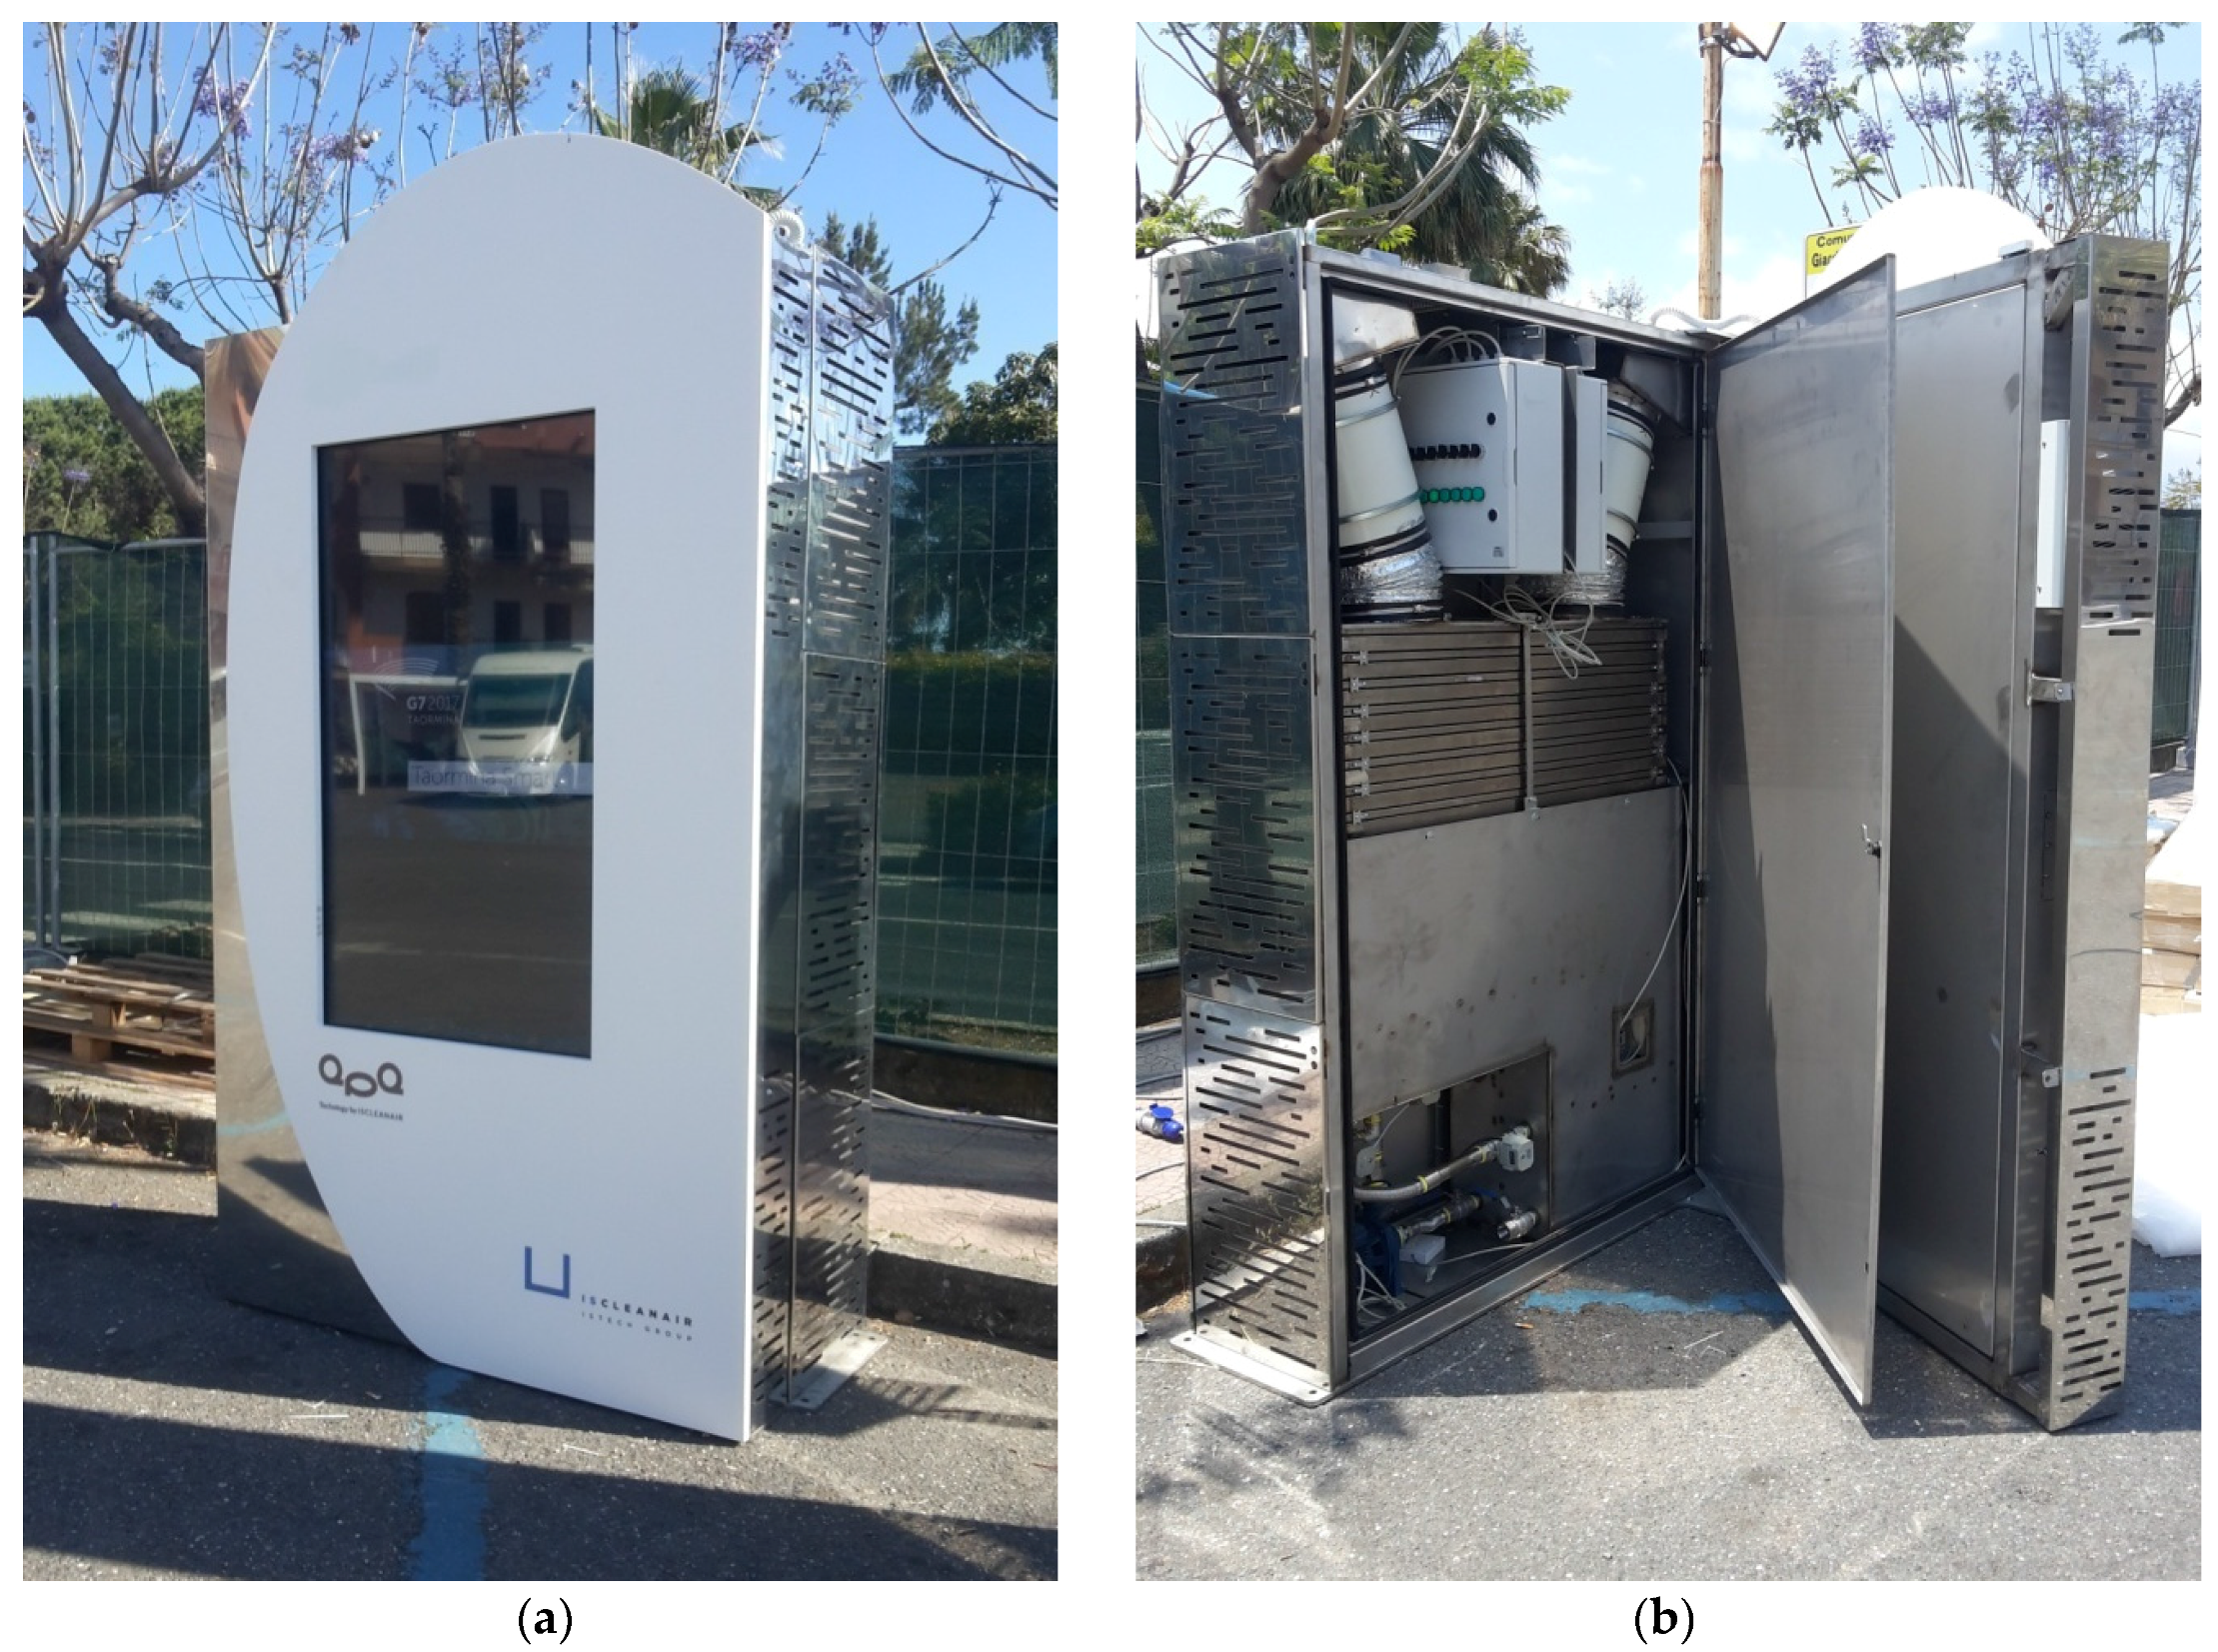
Different urban design solutions of the APA technology have been implemented in order to make it completely camouflaged and integrated into areas of use. Hence, it is possible to have air cleaner systems while providing other services for citizens (communication and co-marketing, info point, wi-fi, video surveillance). In particular, for the pilot remediation project of L’Aquila’s urban environment, the APA technology has been incorporated within a multimedial totem with a size of 1300 × 400 × 2100 mm. The device is shown in Figure 2.
Every system is also equipped with a monitoring station of the main air pollutants and environmental parameters, creating, when fully implemented, a dense distributed network in that urban area, with easy monitoring and processing of sensible atmospheric data and environmental information, at a broad scale. The gas sensors used are of the MQ-type, based on electrochemical and semiconductor technology, SnO2 sensitive material, with lower electrical conductivity in clean air. They are calibrated directly in S.P.In laboratories, in collaboration with the Department of Industrial Engineering, Information and Economics of the University of L’Aquila. Those sensors allow a continuous real-time monitoring of light gas concentration in the air, such as CO, NOx, SOx, C6H6, CH4, particulate matter PM0.5–PM1, PM1–PM3, PM3–PM5, PM5–PM10, PM>10, and physico-chemical data such as air temperature, pressure and relative humidity. In addition to the environmental and weather parameters, the on-board electronic system monitors many internal process parameters to control the correct operating conditions of the device. All the data are sent to a cloud database platform where in real time there is access to all data and it is possible to operate the systems.

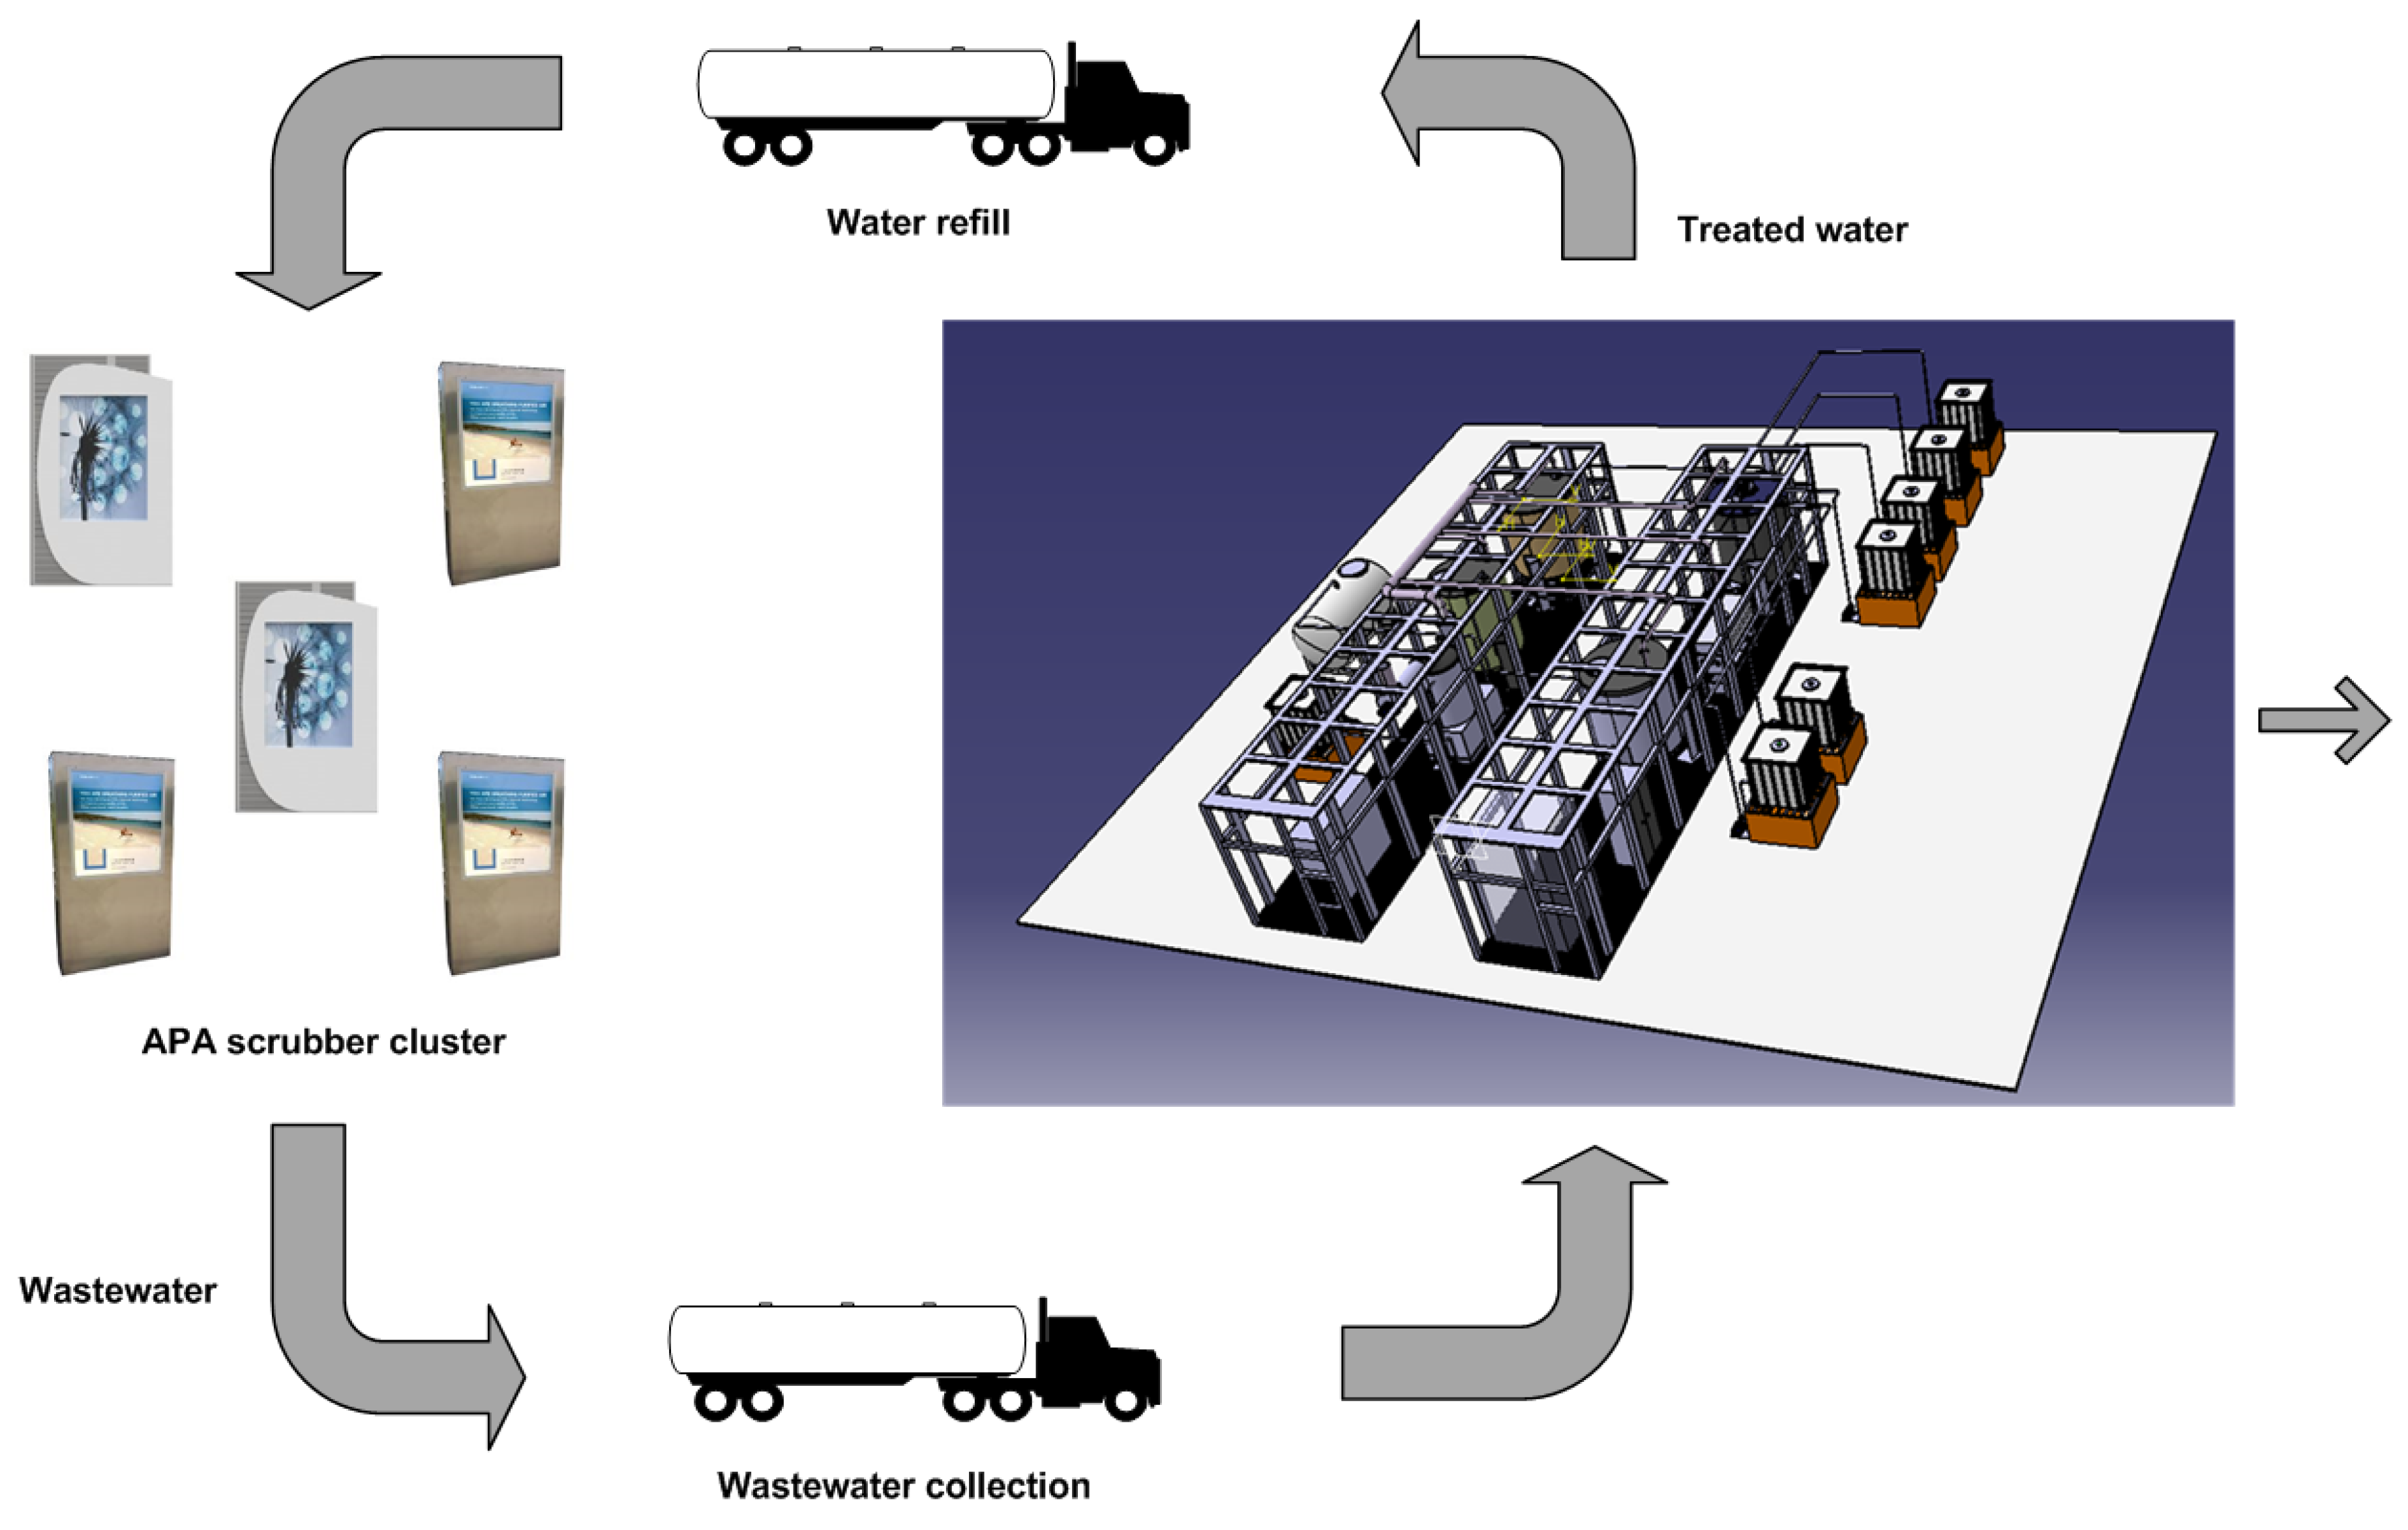
2.2. Brief Description of the Wastewater Treatment Plant

The wastewater coming from APA scrubbers, containing the atmospheric contaminants captured from air, needs to be treated to comply with the Italian environmental regulation D.Lgs. 152/2006, whose limits depend on the final destination of the treated water (sewage network, water body or an industrial-district wastewater treatment plant). Nevertheless, as the zero liquid discharge (ZLD) policy is one of the topics to pursue in the project, the wastewater treatment plant (WWTP) was designed in order to achieve a higher quality of the treated water that makes it suitable to be reused in the APA scrubbers. Such recycling closes the loop of the water cycle and makes the entire APA project more environmentally friendly.
The design of the pilot plant for treatment of water coming from the cluster of APA scrubbers installed in different areas of the city was carried out with the aim of versatility and flexibility of use. For this reason, a skid-mounted mobile plant was chosen. In particular, the plant is assembled on two skids that can be housed in two 40 ft standard containers: thus, the system is mobile and can be transported where required. The treatment is composed of a series of physico-chemical stages like filtration, coagulation, adsorption and advanced oxidation processes. The concept of the plant is shown in Figure 3.
The wastewater pilot plant (WPP) was designed according to the optimal conditions set up in the experimental campaign. The basic hypothesis was that APA scrubbers are installed in different places around the city, such as bus stations, malls, car parking lots, squares and roads; the maximum distance between two consecutive devices is 25 m, in order to have the maximum abatement effect. Another hypothesis was the total number of scrubbers, i.e., 100, that is the minimum reasonable number of devices that should be installed in an Italian medium city with 150,000 inhabitants. Each scrubber is filled with 200–250 L of aqueous solution, and every month the wastewater of each device is partially collected and replaced with fresh solution. The WPP has a nominal capacity of 3 m3/batch for 1 batch/day that lasts 8 h. The aqueous solution in the APA scrubber’s tanks tends to decrease because of air flow transportation and evaporation, which is much stronger during the spring-summer season.
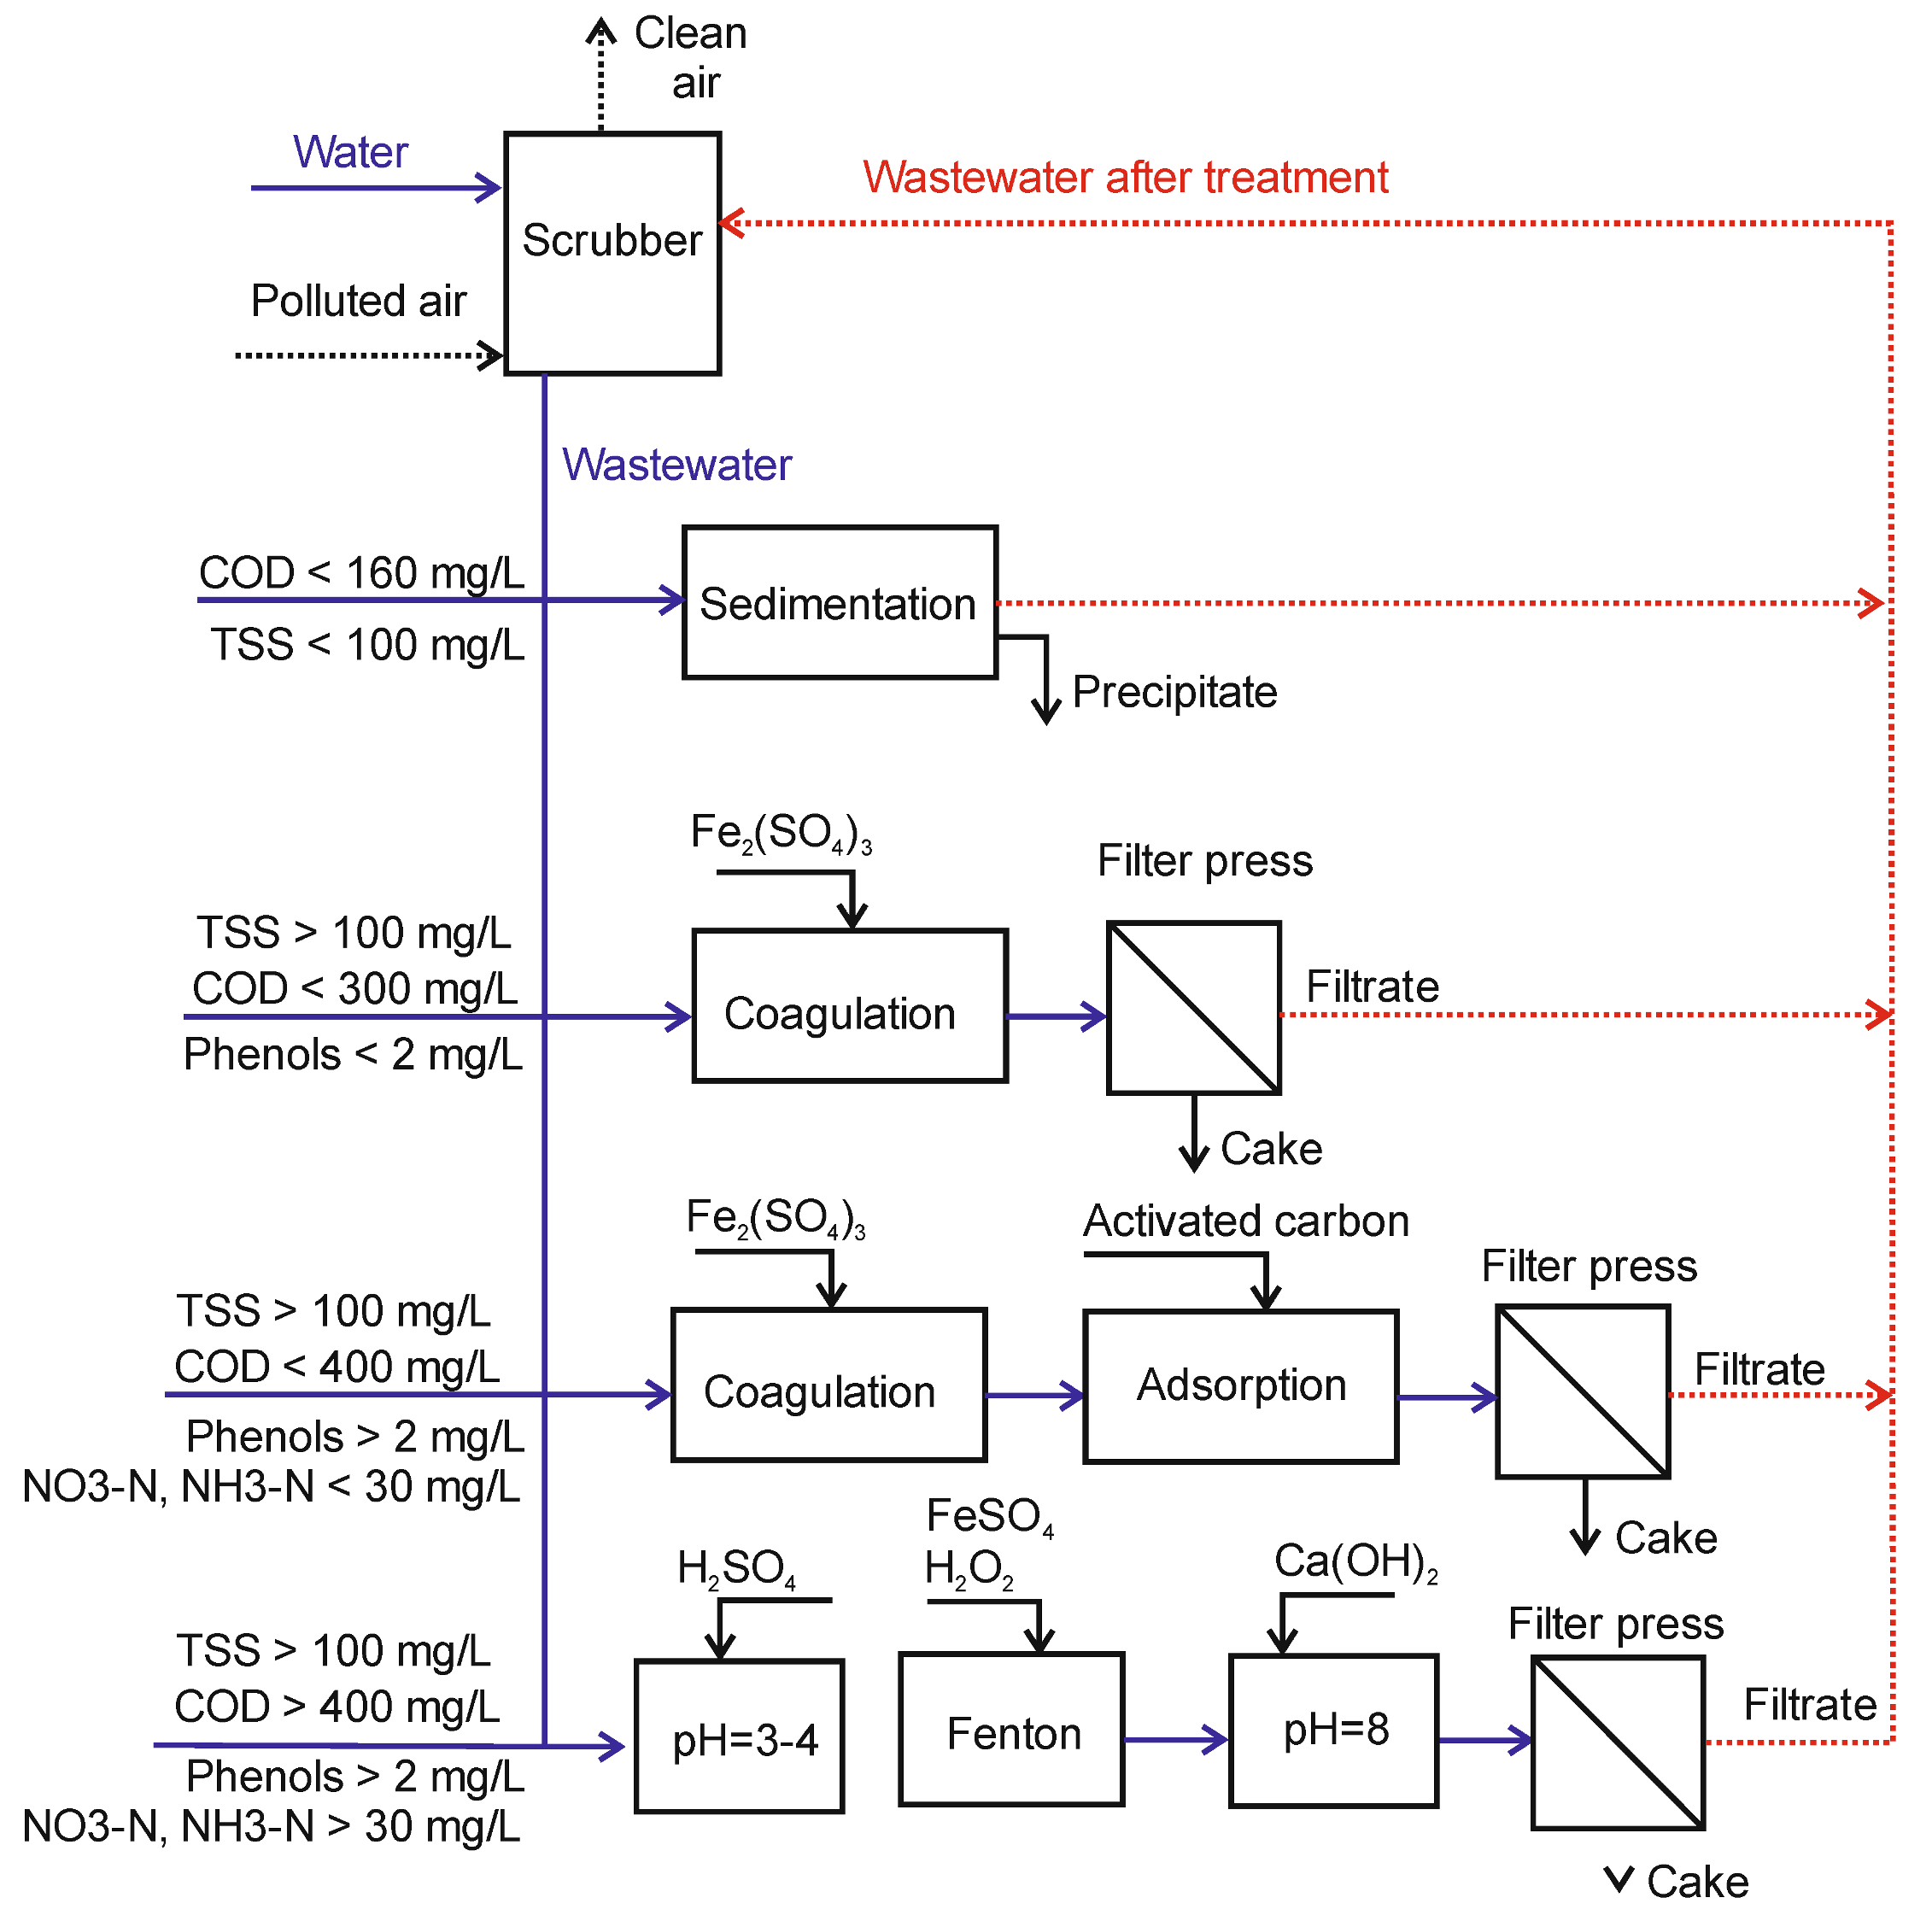
Several operations are carried out at the WPP, usually combined in different sequences, that depend on the characteristics of the waste solution. The goal of the integrated treatment is to reduce the amount of pollutants, mainly represented by total suspended and dissolved solids (TSS and TDS), chemical oxygen demand (COD), metals, nitrates and organics. The treatment stages of the WPP are shown in Figure 4.
The process includes sedimentation of TSS, pH adjustment, coagulation, the Fenton process and basification up to pH 8. Activated carbon can be used for adsorption of organics resulting from condensation of exhaust car gas, and recalcitrant pollutants that could be dissolved in the wastewater. The sludge obtained from such treatment is separated by filtration, dehydrated and stored for landfilling. The treated water is thus stored in one tank and used to refill APA scrubbers: a small tanker truck, equipped with a centrifugal pump, is used for this purpose. As previously stated, two skids are required for all the equipment. This technical solution guarantees adequate openings for ordinary and maintenance operations. The plant is also equipped with a compressor, plastic tanks containing the chemical reagents, electrical connections and one PLC panel. The main equipment includes storage tanks for chemical reagents (ferric and ferrous sulfate, polyethylene, lime, hydrogen peroxide, sulfuric acid and sodium hydroxide); storage tanks for wastewater, treated water, processing tanks and one reactor; plate & frame filter; a compressor and scrubber. As regards the equipment materials, polypropylene was chosen for reactors and tanks, whereas AISI (American Iron and Steel Institute) 304 stainless steel was used for pumps and pipelines.

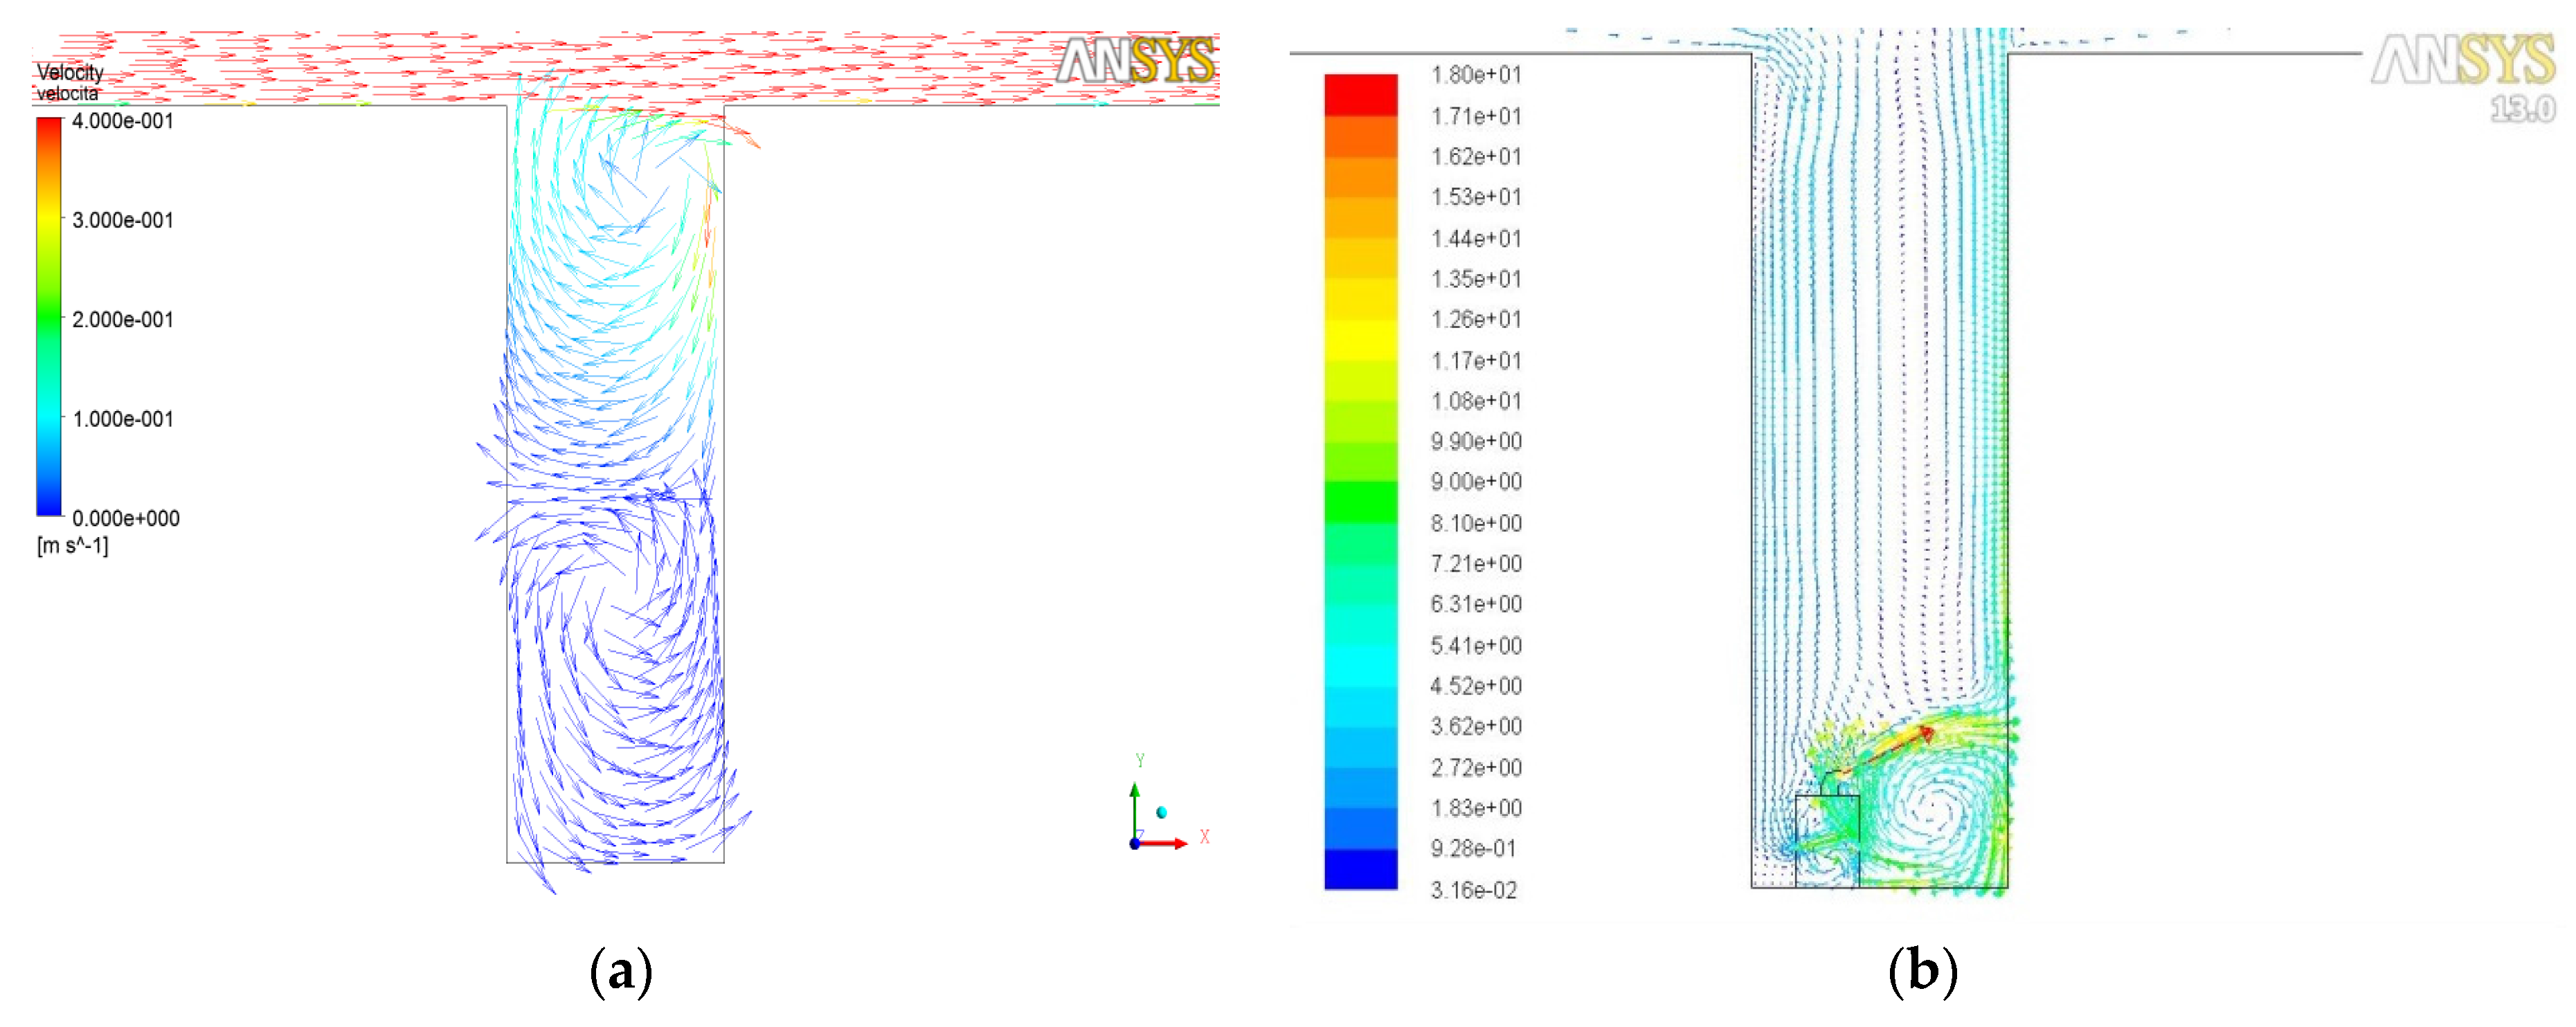
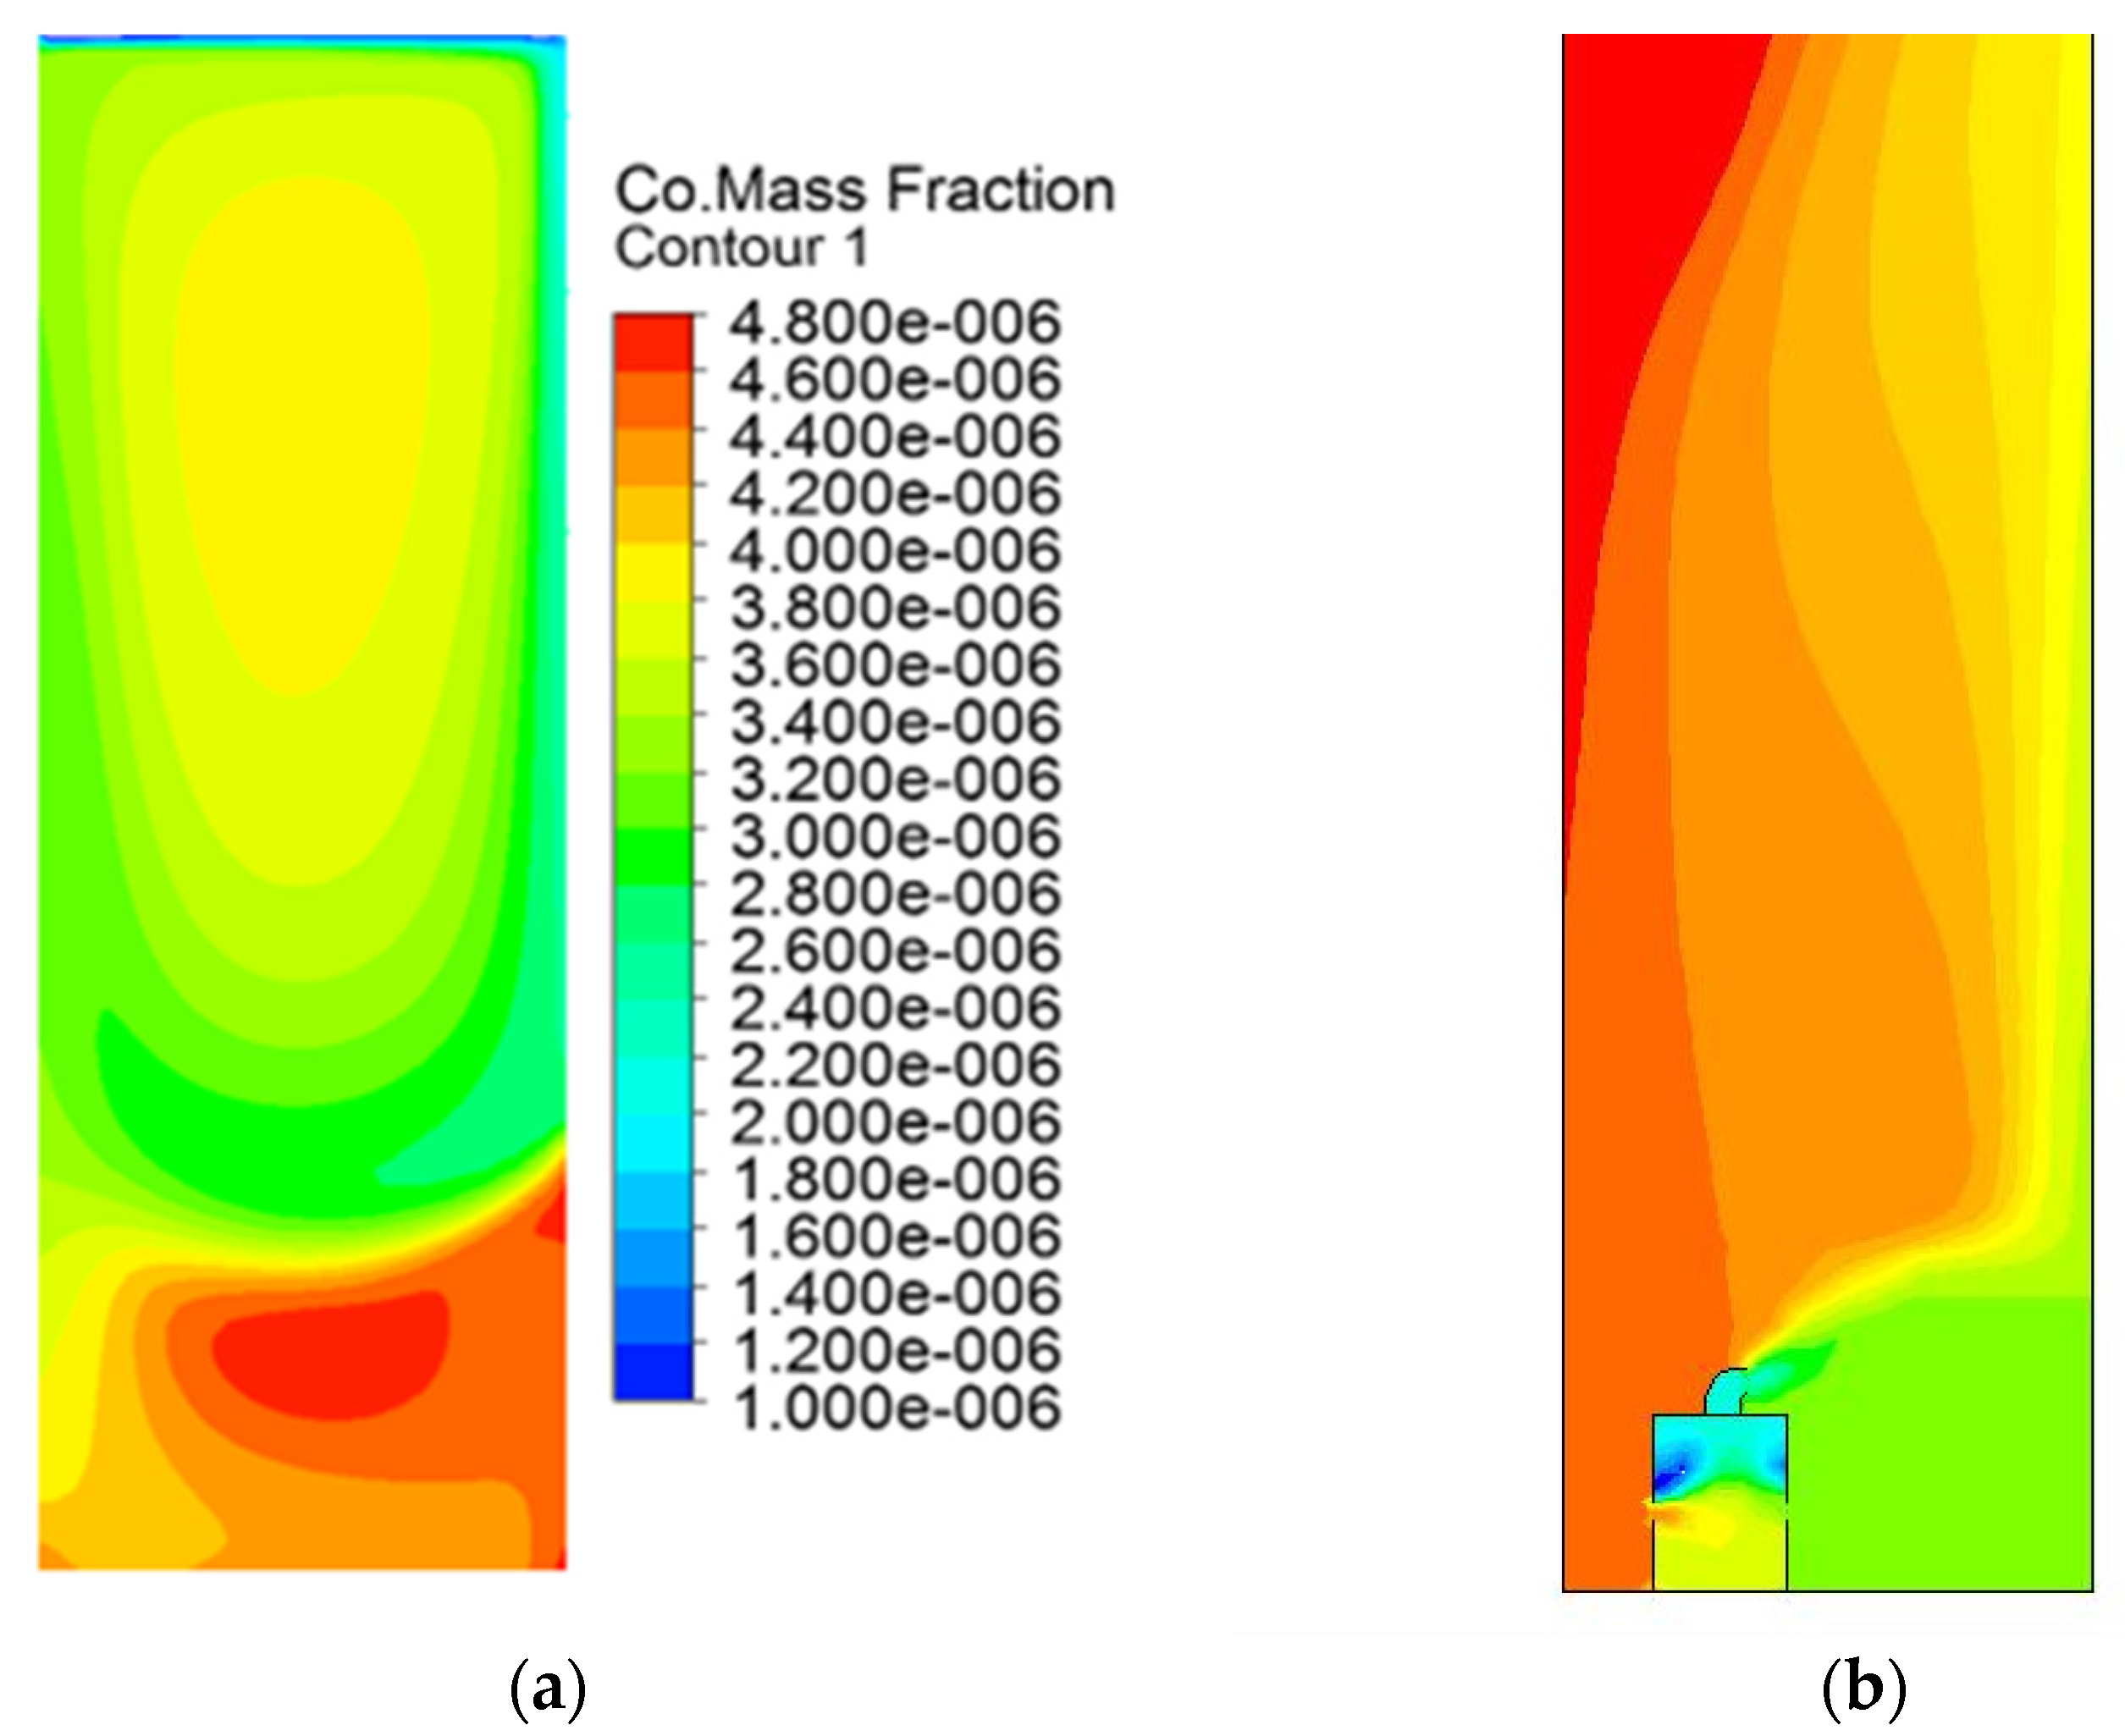
2.3. Deep Street Canyon Case and CFD Model—Boundary Conditions

A street canyon is an urban street surrounded by tall buildings. A fundamental parameter in determining the field of wind flow within the canyon is the aspect ratio H/W, where H is the height of the buildings and W is the width of the street. In this work, deep street canyons with aspect ratios 2 or 3 are considered. According to the literature [20], such configurations, for a wind perpendicular to the street axis, give rise to two counter-rotating vortices. The lower vortex is more isolated and decoupled from the overlying wind structure, and it traps the pollutants, limiting their dispersal into the free atmosphere. This peculiar urban habitat is one of the most favourable for the installation of APA system.
Regarding CFD simulations, the commercial software ANSYS Fluent (version 13.0, ANSYS Inc., Canonsburg, PA, USA) code was employed to simulate the dynamics into a 2-D deep street canyon, like in [21]. The APA scrubber is composed of one cylinder 2.4 m high, including the chimney, with a 1.5 m diameter. The presence of three vents was simulated, two of which were placed on the side walls of the APA (inlets), 80 cm from the ground, while the third (outlet) was positioned at the top of the chimney. An air fan was placed at the base of the chimney and it is characterized by a pressure drop of 309 Pa. Pollutant abatement takes place in the cylindrical scrubber by means of a fictitious chemical reaction with a constant decay of a passive tracer:
t r a c e r + a i r a i r
The rate in Reaction (1) is adjusted in order to reach a desired abatement efficiency of the scrubber. The air to be processed is conveyed into the lateral vents, the pollutants are partly removed by the chemical Reaction (1) and the “purified” air is released from the vent at the top of the chimney.

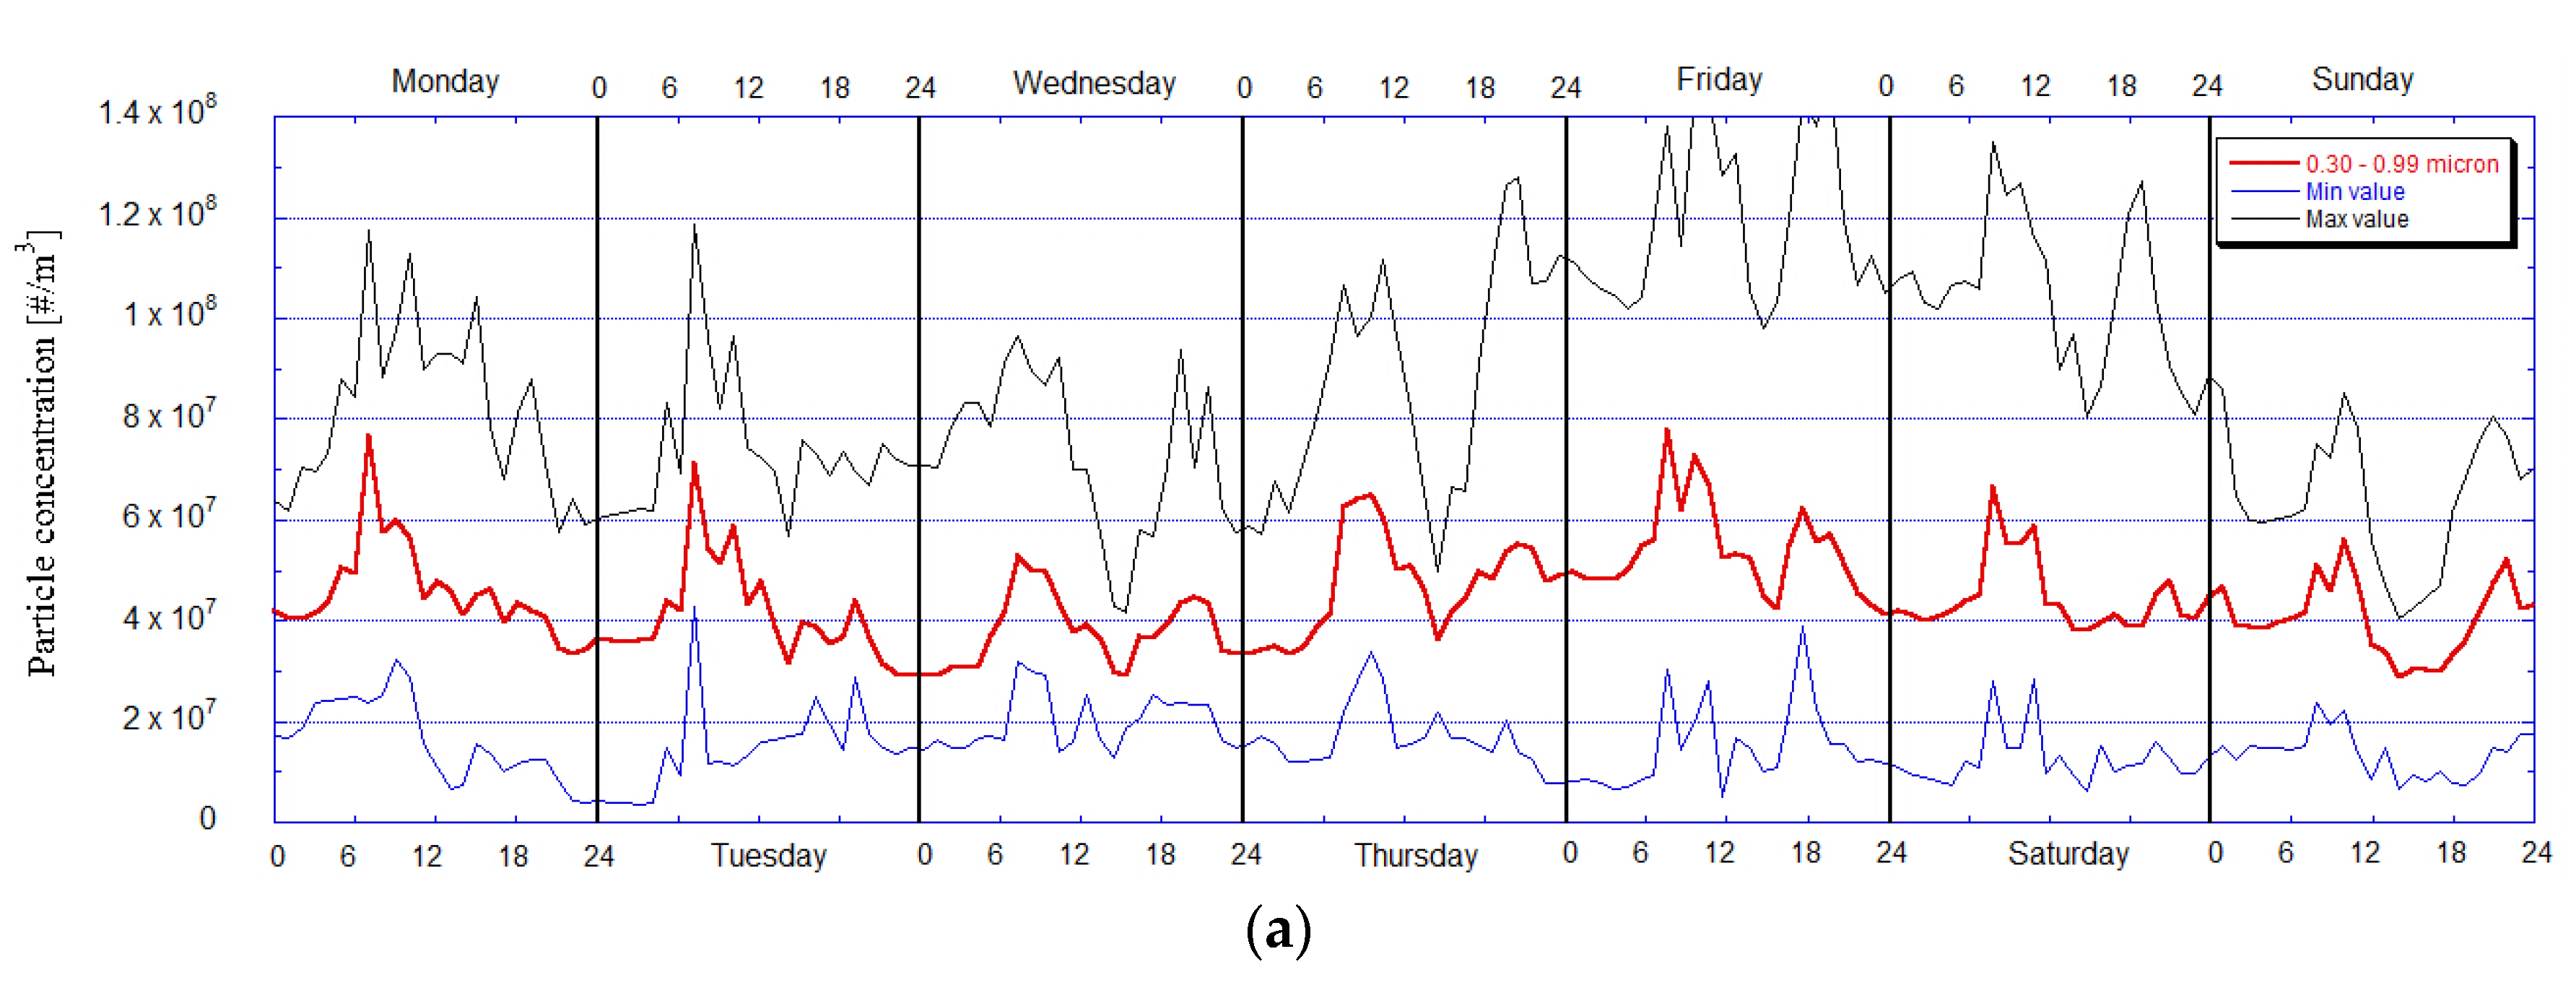
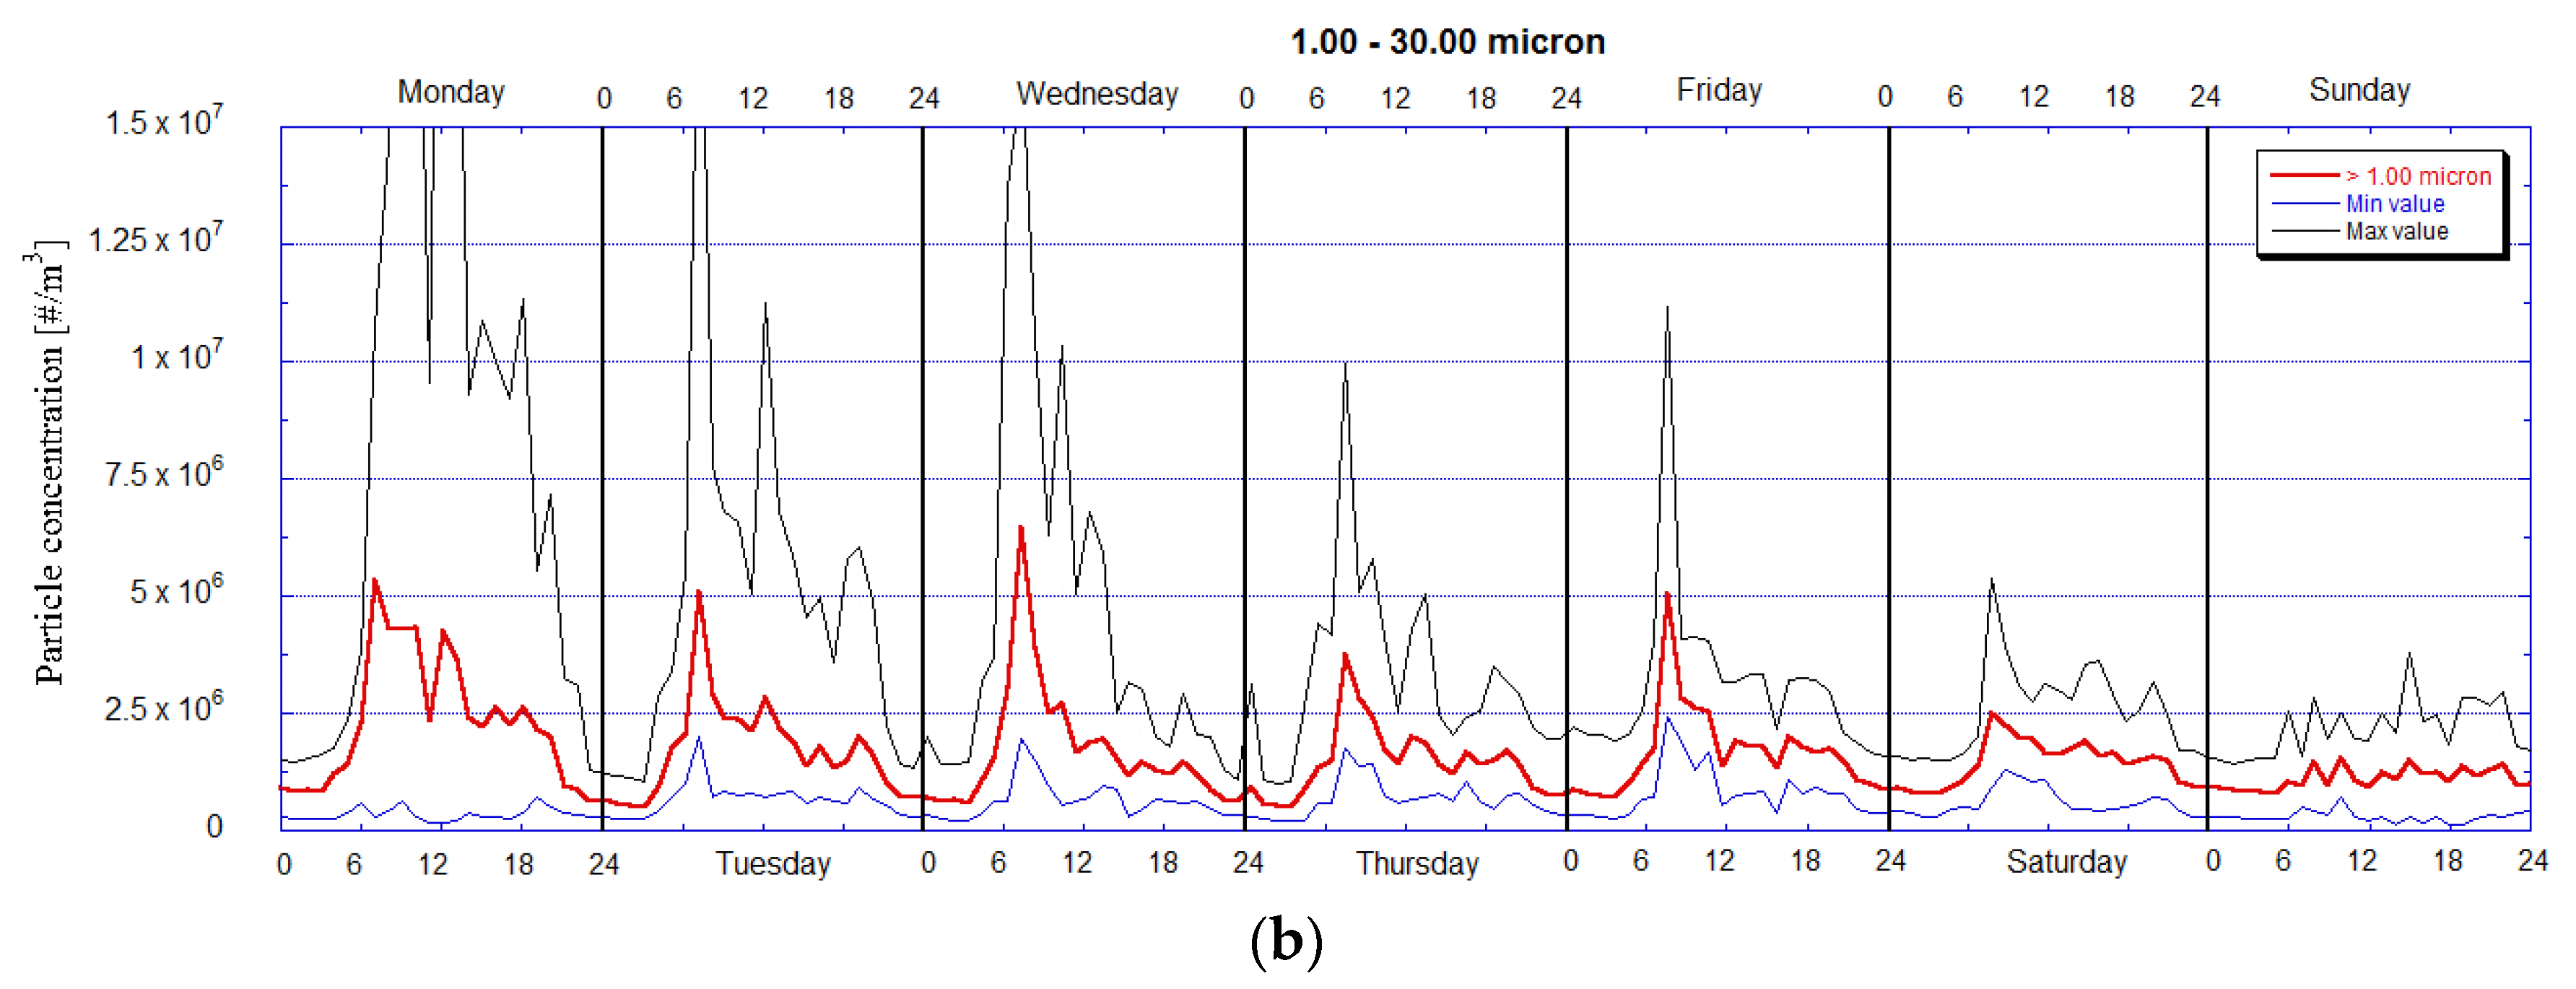
2.4. Air Quality Characterization: Particle Number Measurements

The PM measurements normally refer to the mass concentration, as this is the standard used by the European legislation for the definition of air quality limit values. In the last years, interest in the numerical concentration increased strongly among the members of the scientific community. According to one recent study [22], particle number concentration plays a predominant role in terms of health impact, so the Regulation of the European Commission [
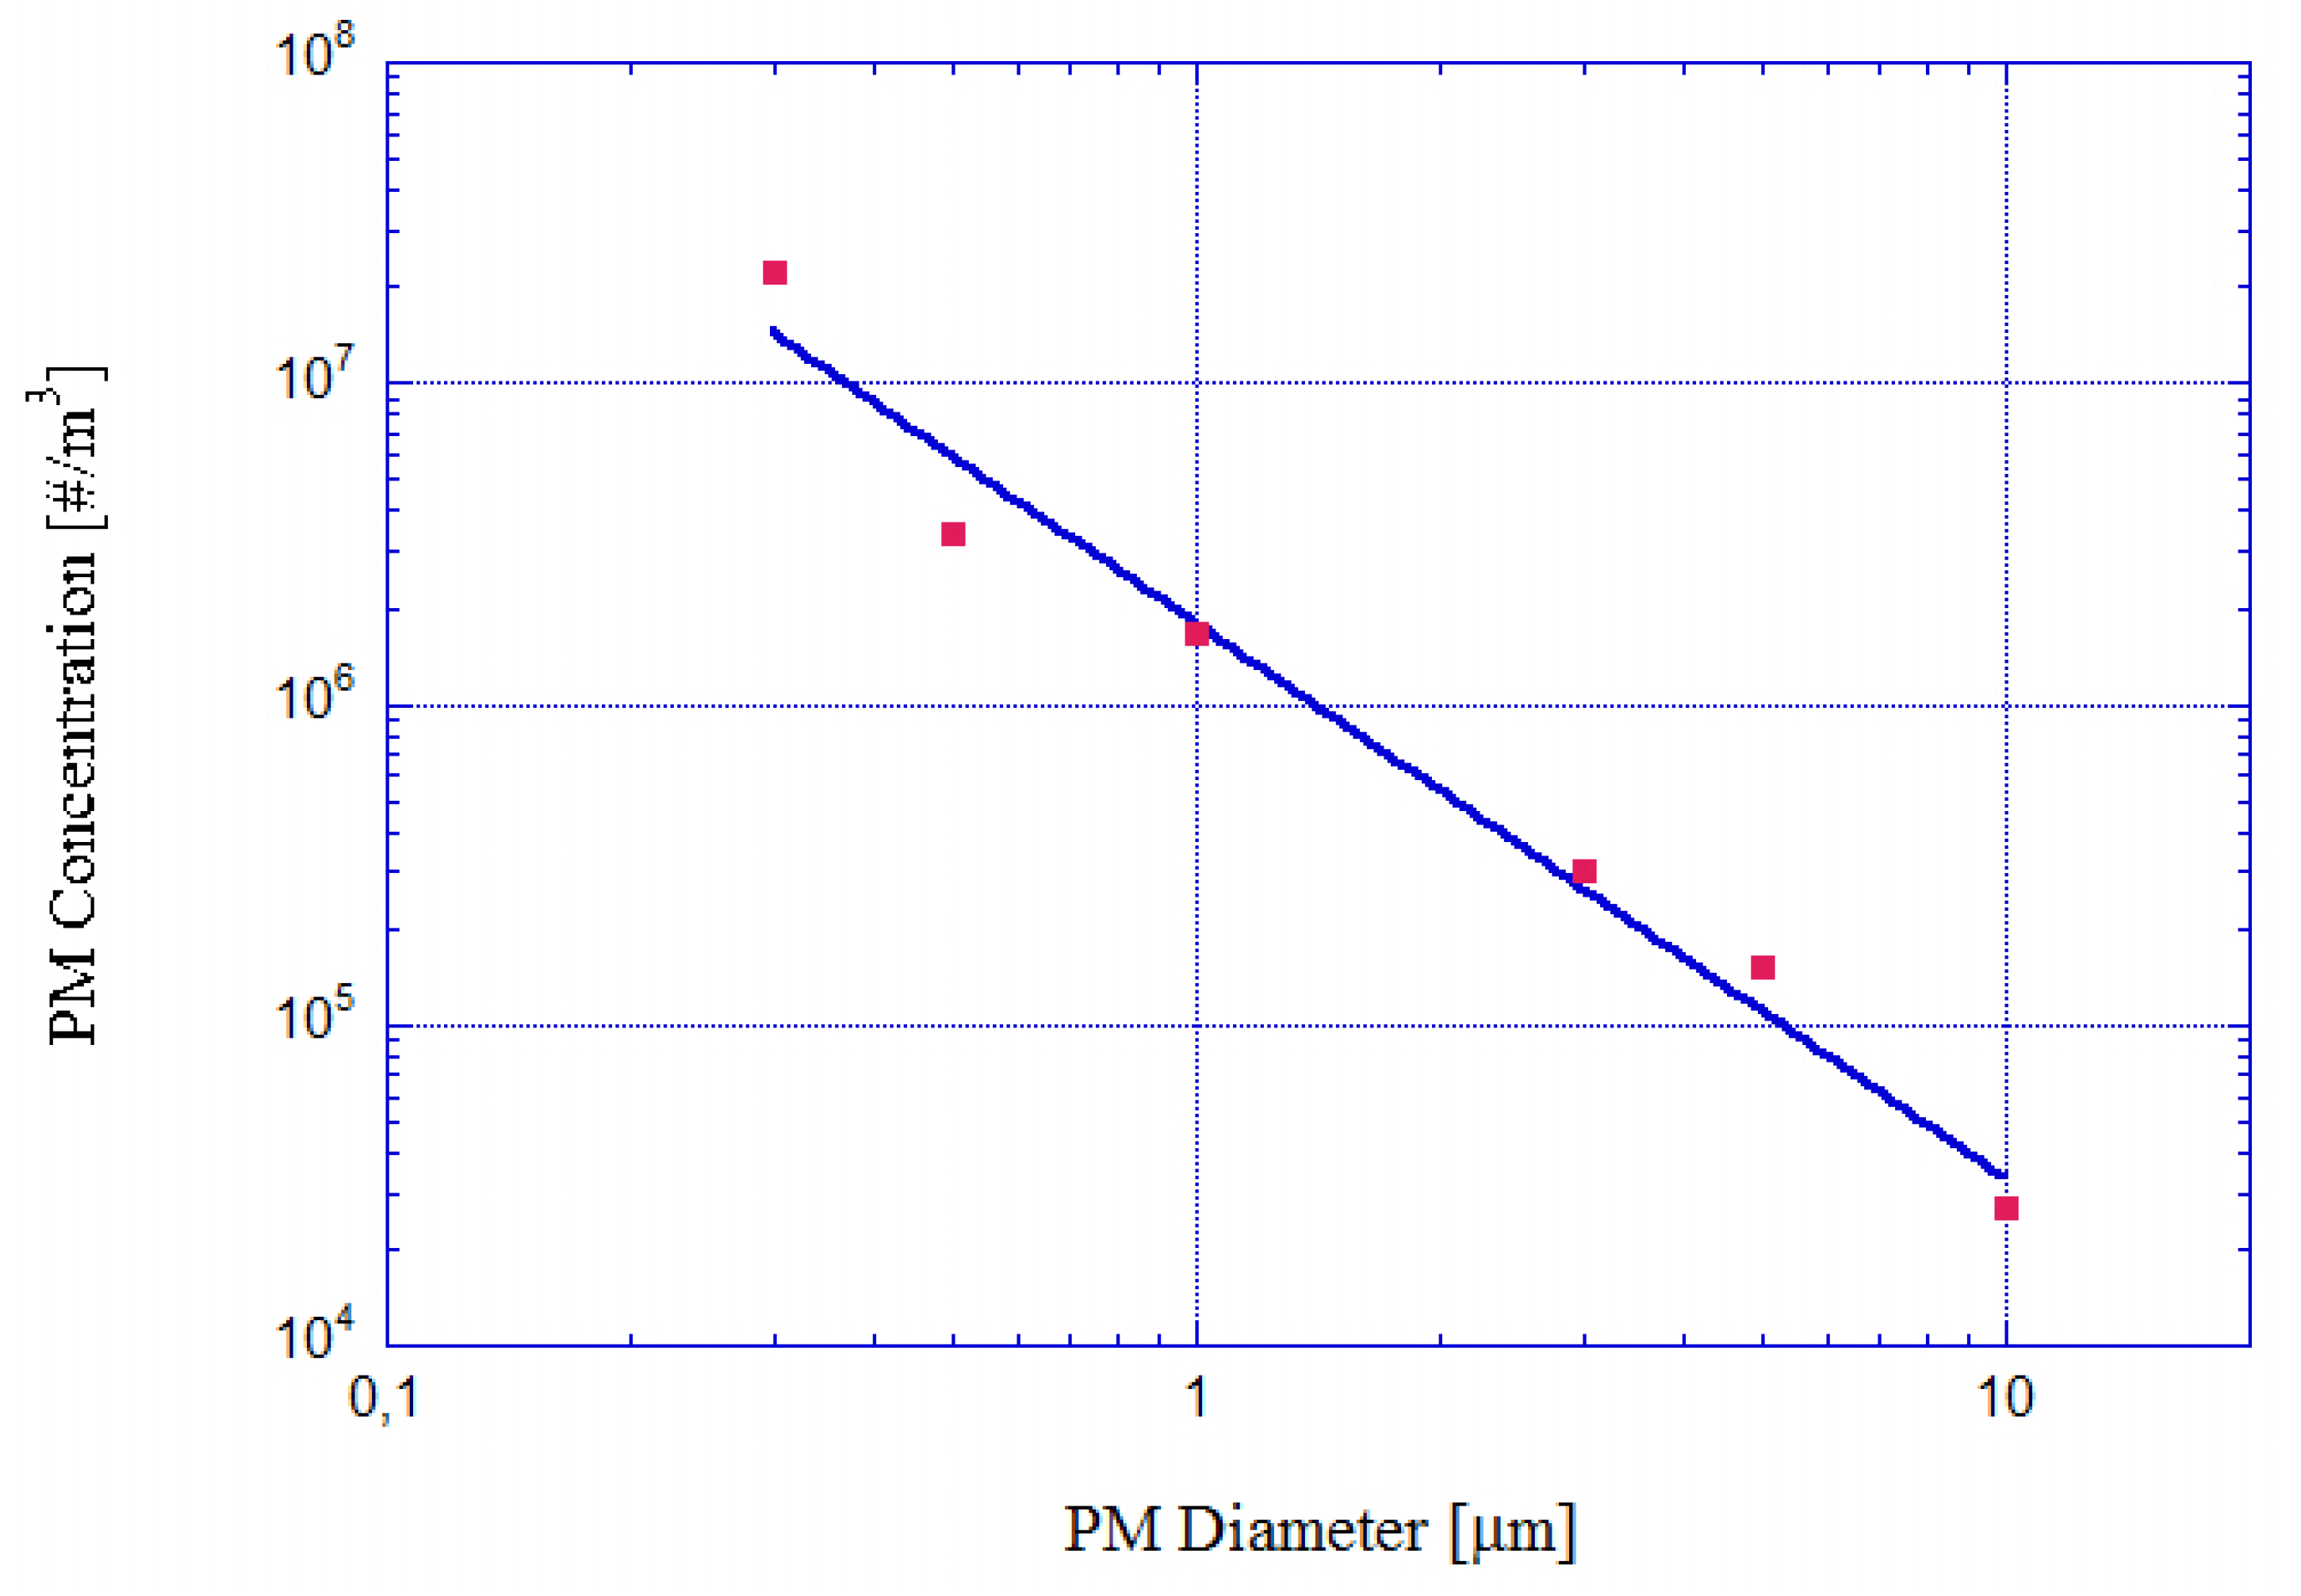
23] established the vehicle emission standards to be defined in terms of particle number. It is known that the numerical concentration distribution is not correlated with the mass concentration and must then be determined independently. In this study, the particle concentration has been measured by means of an Optical Particle Counter (OPC) in 6 size channels in the range 0.30–25 µm. The measurements were carried out with a sampling frequency of 2 min (about 6 liters of air for single sample). The OPC 
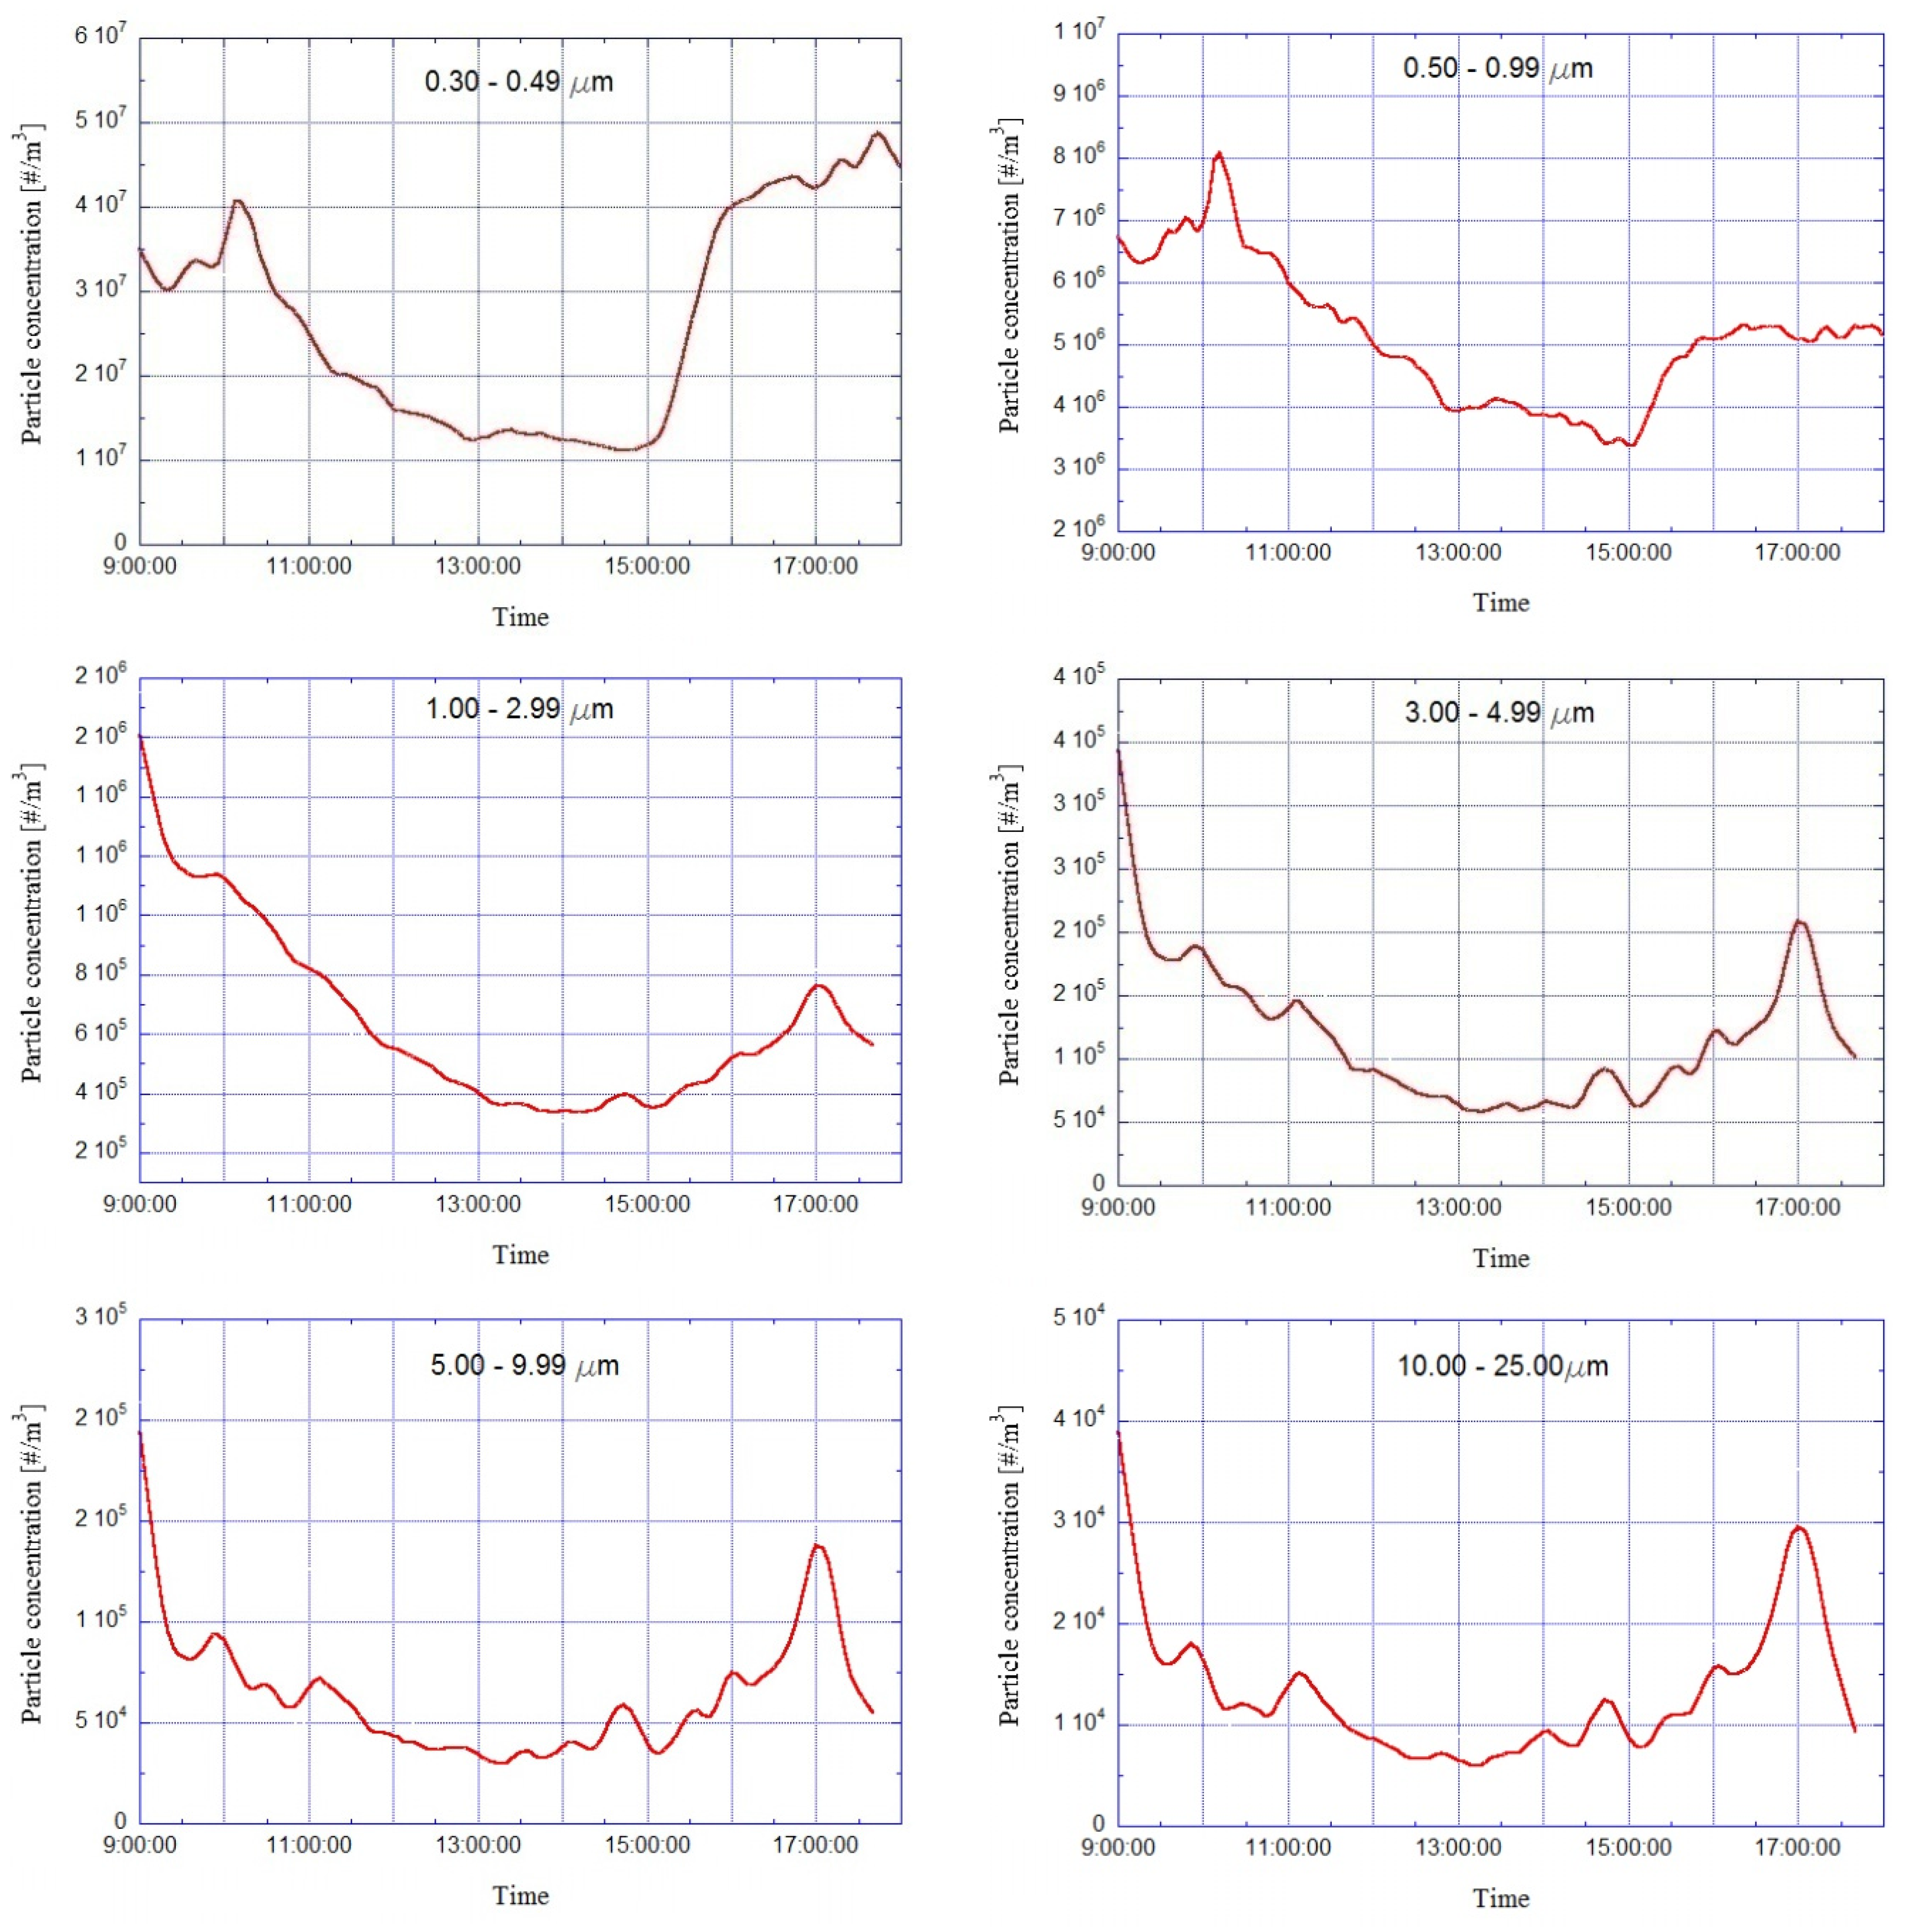
TSI Aero Trak Model 9306-04 complies with all the stringent requirements set forth in ISO 21501-4. The instrument is calibrated with NIST traceable PSL spheres using TSI’s world class Classifier and Condensation Particle Counters, the recognized standard for particle measurements. The instrument collects the particle concentration in the following size classes: 0.30–0.49 µm, 0.50–0.99 µm, 1.00–2.99 µm, 3.00–4.99 µm, 5.00–9.99 µm and 10.00–25.00 µm (fine and coarse particulate matter).

3. Description of the Sites

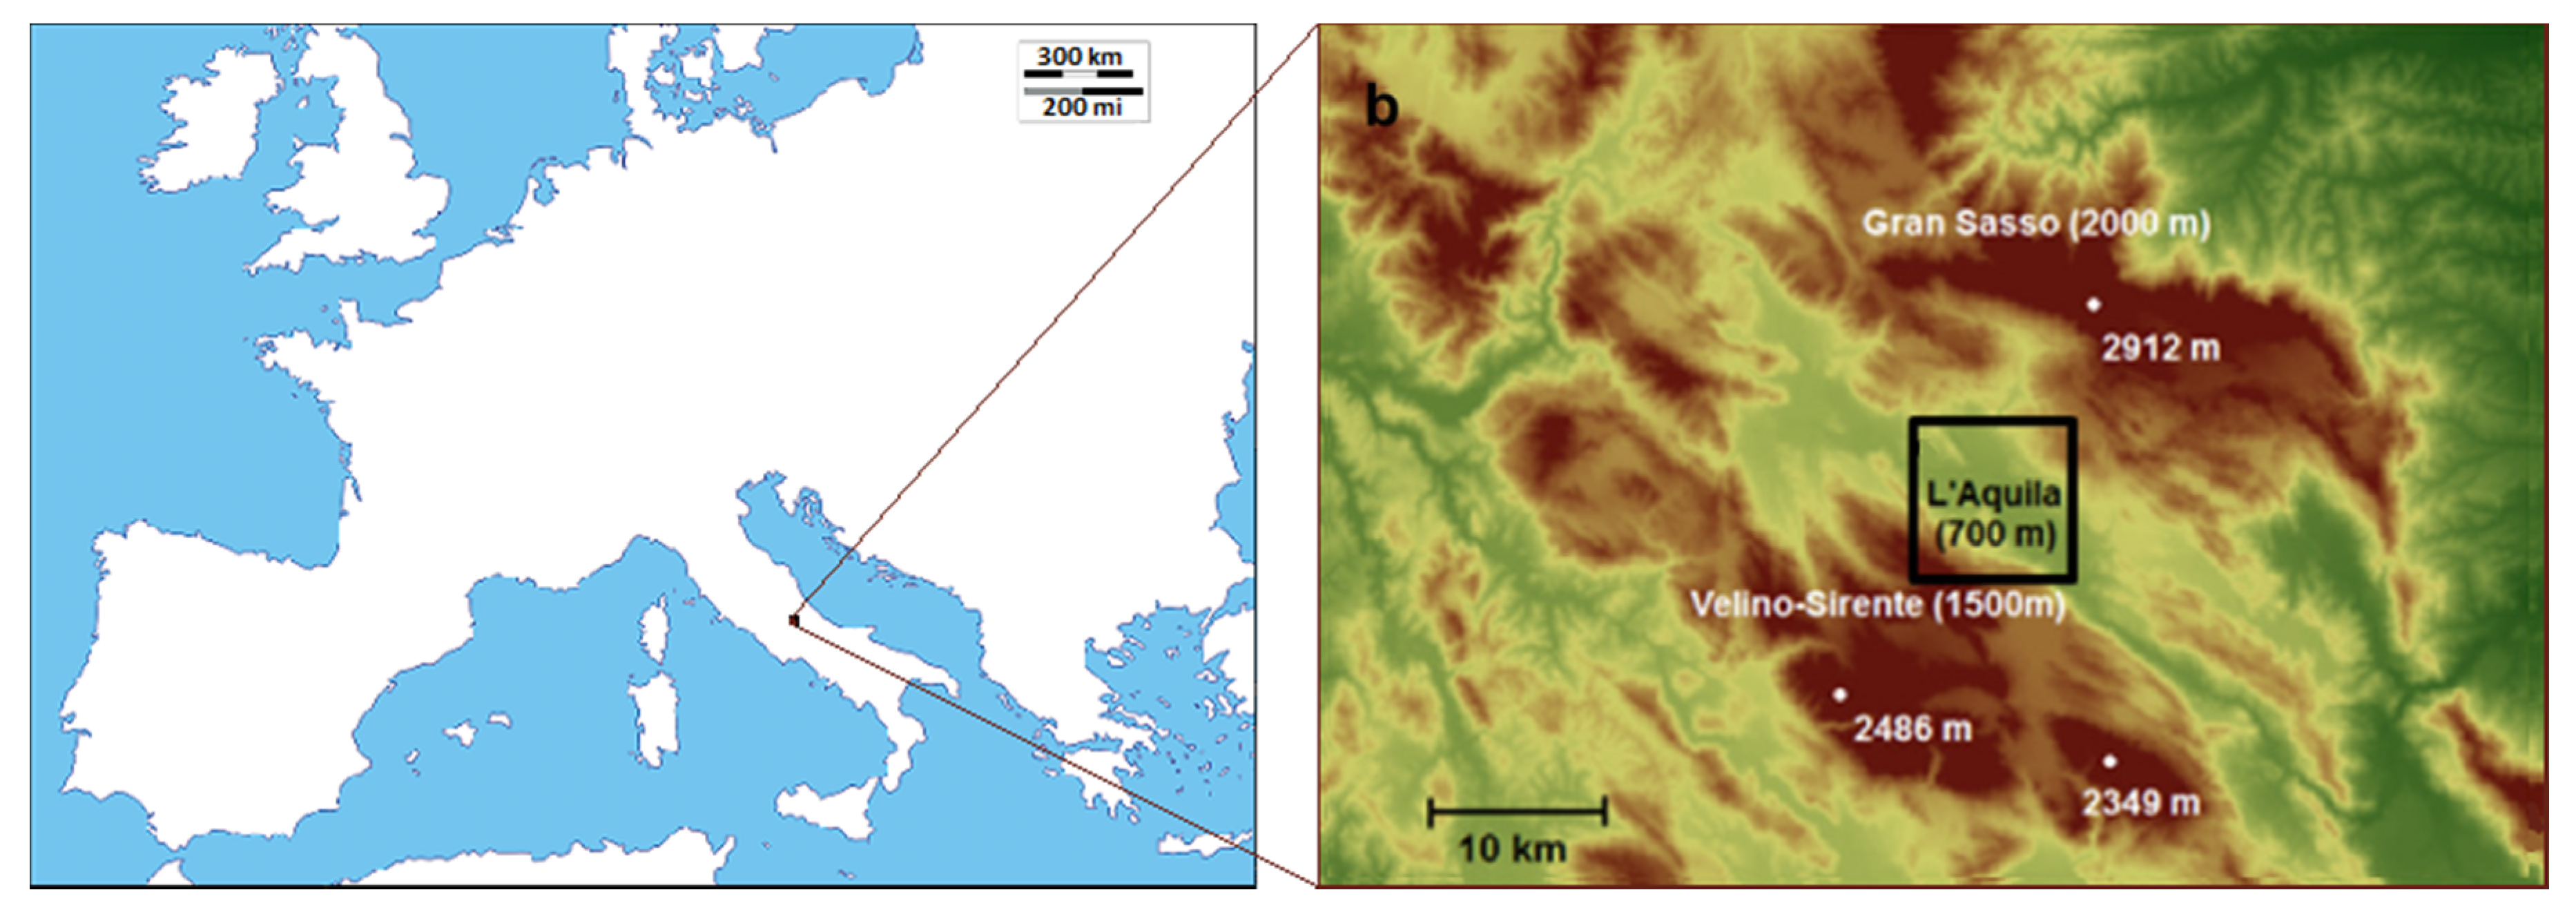
L’Aquila, a city of about 70,000 people, is located in a valley of the Italian Central Appennines, about 700 m above sea level (see Figure 5).
The valley, crossed by the Aterno river, extends about 10 km in width and about 50 km in length, it softly slopes to the South-East, and it is delimited by the Gran Sasso range to the North-East (average height 2000 m, highest peak 2912 m) and by the Sirene-Velino range to the South-West (average height 1500 m, highest peak 2348 m). Such a narrow and relatively deep valley, 800 m, is expected to display a strong decoupling between the synoptic (above ridges top) and the surface (at valley floor, NW-SE axis) winds, and favours the onset of a local thermally-driven circulation [24]. The night air masses descending from the mountains enhance accumulation of cold air at the bottom of the valley and strong thermal inversions, making L’Aquila a relatively cold city in winter (January mean temperature 2.5 °C) and with fresh nights also in summer (July average minimum daily temperature 13.6 °C).
The municipal territory of L'Aquila city extends across an area of 474 km2 (9th largest municipality in Italy). The urban nucleus orography of the city is therefore varied and complex. The different neighborhoods are both on hilly peaks (old town), lying along the mountain slope (Antica Arischia street, Pettino neighborhood), along a valley (SS 17) or long engravings (Strinella street).
After the earthquake of 6 April 2009, the city implemented a complete reorganization of the ordinary road system. Many roads have been expanded, others built to serve new housing of C.A.S.E. projects (Complex Anti-seismic Sustainable and Environmentally friendly) and dozens of temporary housing units placed in the municipal territory. As a result, there has been increasing traffic in the surrounding areas of the downtown, closed to traffic, and in the closest fractions to the city. At the same time, with the reconstruction of many houses and public buildings, many streets are back to pre-earthquake levels of traffic. According to the above considerations and in cooperation with the public administration of the city, two suitable urban sites have been identified to apply the APA technology. The characterization of the local air quality and a simulated study on the scrubber’s effect on environmental parameters in such urban sites have been carried out before APA’s operation.

3.1. Strinella Street and Collemaggio Parking Site

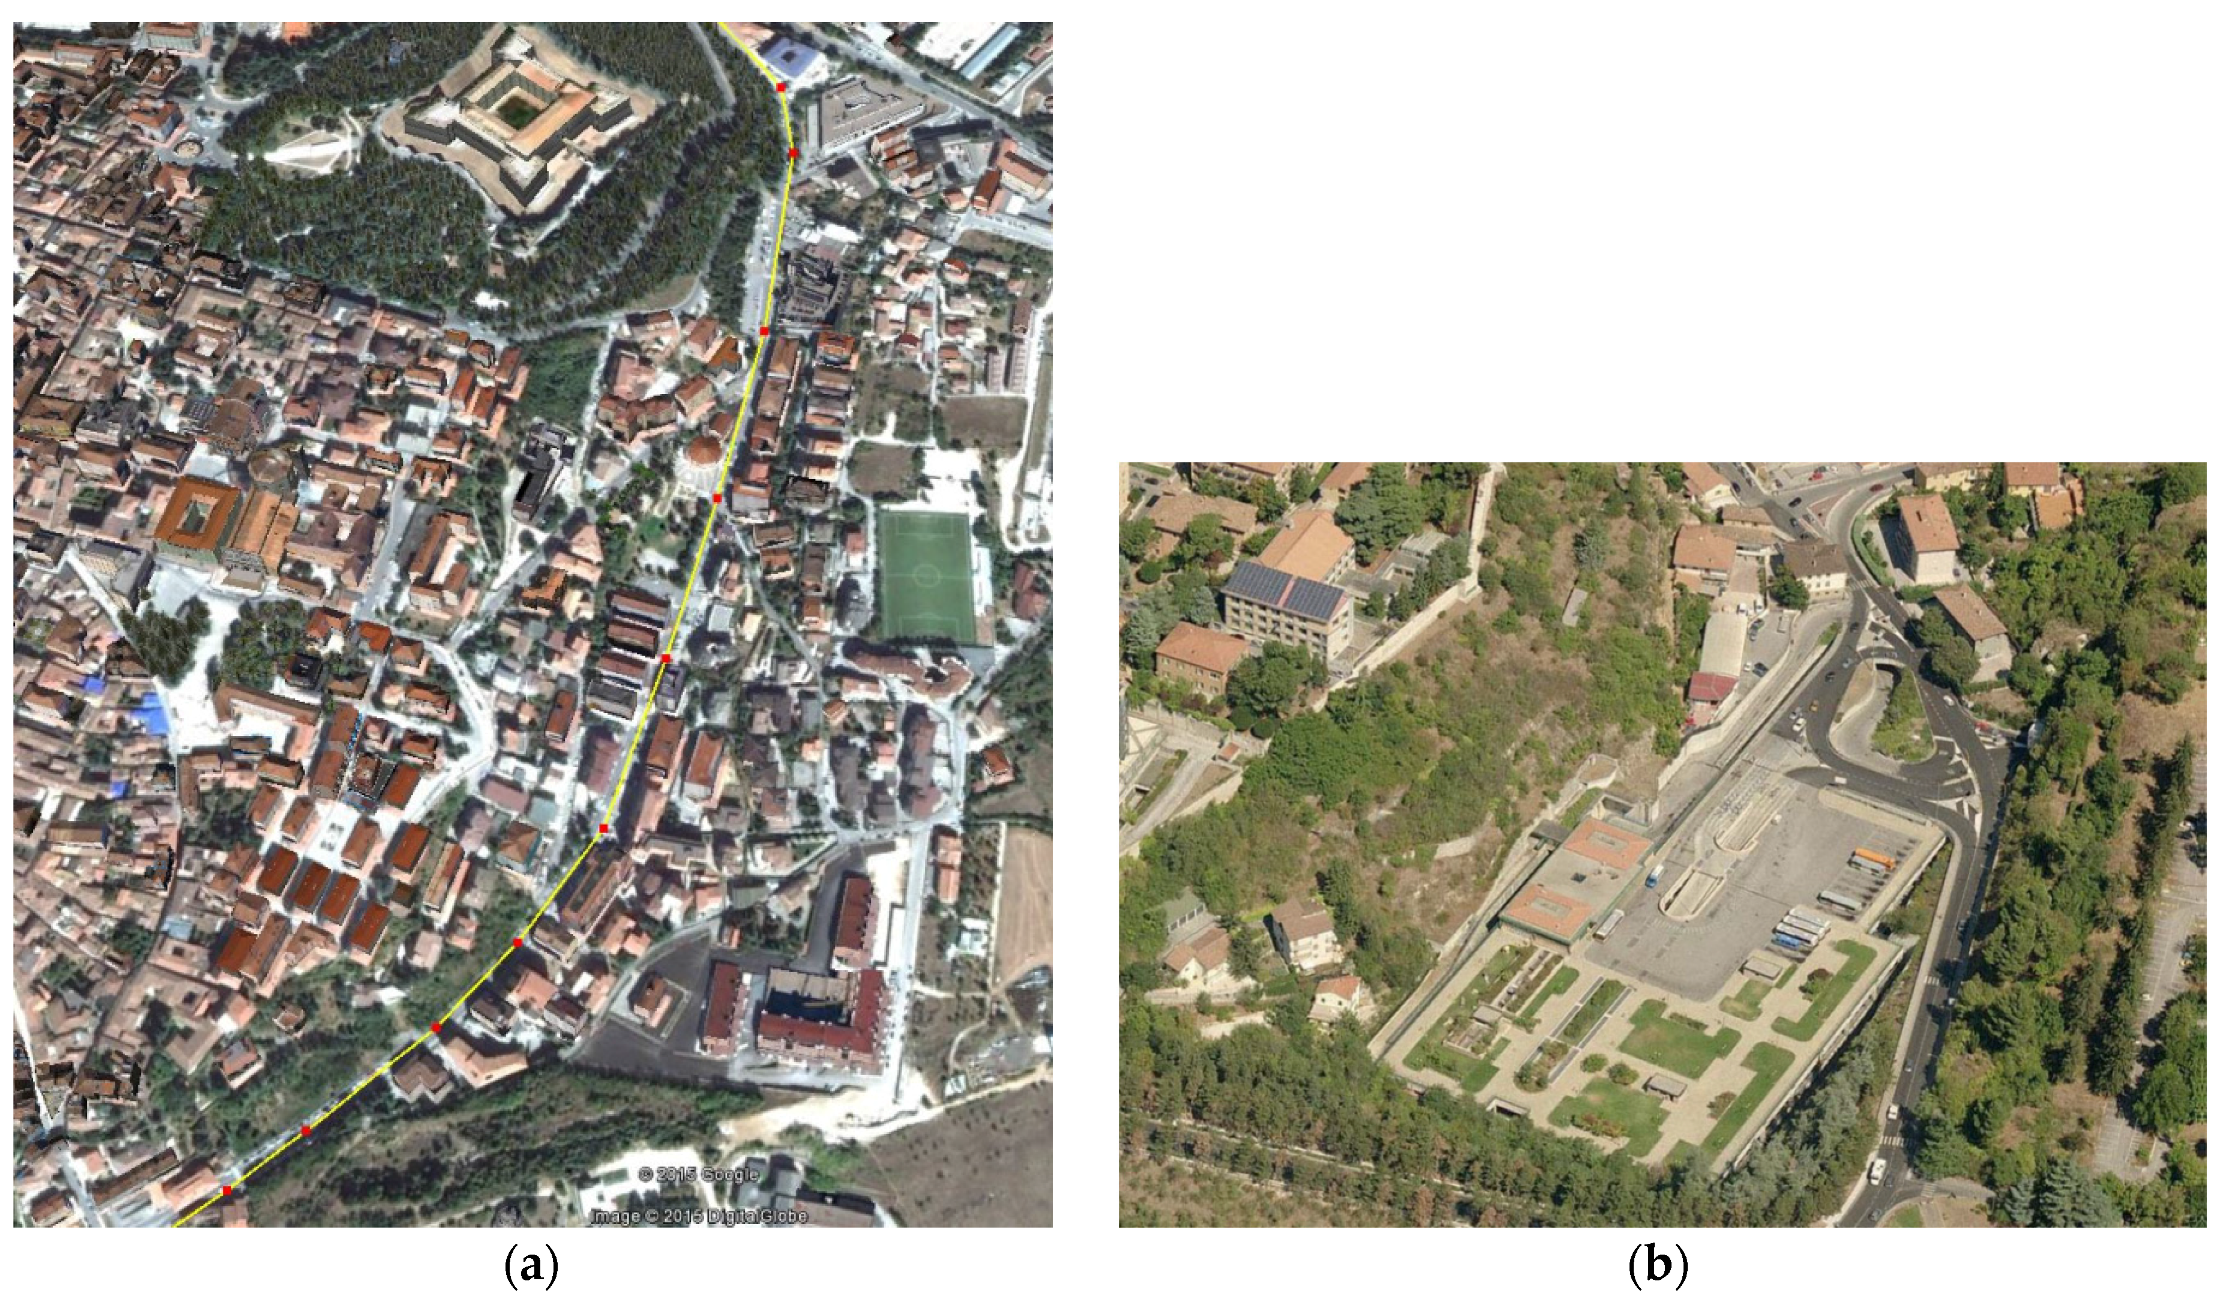
Strinella street is one of the main roads of L’Aquila city and is characterized by a high population density. The street, approximately 1050 m in length, is shown in Figure 6a.
The road lies just east of the old town. Because of the 2009 earthquake, 98% of the buildings that overlook the street have been renovated and/or rebuilt. This aspect is a fundamental factor to obtain veritable air quality measurements as it limits the interference from the significant amount of dust generated in or near a building site. Traffic is continuously monitored from 7 a.m. to 8 p.m. Several commercial activities (shops, bars, offices, malls, supermarkets) and services attract the influx of many public and private means of transportation. Nine bus stops of municipal transportation company are present. A particular conformation of the territory characterizes Strinella street: in fact, the road lies at the bottom of a long and narrow valley, with an average slope of about 3%, in which pollutants are preferentially channeled. The particular orographic conformation of the site and the delimitation of tall buildings (up to 6 floors) make such a street a real deep street canyon characterized by an aspect ratio of 2 or 3, depending on the road section considered, in which the gases emitted from the continuous traffic tend to be stagnant. The emissions from heating systems in buildings, homogeneous along the two sides of the street, tend to worsen the air quality during the winter time, that lasts around 6 months in L’Aquila. Moreover, the pedestrian flow on the two sidewalks is very intense during the day.
The Collemaggio parking site is located in the valley of Collemaggio, shown in Figure 6b. The building complex is composed of three underground levels (levels −3, −2, −1) beneath a covering square (level 0). The underground levels −3 (7300 m2) and −2 (8400 m2) are aimed at car parks, in total 720 parking slots. Level −1 (9500 m2) is designed as a suburban bus terminal and bus parking. On the covering square, i.e., level 0 (11,200 m2), there is the access road to the lower levels and the connection viability with the urban network. Such a level is also part of the uncovered urban bus terminal. The level −1, devoted to bus terminal, is characterized by a pedestrian area where services, offices, ticket office, waiting room, stairs and elevators are located. Such characteristics make it the most crowded place among all. The area along the building perimeter is an open-air space, formed between the parking structure and the edge containment walls, which provides for natural ventilation of the different levels.
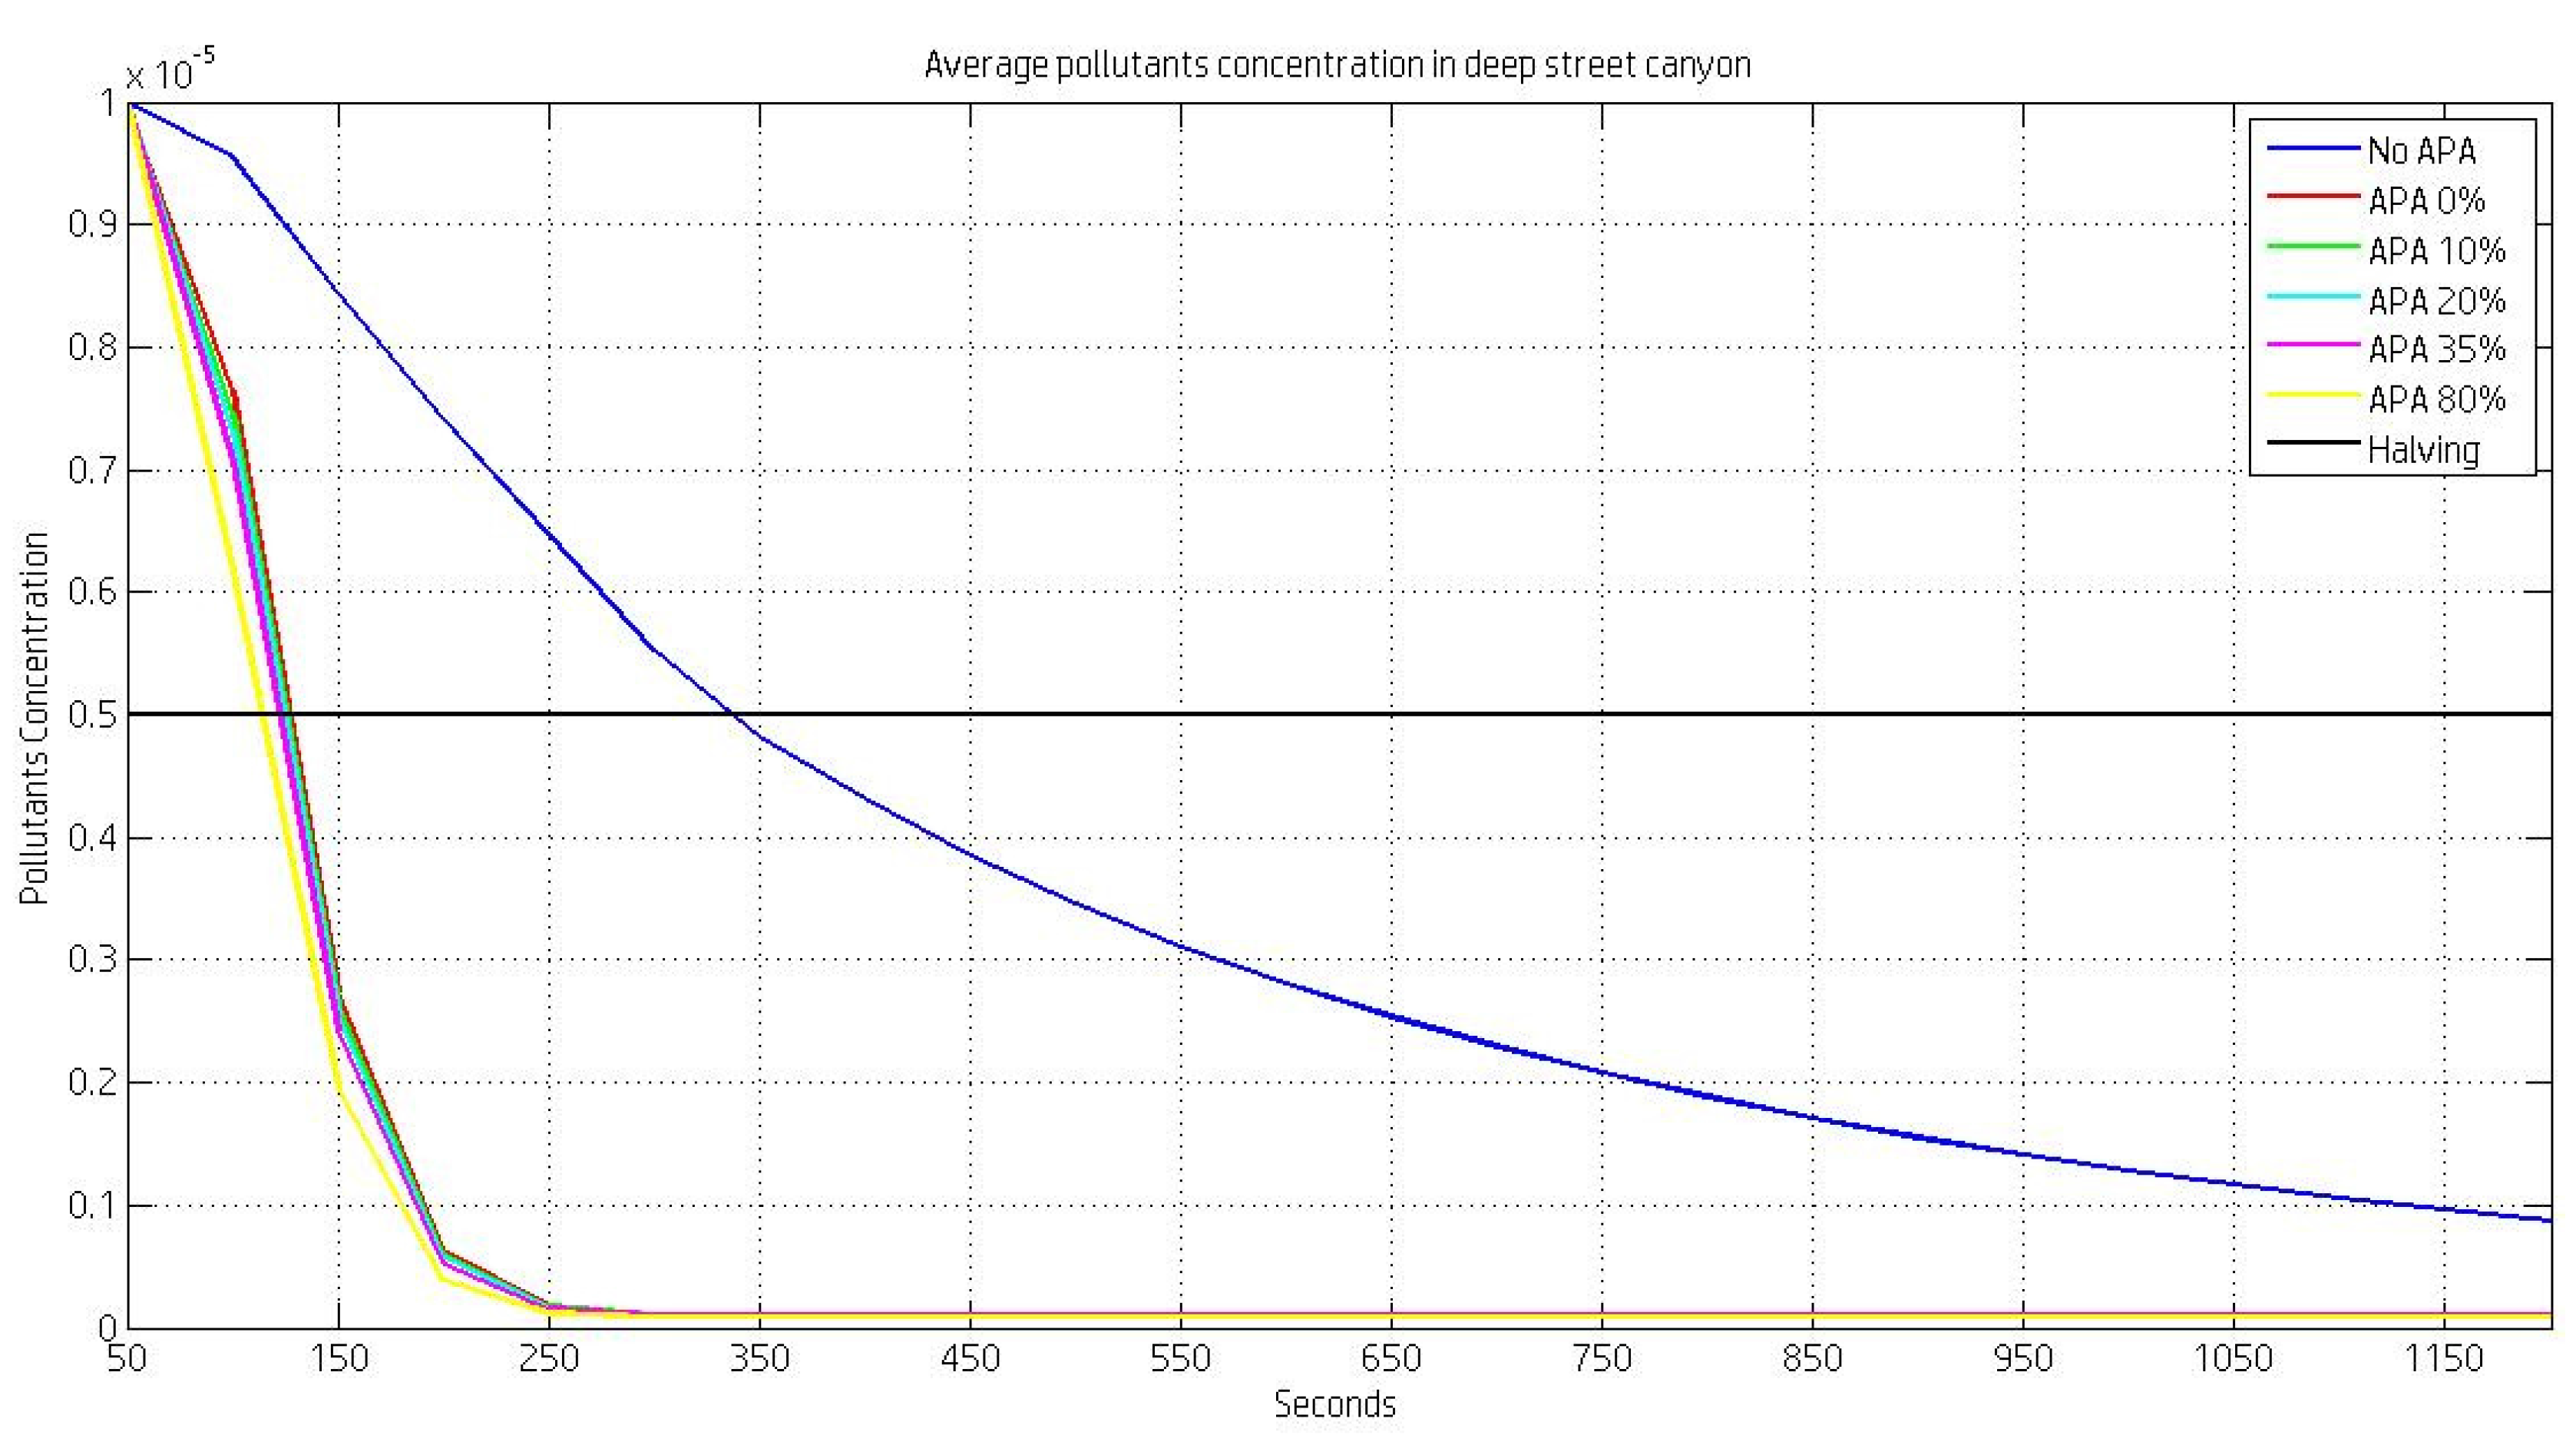
4. Results and Discussion

4.1. Strinella Street Site

APA devices will be installed in the next months to form a cluster of 14 scrubbers alternatively placed on the two sidewalks of the street, covering a total length of about 450 m. The distance between two systems will be 25–30 m. The numerical particle concentration has been monitored at Strinella street number 8, approximately in the middle point of the cluster, during the period January 2016–April 2016. The measurements have been carried out daily during the working hours, between 9 a.m. and 6 p.m. The OPC was placed on the roadside, at the edge of the sidewalk, at about 1 m from the ground. The PM mean number concentration detected was 2.4 × 10⁷ particles/m3, approximately one order of magnitude lower than concentrations monitored in urban sites of large Italian cities, like Milan [25], Turin [26] and Rome [27], in the same size range.
The particle number size distribution is reported in Figure 7, where data are plotted on a log-log scale graph. Red dots in Figure 7 show one absolute maximum value that corresponds to the lower particle size channel of the instrument, 0.30–0.49 µm.
In particular, more than 97% of the detected particles during the whole sampling period were found to have a diameter ranging from 0.30 µm to 1 µm; on the other hand, the particle number greater than 10 µm in diameter is less than 0.04% on average with respect to the total concentration. No substantial differences, compared to the available data published in the scientific literature, are recognized in the coarse particulate concentration (>3 µm). According to literature data, in an urban context, the particle concentration as a function of the diameter is fitted in the first approximation by a straight line (power law in a linear scale).
The behavior of the hourly mean number concentration (9 a.m.–6 p.m.) is reported in Figure 8 for each of the different size channels.
Despite the urban background characteristics of the site, the particle number profile shown in Figure 8 follows the evolution of the vehicle traffic. A different trend is observed as a function of the size channels. In particular, during the morning rush hour, fine particulates (<1 µm) present a peak at 10 a.m., characterized by a width at half height of about 3 h, followed by lower and stable values between 1 p.m. and 3 p.m. A huge increase in the particle concentration is observed at 3 p.m.; in only one hour the concentration reaches a value of 4.5 × 10⁷ #/m3 and 5.5 × 10⁶ #/m3 in the size classes 0.30–0.49 µm and 0.50–0.99 µm, respectively. These concentrations are observed roughly until the end of the measurement. On the contrary, in the afternoon rush hour, PM > 1 µm shows a peak at 5 p.m., that is the closing time, characterized by a width at half height of only 1 h, probably due to the short time of the large particle sedimentation process. This trend is not observed in the morning rush hour, especially for particle sizes between 1 µm and 5 µm. This characteristic is probably due to the high traffic levels persisting until 12 a.m. The lowest concentration levels monitored between 1 p.m. and 3 p.m. are associated with higher radiation and temperature values that caused an increase in the mixing layer and therefore an increase in the volume in which the pollutants are dispersed.

4.2. Collemaggio Parking Site

According to the considerations in Section 3.1, the bus terminal located on −1 level of the parking site has been investigated, as most of the activities are concentrated there. In order to consider the effects on air quality affected by the emissions originating from bus flows in the terminal, the monitoring point was chosen in a semi-confined pedestrian area (6 m × 6 m) between the departing and arriving bus lanes. Each lane is composed of 5 parking spots. The identified point is of great importance for two reasons: firstly, it is in the pedestrian passage between the two lanes; secondly, it is located in the middle between the ticket office and the elevators/stair room. In this area, two APA scrubbers will be positioned in the next months. The processed air by OPC was extracted at about 1.8 m from the ground through a suitable pumping air system, in order to achieve non-invasive measurements with respect to the regular flow of people. The numerical particle detection occurred in the period June 2016–August 2016. The measurements were carried out continuously for 24 h a day. As is known, means of transportation represent the major source of particulate matter. In particular, diesel engines emit a greater amount of dust compared to gasoline vehicles. It is well known that there is a link between a vehicle's power and the amount of emitted PM. Heavy vehicles, like buses, are therefore the most polluting. During the monitoring period, the total daily bus traffic in the terminal was 400 buses per working day on average. Another source of local pollution is therefore associated with the wear of brakes, tires, road surface and friction, as well as the dust lift-off deposited on the roadway caused by bus movement. The PM mean number concentration monitored in the terminal during the experiment was 4.7 × 10⁷ particles/m3, almost twice the concentration monitored in Strinella street. Figure 9 shows the profile of the hourly mean number concentration in the granulometric channels 0.30–0.49 µm, 0.50–0.99 µm, and >1.00 µm, respectively.
As can be noticed, the concentration level over the day is always maintained above the threshold of 4 × 10⁷ particles/m3. The highest concentration, greater than 7 × 10⁷ particles/m3, is observed during the morning rush hour period, in particular from 7 a.m. to 8 a.m., with a ratio between the peak value and the average daily concentration of 1.7. This trend reflects the daily traffic level that becomes more intense in the rush hour period, as shown by the green line in Figure 9. Figure 10 shows the percentage contribution to the particle number concentration given in the same granulometric channels.
It is possible to observe that, without substantial variations throughout the day, more than 96% of the numerical concentration is included in the first two channels provided by the OPC (particles less than 1 µm in diameter), and only the first channel (0.30–0.49 µm) contributes nearly 89%. The weekly mean number concentration associated with fine (<1 µm) and coarse (>1 µm) particulate matter is shown in Figure 11.
Also, in this case, it is possible to notice a concentration profile strictly correlated with the particle kinetics. Except on Mondays and Saturdays, only fine particles show the typical profile characterized by two peaks corresponding to the rush hour period. Instead, coarse particles are characterized by only one peak in the morning hours with oscillating values during daylight hours, clearly indicating the presence of vehicular traffic, and lower and stable values in the nighttime hours. High concentration levels of fine particles have also been detected during the weekend, 4.2 × 10⁷ particles/m3 on average; the minimum concentration value, 2.9 × 10⁷ particles/m3, has been measured on a Sunday in the afternoon. Finally, during the weekend, coarse particulate shows a modest peak on a Saturday morning and almost stable values throughout the day on Sunday as a consequence of low bus flow.

4.3. Simulation Study

As mentioned above, Strinella street can be considered as a deep street canyon (height 18 m and width 6 m), with a consequent H/W aspect ratio equal to 3. In some sections, the width of the road widens to about 12 m, resulting in a deep street canyon with an aspect ratio of 2. In the presence of a constant wind perpendicular to the axis of the road, two vortices are found in the canyon, as shown in Figure 12a for H/W = 3.
It is easy to realize that the two counter-rotating vortexes have comparable dimensions. Furthermore, the upper vortex has a greater velocity than the lower one. The vortexes are slowed by friction with the houses’ walls and, consequently, the speed decreases on the bottom of the canyon. The lower vortex is more isolated and detached from the upper levels than the overlying structure, so it will generally be characterized by a higher concentration of pollutants. It is interesting to observe how the sole air fan of the scrubber can modify the dynamics inside the street canyon. The modification of the vortexes caused by the APA scrubber is shown in Figure 12b. The presence of the fan generates three vortexes. The most powerful vortex is confined in the upwind corner, with speeds between 4 and 17 m/s. The space occupied by this vortex is completely determined by the position of the fan and is about 3 m high, extending along the canyon. The second vortex, leaning on the overhanging canyon wall, reaches a maximum speed of about 6 m/s and counter-rotates with respect to the other vortexes. Finally, the upper vortex has a maximum speed of 1.5 m/s. The presence of the three vortexes is also induced in a deep street canyon with H/W = 2. The dynamic of the canyon is completely disrupted by the fan of the APA scrubber; this important result is easily understandable considering that the velocity of the fan-induced fluid is of an order of magnitude greater than the velocities of wind-induced vortexes. The simulated distribution of a passive tracer inside the canyon is shown in Figure 13.
It is extremely interesting to observe how the pollutant concentration, initially constant within the canyon, evolves without and with the scrubber. As shown in Figure 13a, accumulation of pollutants in absence of the device is observed in the bottom vortex, especially in the upwind corner. This area is particularly important since it is where pedestrians walk and where the pollutants are inhaled. In the presence of the scrubber, air is less polluted in the area of interest with respect to pedestrians (see Figure 13b). This is explained by the presence of the strong vortex in the upwind corner; air in such a vortex is treated several times by the APA scrubber, which is therefore able to cut down the pollutants more efficiently. Figure 14 and Figure 15 show the trend of the average concentration of the pollutant in the leeward corner, without and with the scrubber, for canyons characterized by different aspect ratios, H/W = 3 and H/W = 2, respectively.
The blue line represents the natural air exchange in the canyon, whereas the other lines show the air exchange due to the APA operation for different abatement efficiencies. The black line indicates the concentration corresponding to 50% of its initial value; its intersection with the curves allows the estimation of the time required to halve the concentration of the pollutant. As expected, the air exchange in the canyon is much faster in the case H/W = 2. The trend of the average pollutant concentration with an APA scrubber characterized by zero abatement efficiency (APA = 0) is also shown in Figure 15: the presence of the fan increases the air exchange of the canyon. The efficacy of the scrubber has also been evaluated in a more realistic case: besides a constant urban background concentration, a constant source of pollutants in the street, simulating the traffic emissions, was also taken into account. Different APA abatement efficiencies are shown in Figure 16.
The average concentration of the passive tracer, with and without APA scrubber, is shown for different abatement efficiencies. It is possible to observe how the concentration is gradually reduced as a function of the APA efficiency, with respect to the reference case without the absorber (blue line). The pollutant concentrations achieve a constant value after approximately 350 s, denoting the achievement of an equilibrium rate between sources and sinks. Table 1 shows the percentage of pollutants removed by APA operation at different efficiencies of abatement in the entire canyon volume and in a sub-volume delimited by the region between the ground and 2.5 m height for the case H/W = 3.
The percentage reduction is higher in the entire canyon volume than in the sub-volume. Actually, a higher absolute mass of pollutant is removed in the sub-volume, but the reference average concentrations are also higher with respect to the whole canyon. The results for the case H/W = 2 are listed in Table 2.
The APA efficacy is significantly reduced, as expected in a more open space where air can be re-processed by the scrubber fewer times. It is interesting to note that the efficacy in the sub-volume at human height is higher with respect to that of the whole canyon. This is a valuable result since a higher quality of air is required in the lower layers of the atmosphere, where human activities are concentrated.

5. Conclusions

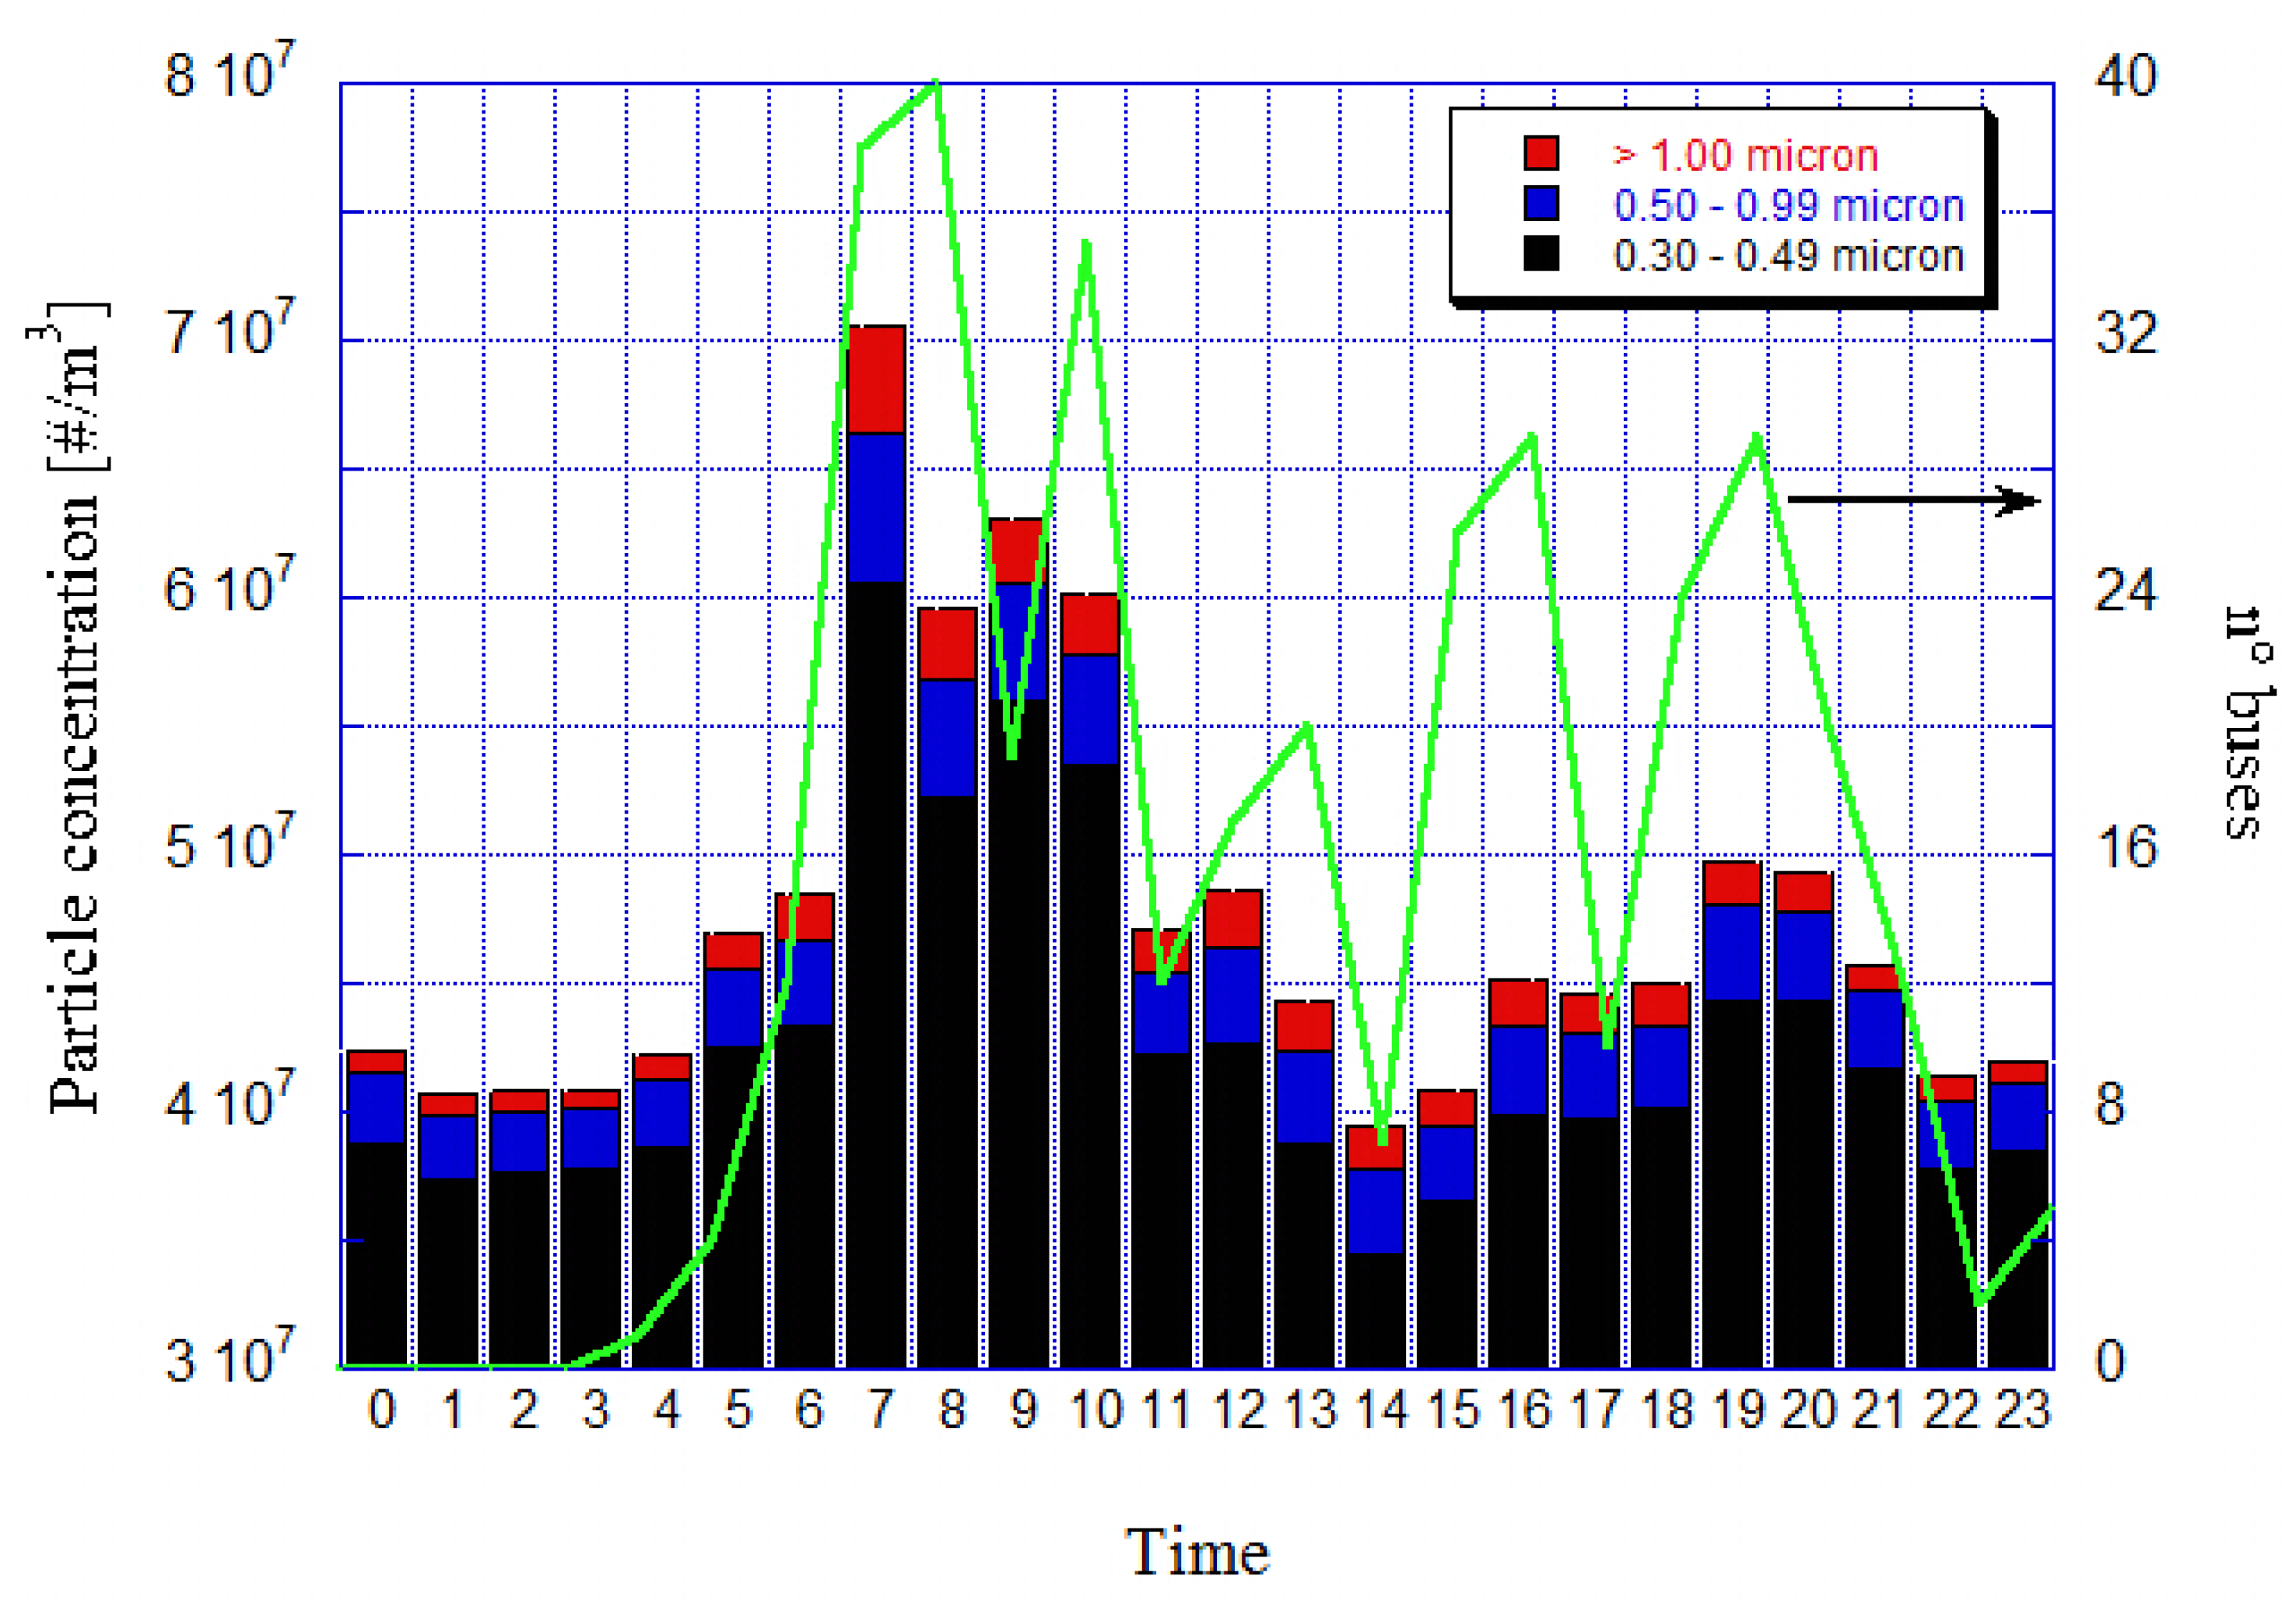
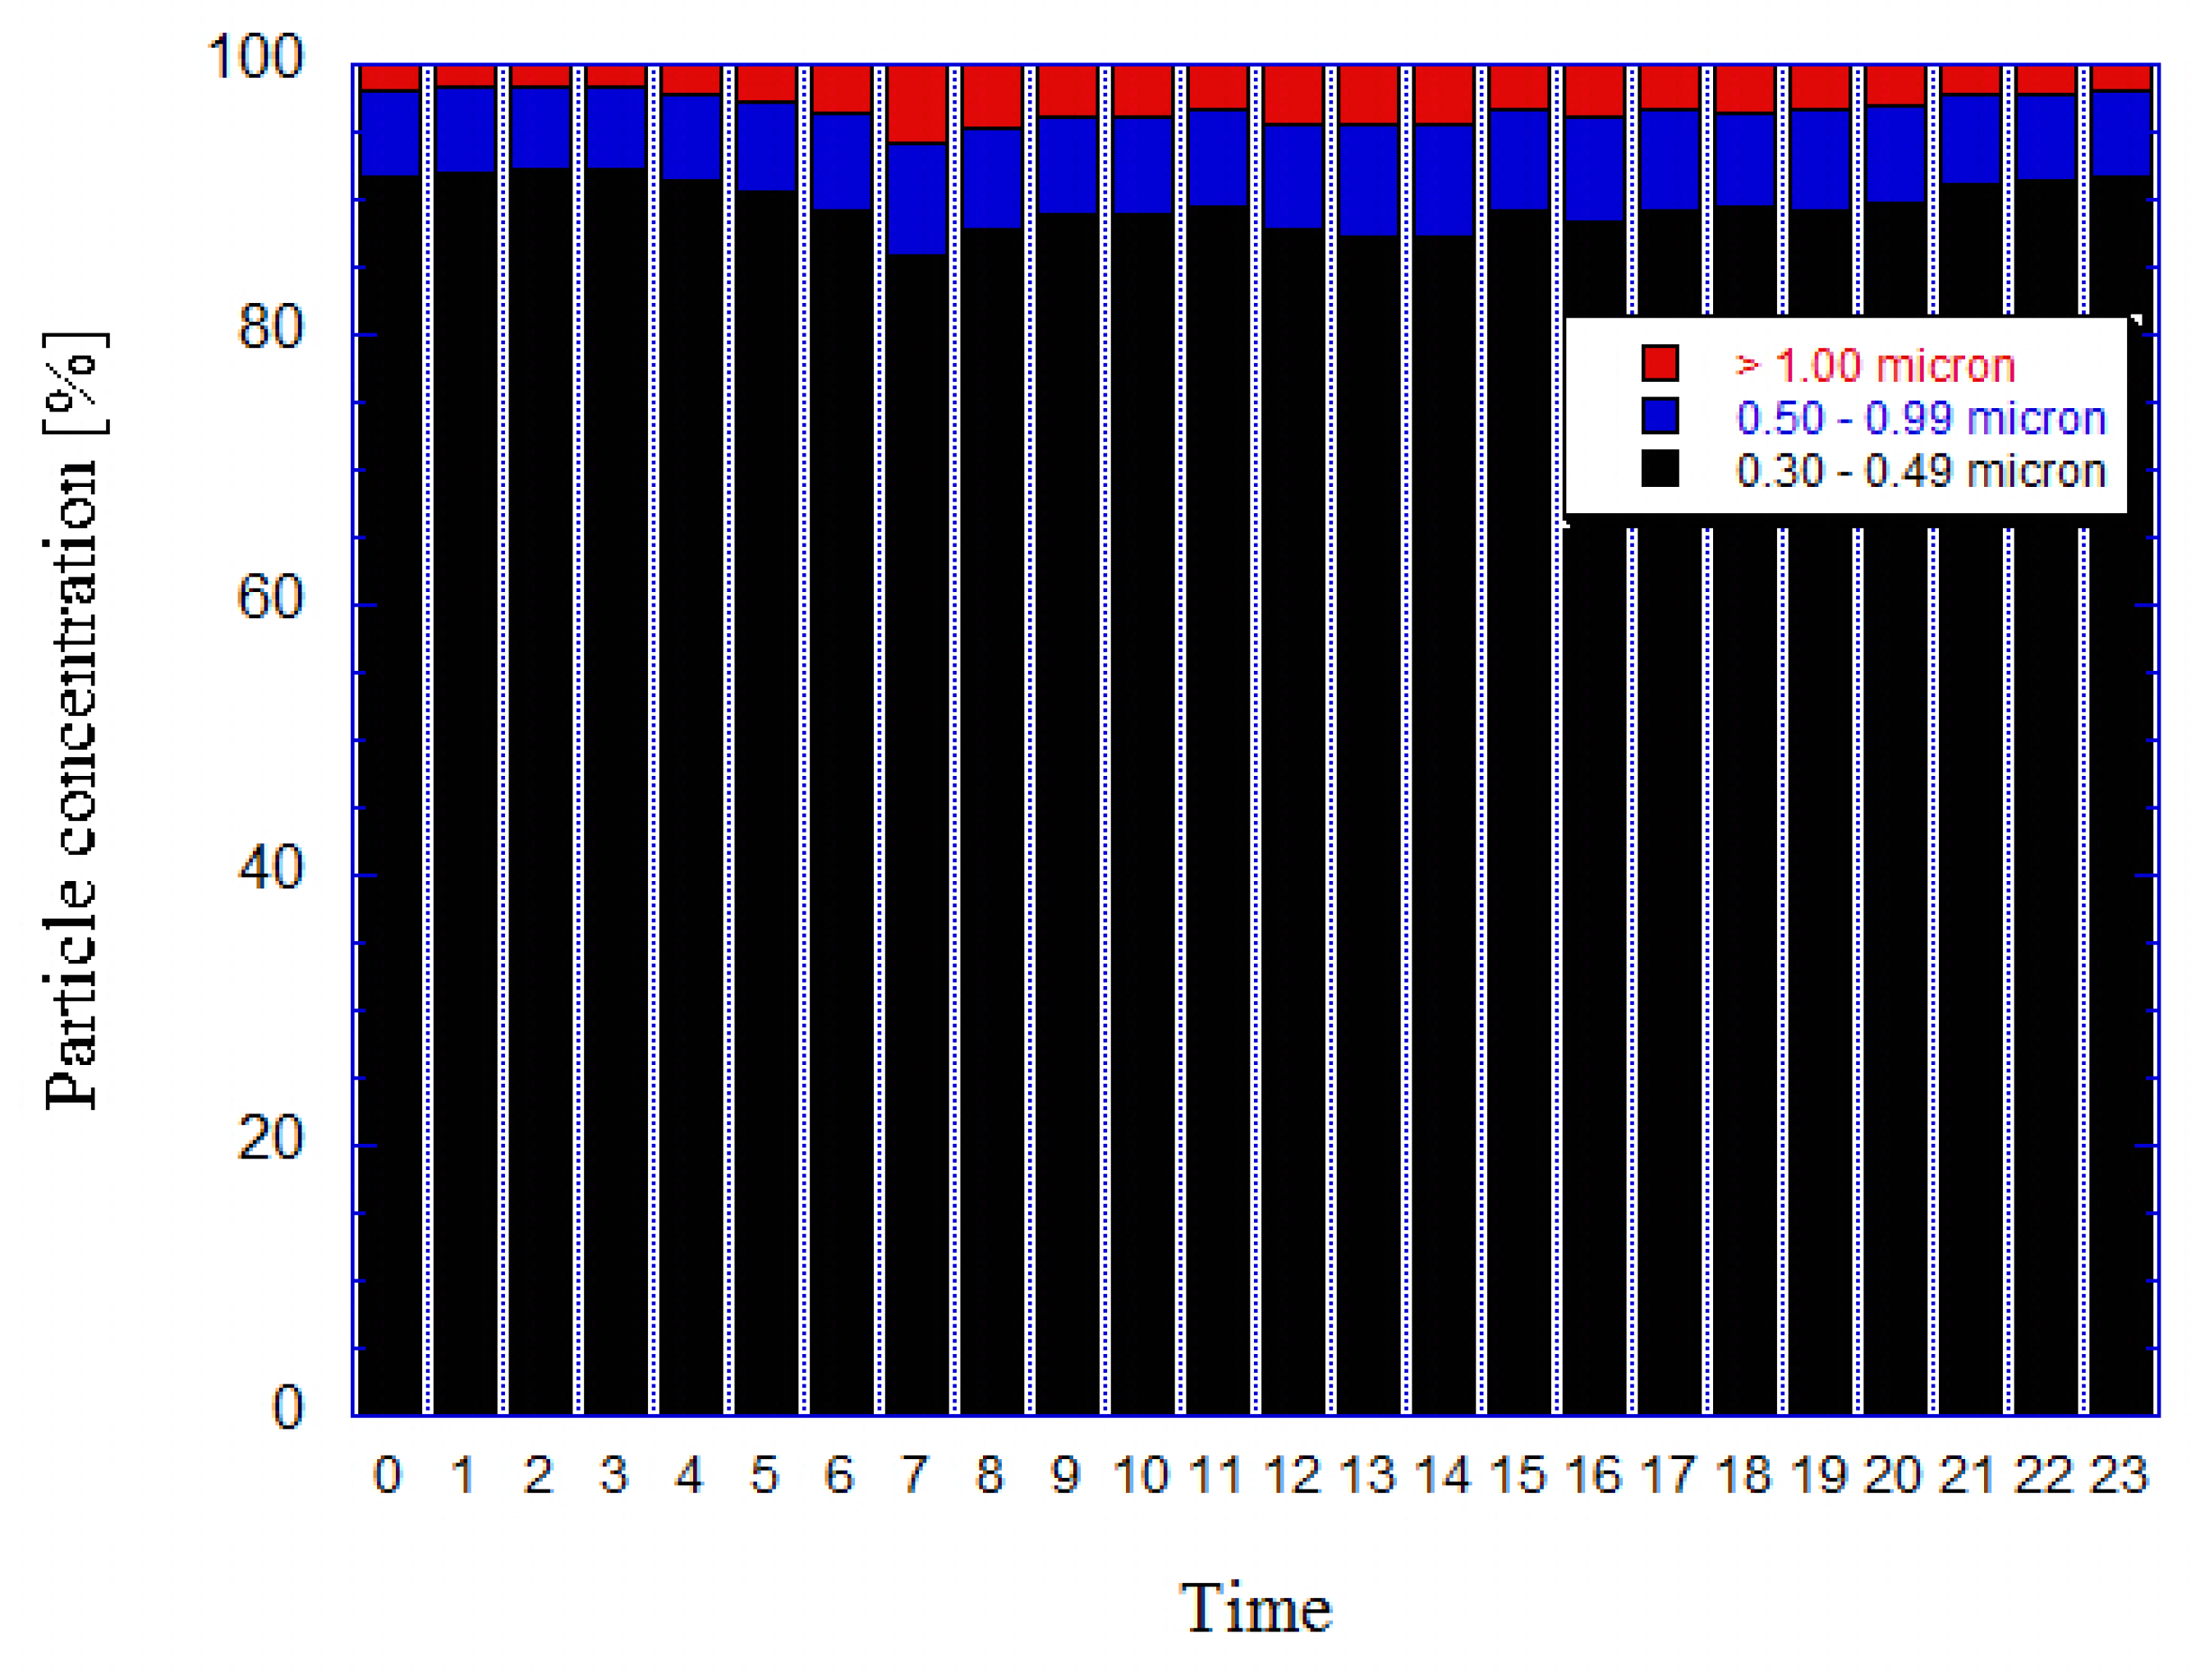
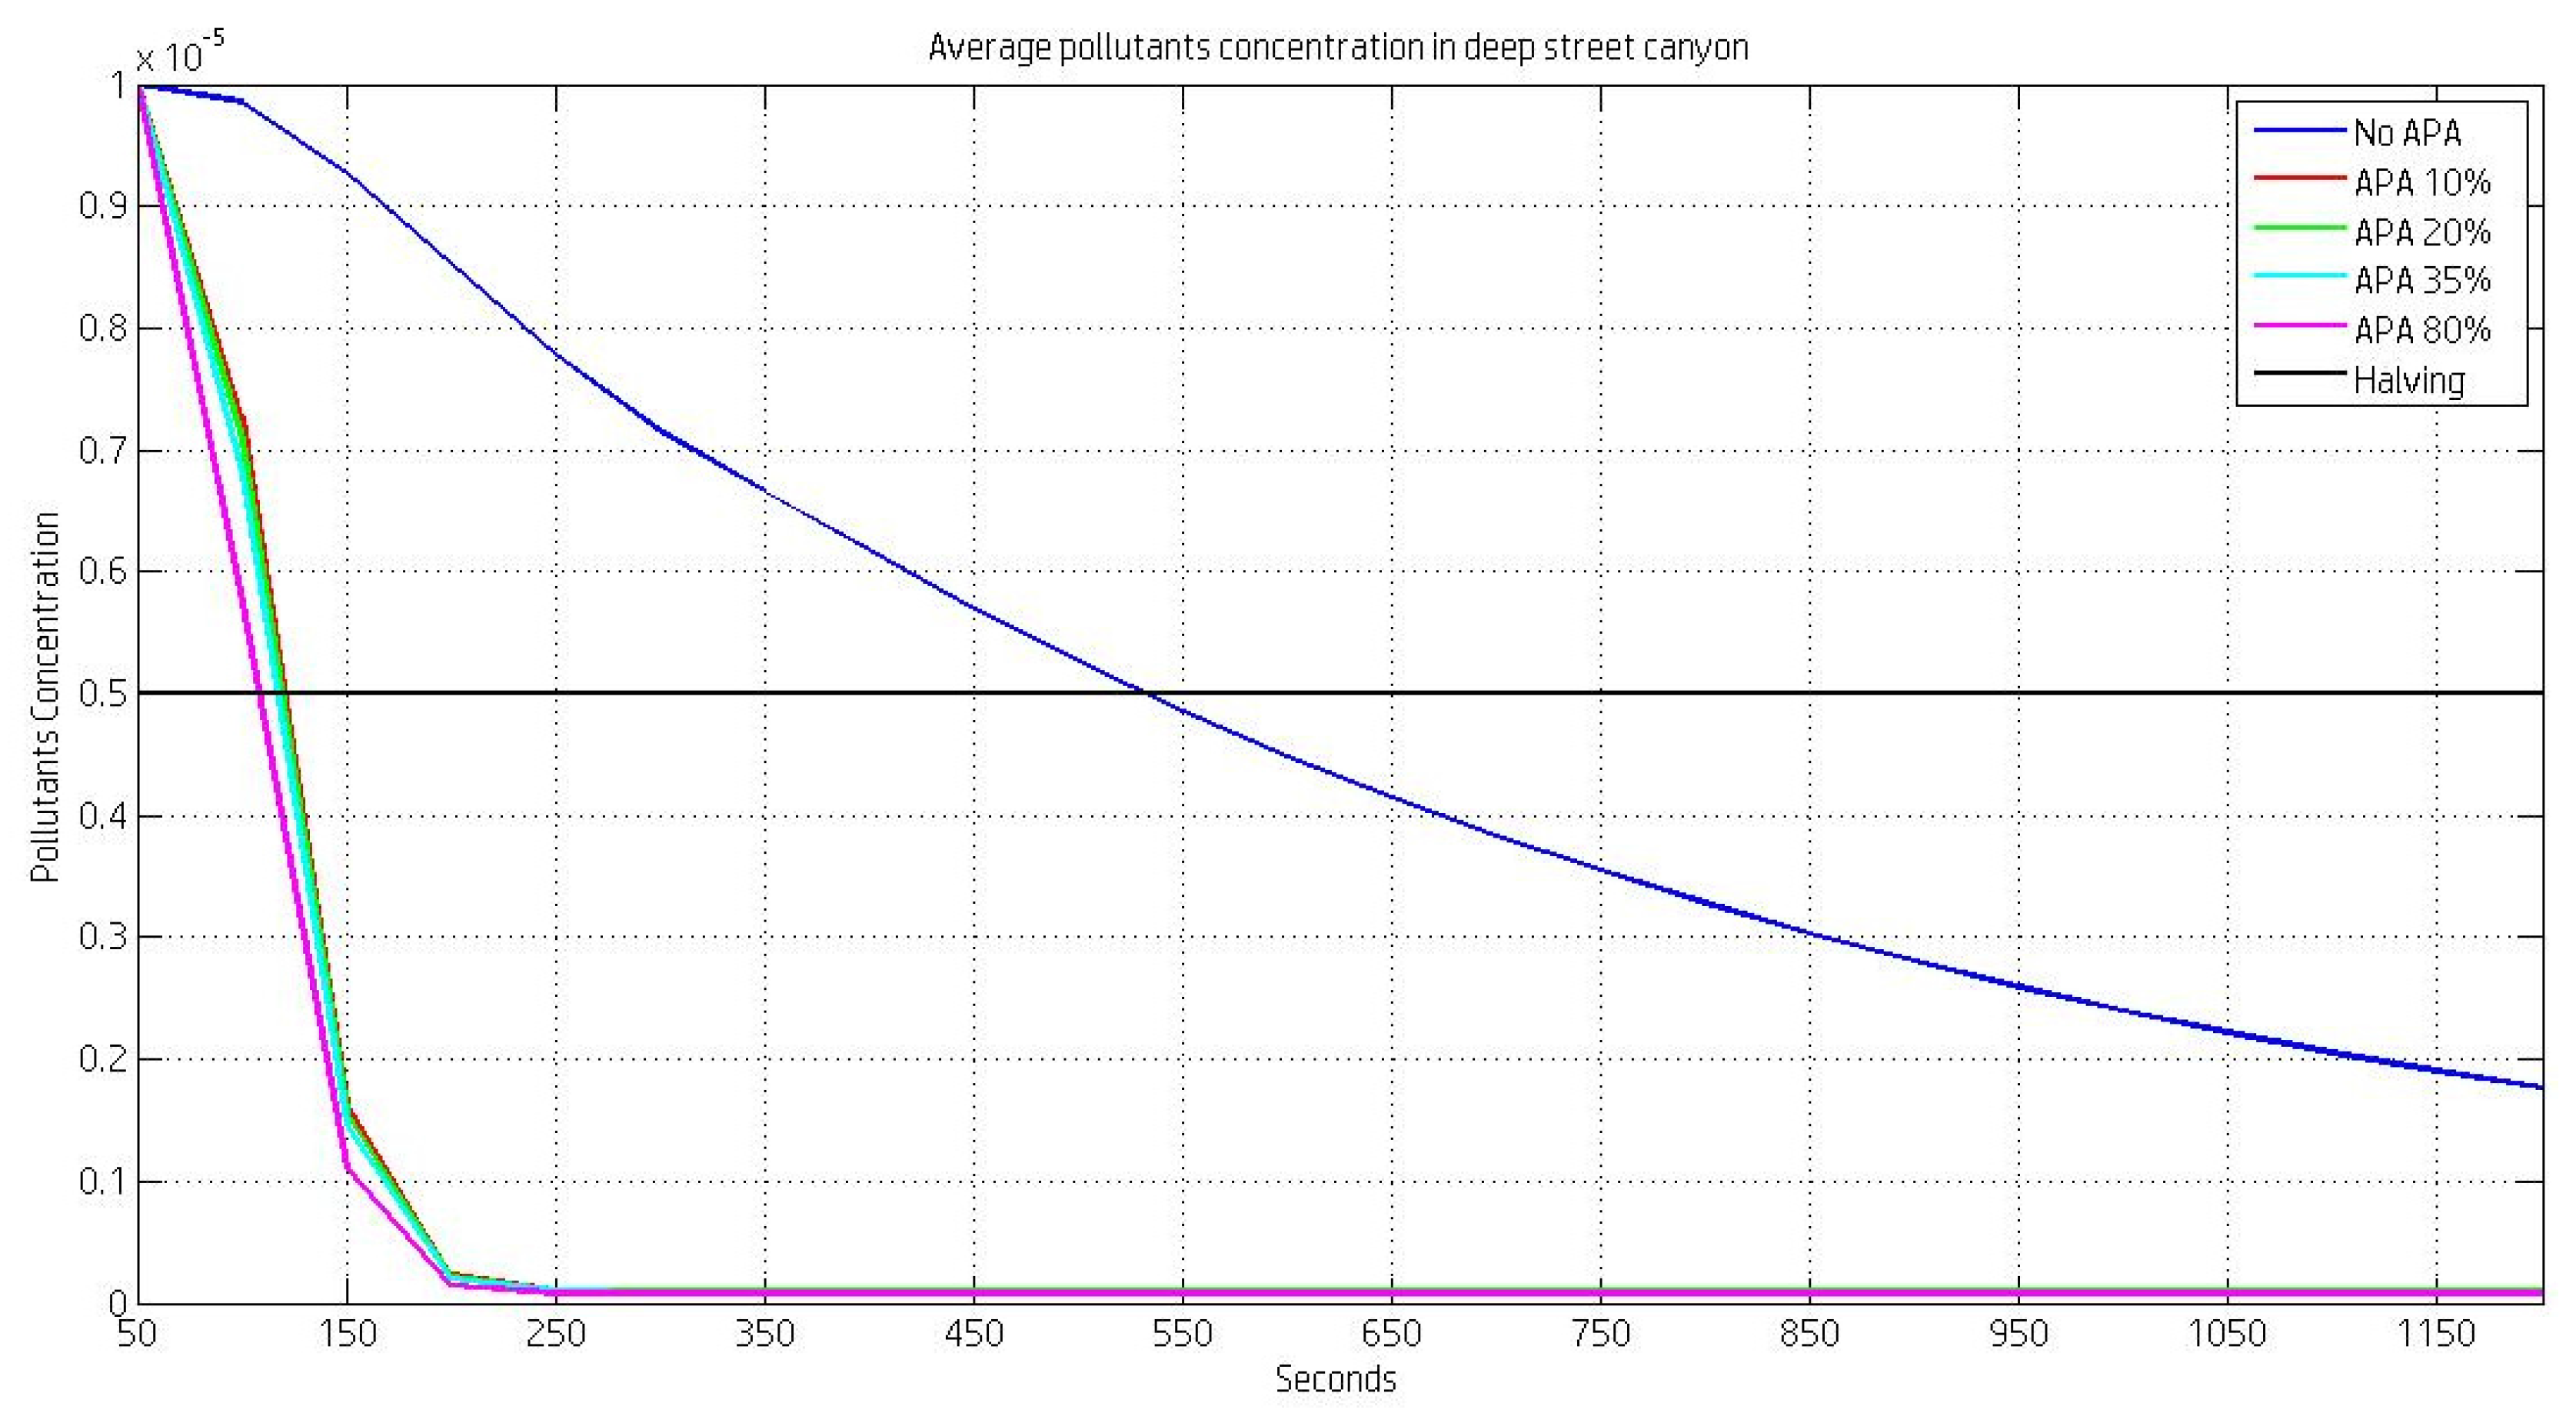
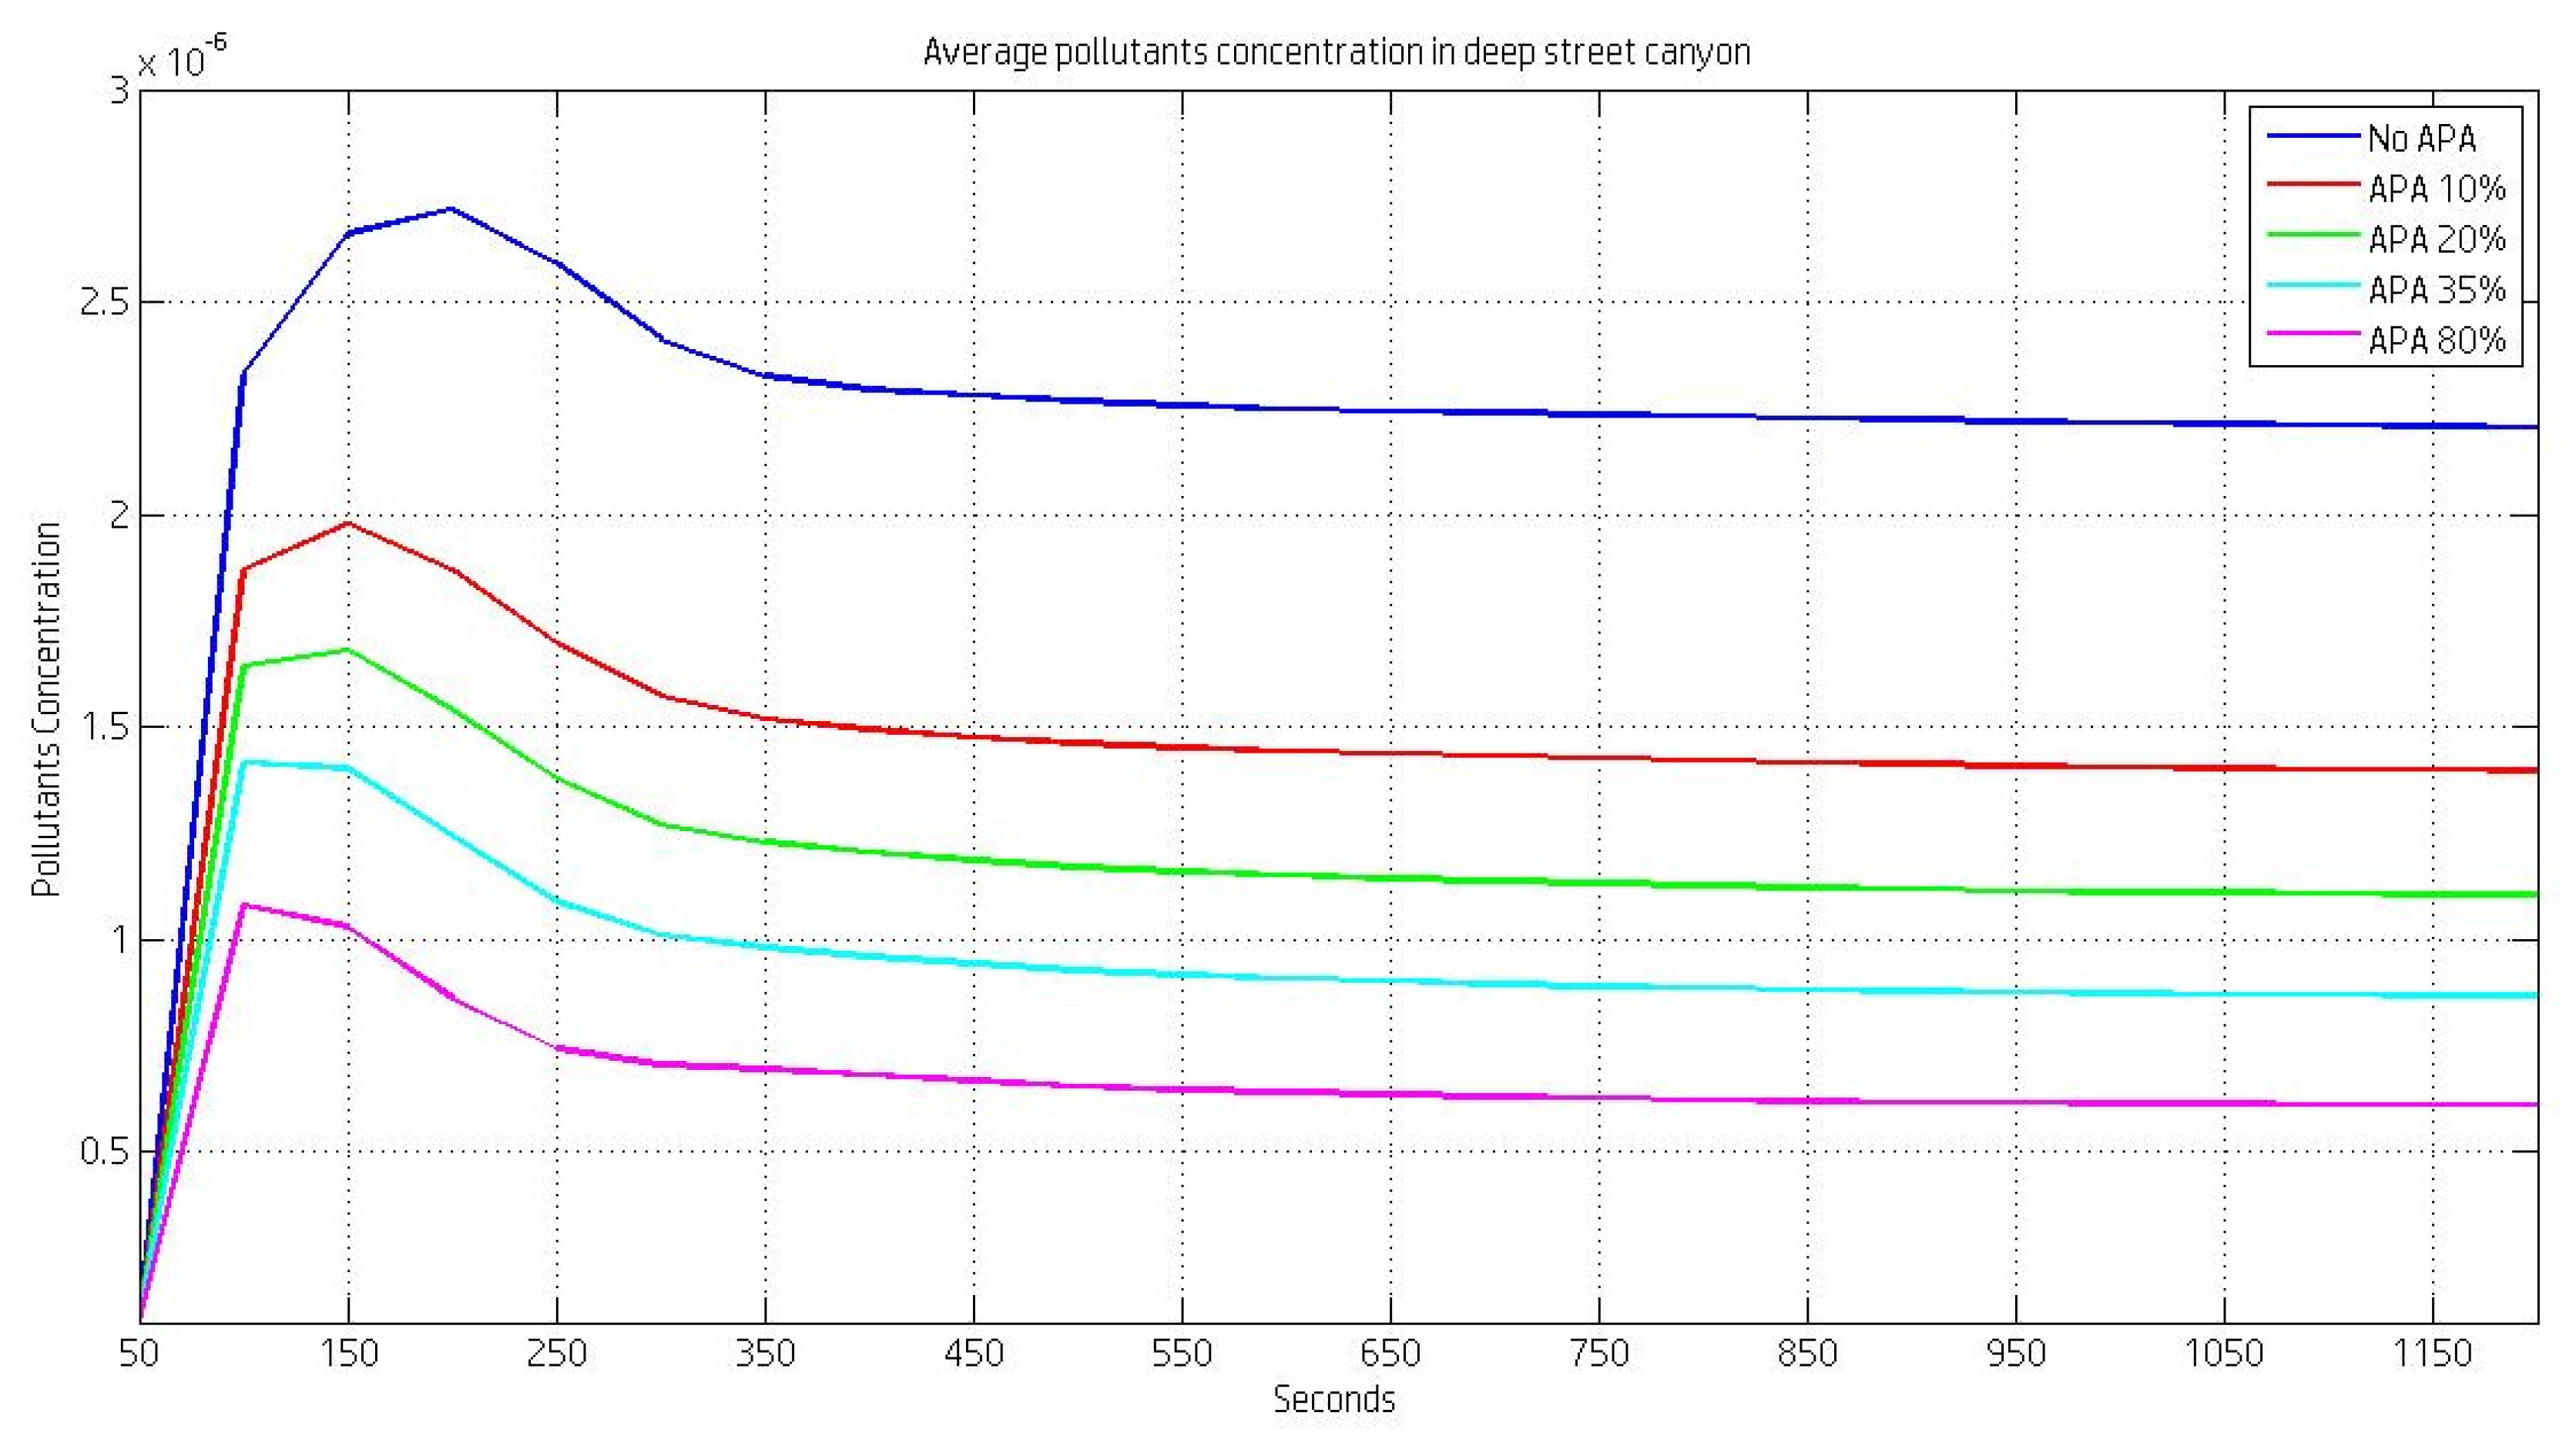
The Smart Clean Air City project is aimed at improving the urban air quality through the use of APA technology. Small wet scrubber systems, camouflaged and integrated into multimedial totems, have been designed and developed to form a densely distributed network of air pollution absorbers in a small urban context like L’Aquila city. In this paper we presented the air quality characterization carried out at two sites of L’Aquila city by means of monitoring of particle number concentration: Strinella street, an urban background site, and the bus terminal of Collemaggio parking, a bus traffic area. Due to their peculiar characteristics, these sites have been identified as suitable urban areas in which to carry out the pilot project. The characterization of the sites has been performed in terms of PM measurement, in the range 0.30–25 µm with a 2-min time resolution. The mean number concentration monitored in the urban site was found to be approximately one order of magnitude lower than concentrations monitored in larger cities. The temporal variation of the particle number concentration followed the traffic density, especially for fine particulate. High total concentration levels have been observed during the days of the week and the lower concentrations occurred only for coarse particulate during the weekends. Further air pollution data detections will be carried out in the coming months, coordinating the activities with the public administration in order to better define the application area of the APA scrubbes. The effectiveness of the APA systems has been theoretically tested by means of CFD simulations, performed in deep street canyons, characterized by low ventilation and frequent air recirculation. These conditions are favourable for pollutant accumulation, but at the same time, allow several re-processing iterations of the same air in the scrubber. The simulations have been performed by means of the evolution of the passive tracer spatial distribution inside the canyon. The presence of the scrubber creates an additional sink at the bottom of the canyon, accelerating the cleaning process of the canyon. The efficacy of the APA is high even at low system efficiencies, ensuring a significant pollution reduction. The canyon cleaning time is greatly reduced during APA operation; the average concentration of pollutants in the canyon is close to zero in less than 200 s, compared to approximately 550 s in case the APA scrubber is turned off. The pollutant abatement efficacy of the scrubber has also been evaluated in a realistic case characterized by constant emissions of the tracer from the street floor (such as traffic emissions) and a constant urban background concentration. In this case, the effectiveness of APA is not proportional to the internal abatement efficiency, but rapidly increases at low efficiencies and then tends to saturate. Further work is currently being carried out in order to include other sources of turbulence and urban scenarios. Once the APA scrubbers are installed, the experimental campaign will take place: PM and other gaseous pollutants will be monitored for several months in order to characterize the sites; after that, the same experimental study will be conducted with APA scrubbers in continuous operation mode, in order to quantify the reduction of pollutants and the quality of air. Other papers will be presented, discussing the results of such a pilot project, representing, to date, the first experiment of its kind in the World.

Acknowledgments

The authors kindly acknowledge the Italian Ministry for the Economic Development (MISE) for having financed the project Smart Clean Air City L’Aquila, grant number M/0007/03/X23, Decree n. 2622 of 3 March 2015 and IsTECH srl (Roma) for its invaluable collaboration in the management of the activities. The authors are also grateful to the Municipality of L’Aquila for arranging a central urban area for this scientific study.

Author Contributions

Alessandro Avveduto and Paolo Tripodi conceived and designed the experiments; Alessandro Avveduto, Francesco Ferella and Lorenzo Pace performed the experiments; Marina De Giovanni performed the CFD simulations; Alessandro Avveduto analyzed the data; Francesco Ferella and Valentina Innocenzi designed and described the wastewater mobile plant; Alessandro Avveduto wrote the paper.

Conflicts of Interest

The authors declare no conflict of interest.

References

  1. Chan, C.K.; Yao, X. Air pollution in mega cities in China. Atmos. Environ. 2008, 42, 1–42. [Google Scholar] [CrossRef]
  2. Mcdonald, K. Air pollution in the urban atmosphere: Sources and consequences. In Metropolitan Sustainability: Understanding and Improving the Urban Environment, 1st ed.; Zeman, F., Ed.; Woodhead Publishing: Amsterdam, The Netherlands, 2012; pp. 231–259. [Google Scholar]
  3. Seaton, A.; Macnee, W.; Donaldson, K.; Godden, D. Particulate air pollution and acute health effects. Lancet 1995, 345, 176–178. [Google Scholar] [CrossRef]
  4. Gouveia, N.; Fletcher, T. Time series analysis of air pollution and mortality: Effects by cause, age and socioeconomic status. J. Epidemiol. Community Health 2000, 54, 750–755. [Google Scholar] [CrossRef] [PubMed]
  5. European Environment Agency (EEA). Air Quality in Europe—2013 Report. 2013. Available online: https://www.eea.europa.eu/publications/air-quality-in-europe-2013/download (accessed on 24 April 2017).
  6. European Environment Agency (EEA). A Summary of the Year of Air—What We Know about Air Pollution in 2013. Available online: http://www.eea.europa.eu/highlights/a-summary-of-the-year (accessed on 24 April 2017).
  7. Beelen, R.; Raaschou-Nielsen, O.; Stafoggia, M.; Andersen, Z.J.; Weinmayr, G.; Hoffmann, B.; Wolf, K.; Samoli, E.; Fischer, P.; Nieuwenhuijsen, M.; et al. Effects of long-term exposure to air pollution on natural-cause mortality: An analysis of 22 European cohorts within the multicentre ESCAPE project. Lancet 2014, 383, 785–795. [Google Scholar] [CrossRef]
  8. Agenzia Nazionale per Le Nuove Tecnologie, L’energia e lo Sviluppo Economico Sostenibile (ENEA). Energia Ambiente E Innovazione. Available online: http://www.enea.it/it/pubblicazioni/pdf-volumi/EdizioniENEA2013.pdf (accessed on 25 April 2017).
  9. Zhang, Y.P.; Mo, J.H.; Li, Y.G.; Sundell, J.; Wargocki, P.; Zhang, J.S.; Little, J.C.; Corsi, R.; Deng, Q.H.; Leung, M.H.K.; et al. Can commonly-used fan-driven air cleaning technologies improve indoor air quality? A literature review. Atmos. Environ. 2011, 45, 4329–4343. [Google Scholar] [CrossRef]
  10. Fisk, W.J.; Faulkner, D.; Palonen, J.; Seppanen, O. Performance and costs of particle air filtration technologies. Indoor Air 2002, 12, 223–234. [Google Scholar] [CrossRef] [PubMed]
  11. Sublett, J.L.; Seltzer, J.; Burkhead, R.; Williams, P.B.; Wedner, H.J.; Phipatanakul, W.; Allergy, A.A. Air filters and air cleaners: Rostrum by the American academy of allergy, asthma & immunology indoor allergen committee. J. Allergy Clin. Immunol. 2010, 125, 32–38. [Google Scholar] [PubMed]
  12. Folli, A.; Strøm, M.; Pilegaard Madsen, T.; Henriksen, T.; Lang, J.; Emenius, J.; Klevebrant, T.; Nilsson, Å. Field study of air purifying paving elements containing TiO2. Atmos. Environ. 2015, 107, 44–51. [Google Scholar] [CrossRef]
  13. Calia, A.; Lettieri, M.; Masieri, M.; Pal, S.; Licciulli, A.; Arima, V. Limestones coated with photocatalytic TiO2 to enhance building surface with self-cleaning and depolluting abilities. J. Clean. Prod. 2017, 165, 1036–1047. [Google Scholar] [CrossRef]
  14. Águia, C.; Ângelo, J.; Madeira, L.M.; Mendes, A. Photo-oxidation of NO using an exterior paint e Screening of various commercial titania in powder pressed and paint films. J. Environ. Manag. 2011, 92, 1724–1732. [Google Scholar] [CrossRef] [PubMed]
  15. Águia, C.; Ângelo, J.; Madeira, L.M.; Mendes, A. Influence of paint components on photoactivity of P25 titania toward NO abatement. Polym. Degrad. Stab. 2011, 96, 898–906. [Google Scholar] [CrossRef]
  16. Ministero Dello Sviluppo Economico (MISE). Decreto Ministeriale 22 Ottobre 2013—Cratere Sismico Aquilano. Finanziamento di Progetti di Ricerca Industriale e Prevalente Sviluppo Sperimentale. Available online: http://www.sviluppoeconomico.gov.it/index.php/it/?option=com_content&view=article&id=2029853 (accessed on 12 September 2017).
  17. Tripodi, M.; Tripodi, P. Network of Complex Systems for Environmental Remediation, and Method for Controlling the Network. Patent IT MI2012A001892, 27 February 2015. [Google Scholar]
  18. Tripodi, M.; Tripodi, P. Method and System for Mixing Gas and Liquid for Gravitational, Physical and Chemical Collection of Compounds. Patent IT MI2012A001893, 27 February 2015. [Google Scholar]
  19. Avveduto, A.; Dari Salisburgo, C.; Pace, L.; Curci, G.; Monaco, A.; De Giovanni, M.; Giammaria, F.; Spanto, G.; Tripodi, P. Analysis of a wet scrubber network in the air remediation of industrial workplaces: Benefit for the city air quality. In Proceedings of the Urban Environmental Pollution Conference, Toronto, ON, Canada, 12–15 June 2014. [Google Scholar]
  20. Vardoulakis, S.; Fisher, B.E.A.; Pericleous, K.; Gonzalez-Flesca, N. Modelling air quality in street canyons: A review. Atmos. Environ. 2003, 37, 155–182. [Google Scholar] [CrossRef]
  21. Murena, F.; Di Benedetto, A.; D’Onofrio, M.; Vitiello, G. Mass transfer velocity and momentum vertical exchange in simulated deep street canyon. Bound.-Layer Meteorol. 2011, 140, 125–142. [Google Scholar] [CrossRef]
  22. De Hartog, J.J.; Hoek, G.; Peters, A.; Timonen, K.L.; Ibald-Mulli, A.; Brunekreef, B.; Heinrich, J.; Tiittanen, P.; Van Wijnen, J.H.; Kreyling, W.; et al. Effects of fine and ultrafine particles on cardiorespiratory symptoms in elderly subjects with coronary heart disease: The ULTRA Study. Am. J. Epidemiol. 2003, 157, 613–623. [Google Scholar] [CrossRef] [PubMed]
  23. Regulation (EC) No 715/2007 of the European Parliament and of the Council of 20 June 2007 on Type Approval of Motor Vehicles with Respect to Emissions from Light Passenger and Commercial Vehicles (Euro 5 and Euro 6) and on Access to Vehicle Repair and Maintenance Information. Available online: http://eur-lex.europa.eu/eli/reg/2007/715/oj (accessed on 29 June 2007).
  24. Curci, G.; Cinque, G.; Tuccella, P.; Visconti, G.; Verdecchia, M.; Iarlori, M.; Rizi, V. Modelling air quality impact of a biomass energy power plant in a mountain valley in Central Italy. Atmos. Environ. 2012, 62, 248–255. [Google Scholar] [CrossRef]
  25. Beccaceci, S.; Gianelle, V.; Mognaschi, G.; Vecchi, R. A study on atmospheric aerosol particles size distribution in several sites in Lombardia Region by an Optical Particle Counter. In Chemical Engineering Transaction, Proceedings of Advanced Atmospheric Aerosol Symposium, Milano, Italy, November 2006; AIDIC: Milano, Italy, 2006; Volume 10, pp. 197–202. [Google Scholar]
  26. Lollobrigida, F.; Sacco, M.; Maringo, M.; Pace, M.; Romeo, F.; Bussi, C.; Castrogiovanni, G. Determinazione della Concentrazione Numerica di Particelle Aerodisperse in un Sito Urbano da Traffico della Città di Torino. Arpa Piemonte, 2008. Available online: http://www.arpa.piemonte.gov.it/arpa-comunica/events/eventi-2009/atti-convegno-agenti-fisici/lollobrigida1.pdf (accessed on 10 April 2012).
  27. Marconi, A.; Cattani, G.; Cusano, M.; Ferdinandi, M.; Inglessis, M.; Viviano, G.; Settimo, G.; Forastiere, F. Two-years of fine and ultrafine particles measurements in Rome, Italy. J. Toxicol. Environ. Health A 2007, 70, 213–221. [Google Scholar] [CrossRef] [PubMed]
Figure 1. Schematic representation of the three-stage air treatment system of APA (Air Pollution Abatement) technology. The weak Venturi ejectors, the spray tower and the variable deposition stack are represented.
Environments 04 00078 g001
Figure 2. APA Totem (1300 × 400 × 2100 mm, AISI (American Iron and Steel Institute) 304 stainless steel). The multimedial 55-inch touch-screen is installed in the central part of the front panel (a). Internal view of the system (b).
Environments 04 00078 g002
Figure 3. Water loop of the smart city pilot project.
Environments 04 00078 g003
Figure 4. Different treatment pathways available in the WPP (COD: chemical oxygen demand; TSS: total suspended solids; NO3-N: nitric nitrogen; NH3-N: ammoniacal nitrogen).
Environments 04 00078 g004
Figure 5. L’Aquila, Italy (42°22′ N, 13°21′ E). Topography of the region of interest.
Environments 04 00078 g005
Figure 6. The two urban sites of L’Aquila, where the air remediation tests will be carried out. Strinella street, yellow line (a), and Collemaggio parking site (b).
Environments 04 00078 g006
Figure 7. PM average numeric size distribution (log scale) monitored in Strinella Street, L’Aquila, in the period January 2016–April 2016. The blue line indicates the power fit. Data collected by Optical Particle Counter (OPC) TSI.
Environments 04 00078 g007
Figure 8. Hourly trend (9 a.m.–6 p.m.) of the PM mean number concentration monitored in Strinella Street, L’Aquila, over the period January 2016–April 2016 for each of the six granulometric channels investigated. Analysis of hourly averages. Data collected by OPC TSI.
Environments 04 00078 g008
Figure 9. Hourly trend of the PM mean number concentration (left column) monitored in the bus terminal (level −1) of Collemaggio parking site, L’Aquila, in the period June 2016–August 2016. Three granulometric sizes are shown: 0.30–0.49 µm, 0.50–0.99 µm and >1.00 µm. Analysis of hourly averages. Data collected by OPC TSI. The green line (right column) indicates the total number of incoming and outgoing buses from the terminal.
Environments 04 00078 g009
Figure 10. Hourly trend of the PM percentage number concentration monitored in the bus terminal (level −1) of Collemaggio parking site, L’Aquila, in the period June 2016–August 2016. Three granulometric sizes are shown: 0.30–0.49 µm, 0.50–0.99 µm and >1.00 µm. Analysis of hourly averages. Data collected by OPC TSI.
Environments 04 00078 g010
Figure 11. Weekly trend of the PM mean number concentration, the red line, monitored in the bus terminal of Collemaggio parking site, L’Aquila, in the period June 2016–August 2016. Two granulometric sizes are shown: (a) 0.30–0.99 µm, (b) 1.00–25.00 µm. Blue and black lines indicate the minimum and maximum values monitored, respectively. Analysis of hourly averages. Data collected by OPC TSI.
Environments 04 00078 g011aEnvironments 04 00078 g011b
Figure 12. Wind flow pattern in a deep street canyon characterized by an aspect ratio of 3 without (a) and with (b) the APA scrubber.
Environments 04 00078 g012
Figure 13. Spatial distribution of a passive tracer in a deep street canyon characterized by an aspect ratio of 3 without (a) and with (b) the APA scrubber. The figure is a snapshot of the simulation 1300 s from the start (constant tracer). The unit is the tracer molar mixing ratio.
Environments 04 00078 g013
Figure 14. Time series of the average concentration of the passive tracer in a deep street canyon with aspect ratio H/W = 3 without (blue line) and with (colour lines) the APA absorber. Different APA abatement efficiencies are analyzed. The black line denotes half of the initial concentration value used to calculate the canyon cleansing time.
Environments 04 00078 g014
Figure 15. Time series of the average concentration of the passive tracer in a deep street canyon with aspect ratio H/W = 2 without (blue line) and with (color lines) the APA absorber. Different APA abatement efficiencies are analyzed. The black line denotes half of the initial concentration value used to calculate the canyon cleansing time.
Environments 04 00078 g015
Figure 16. Average passive tracer concentration in a deep street canyon with aspect ratio H/W = 3, simulated in the presence of a constant emission from the street floor. Different APA abatement efficiencies are analyzed.
Environments 04 00078 g016
Table 1. Percent change of passive tracer average concentration in the entire volume of the canyon and in a sub-volume at human height with respect to the reference case without the scrubber for H/W = 3. Different APA abatement efficiencies are analyzed. Simulated values are relative to concentrations after 2000 s.
APA Abatement Efficiency% Change with Respect to No APA (Canyon Volume)% Change with Respect to No APA (Sub Volume)
APA 10%−35%−26%
APA 20%−48%−40%
APA 30%−59%−44%
APA 80%−71%−54%
Table 2. Percent change of passive tracer average concentration in the entire volume of the canyon and in a sub-volume at human height with respect to the reference case without the scrubber for H/W = 2. Different APA abatement efficiencies are analyzed. Simulated values are relative to concentrations after 2000 s.
APA Abatement Efficiency% Change with Respect to No APA (Canyon Volume)% Change with Respect to No APA (Sub Volume)
APA 0%−4%−7%
APA 10%−7%−10%
APA 20%−9%−13%
APA 30%−12%−17%
APA 80%−22%−30%

