1. Introduction
The herbicide atrazine (6-chloro-N-ethyl-N’-(1-methylethyl)-1,3,5-triazine-2,4-diamine) is used to control the growth of broad-leaved and grassy weeds. It and its degradation products are commonly found in the soil and surface water, and they can elute through the subsurface sediments to groundwater [
1,
2]. Atrazine concentrations can be particularly high in point source pollutions, e.g., in the vicinity of dealerships [
3,
4,
5]. Atrazine has been reported to be an endocrine disrupting compound [
6,
7]. To protect the drinking water quality, the European Commission prohibited the sale of atrazine in 1992 [
8].
Atrazine dissipation has been studied extensively due to its wide use, occurrence in environment as a contaminant, and possible adverse effects. Methods for the removal of atrazine from soil, subsurface sediments, and groundwater are needed. Microbes and microbial consortia can degrade and even mineralize atrazine [
3,
9], though the degradation rate is slow in subsurface sediments [
5,
10,
11].
The chemical decomposition of atrazine by advanced oxidation methods like sonication has also been studied [
12,
13,
14,
15,
16,
17,
18]. Mild sonication homogenizes suspensions, enhances extraction, and increases microbial productivity, while strong sonication conditions disrupt cells and cause the chemical degradation of xenobiotics [
16,
19,
20,
21,
22,
23]. Sonication separately and in combination with other advanced oxidation processes has induced chemical atrazine degradation in an aqueous solution [
13,
14,
15,
18]. Ultrasound generates hydroxyl radicals and other radical species at the extreme temperature and pressure conditions that occur when the cavities formed by sonication implode in water. The direct pyrolysis in the sonication cavities is regarded as negligible due to the low volatility of atrazine [
14]. Atrazine has also been chemically degraded by ultrasound in a slurry, where the cavitation bubbles are preferentially formed at the interface of solid and liquid [
16,
17]. When the bubble collapses, a high-speed jet is created towards the surface of the particle. As a result, the adsorbed pesticides are exposed to high temperatures and may undergo pyrolysis. It is not known, however, whether microbial atrazine degradation can be enhanced by sonication. For instance, the microbial phenantrene degradation rate was increased fourfold by intermittent sonication in a solid-liquid system [
24]. The enhanced degradation was attributed to the improved mass transport of phenantrene between the solid and liquid phase, which increased phenantrene bioavailability to microorganisms. However, the behavior of different contaminants in matrix-contaminant interactions differ [
19].
To clarify the relationships between the sonication, and the microbial and chemical atrazine dissipation in subsurface sediments, we studied sonication effects on atrazine dissipation in the subsurface sediment slurries. The hypotheses of the study were that microbial (slurries) and chemical (sterilized slurries) atrazine dissipation can be enhanced by sonication (43 kHz, 320 W), while the null hypothesis was that dissipation cannot be improved. The high initial atrazine concentration of 100 mg·L−1 was chosen, to ensure that bioavailability does not limit microbial degradation, and to reveal atrazine behavior at concentrations above the water solubility limit of 33 mg·L−1 in slurry suspensions homogenized by sonication. High concentrations represent an example of point source pollution.
2. Materials and Methods
2.1. Sediments and Chemical Analyses
Sediments were collected in drillings next to the Lahti railway station (Finland), which is located in a pesticide-contaminated groundwater area. The drill diameter was 75 mm down to about 10 m, and below that 48 mm. Sediments from the depths of 11.3–14.6 m were collected in sealed plastic bags at the drilling site, where groundwater table was at about 15 m [
25]. Sediment size fractions were separated by sieving for 30 min at the amplitude 50 (AS 200 basic, Retsch GmbH, Haan, Germany).
To determine their dry weight, 3–5 g of sediments in triplicate were dried for 16 h at 105 °C, followed by heating at 550 °C for 4 h to measure the organic matter (SFS-EN 13039, SFS-EN 13040). Sediment total carbon (total-C) was analyzed in duplicate by LECO Model 2000 CNS analyzer (LECO Corporation, St. Joseph, MI, USA) according to its instructions. Sediment ammonium (the limit of detection, LOD, 0.039 µg·g
−1), nitrate (LOD, 0.1 µg·g
−1), nitrite (LOD, 0.1 µg·g
−1), and elements (Cd, LOD 0.2 µg·g
−1; Co; Cr; Cu; Pb; Mn; Ni; Fe; Zn) were determined as a purchased service from Ramboll Analytics Ltd. as presented in Talja et al. [
10]. Microorganisms were cultivated from sediment slurries.
2.2. Sonication Experiments
Sonication experiments were done in 100 mL flasks with hole (diameter 5 mm) caps, which were covered with aluminum foil. The flasks contained 15.0 g (dry weight) of sediment, 50 mL of sterile distilled water, and 100 mg·L−1 of atrazine (0.5 mL from 10 g·L−1 stock in methanol; Dr. Ehrenstorfer GmbH, Augsburg, Germany). The sediment slurries were sterilized by autoclaving (Instru, Santasalo-Sohlberg, Helsinki, Finland) on three successive days for 1 h at 121 °C and 101 kPa pressure. The flasks were incubated at the room temperature of 21 ± 2 °C in a shaker (120 rpm, Laboshake, Gerhardt, Konigswinter, Germany), all in triplicate.
In the 0, 5, and 10 min sonication experiment, the slurries amended with 100 mg·L−1 of atrazine were allowed to stabilize on the shaker (120 rpm) for five days, and then the effects of 0, 5, and 10 min sonications on atrazine concentrations were studied using Branson 8510 bath sonicator (43 kHz, RF-power 320 W; W.A. Brown Industrial Sales Inc., Richmond, VA, USA). The slurry and sterilized slurry flasks were placed in a sonicator bath filled with water to the mark. The initial bath water temperature was at room temperature, and it increased approximately 1.3 °C/10 min sonication. The flasks were sonicated once a day for 0, 5, or 10 min on days 5, 6, 7, 8, 12, 13, 14, and 15, followed by a stabilization period. As the effects of the once a day sonications were minor, the sonications were continued twice a day for 0, 5, and 10 min on days 25, 26, 27, 28, 29, 32, 33, 34, 35, and 36. The 100 µL samples were taken on days 0, 1, and before the daily sonications. Prior to the samplings, the flasks were shaken to evenly distribute atrazine, and then large particles were allowed to settle for at least 15 min, while the suspended colloids remained in the water phase.
In the 0, 20, and 30 min sonication experiment, the slurries amended with 100 mg·L−1 of atrazine were allowed to equilibrate on the shaker (120 rpm) for six days. Then the impacts of twice a day sonications for 0, 20, and 30 min on atrazine concentrations were studied in the slurries and sterilized slurries, as presented above. The flasks were sonicated twice a day for 0, 20, or 30 min on days 6, 7, 10, 11, 12, 13, and 14. The 100 µL samples were taken at the beginning of the experiment (day 0) and before the sonications on days 6, 10, 13, and 17. Samples were taken as in the 0, 5, and 10 min sonication experiment.
2.3. Pesticide Adsorption and Microbial Growth in the Sediment Slurries
To determine the quantity of atrazine remaining adsorbed in the sediments and microbial numbers in the slurries with and without atrazine addition, the following experiment was done. Sediments (15.0 g) and 50 mL of sterile distilled water were incubated with and without 100 mg·L
−1 of atrazine as presented above, all in duplicate. The slurries were stabilized for 10 days on a shaker as presented above (final atrazine concentration 61.9 ± 8.9 mg·L
−1 in atrazine-amended slurries) to allow adsorption to occur and reach the equilibrium stage [
26]. The liquid phase was removed, ten-fold serial dilution was performed, and 100 µL was cultivated on mineral agar plates having 33 mg·L
−1 of atrazine as a nitrogen source, as presented in Liu et al. [
27] and Pukkila et al. [
28]. The colonies were counted after 5 days incubation at the temperature of 21 ± 2 °C. The sediment was extracted as presented below.
2.4. Pesticide Analyses
The 100 µL sample was supplemented with 400 µL of methanol:water (3:1, v/v), and 100 µL of the internal standard simazine in methanol: water (3:1, v/v) to gain the final concentration of 11.9–15.3 mg·L−1. The simazine background level in the sediments was low, 11.4 µg·L−1 (<0.1% of total). The 600 µL standards in methanol:water (3:1, v/v) contained 0.5, 2.5, 5, 10, 20 and 35 mg·L−1 of atrazine (external standards), and the same quantity of simazine as in samples (internal standards). The responses were linear with the correlation coefficients of 0.997 ± 0.007 (R2 ± S.D.). The quantification limit was about 0.56 mg·L−1 for atrazine. The standards and samples were filtered through 0.45 µm GHP polypropylene membrane filters (Acrodisc®, Gelman, Pall Corporation Ltd., New York, NY, USA), and 20 µL was analyzed by high performance liquid chromatography (HPLC) equipped with Shimadzu Prominence SIL-20A auto sampler, LC-20AT solvent delivery module, DGU-20A5 on-line degasser, SPD-20A UV/VIS detector (225 nm; Shimadzu, Kyoto, Japan), SunFire column (C18, 3.5 µm, 3.0 mm × 150 mm, Waters, Milford, MA, USA) and Shimadzu LC Solution software control system (Shimadzu, Kyoto, Japan). The chromatographic separation was carried out using the following gradient profile: the initial acetonitrile concentration was held at 30% for 3.5 min, and then it was increased to 65%, which was held until 8.5 min. Finally, the acetonitrile concentration was decreased back to 30%, which was held until 14 min. The mobile phase flow rate was 0.4 mL·min−1.
To extract atrazine adsorbed to 15 g of sediments, 20 µg of propazine (Dr. Ehrenstorfer GmbH, Augsburg, Germany) was added as an internal standard. The sediment was extracted three times with 18.0 mL of methanol:water (3:1,
v/v) by shaking overnight at 200 rpm (Unimax 1010, Heidolph Instruments, Schwabach, Germany). Before the extractions, the sample was sonicated for 15 min at 20 °C (40 kHz, Everest, Istanbul, Turkey). The extracts were separated by centrifugation for 10 min at 1250×
g (Multifuge 1S-R Heraeus, Kendro Laboratory Products, Osterode, Germany), and stored at −20 °C. The combined extracts were evaporated to dryness, and the residue was extracted twice with 300 µL of acetone. The extraction solution was sonicated as above, followed by centrifugation (13,000×
g). The pooled acetone extracts were filtered, and pesticides were analyzed using Shimadzu GCMS-QP-2010Ultra GC-MS (Shimadzu, Kyoto, Japan), autosampler AOC-20i+s, ZB-5MS capillary column (29 m, 0.25 mm, 0.25 µm), carrier gas helium (1.29 mL/min), injector temperature 250 °C, and 2 µL splitless injection. The oven temperature was held at 120 °C for 2 min, increased 20 °C/min to 180 °C, held for 5 min, and then increased 20 °C/min to 280 °C, held for 8 min. The mass spectra were recorded at an electron energy of 70 eV. The ion source temperature was 230 °C, and interface temperature was 250 °C. Five standards in acetone contained 0.133–3.435 nmol·L
−1 of atrazine, desethylatrazine (DEA), deisopropylatrazine (DIA), and desethyldeisopropylatrazine (DEDIA). The limit of quantification (LOQ) was about 0.1 µg/sample. The ions followed were m/z 202 and 215 (quantification) for atrazine; 174 (quantification) and 187 for DEA, m/z 158 (quantification), 173 and 175 for DIA, m/z 110, 145 (quantification) and 147 for DEDIA, and m/z 172, 187, 214, and 229 (quantification) for propazine. The extraction efficiency of atrazine is 102.1% ± 14.0%. The quantity of atrazine, simazine and 2,6-dichlorobenzamide (BAM) in the sediments was determined as presented in Mattsson et al. [
25].
2.5. Calculations
Results are presented on a dry weight basis. Atrazine concentrations are presented as mean ± S.D. (
n ≥ 3). Results were analyzed using two-factor (sonication and autoclaving) repeated measures analysis of variance (RMA), followed by pairwise comparisons (PC) (IBM SPSS Statistics, version 23, IBM Corporation, New York, NY, USA). In the 0, 5, and 10 min sonications, the RMA was performed separately on days 5 to 15 (sonications once a day), and 25 to 36 (sonications twice a day). In the 0, 20, and 30 min sonications, the RMA was performed between days 6 to 17 (
Table 1). The highest atrazine concentrations reached by sonications were compared using Anova, followed by Tukey honest significant difference (HSD) test. Mann-Whitney’s test (M-W) was used for pairwise comparisons.
3. Results
3.1. Sediments
Sediment cores were collected by drilling in a groundwater area contaminated with simazine, atrazine, and BAM in concentrations of 38, 13, and 5 µg·kg−1 (dry weight), which are equivalent to 0.57, 0.195, and 0.075 µg in 15 g of sediments, respectively. The sediment size fractions were: <45 µm, 0.9%; 45–100 µm, 2.6%; 100–125 µm, 3.4%; 125–250 µm, 33.7%; 250–500 µm, 38.6%; 0.5–1 mm, 16.7%; 1–2 mm, 3.5%; 2–4 mm, 0.2%; 4–8 mm, 0.2%; and >8 mm (diameter), 0.2%, i.e., the sediment was sandy. The fractions ≥4 mm were removed from the sonication experiments. Sediment organic matter (4.3 ± 0.2 mg·g−1) and total-C (0.31 mg·g−1) concentrations were low, and ammonium, nitrate, nitrite, and Cd were below the detection limits. The sediments contained 3.4 ± 1.0 µg·g−1 of cobalt, 12 ± 4 µg·g−1 of chromium, 15 ± 5 µg·g−1 of copper, 2.8 ± 1.0 µg·g−1 of lead, 96 ± 24 µg·g−1 of manganese, 6.1 ± 2.0 µg·g−1 of nickel, 12 ± 3 mg·g−1 of iron, and 27 ± 9 µg·g−1 of zinc.
Sonication effects on atrazine dissipation were studied in the slurries and sterilized slurries, to separate microbial and chemical dissipation. Sonication times were once (days 5–15) and twice a day (days 25–36) for 0, 5 and 10 min in the first experiment, and twice a day (days 6–17) for 0, 20 and 30 min in the second experiment.
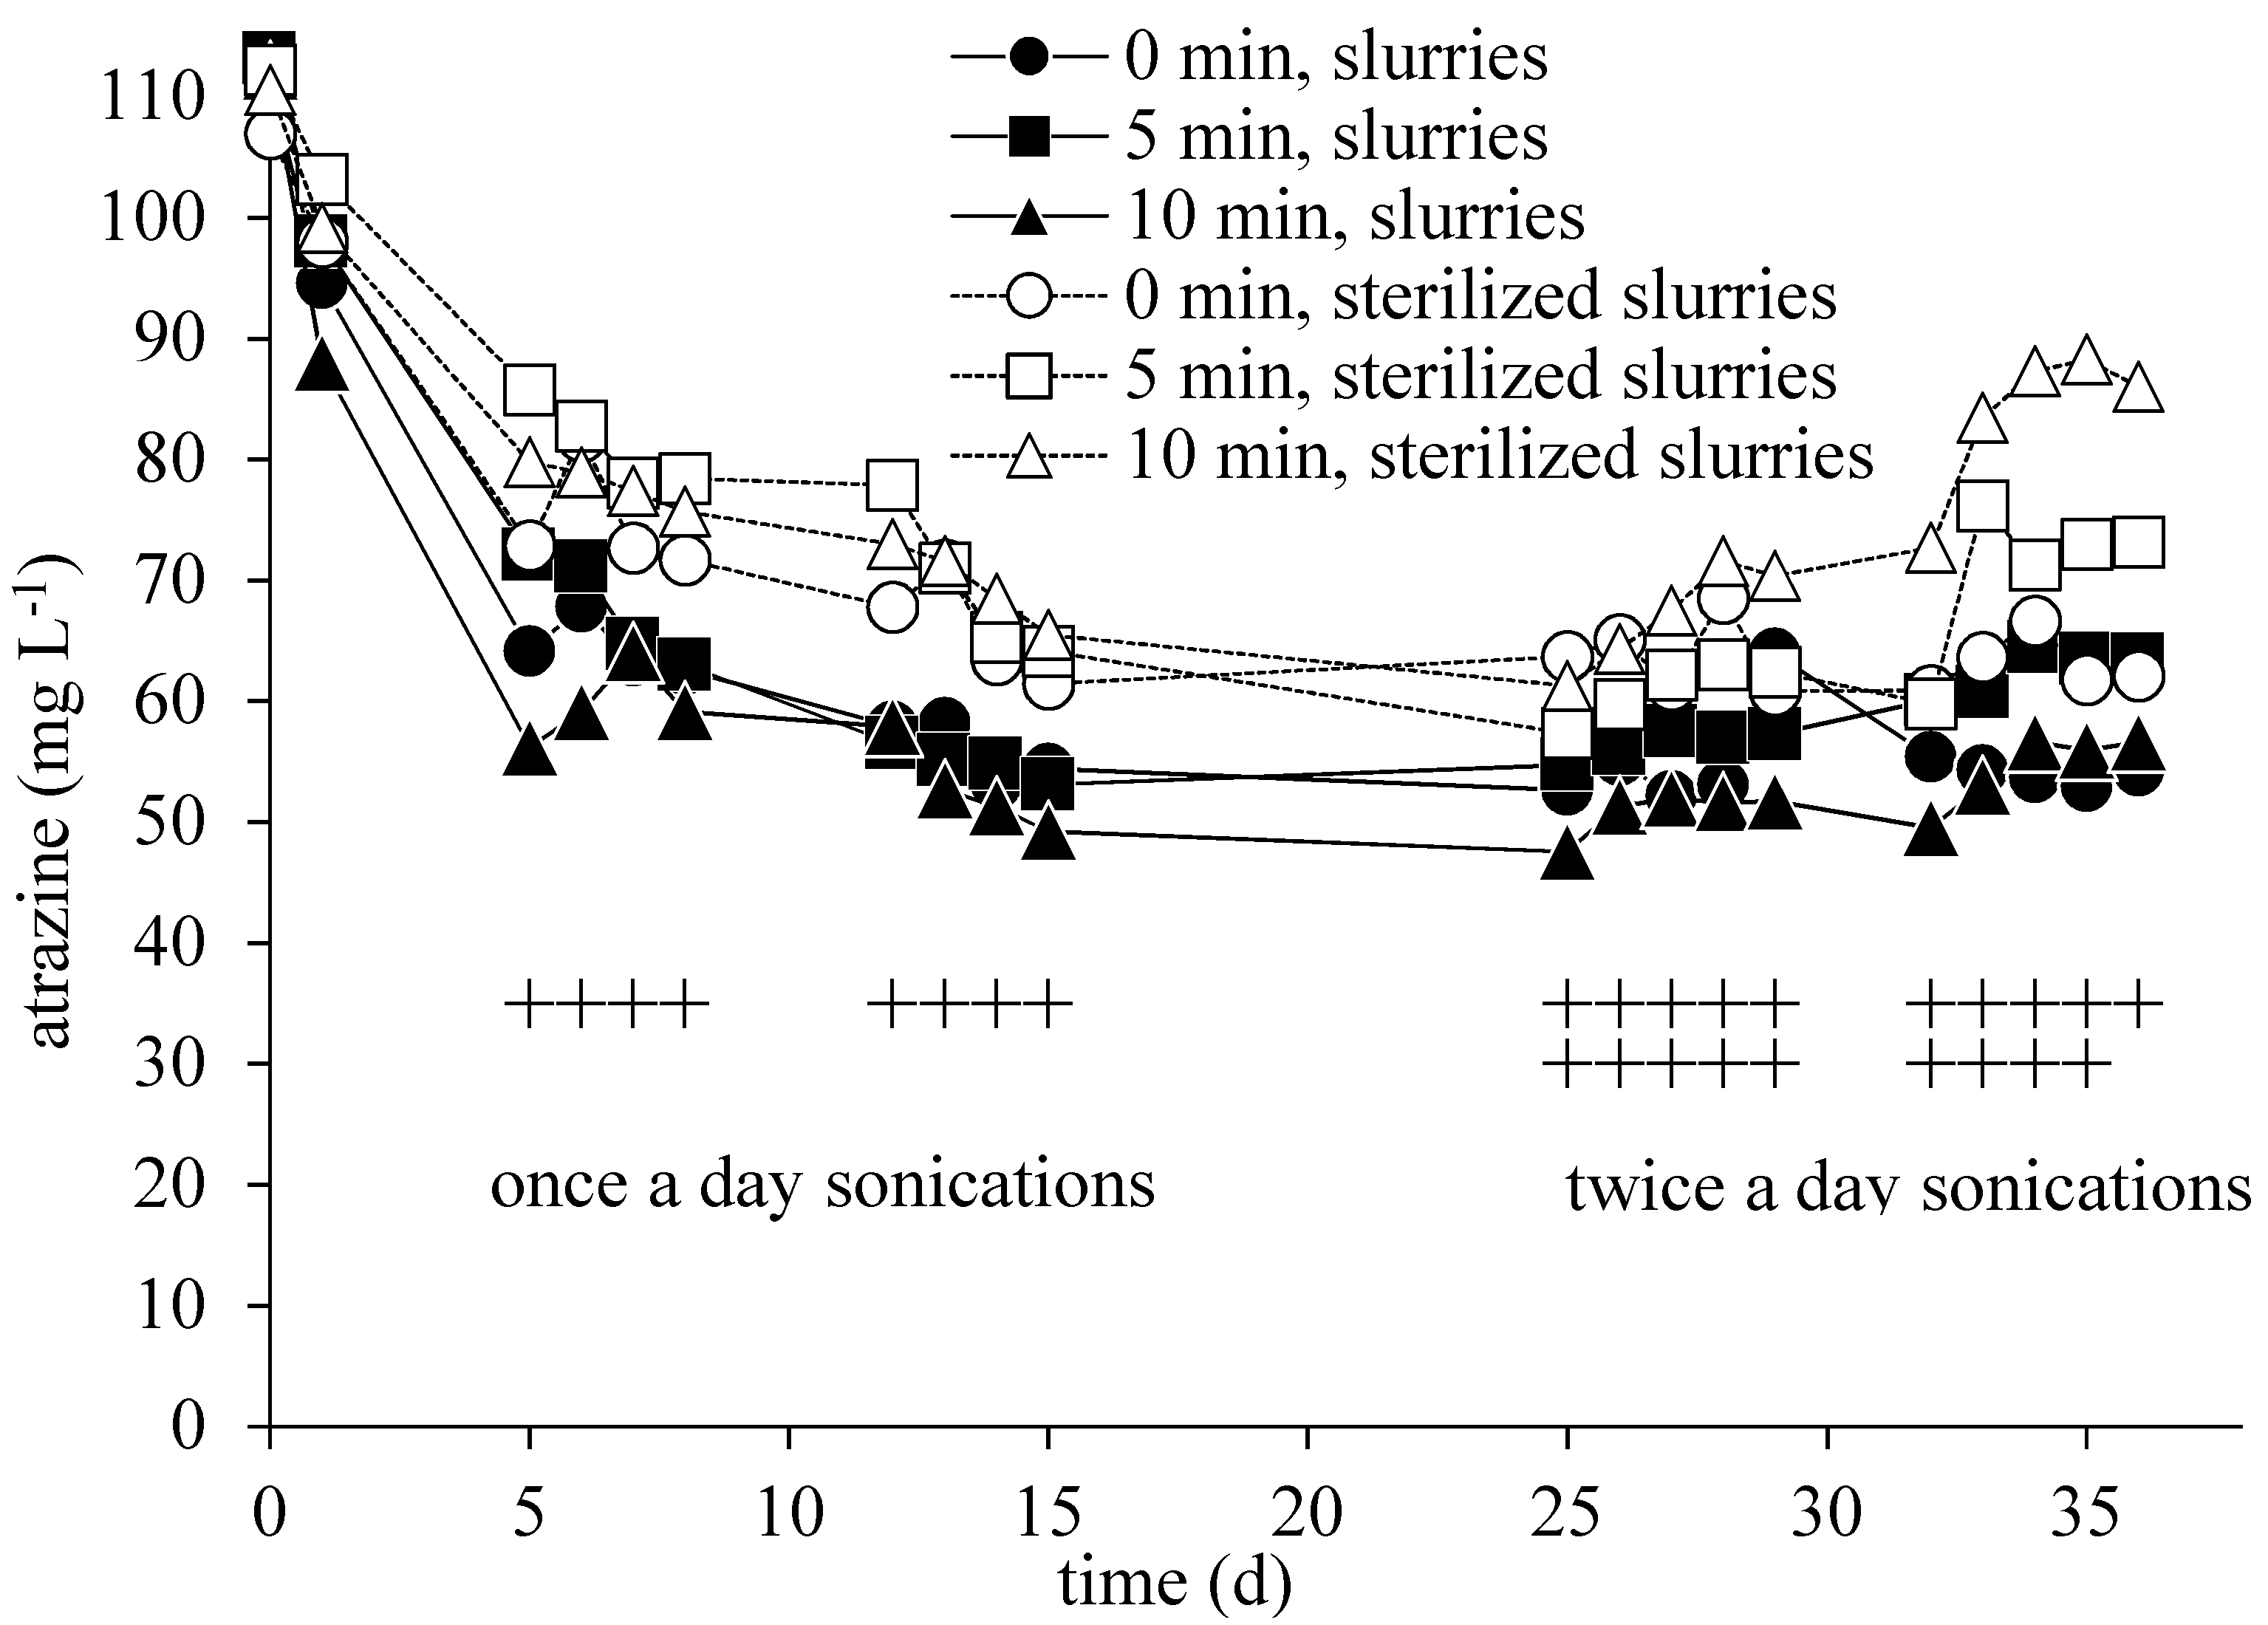
3.2. The 0, 5 and 10 min Sonication Experiment
Atrazine concentrations fell during the initial stabilization period from 100 mg·L
−1 to 64.1 ± 8.9 mg·L
−1 in the slurries, and only to 79.5 ± 12.3 mg·L
−1 in the sterilized slurries, the difference of 15.4 mg·L
−1 being statistically significant (M-W,
p = 0.007;
Figure 1). Atrazine concentrations in the slurries continued to be lower than in the sterilized slurries throughout the experiment (RMA,
p < 0.001;
Table 1), the difference between the non-sonicated slurries and the sterilized slurries being on the average 9.7 ± 3.2 mg·L
−1 on days 5–36.
Once a day sonications for 5 and 10 min were not strong enough to affect atrazine concentrations in the slurries and sterilized slurries, compared to the non-sonicated slurries and sterilized slurries, as can be seen from two-factor RMA results on days 5–15 (
p = 0.421 for sonication;
Table 1,
Figure 1). When the 5 and 10 min sonications were repeated twice a day between days 25–36, atrazine concentrations in the sterilized slurries sonicated for 10 min were higher than in those sonicated for 5 min, or in those without sonication (RMA,
p = 0.002 for sonication; PC,
p ≤ 0.002;
Figure 1,
Table 1). Twice a day sonications for 5 min were not strong enough to affect atrazine concentrations in the sterilized slurries, but sonications twice a day for 10 min increased atrazine concentrations to the highest measured values of 86.0 ± 7.7 mg·L
−1. In contrast, in the slurries twice a day sonications for 5 and 10 min did not affect significantly atrazine concentrations (RMA,
p = 0.296 for sonication), which were 56.6 ± 10.9 mg·L
−1 on days 25–36. Indeed, an interaction between the sterilization and sonication was obtained in two-factor RMA on days 25–36 (
p = 0.007), that is sonication effects on atrazine concentrations differed between the sterilized slurries and slurries. Twice a day sonications for 10 min increased atrazine concentrations in the sterilized slurries, but not in the slurries apparently due to microbial atrazine degradation.
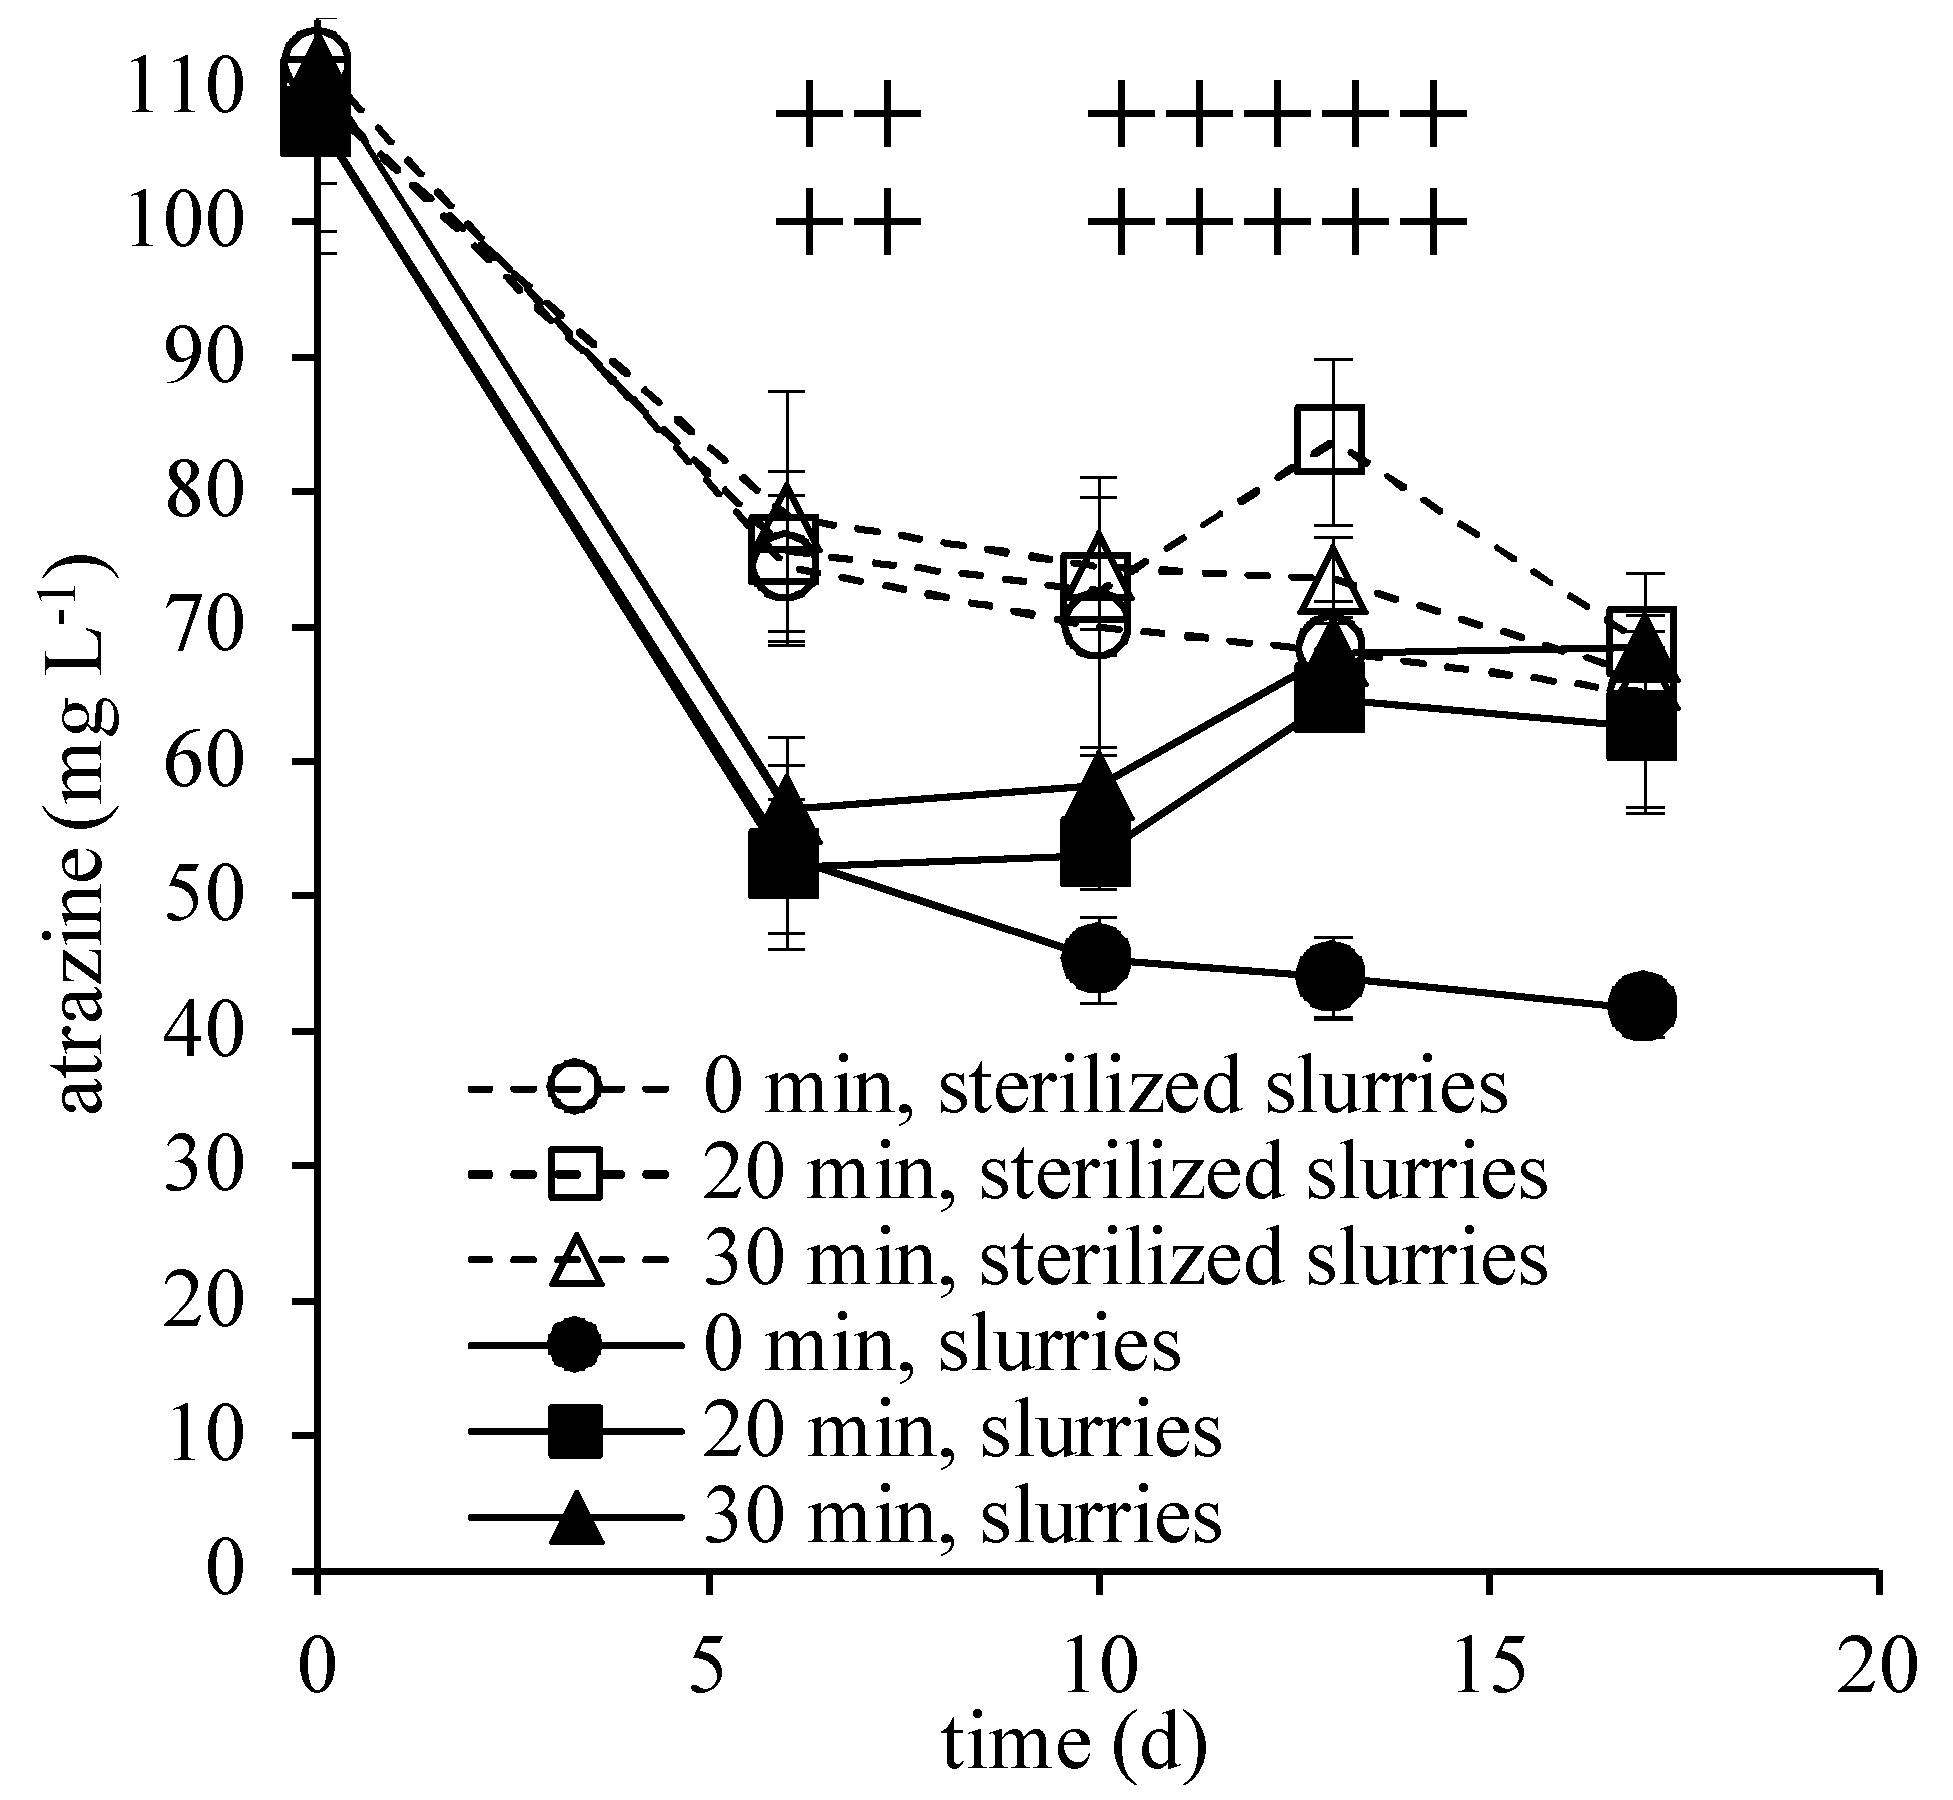
3.3. The 0, 20 and 30 min Sonication Experiment
After the initial stabilization period, atrazine concentrations in the slurries (53.8 ± 5.4 mg·L
−1) were again lower than in the sterilized slurries (76.0 ± 6.4 mg·L
−1) (M-W,
p < 0.001,
Figure 2). The influence of sterilization continued to be significant also on days 6–17 (RMA,
p < 0.001 for sterilization;
Table 1,
Figure 2). Atrazine concentrations in the non-sonicated slurries remained on average 23.5 ± 1.4 mg·L
−1 lower than in the non-sonicated sterilized slurries throughout the experiment on days 6–17. Decreased atrazine concentrations were also measured in the sonicated slurries, compared to the sonicated sterilized slurries.
Twice a day sonications for 20 and 30 min did not affect atrazine concentrations of 75.1 ± 7.9 mg·L
−1 in the sterilized slurries on days 6–17 (RMA,
p = 0.416;
Figure 2,
Table 1), as the concentrations were still high immediately after the stabilization period. In contrast, twice a day sonications increased atrazine concentrations from 44.0 ± 3.0 mg·L
−1 of the non-sonicated slurries to 66.3 ± 3.0 mg·L
−1 of the slurries sonicated for 20 and 30 min, the difference of 22.3 mg·L
−1 being statistically significant (RMA,
p = 0.001; PC,
p ≤ 0.002). Thus, an interaction between the sterilization and sonication was obtained in two-factor RMA on days 6–17 (
p = 0.050), which indicates that 20 and 30 min sonication effects on atrazine concentrations differed between the slurries and sterilized slurries. Twice a day sonications for 20 and 30 min did not affect atrazine concentrations in the sterilized slurries, but the sonications increased concentrations in the slurries. Microbes in the slurries did not have time to degrade more atrazine during the stabilization period, and thereafter the longest sonication times of 20 and 30 min may have disturbed the microbial degradation.
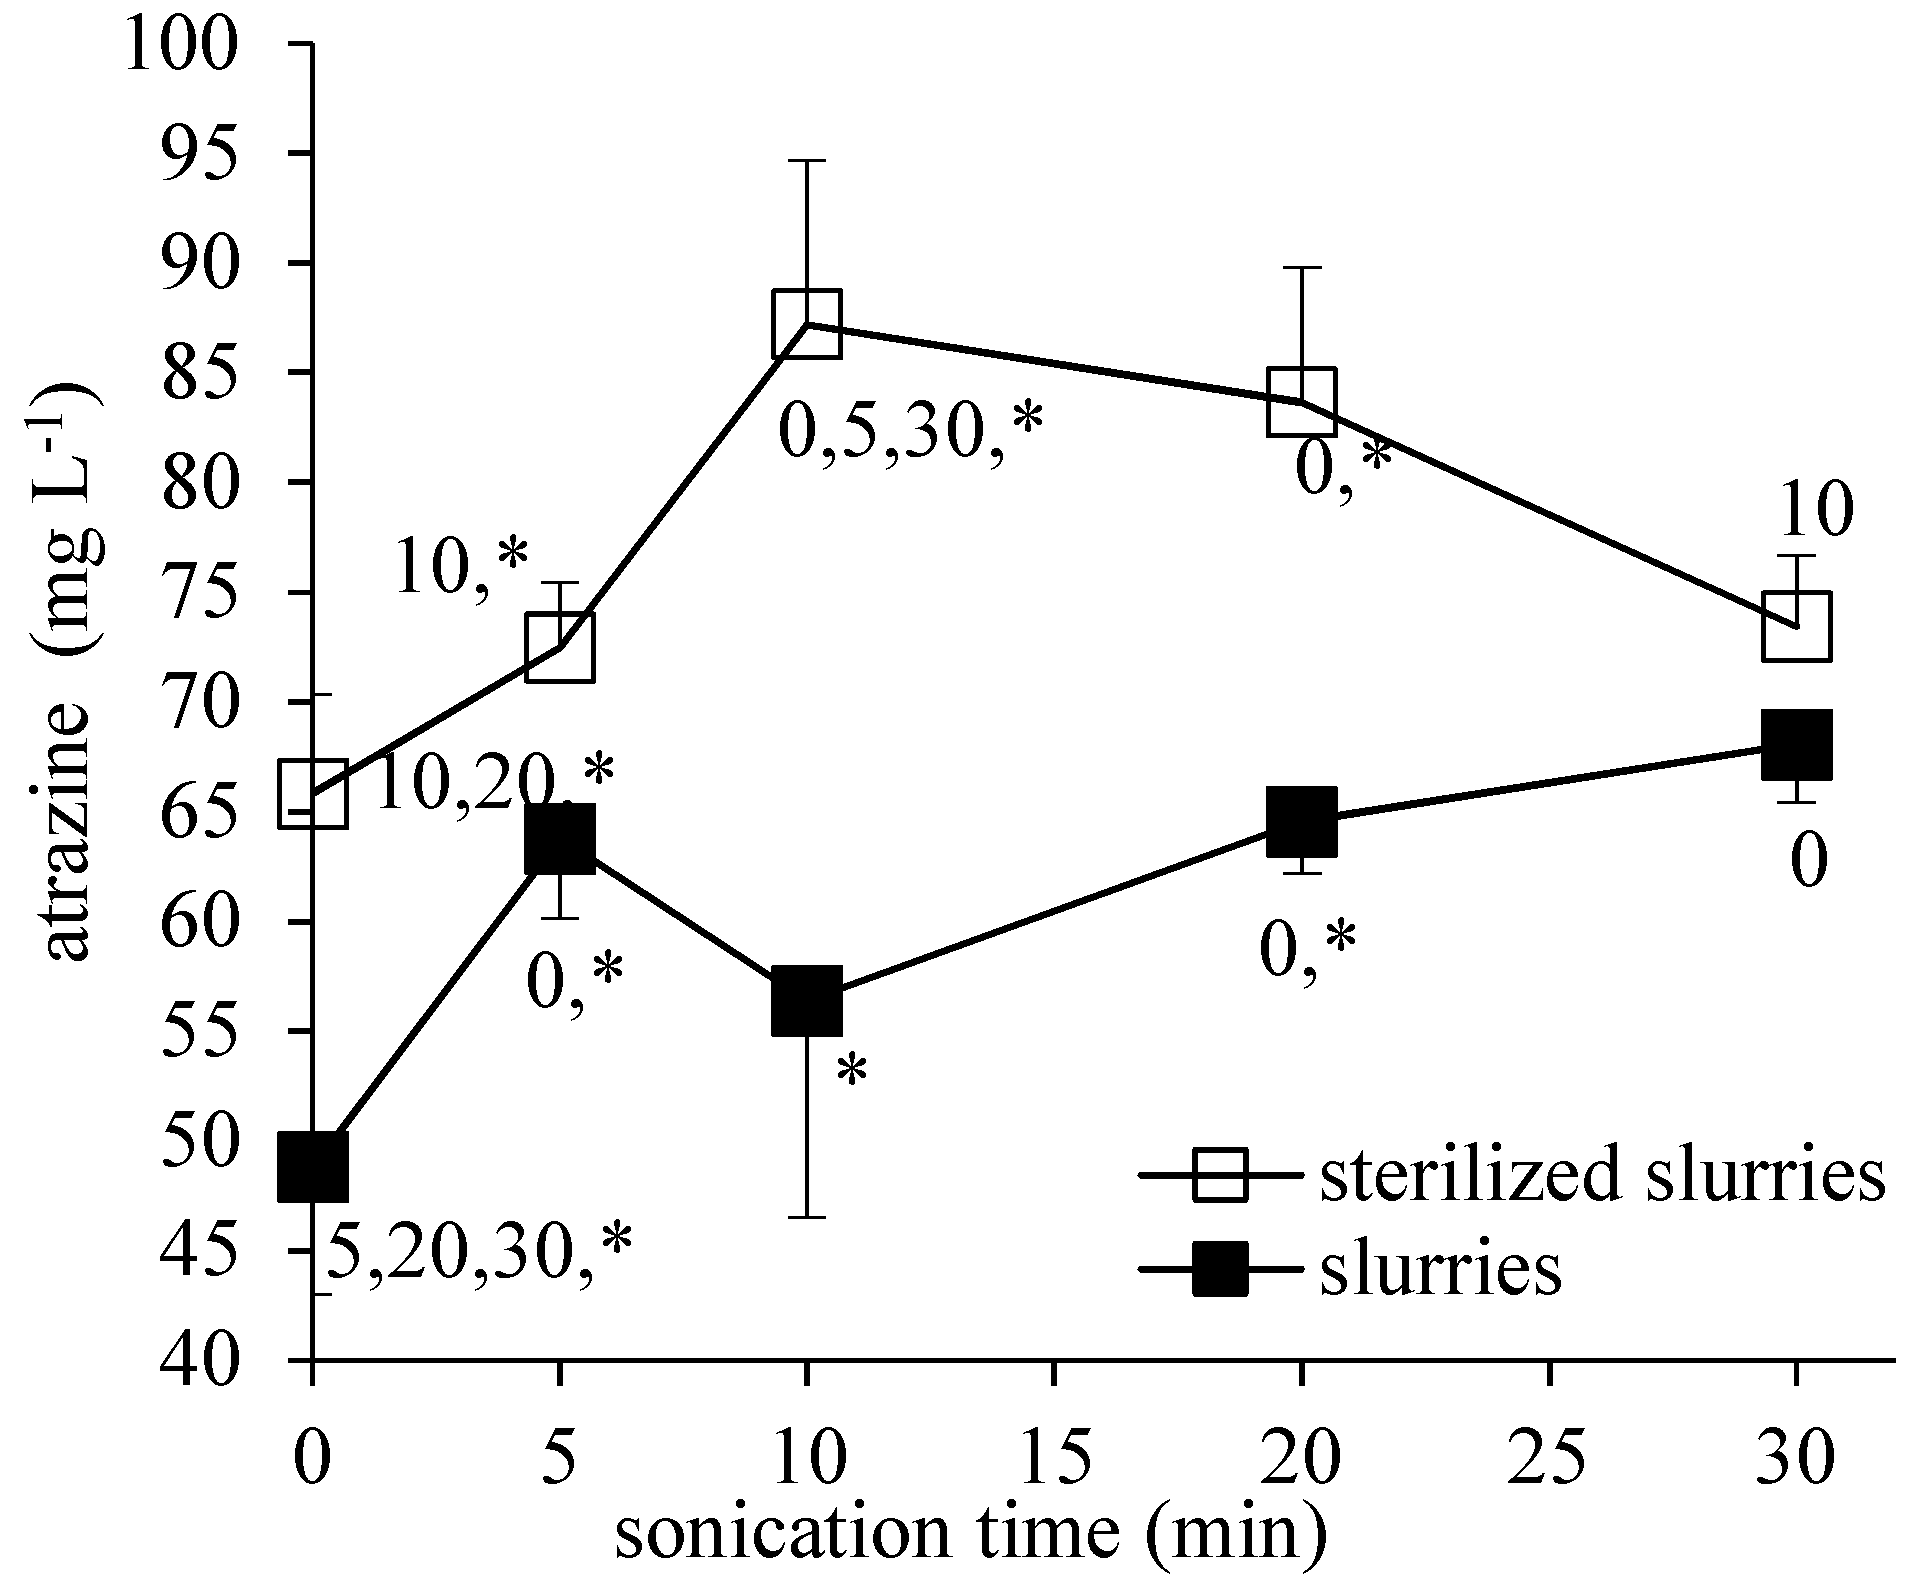
3.4. Summary of the Sonication Effects on Atrazine Concentrations
The highest atrazine concentrations, achieved in the slurries and sterilized slurries by sonication, were plotted as a function of twice a day sonication times of 5, 10, 20, and 30 min (
Figure 3). Atrazine concentrations in the non-sonicated sterilized slurries were 65.8 ± 4.5 mg·L
−1. When the sterilized slurries were sonicated twice a day for 10–20 min, atrazine concentrations increased significantly by 19.6 mg·L
−1 to 85.4 ± 6.4 mg·L
−1 (Anova and Tukey HSD,
p ≤ 0.002) (
Figure 3). When the sonication time was further increased to twice a day for 30 min, atrazine concentrations in the sterilized slurries increased only by 7.6 mg·L
−1 to 73.4 ± 3.2 mg·L
−1 compared to the non-sonicated sterilized slurries, which is not a statistically significant difference. Atrazine concentrations in the sterilized slurries sonicated twice a day for 10 min were higher than those in the sterilized slurries sonicated twice a day for 30 min (Tukey HSD,
p = 0.034). In the latter, chemical atrazine dissipation may have occurred.
Atrazine concentrations in the non-sonicated slurries were 48.8 ± 5.8 mg·L
−1 (
Figure 3). The concentrations increased to 63.2 ± 6.5 mg·L
−1 due to the twice a day sonications for 5–30 min; on average, 14.4 mg·L
−1 of atrazine was released by sonication compared to the non-sonicated slurries. Atrazine concentrations in the sonicated slurries were significantly higher than in the non-sonicated slurries (Anova,
p = 0.002; Tukey HSD,
p ≤ 0.017), with the exception of 10 min sonications (Tukey HSD,
p = 0.360). Atrazine concentrations increased least in the slurries sonicated twice a day for 10 min, while the atrazine quantity bound to the sediments in the non-sonicated slurries was only 4.6 ± 3.9 mg·kg
−1 (1.4 ± 1.2 mg·L
−1). The DEA quantity in the sediment extracts of the non-sonicated slurries was below the LOQ, and DIA and DEDIA residues were not detected. In the experiment done to determine the pesticide adsorption and microbial growth, the microbial numbers increased from 7×10
4 cfu·mL
−1 of the non-atrazine amended slurries to >10
8 cfu·mL
−1 of the slurries amended with 100 mg·L
−1 of atrazine. The microbial atrazine degradation seemed to be the best in the slurries sonicated twice a day for 10 min.
4. Discussion
Atrazine concentrations were the lowest in the slurries, and they could not be increased by sonication to the same levels as in the sterilized slurries, the difference being as much as 30.8 mg·L
−1 between the slurries and sterilized slurries sonicated twice a day for 10 min, while only about 1.4 ± 1.2 mg·L
−1 of atrazine was adsorbed to the sediments. The sediments were collected from the depth of 11.3–14.6 m in groundwater area having atrazine in sediments and groundwater [
10,
25]. As the atrazine exposure increases the density or activity of atrazine-degrading microorganisms [
5], a significant portion of atrazine in the slurries appeared to be degraded by inherent sediment microorganisms. Microbial growth increased by atrazine addition in the atrazine-amended sediment slurries compared to non-amended slurries, and ammonium, nitrate, and nitrogen concentrations in the sediments were below the detection limit. This suggests that the increased microbial growth could be related to the use of atrazine as a nitrogen source.
Microbial atrazine degradation ceased at high concentrations above the water solubility limit of about 33 mg·L
−1 [
29], at about 48.8 mg·L
−1 in the non-sonicated slurries, and at about 63.2 mg·L
−1 in the sonicated slurries. For comparison, pesticide dichlobenil dissipated in subsurface deposit slurries to the low concentration of 1.0–6.3 mg·L
−1, and its degradation product BAM to 3.0–11.3 mg·L
−1 [
30]. Atrazine forms strong complexes in a solution with organic and inorganic sediment colloids [
31,
32]. Such interactions could prevent microbial atrazine degradation in the slurries, and also the atrazine release by sonication for microbial degradation.
Mild sonication could enhance microbial atrazine degradation, as 15 min sonication/240 min cycle has increased microbial ethanol production from cellulose (sonication horn, 36 kHz, 150 W) [
33]. In this study, microbial atrazine degradation was the best in the sediment slurries sonicated twice a day for 10 min. However, sonication improved microbial degradation only slightly or not at all, as atrazine concentrations in the sonicated slurries did not fall below those in the non-sonicated slurries. In addition, the sonication time range that affected atrazine concentrations and allowed microbial atrazine degradation was narrow. Once a day sonications for 10 min, or twice a day sonications for 5 min did not affect atrazine concentrations, while the increase in the sonication time to twice a day for 20–30 min may already have inhibited microbial atrazine degradation. Similarly, 20 min sonications at the intervals of 120/240 min have enhanced microbial phenantrene degradation in a solid-liquid system, but not 25 min sonications at intervals of 205 min in two-liquid-phase systems (sonication horn, 42 kHz, 70 W) [
24,
34]. Biological activity started to decrease after 5 min sonication (40 kHz, 0.115 W/cm
3) in the regeneration of biological activated carbon [
35]. Continuous sonication for 12 h prevented growth, cell division and sugar metabolism of
Klebsiella oxytoca strain P2 (sonication horn, 36 kHz, 150 W) [
33]. Microbes tolerate stronger sonication conditions in the slurries than in the pure liquid, and intermittent sonication better than continuous, while sonication time ranges improving microbial degradation may be quite narrow.
Microbial atrazine degradation in the slurries may have increased differences in atrazine concentrations between the slurries and sterilized slurries. Simultaneously autoclaving likely increased atrazine concentrations in the sterilized slurries compared to slurries (
Figure 1 and
Figure 2,
Table 1), similarly as anilines and trichlorophenoxyacetic acid (2,4,6-T) were less bound in autoclaved soils than in soils [
36,
37]. Autoclave sterilization decreases atrazine adsorption by altering the sediment structure and sorption capacity, such as dissolved organic carbon/matter in solution decreased atrazine adsorption [
38,
39]. Organic matter released in autoclaving could increase solubility, as humic substances in water increased chlordane solubility [
40]. In the sediments of this study, organic matter and element concentrations were quite low, compared to the subsurface deposits [
10,
28] and materials like biochars [
26], which resulted in low atrazine adsorption (1.4 ± 1.2 mg·L
−1). It is difficult to estimate precisely how much of the difference in atrazine concentrations between the slurries and sterilized slurries was due to autoclaving and how much was due to microbial degradation. Part of atrazine could also be solid in the slurries of this study. However, atrazine was quite evenly distributed in the liquid phase, based on small deviations in the results between parallel experimental flasks under continuous shaking. Further, sonication suspended solid atrazine particles homogenously in the slurries. Based on the highest measured concentrations in the sterilized slurries, the most appropriate sonication time for dissolving atrazine and homogenizing atrazine suspensions was between 10 and 20 min.
Atrazine concentrations in the sterilized slurries sonicated twice a day for 30 min were lower than in those sonicated twice a day for 10 min (
Figure 3). The twice a day sonications for 30 min may have been strong enough to cause chemical atrazine dissipation in the sterilized slurries, while atrazine concentrations in the slurries sonicated twice a day for 5–30 min were the same. The autoclave sterilization has disturbed the composition of subsurface deposits and enhanced chemical atrazine dissipation [
10]. In this study, sonication conditions needed for chemical atrazine dissipation in the autoclave-sterilized slurries seemed to be milder than in the slurries.
According to the literature, chemical atrazine dissipation by sonication in aqueous solution has varied between 20% and 100%, depending on sonication powers, frequencies, and the type of the sonication equipment (
Table 2). In studies using sonication horn, 20%–55% of atrazine was dissipated at the frequency of 20 kHz and powers of 18.5–22.8 W [
14,
15]. When the frequency increased to 500 kHz, the atrazine degradation rate increased to 100% [
15]. When the power increased to 500 W, the atrazine degradation rate increased to >81% [
13]. Generally, in the presence of the same sonication power and frequency, the chemical atrazine degradation decreases when the sonication horn is changed to the sonication bath, and aqueous solution is changed to the sediment slurry. Water in the sonication bath and soil/sediment in the slurry reduce the sonication efficiency for chemical atrazine degradation. In studies using the sonication horn in soil slurries and sonication powers between 150 and 1700 W (20 kHz), over 75% of atrazine was degraded [
16,
17]. Xu et al. [
18] used the sonication bath with 400 kHz frequency and 120 W power to degrade 45% (100%) of atrazine in water using long sonication times of 60 (360) min. In this study, the sonication at the 43 kHz frequency and 320 W power twice a day for 30 min may have caused chemical atrazine dissipation of <26.6% of the initial quantity of 100 mg·L
−1 (day 13,
Figure 2). However, concentrations did not decrease below those in the non-sonicated sterilized slurries. With the equipment used, longer sonication times are needed to increase chemical atrazine dissipation in the slurries.
Atrazine sale in Finland ended in 1992, but atrazine is still found in groundwater and subsurface sediments [
10,
25]. The results of this study showed that microbes able to degrade atrazine occur in the drilling site sediments collected from the groundwater recharge area, but the microbial atrazine degradation ceased at high concentrations. Therefore, microbial atrazine degradation may be limited during water run-off through the deep vadose zone sediments into the groundwater, though atrazine dissipation in flowing water has been greater than in stagnant water [
41]. The interactions of atrazine and particles in the water phase appeared to be strong, in addition to the adsorption to sediments. These interactions should be overcome for bioremediation of atrazine-contaminated groundwater and sediments. The sonication powers, frequencies and times able to release atrazine from the interactions were quite close to those damaging microorganisms. The enhancement of microbial atrazine degradation in environment by sonication may be difficult in sediments with variable composition. However, sonication can be used to enhance chemical atrazine degradation through direct pyrolysis on particle surfaces, and/or through formation of hydroxyl radicals and other radical species [
17,
18]. Xu et al. [
18] found that atrazine sonodegradation proceeded to ammeline through the pathways of alkylic oxidation, dechlorination-hydroxylation, alkylic hydroxylation and dealkylation.
5. Conclusions
Atrazine appeared to be degraded in the slurries by indigenous sediment microbes, as atrazine concentrations could not be increased by sonications twice a day for 10 min, but they increased in the sterilized slurries. In addition, microbial numbers increased in the sediment slurries amended with 100 mg·L−1 of atrazine, but not in the slurries without atrazine addition, suggesting that atrazine was used as a nitrogen source in the slurries exhausted of nitrogen. However, microbial atrazine degradation was inhibited at high concentrations above the water solubility limit of 33 mg·L−1, at about 48.8 mg·L−1 in the non-sonicated slurries, and at about 63.2 mg·L−1 in the sonicated slurries. All water-soluble and also part of atrazine above the solubility limit (up to 48.8–63.2 mg·L−1) seemed not to be bioavailable, apparently due to the interactions with the slurry particles and sediments. Sonication times needed to release atrazine from such interactions for microbial degradation appeared to be close to those damaging microbes. Autoclave sterilization affected sediment structure, decreased atrazine adsorption, and increased its concentration in the sterilized slurries. Atrazine seemed to dissipate chemically in the sterilized slurries under milder sonication conditions than in the slurries. The concentrations in the sterilized slurries did not increase by twice a day sonications for 30 min, as they did in the slurries where microbial degradation may have impaired. However, atrazine concentrations in the slurries and sterilized slurries did not fall due to twice a day sonications for 5–30 min (43 kHz, 320 W, sonication bath) below those in the non-sonicated slurries and sterilized slurries. Although indigenous microbial atrazine degradation was observed in the heterogeneous sediments at high concentrations, it may be difficult to improve by sonication, opposite to the hypothesis. However, sonication can be used for enhanced chemical atrazine dissipation. In addition, the results revealed that microbial atrazine degradation ceased in the slurries at high concentrations above the water solubility limit.


