Article

A New Method of Environmental Assessment and Monitoring of Cu, Zn, As, and Pb Pollution in Surface Soil Using Terricolous Fruticose Lichens

1
Graduate School of Science and Engineering, Ehime University, Bunkyo-cho 2-5, Matsuyama, Ehime 790-8577, Japan
2
Faculty of Collaborative Regional Innovation, Ehime University, Bunkyo-cho 3, Matsuyama, Ehime 790-8577, Japan
3
Faculty of Education, Ehime University, Bunkyo-cho 3, Matsuyama, Ehime 790-8577, Japan
4
Osaka Museum of Natural History, Ikeda-Kitamachi 24-1, Neyagawa, Osaka 572-0073, Japan
*
Author to whom correspondence should be addressed.
Environments 2016, 3(4), 35; https://doi.org/10.3390/environments3040035
Submission received: 31 October 2016 / Revised: 8 December 2016 / Accepted: 8 December 2016 / Published: 11 December 2016

Abstract

:
Levels of trace element pollution in surface soil can be estimated using soil analyses and leaching tests. These methods may reveal different results due to the effect of soil properties, such as grain size and mineral composition, on elemental availability. Therefore, this study advocates an alternative method for monitoring and assessment of trace element pollution in surface soil using terricolous fruticose lichens. Lichens growing at abandoned mine sites and unpolluted areas in southwest Japan and their substrata were analyzed using inductively coupled plasma-mass spectrometry and X-ray fluorescence spectrometry to clarify the relationships between Cu, Zn, As, and Pb concentrations in lichens and soils, including their absorption properties. Concentrations of these elements in the lichens were positively correlated with those in the soils regardless of lichen species, location, habitat, or conditions of soils. The analyzed lichens had neither competitive nor antagonistic properties in their elemental absorption, which made them good biomonitors of trace element pollution in surface soil. The distribution maps of average Cu, Zn, As, and Pb concentrations at each sampling region detected almost all of the Cu, Zn, and As pollution of the soils. Therefore, lichens could be used in practical applications to monitor Cu, Zn, and As pollution in surface soils.

1. Introduction

Soil pollution has been estimated using soil analyses and leaching tests. No single laboratory leaching test can evaluate the leaching behavior of a wide variety of material in a broad range of management scenarios [1]. The methods of leaching tests should be chosen after consideration of soil properties, such as chemical and physical properties of soil-forming minerals and climatic conditions of the sampling area. Results differing from the actual condition may be obtained by the leaching test if an inappropriate method is chosen. Accordingly, the leaching test methods may lead to misuse and misinterpretation of the results [1].
Many organisms have been investigated as potential biomonitors as a means to assess the level of soil pollution [2]. The use of local-resident biomonitors growing in a polluted area could reduce the limitations shown in leaching tests. Commonly used indicator organisms include fishes, mollusks, and vascular plants [2,3,4,5,6,7,8,9,10,11,12,13]. However, trace element absorption by plants is affected by antagonisms and interactions among elements [14]. For instance, Cd, Co, Cr, Pb, Ni, Mn, and Zn accumulation causes Fe deficiency in plants [15]. The concentrations of these elements are, therefore, affected by Fe concentrations in the soil and/or soil solution. Accordingly, these antagonisms and interactions are a problem in using organisms for biomonitoring and environmental assessment.
In contrast, lichens absorb mineral nutrients and trace elements, including metals, from dry and wet atmospheric deposition and surface water due to a lack of a vascular root system and protective cuticles [13,16,17]. Wet depositions, including precipitation and occult precipitation, such as fog and dew, and dry depositions, including sedimentation, impaction, and gaseous absorption, are important sources of nutrients for lichens [18]. Lichens exchange gases and trap aerosols across their entire surface because of the high surface areas and their lack of stomata [19]. Lichens also uptake elements from trapped soil dust [20] and surface water containing minerals dissolved from their substrata [21]. Accordingly, concentrations of trace elements in lichen thalli may reflect those of surface soil which are unstable and affect environmental pollution.
Moreover, some characteristics of lichens that could be used as biomonitors for pollution of their substrata have been revealed in recent studies. Several lichens absorb heavy metals from the corresponding substrata [22,23,24]. Osyczka and Rola [25] determined that the Zn and Cd contents in Cladonia subulata (L.) F. H. Wigg. thalli were related to those in the host substrata via a power function, calculated through a specific regression model. These characteristics of lichens are an important advantage for practical applications as an alternative to the leaching test.
Terricolous lichens cover more than 6% of the land surface of the earth [23], and are found in areas such as tropical forests, desert, alpine regions, polar regions, urban areas, as well as highly polluted areas [26,27]. Lichens found in naturally heavy metal–enriched sites, such as serpentinite and other ultramafic rocks [28,29,30] and metal mines [31,32], may be good model systems for biomonitoring. Accordingly, lichens may have the potential to be broadly used as biomonitors in various terrestrial habitats worldwide.
To evaluate a practical application of Stereocaulon commixtum and several Cladonia spp. as biomonitors, this study investigated the correlation between concentrations of Cu, Zn, As, and Pb in the lichen thalli and those in the corresponding substrata. In addition, distribution maps of the concentrations at each sampling site, including contaminated abandoned mine sites and unpolluted areas in southwest Japan, were created using the average concentrations of Cu, Zn, As, and Pb in the surface soils and lichen thalli. Finally, the practical application of lichens as biomonitors for the assessment and monitoring of Cu, Zn, As, and Pb pollution in surface soil was evaluated.

2. Materials and Methods
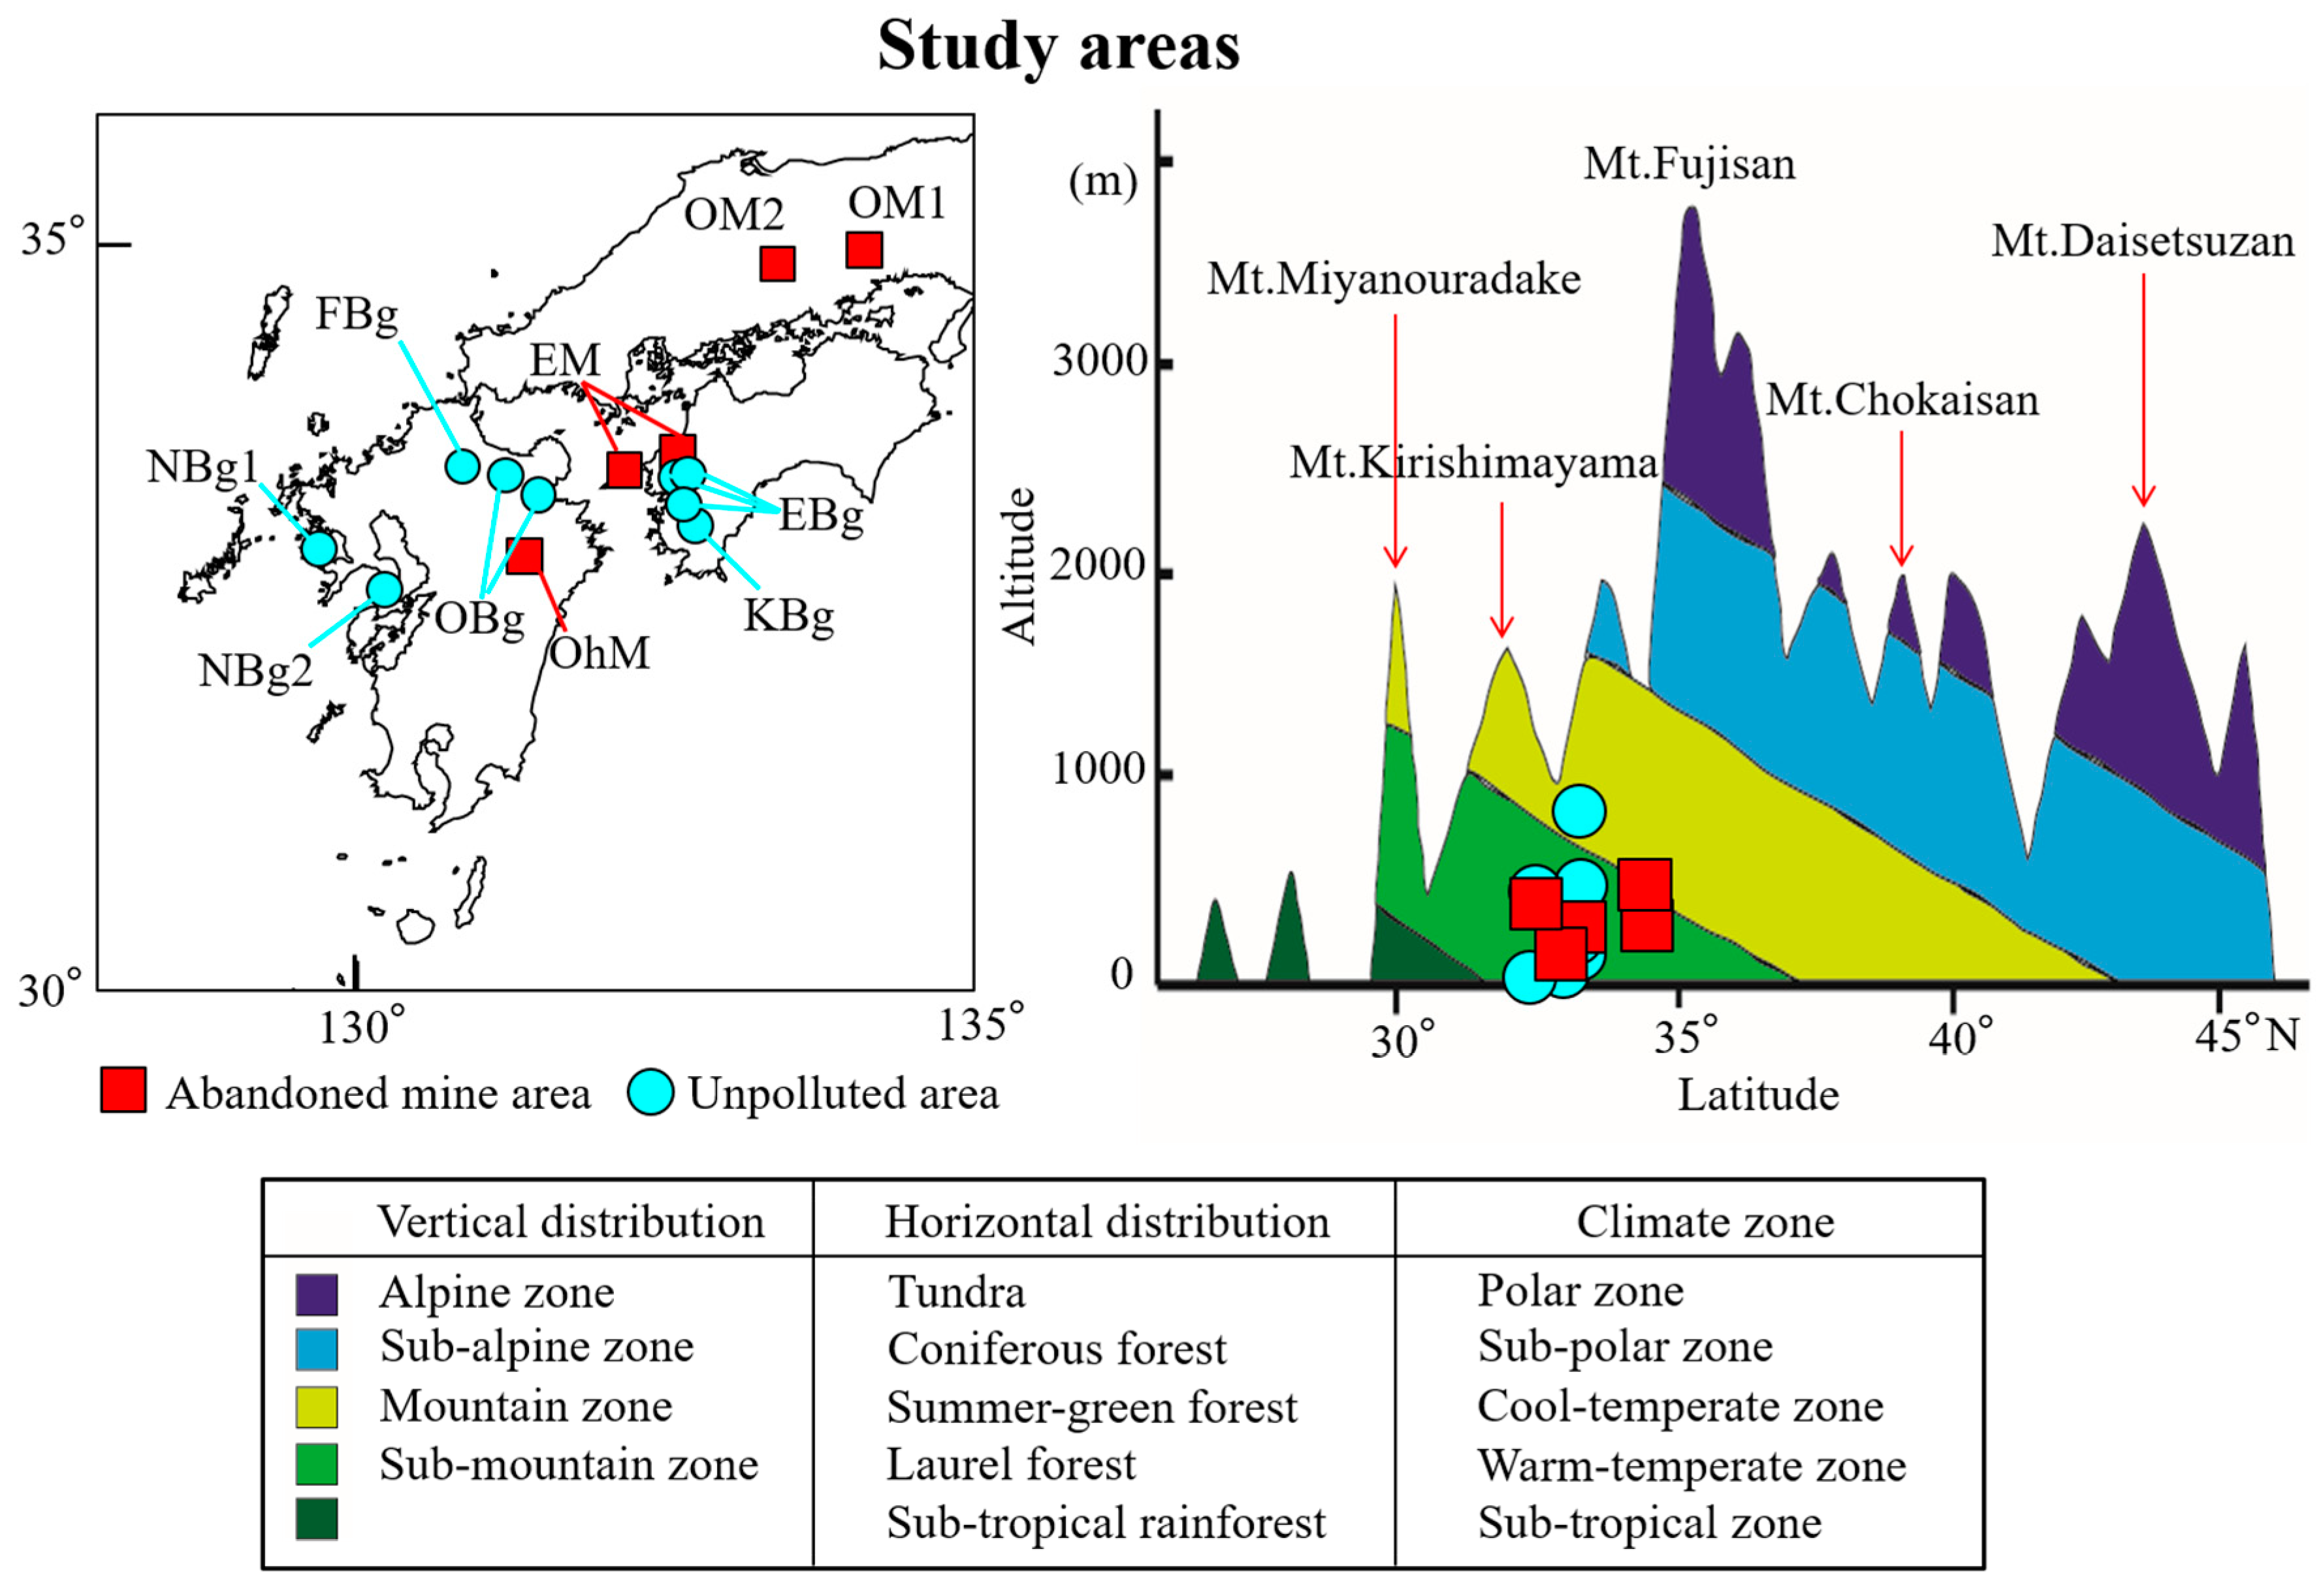
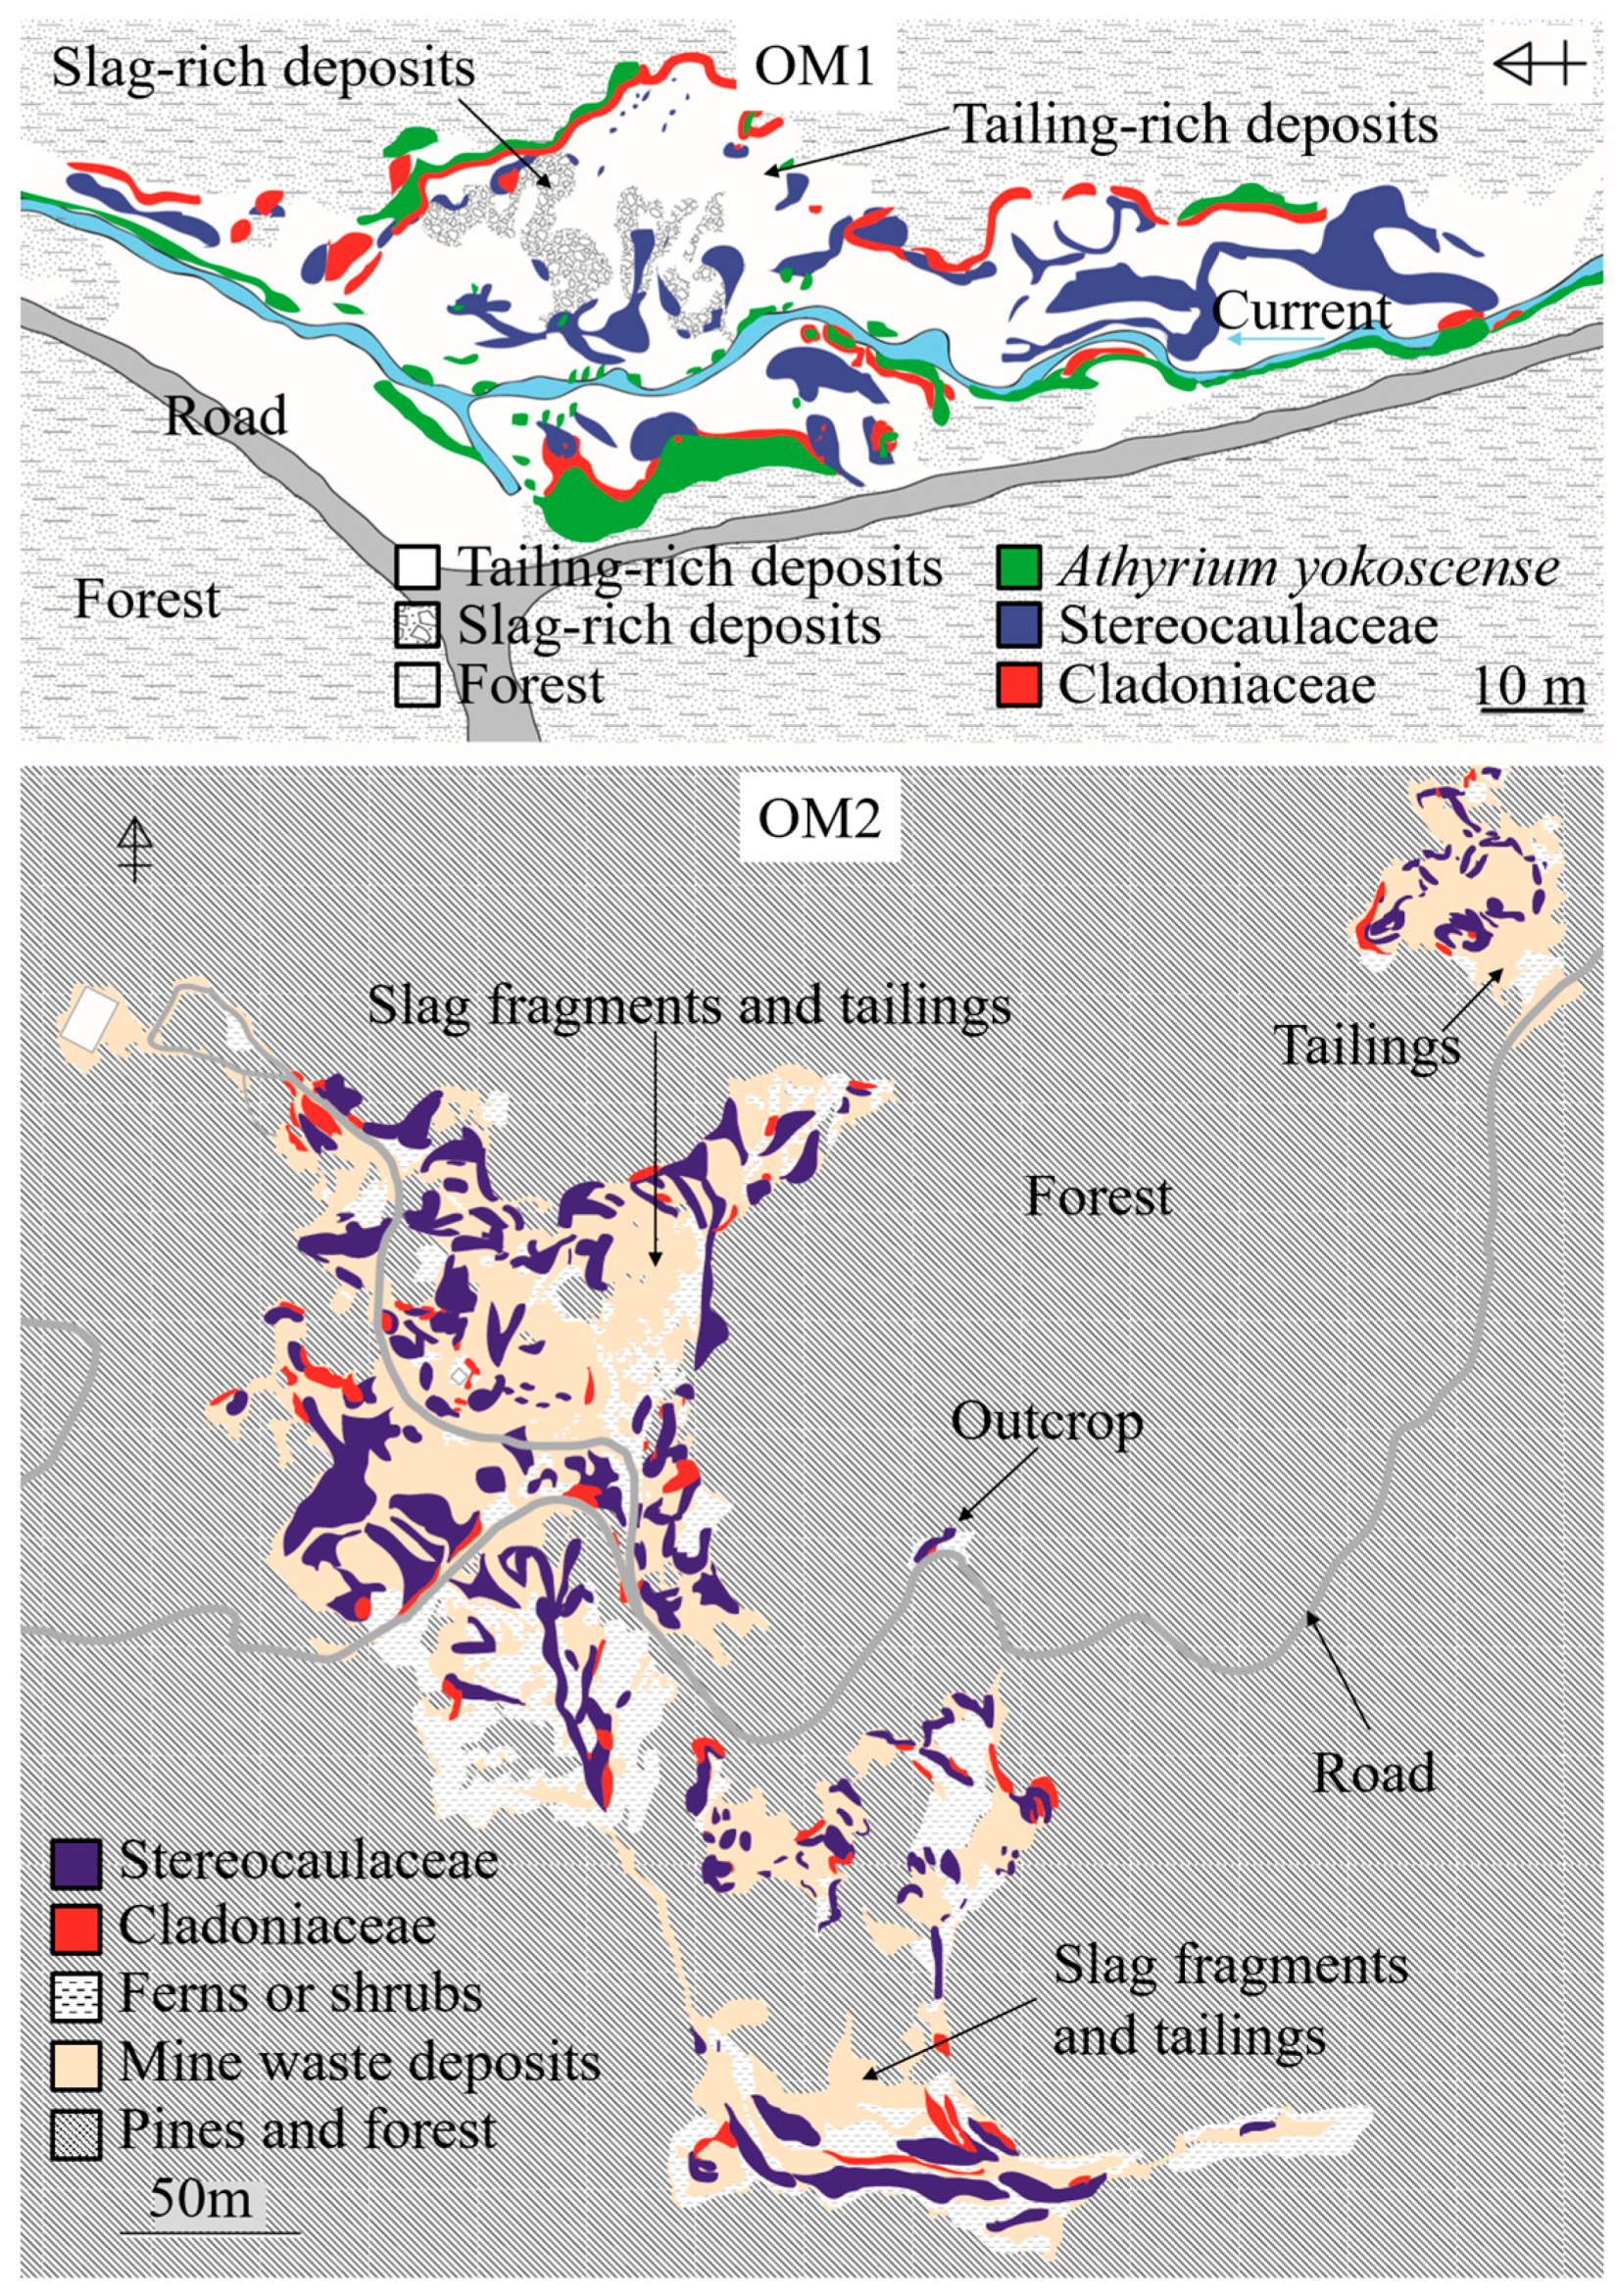
2.1. Study Area

This study was conducted at abandoned mine sites and unpolluted areas at altitudes between 10 and 800 m above sea level in warm-temperate and cool-temperate zones in southwest Japan (Figure 1). Metals, such as Cu, Zn, Sn, and Pb, had been smelted at the abandoned mine sites, which closed at least 40 years before the experiment. Surfaces of waste dumps at the abandoned mine sites consisted mainly of slag fragments and tailings. Solidified and coherent slag was partially exposed on the dumps. The unpolluted areas had almost no ore deposits, and no heavy metal pollution had been reported in these areas.

2.2. Sampling and Pulverizing Methods

A total of 61 lichen specimens set with the corresponding substrata were randomly sampled from the slag and tailing dumps, outcrops, sandbanks, slope sediment, and weathered asphalt along a roadside at each of the abandoned mine sites and unpolluted areas from 3 November 2012 to 18 May 2015. The lichen specimens were stored in dark place at Ehime University. Lichen thalli were excised at the upper 1–5 mm portion from their substrata using ceramic scissors to avoid fragments of the substratum trapped by the hyphae and were washed with ultrapure water (Milli-Q; Merck Millipore Corporation, Darmstadt, Germany). The washed samples were oven dried at 80 °C for 24 h. The dried samples were pulverized using an agate mortar. The soil samples were stored in a desiccator after being oven dried at 120 °C for at least 48 h. Samples were pulverized to a grain size of <1 μm in a tungsten carbide vibrating sample mill (SAMPLE MILL model TI-100, HEIKO, Tokyo, Japan) and an agate mortar. Powdered samples of lichens and soils were stored in dark place at Ehime University.

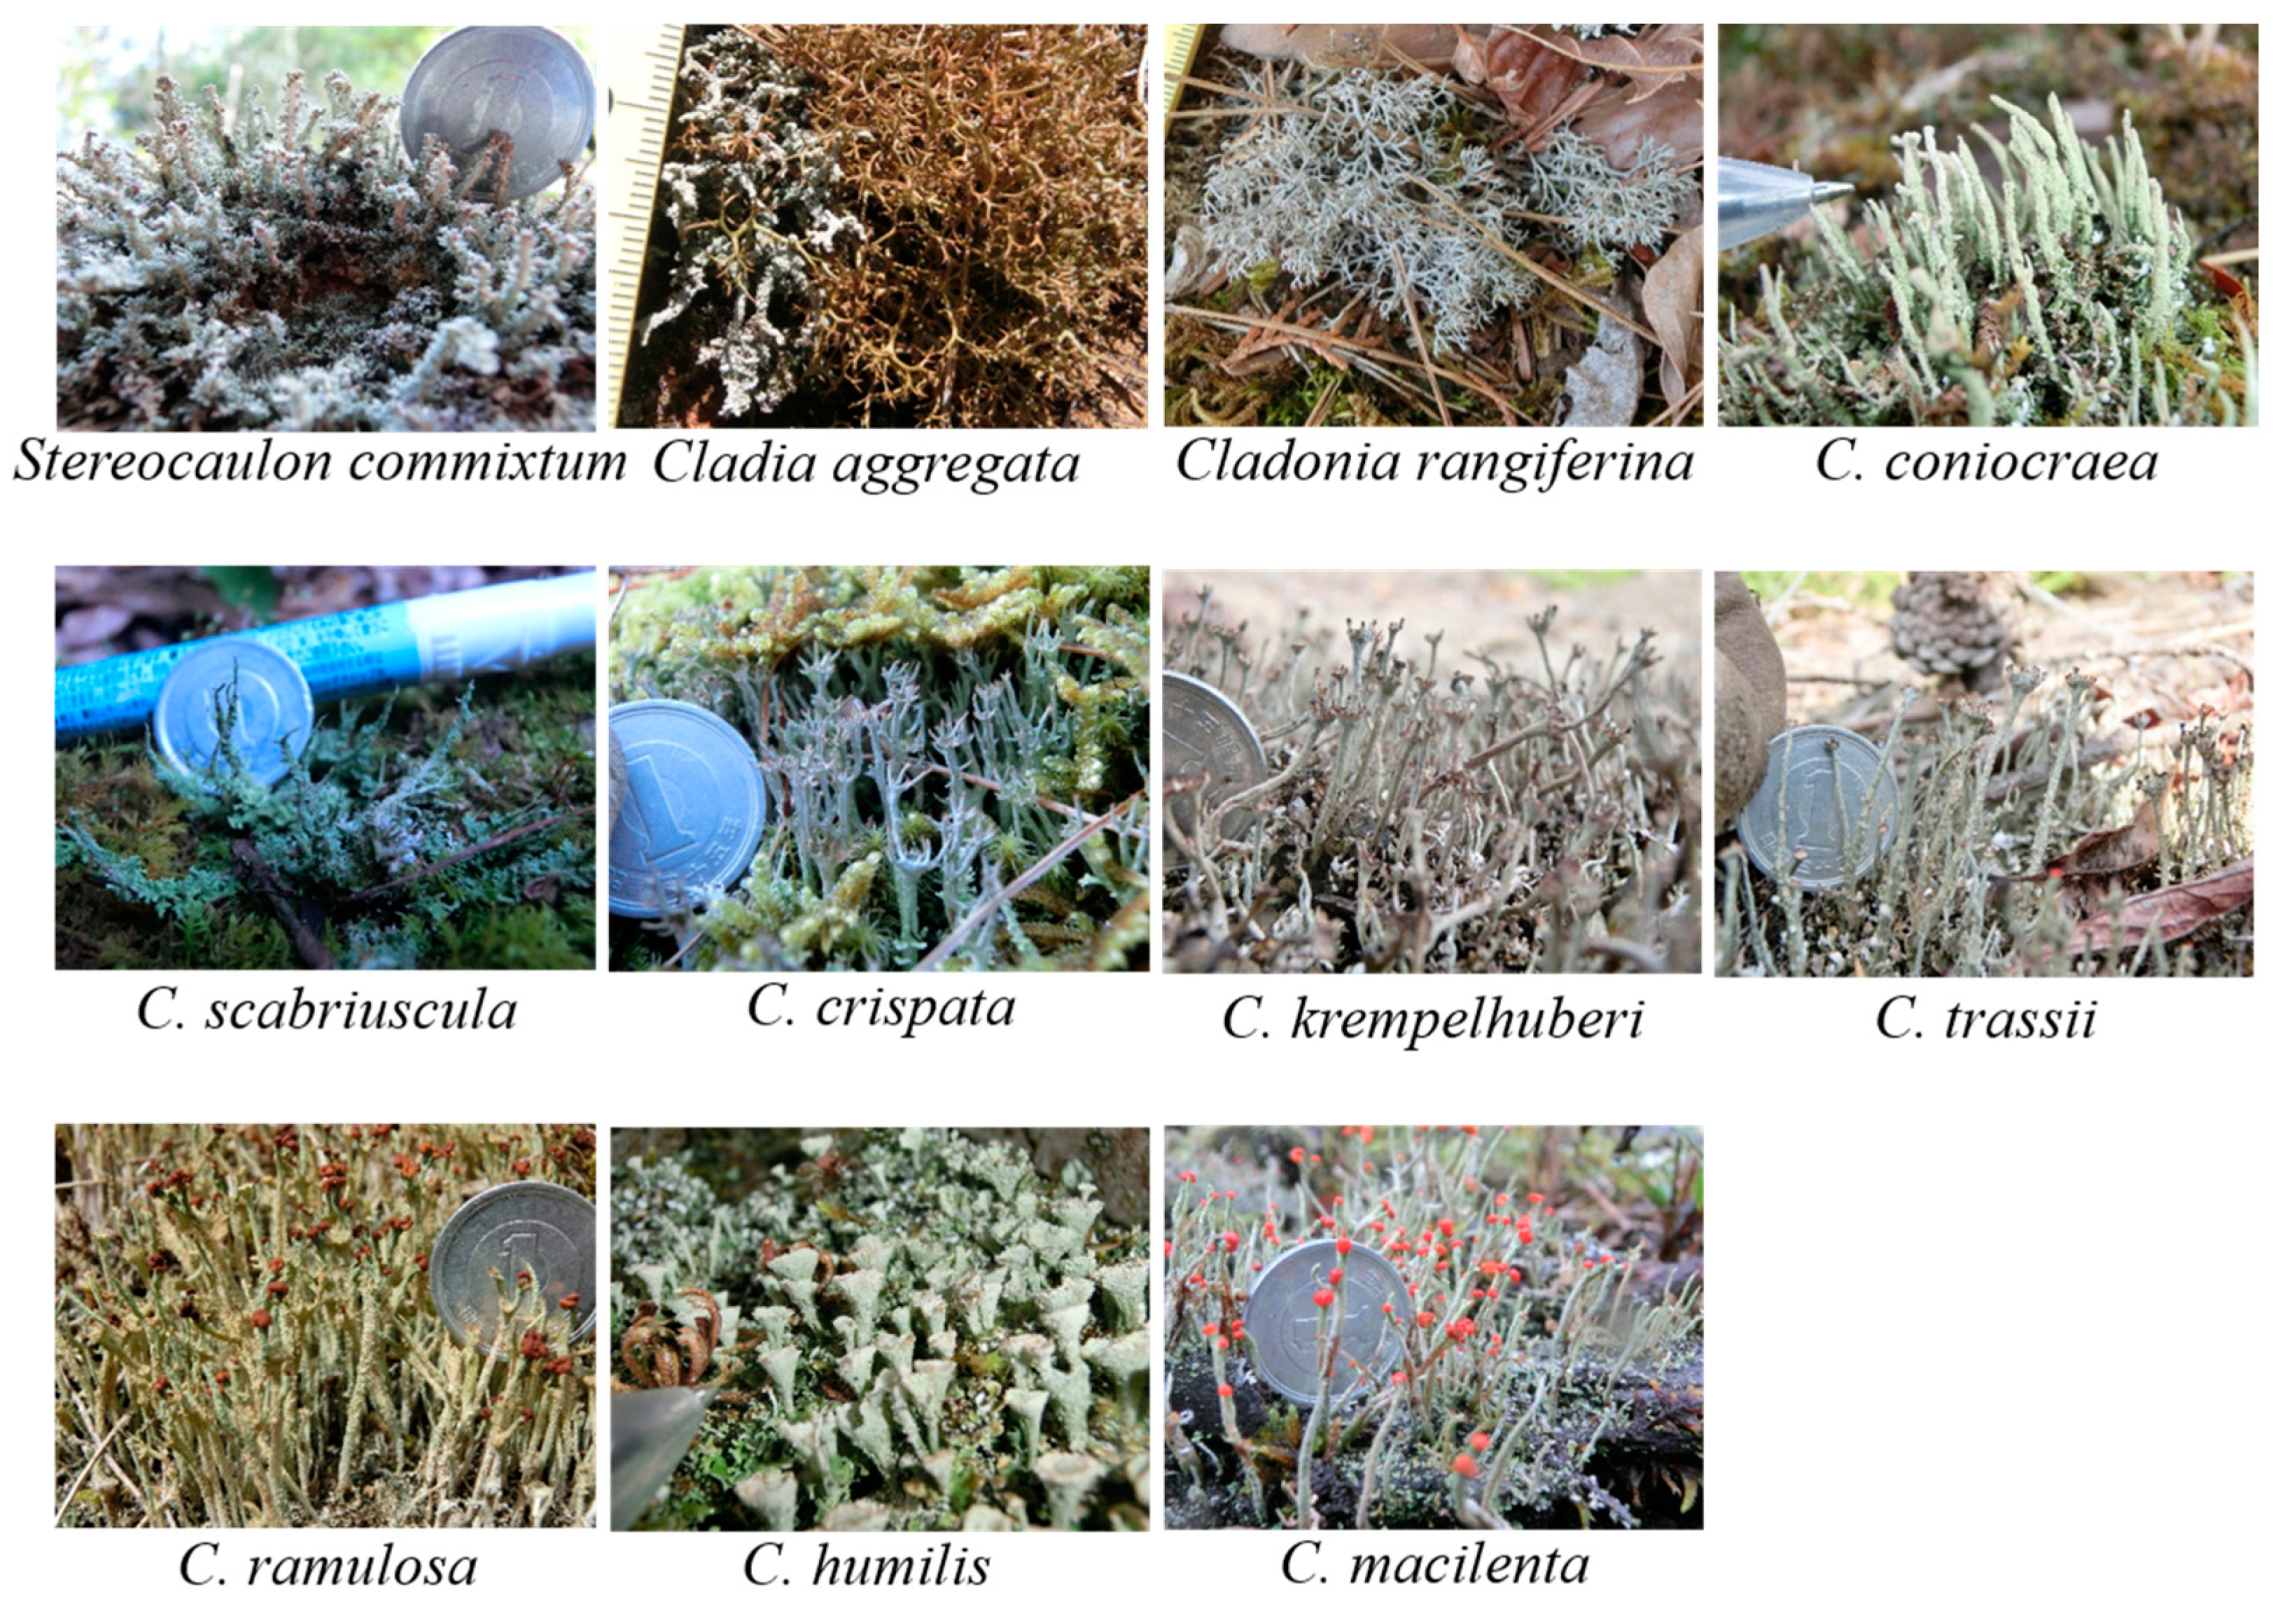
2.3. Identification of Lichens

The lichen specimens were tested for identification by morphological observation and chemical analyses using a stereomicroscope, solutions for color reactions, thin layer chromatography (TLC), and liquid chromatography-mass spectrometry (LC/MS). Color reactions were carried out using the following three solutions: 10% aqueous potassium hydroxide (KOH), saturated aqueous calcium hypochlorite (Ca(OCl)2), and 5% alcoholic p-phenylenediamine solution. Lichen substances in acetone extracts of specimens were identified using TLC and LC/MS according to Huneck and Yoshimura (1996) [33].

2.4. Determining Concentrations of Trace Elements in Lichen Materials and Soils

The concentrations of trace elements in lichen materials were determined by inductively coupled plasma–mass spectrometry (ICP-MS) using a Varian 820-MS instrument (Agilent Technologies, Santa Clara, CA, USA). The concentrations of trace elements in the substrata were determined by wave dispersive X-ray fluorescence (WD-XRF) spectrometry using a Primus II instrument (Rigaku, Tokyo, Japan).

2.4.1. Inductively Coupled Plasma–Mass Spectrometry (ICP-MS)

The 20 mg pulverized powder was digested with several acids by the following steps: (1) digested with 200 μL of hydrogen peroxide (H2O2), 1 mL of 61% nitric acid (HNO3), and 500 μL of hydrofluoric acid (HF), and heated on a hotplate at 160 °C for 30 min; (2) cooled down at room temperature for 30 min; (3) evaporated to dryness on the hotplate at 80 °C; (4) digested with 1 mL of 61% HNO3 and heated on the hotplate at 160 °C for 30 min; (5) cooled down at room temperature for 30 min; (6) evaporated to dryness on the hotplate at 80 °C; (7) digested with 1 mL of 30% HNO3 and heated on the hotplate at 120 °C for 10 min; and (8) cooled down to room temperature for 1 h. The digested solution was diluted by 3% HNO3 as the solution for analysis.
The analytical accuracy and precision were verified using the NIES CRM #1 environmental sample. The analytical calibration curve was created using multi-element calibration standard 3 (PerkinElmer, Inc., Massachusetts, MA, USA). Rhodium standard solution (Wako Pure Chemical Industries, Ltd., Osaka, Japan) was used as the internal standard.

2.4.2. X-ray Fluorescence (XRF)

Pressed powder pellets were used for the XRF analysis. The pulverized samples were homogenized by shaking for six hours. Approximately 3.3 g of powdered soil samples were oven dried at 120 °C for 2 h. Polyethylene series (C13H14O6) was used as a binder (20 wt. % in the pressed powder pellet) and was homogenized with 3 g powdered soil samples by shaking for one hour.
The analysis was conducted at an X-ray tube voltage of 50 kV. Two detectors, the scintillation counter and the proportional counter, were used for the analysis. The X-ray source was a Rh anode. The elemental concentrations were determined using the fundamental parameter method and a matching library. Geological standards, including JSd-1, JSd-2, and JSd-3 (Geological Survey of Japan Reference Materials) [34,35] were analyzed to confirm analytical precision.

2.5. Statistical Analysis

The normality of the concentrations of trace elements in lichens and soils were assessed using the Shapiro-Wilk test and Quantile-Quantile (Q-Q) plots, both exhibiting significantly non-normal distributions. Therefore, correlations between the concentrations of trace elements in lichens and soils were verified by Spearman’s rank correlation rho (rs) or t-values obtained by Spearman’s correlation coefficient.
All statistical analyses were performed with EZR (Saitama Medical Center, Jichi Medical University, Saitama, Japan), which is a graphical user interface for R (The R Foundation for Statistical Computing, Vienna, Austria) that is designed to add statistical functions frequently used in biostatistics [36].

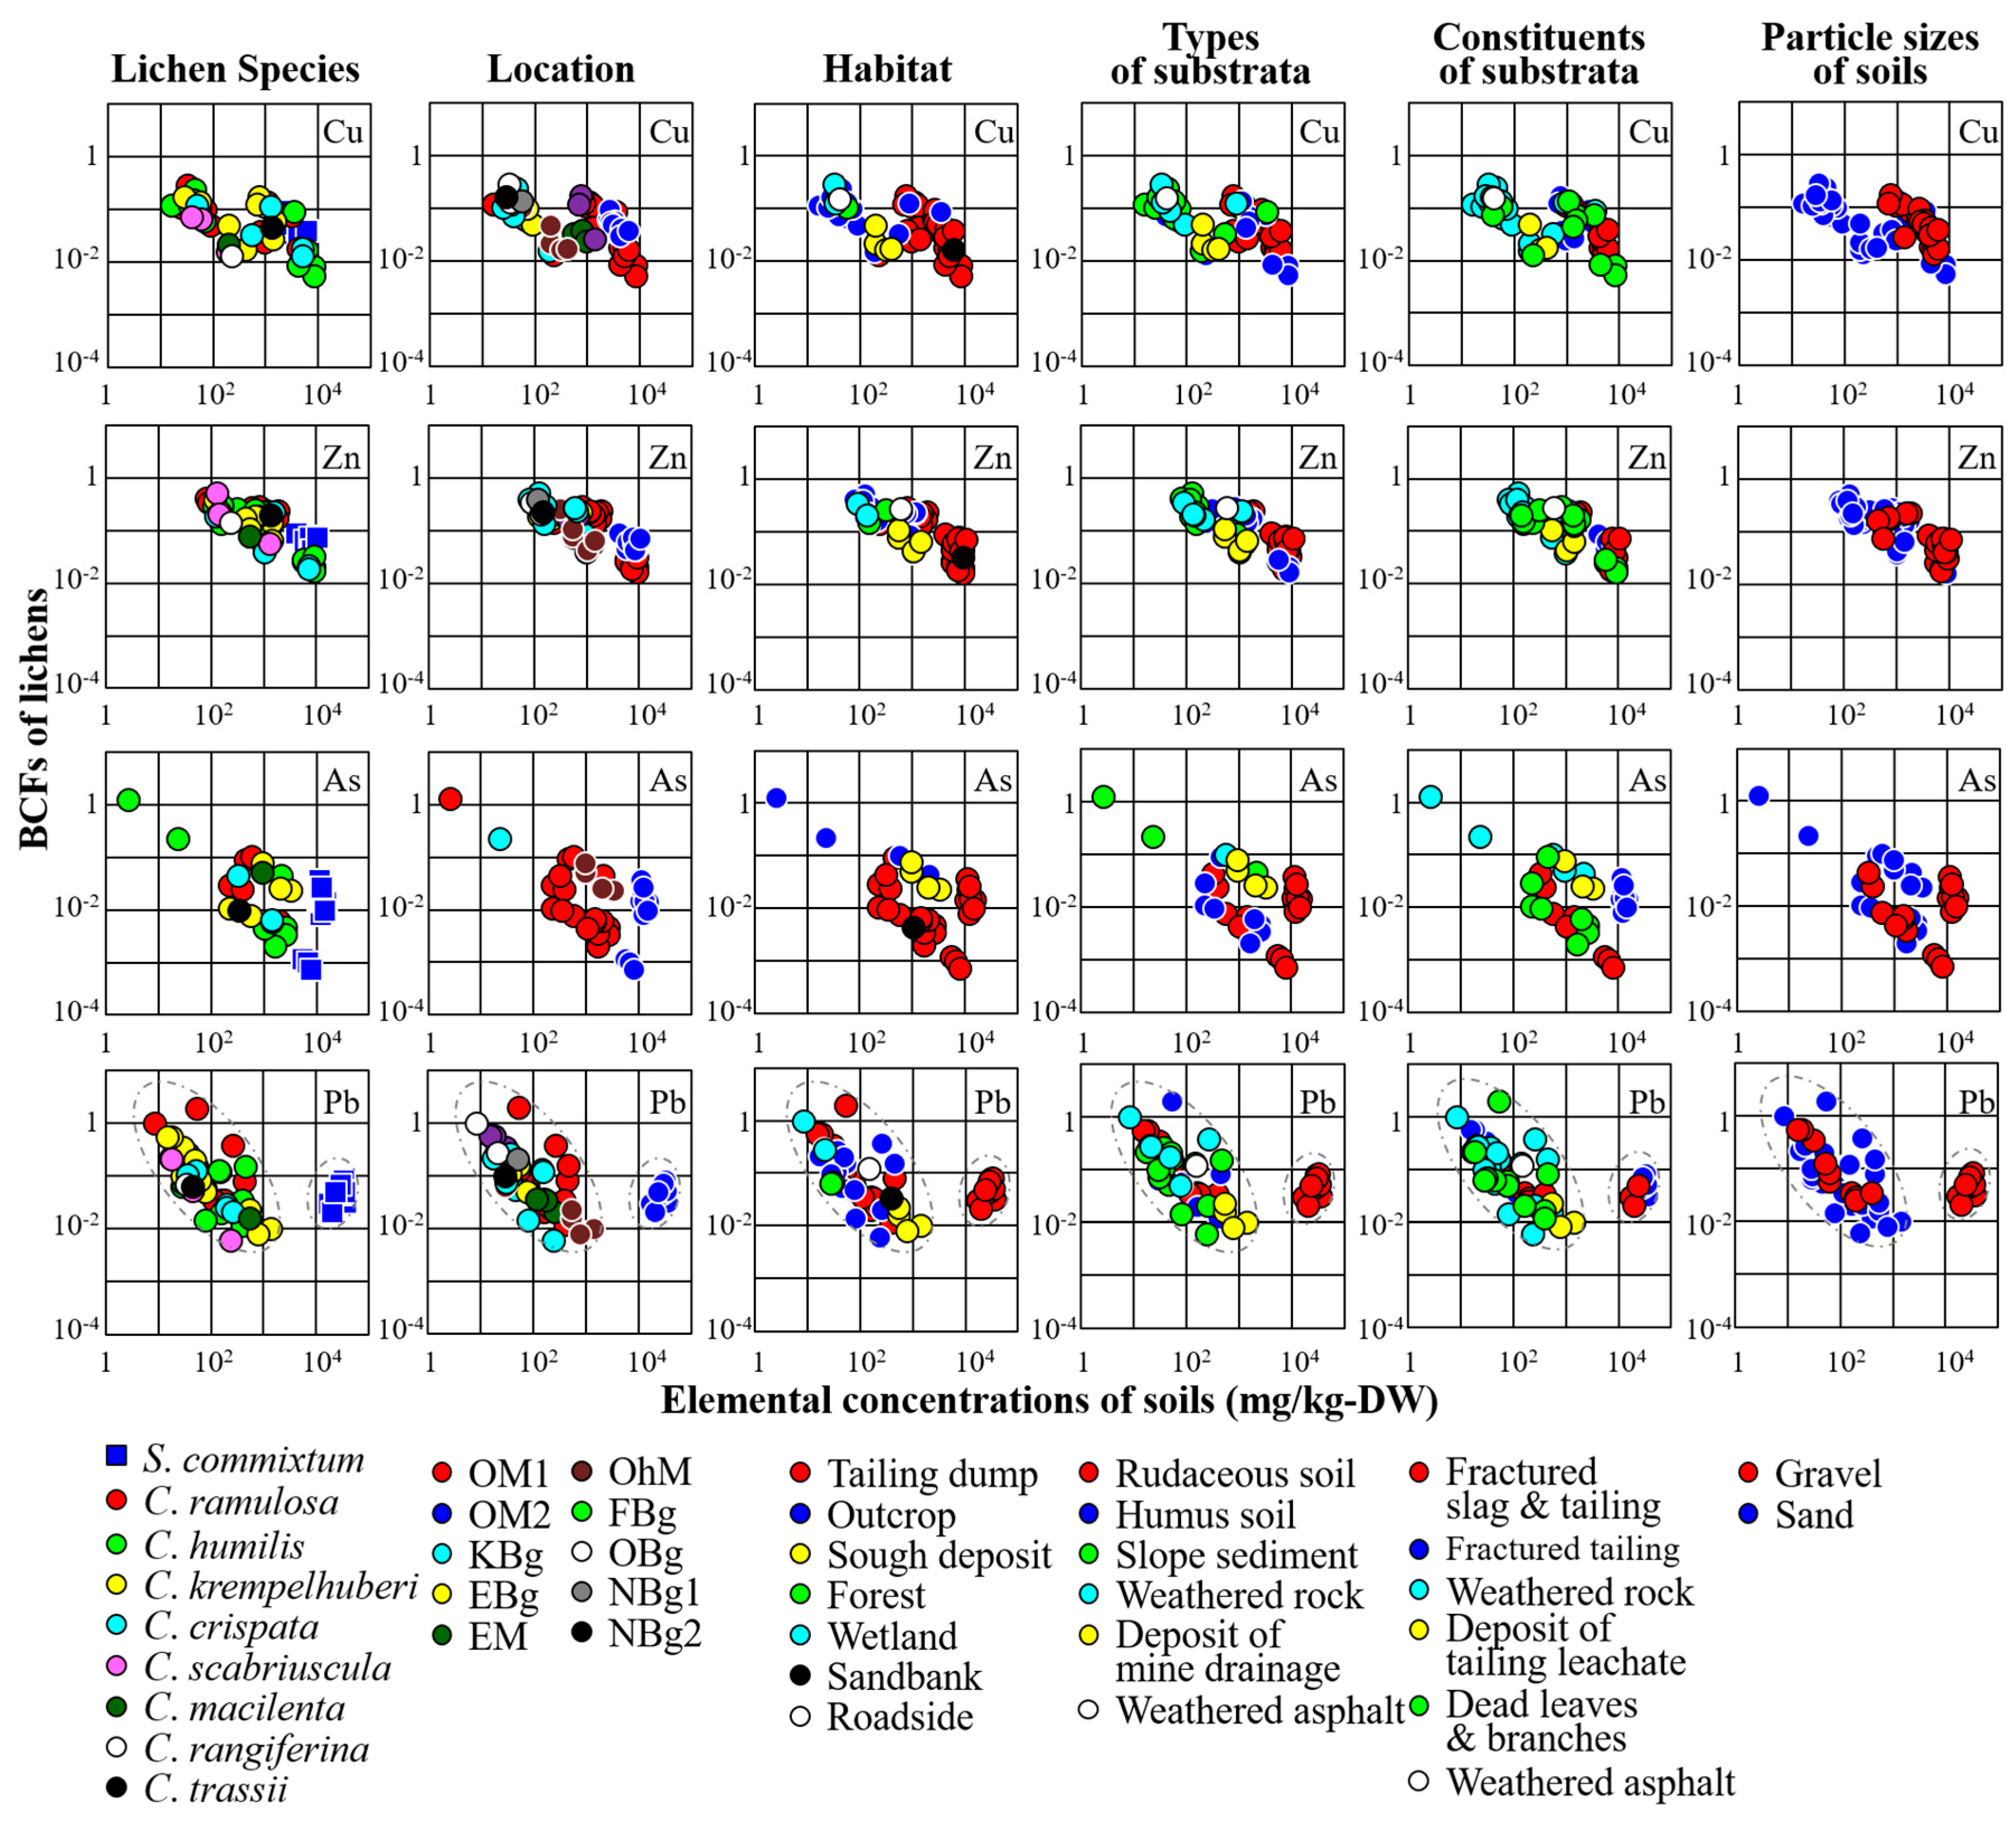
2.6. Bioconcentration Factor

The bioconcentration factor (BCF) has been used to evaluate the bioaccumulation property of plants [28]. The BCF values of lichens were calculated using the following equation [37]:
BCF = C s h o o t / C s o i l
where Cshoot is the elemental concentration in shoot and Csoil is that in soil.

3. Results

3.1. Distribution of Lichens

At least 10 Cladoniaceae lichens and a Stereocaulaceae lichen occurred on soil, rock, and/or mine wastes in the study areas. The tested lichens were identified as follows: Stereocaulon commixtum (Asah.) Asah.; Cladia aggregata (Sw.) Nyl.; Cladonia rangiferina (L.) F. H. Wigg.; C. coniocraea (Flörke) Spreng.; C. scabriuscula (Delise ex Duby) Nyl.; C. crispata (Ach.) Flot. var. crispata; C. krempelhuberi Vain.; C. trassii Ahti; C. ramulosa (With.) J. R. Laundon; C. humilis (With.) J. R. Laundon; and C. macilenta Hoffm (Figure 2).
The S. commixtum, Cladia aggregata, Cladonia rangiferina, C. crispata, C. macilenta, C. humilis, C. ramulosa, C. krempelhuberi, and C. trassii grew in both unpolluted and polluted areas. Distributions of these lichens showed several dense areas on the waste dumps (Figure 3). The S. commixtum occurred mainly on slag fragments, tailings, and rudaceous soil. The C. crispata, C. krempelhuberi, and C. trassii occurred mainly on the rudaceous soil. The remaining Cladonia spp. and Cladia aggregata occurred mainly on humus soil and dead leaves, e.g., from ferns, such as Athyrium yokoscense, which are known as an accumulator and bioindicator for Cu, Zn, Cd, and/or Pb [38,39,40,41]. Cladonia spp. were often associated with other Cladonia lichens.

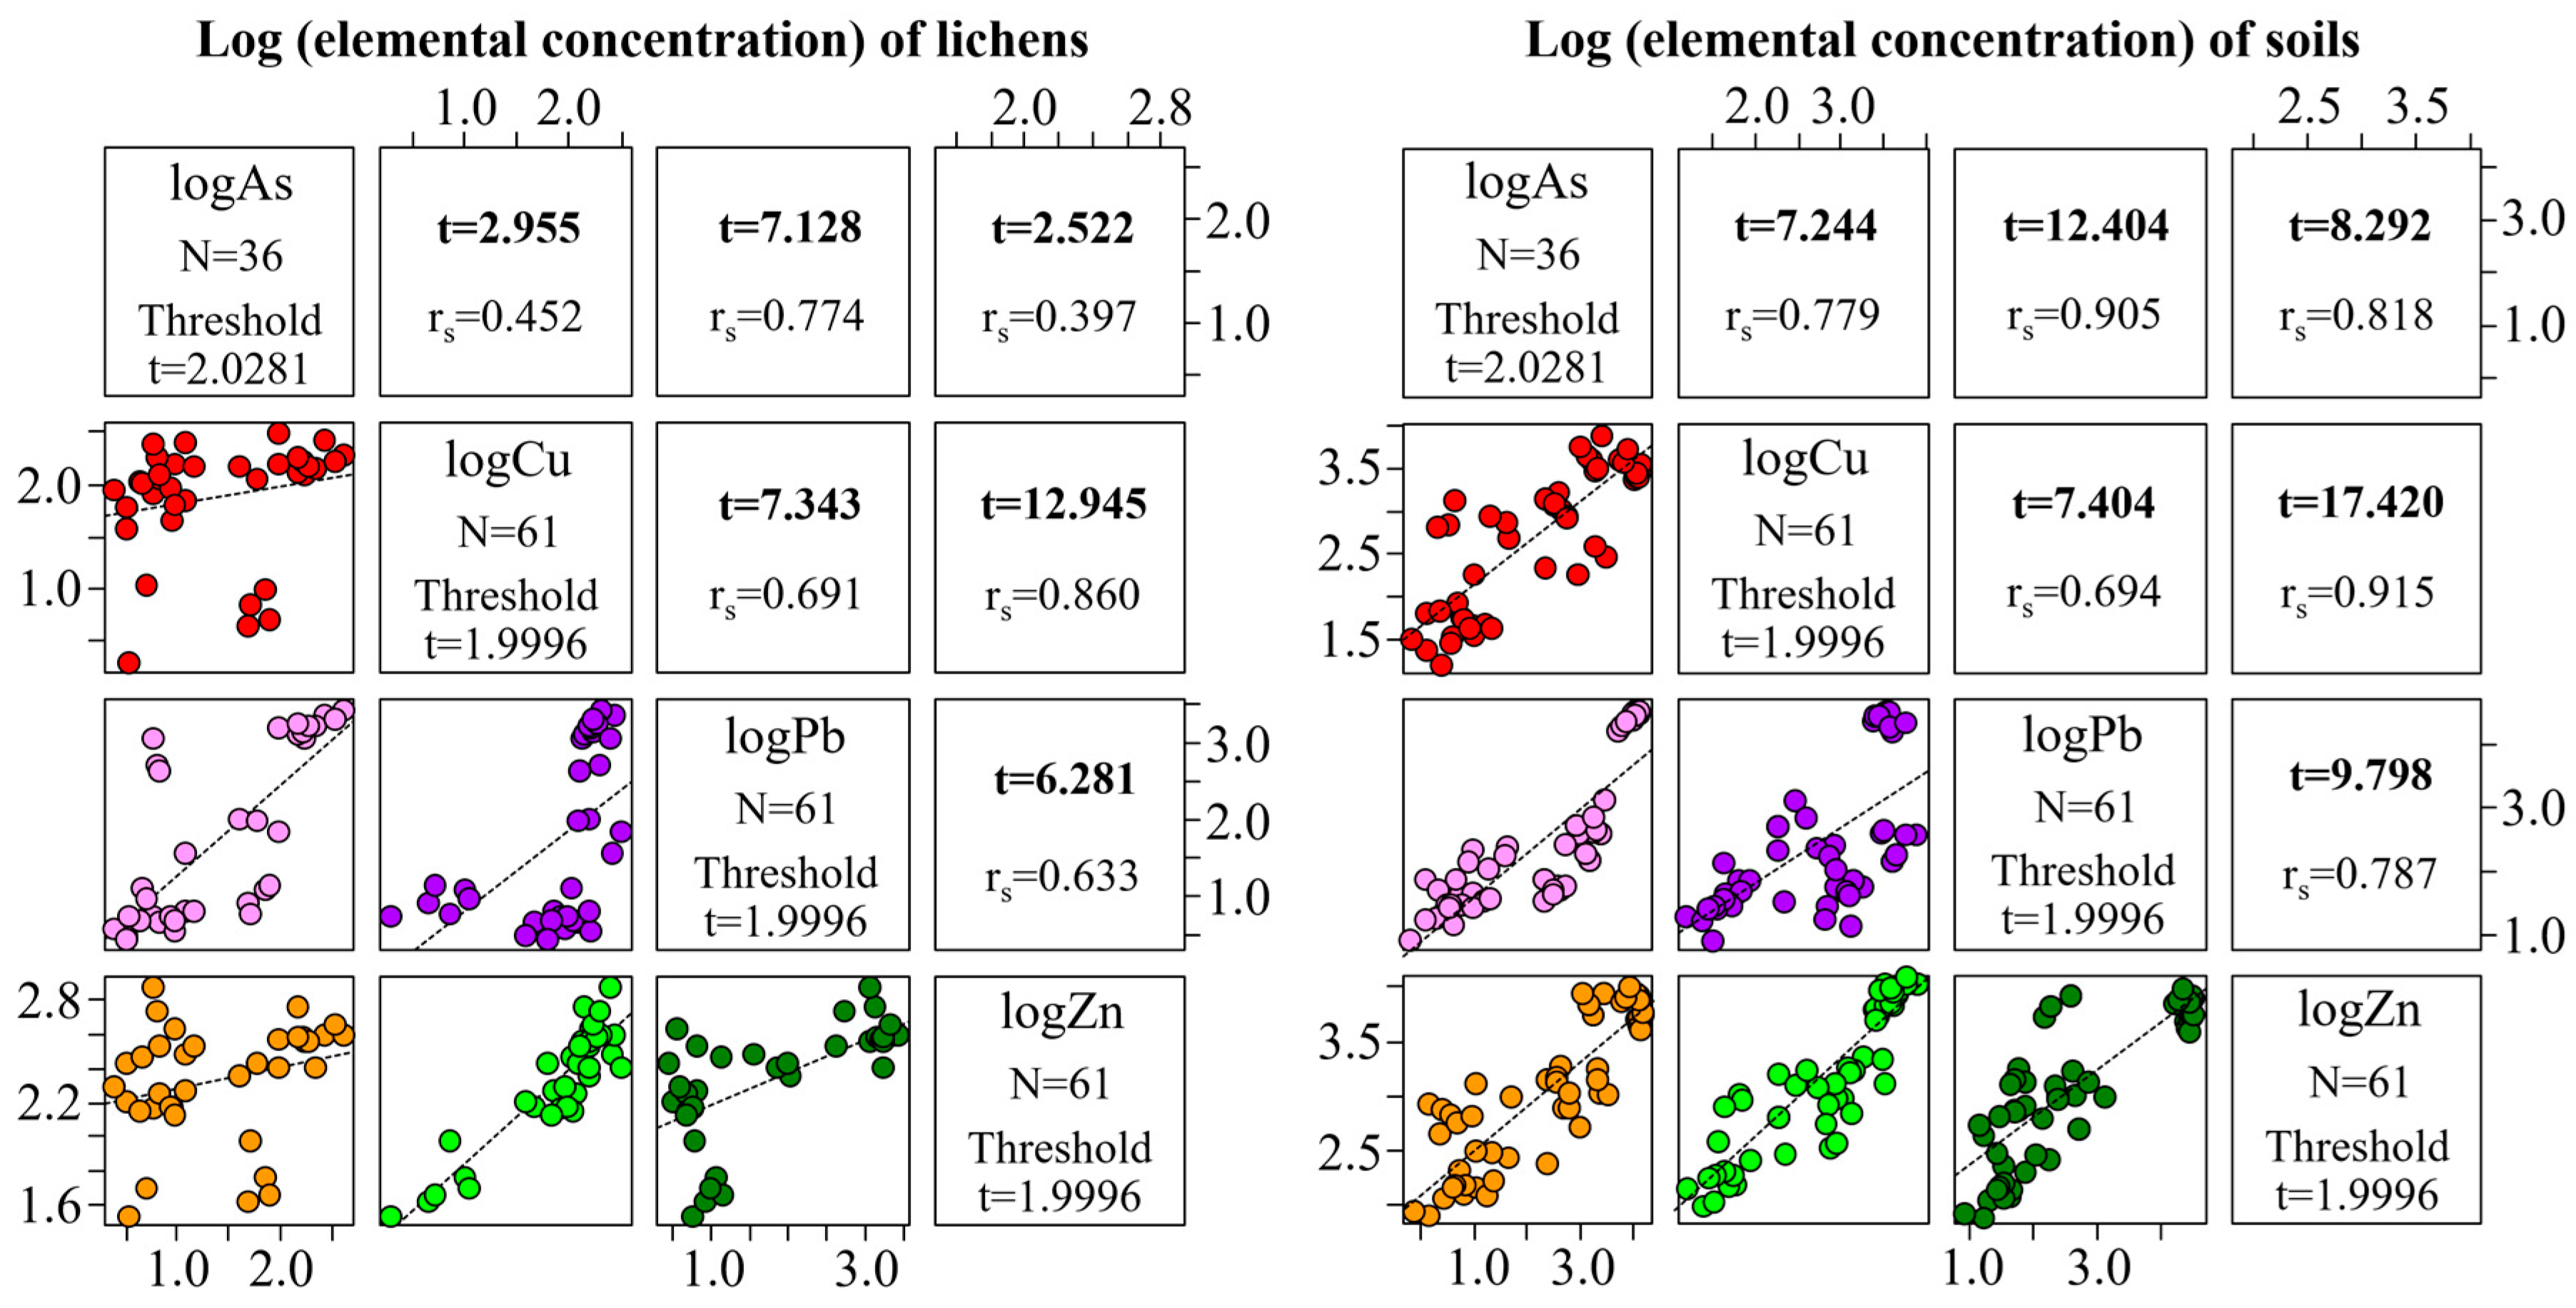
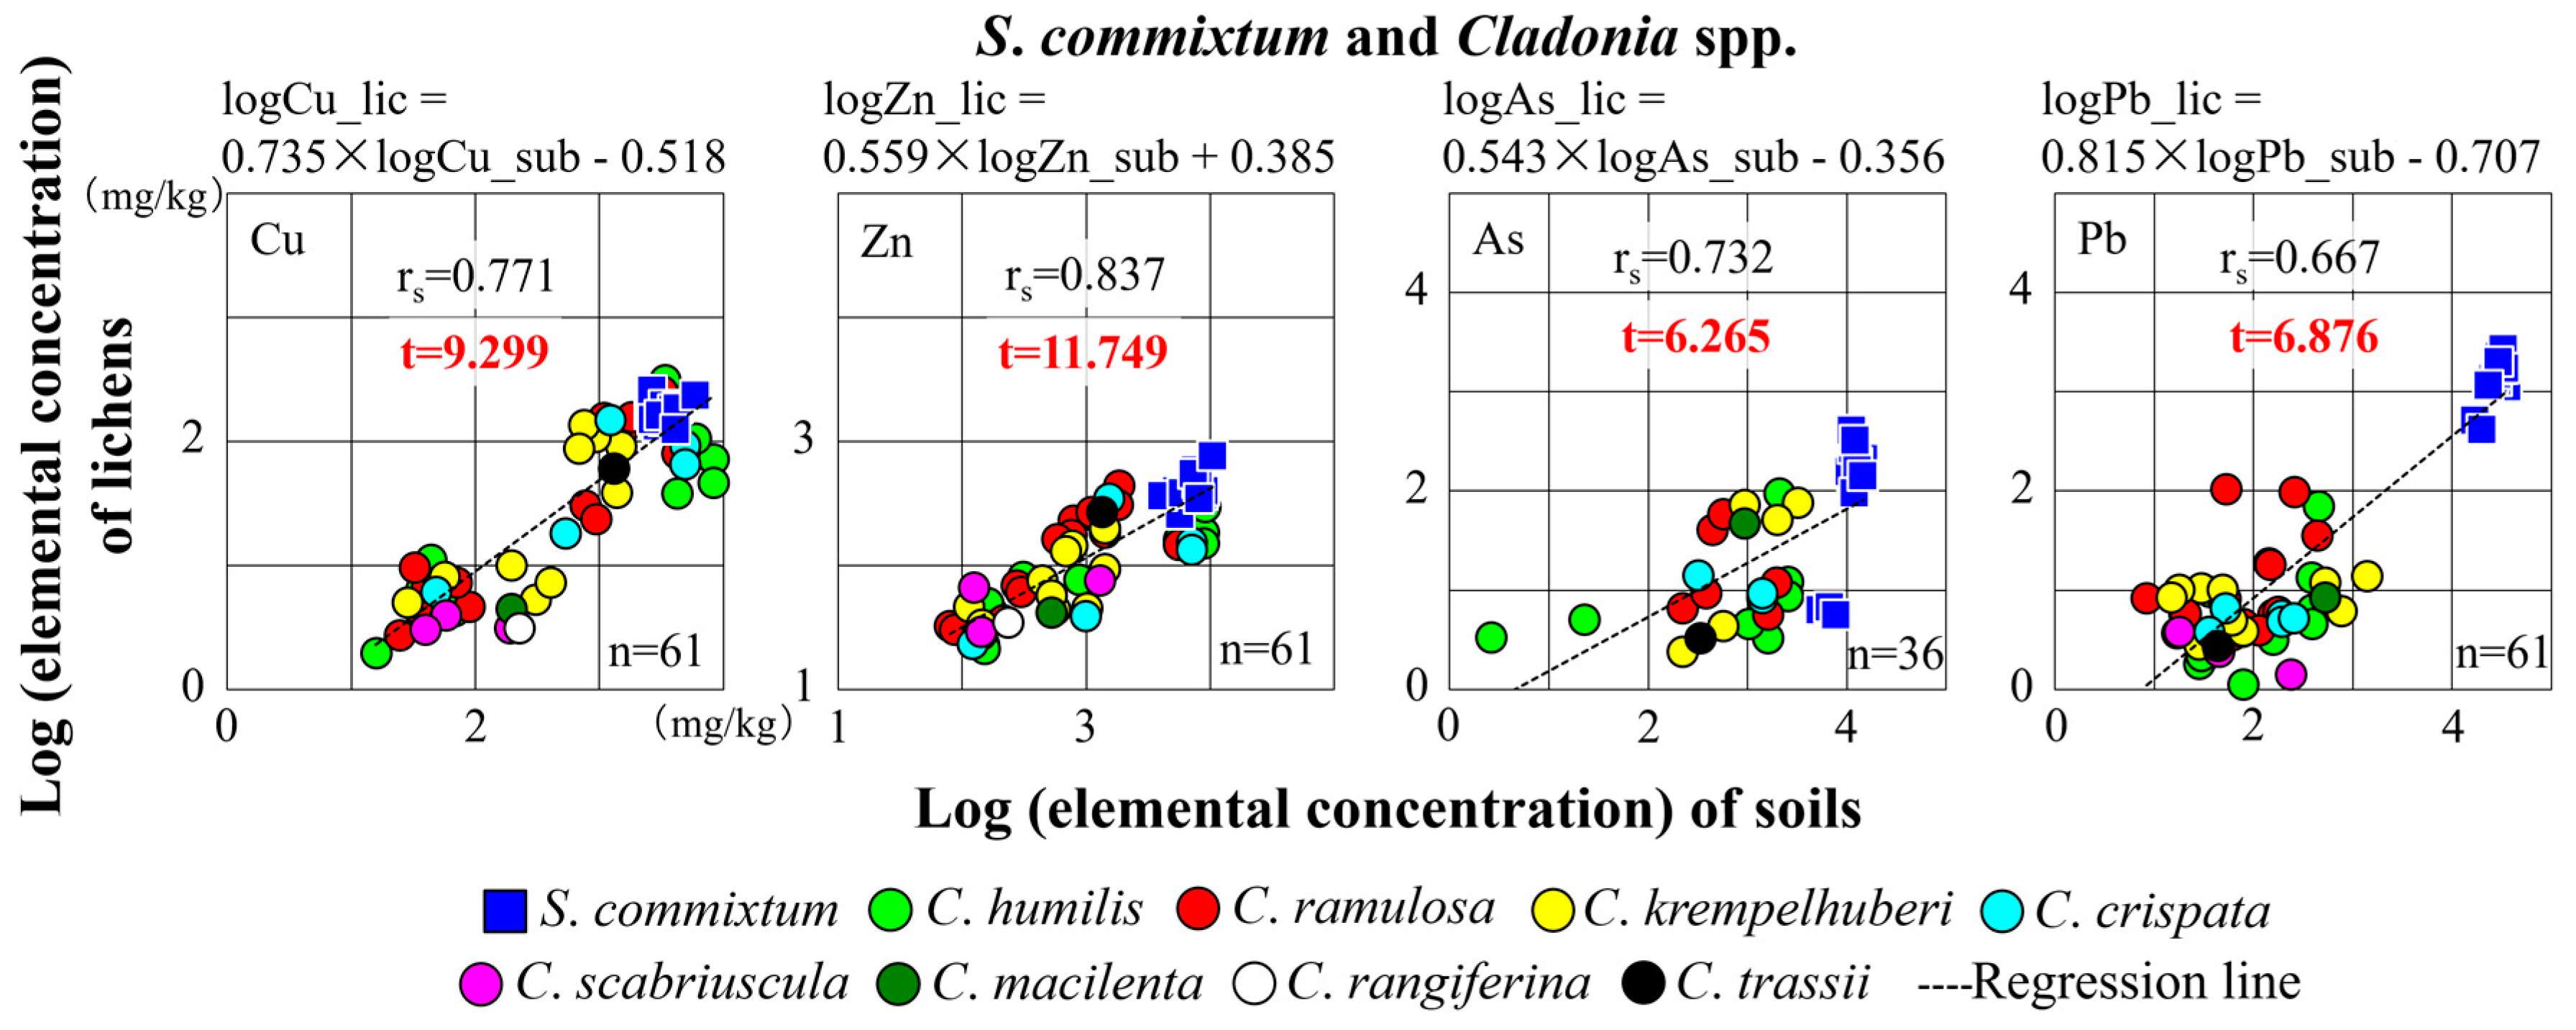
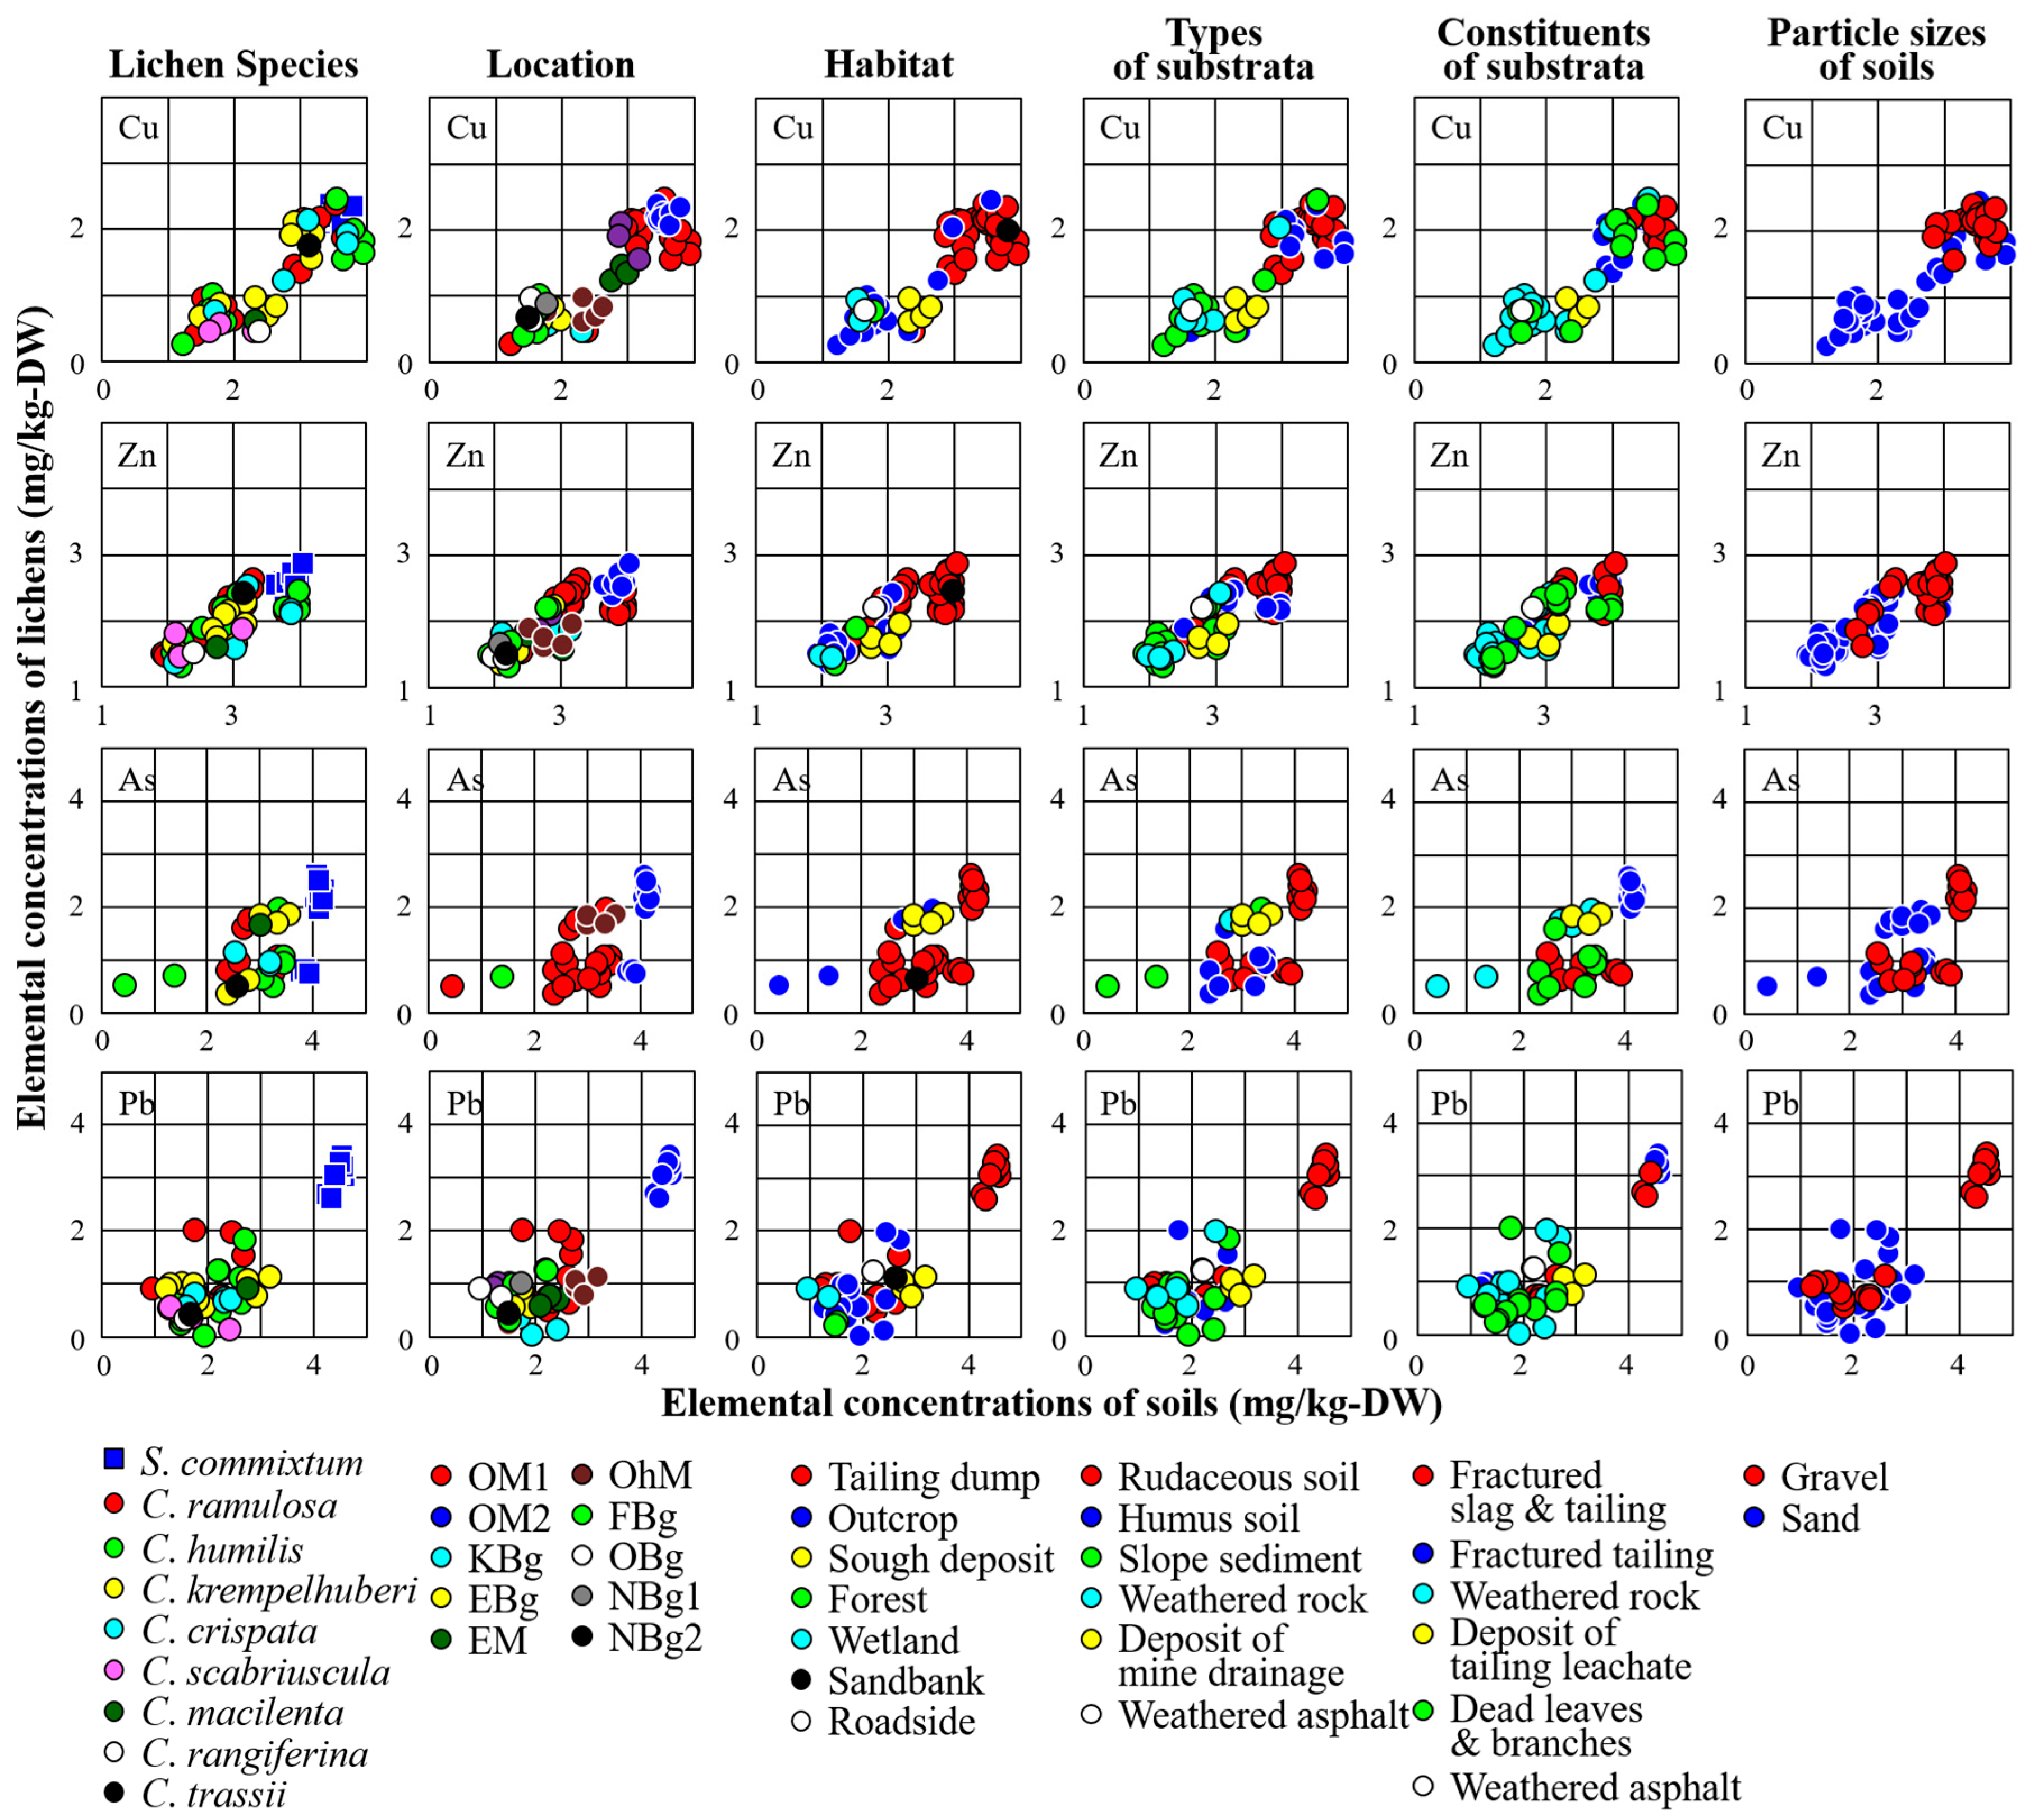
3.2. Relationships between Concentrations of Trace Elements in Lichens and the Corresponding Substrata

Scatterplots were used to determine the relationships between concentrations of trace elements in lichens and the corresponding substrata. The scatterplots showed that concentrations of Cu, Zn, As, and Pb in all lichens, including S. commixtum and eight Cladonia spp., were positively correlated with those in the corresponding substrata regardless of lichen species, location, habitat, types of substrata, constituents of substrata, or particle sizes of soils (Figure 4 and Figure 5). The scatterplots showed no local maximum points, but a linear distribution under a logarithmic scale.
Scatter matrices were used to estimate the competitive and antagonistic properties in the element absorption by lichens. All of the scatterplots in the scatter matrices showed positive correlations between concentrations of Cu, Zn, As, and Pb in lichens and soils after logarithmic transformation (Figure 6). The BCF data also have important implications for potential biomonitors. The BCF values decrease with increasing elemental concentrations in soils regardless of lichen species, location, habitat, types of substrata, constituents of the substrata, or particle sizes of substrata, except Pb (Figure 7).

4. Discussion

4.1. Trace Element Absorption Properties of Lichens

The scatterplots of Pb in Figure 3 and Figure 6 showed two groups related with lichen species and/or locations. Nieboer and Rechardson (1980) [42] demonstrated that the affinity of ions for exchange sites varied in the sequence monovalent Class A < divalent Class A < borderline divalent < divalent Class B ions. The borderline ions include Cu, Zn, As, and divalent Pb ions, while the class B ions include tetravalent Pb. Accordingly, the Pb concentration in lichen thalli may be affected by physiological properties of lichens and/or chemical forms of Pb in surface soil.
Previous studies have demonstrated the heavy metal uptake ability and the accumulation capacity of lichens [25,30,43,44,45]. Competitive effects in the heavy metal absorption of lichens were also clarified in previous studies [46,47]. According to Sueoka et al. [24], Fe and As could be affected by precipitation and adsorption on hyphae of lichen thalli as Fe-hydroxides, but not selective elemental absorption by lichens. In this study, the positive correlations among each Cu, Zn, As, and Pb concentration in lichens were detected. The correlation indicated that these trace elements were not absorbed selectively into the lichen thalli and, therefore, the lichens had neither competitive nor antagonistic properties in their Cu, Zn, As, and Pb absorption. Moreover, the relationships between elemental concentrations in lichens and soils were described by linear regression models in a wide range of concentrations (Figure 4), even for low BCF values. This property of the lichens imply possible practical applications of the lichens as biomonitors for a wide range of trace element pollution in surface soil.
Ions absorbed by lichens were not evenly distributed throughout the thalli [19]. The distributions of cations were divided into the following fractions: (1) the extracellular and surface fraction; (2) the ion exchange site fraction; (3) the intracellular fraction; and (4) the residual fraction [19]. The lichens contained dust and soil particles in their thalli [19,48]. Several Cladonia lichens showed different concentrations of heavy metals in different parts of their thalli [44]. Our previous study clarified the distribution of trace elements in S. exutum thalli as follows: (1) Fe, Cu, Zn, and As were contained between the cortex and medulla; (2) Fe occurred on the surface of hyphae as Fe-hydroxides with As; (3) the trapped soil particulates in the thalli which were in the upper 1–5 mm portion from their substrata were mainly quartz and plagioclase [24]. Accordingly, the most effective factor contributing to the trace element concentrations in S. commixtum thalli may be the precipitation of the elements on the hyphae of the medulla and/or scavenging ions from surface water. Our studies, however, have not revealed the elemental distribution in Cladonia spp. thalli. More detailed investigations on the chemical forms and allocation patterns of trace elements in the lichen thalli, therefore, can reveal the accumulation potential and suitability of the lichens as biomonitors.

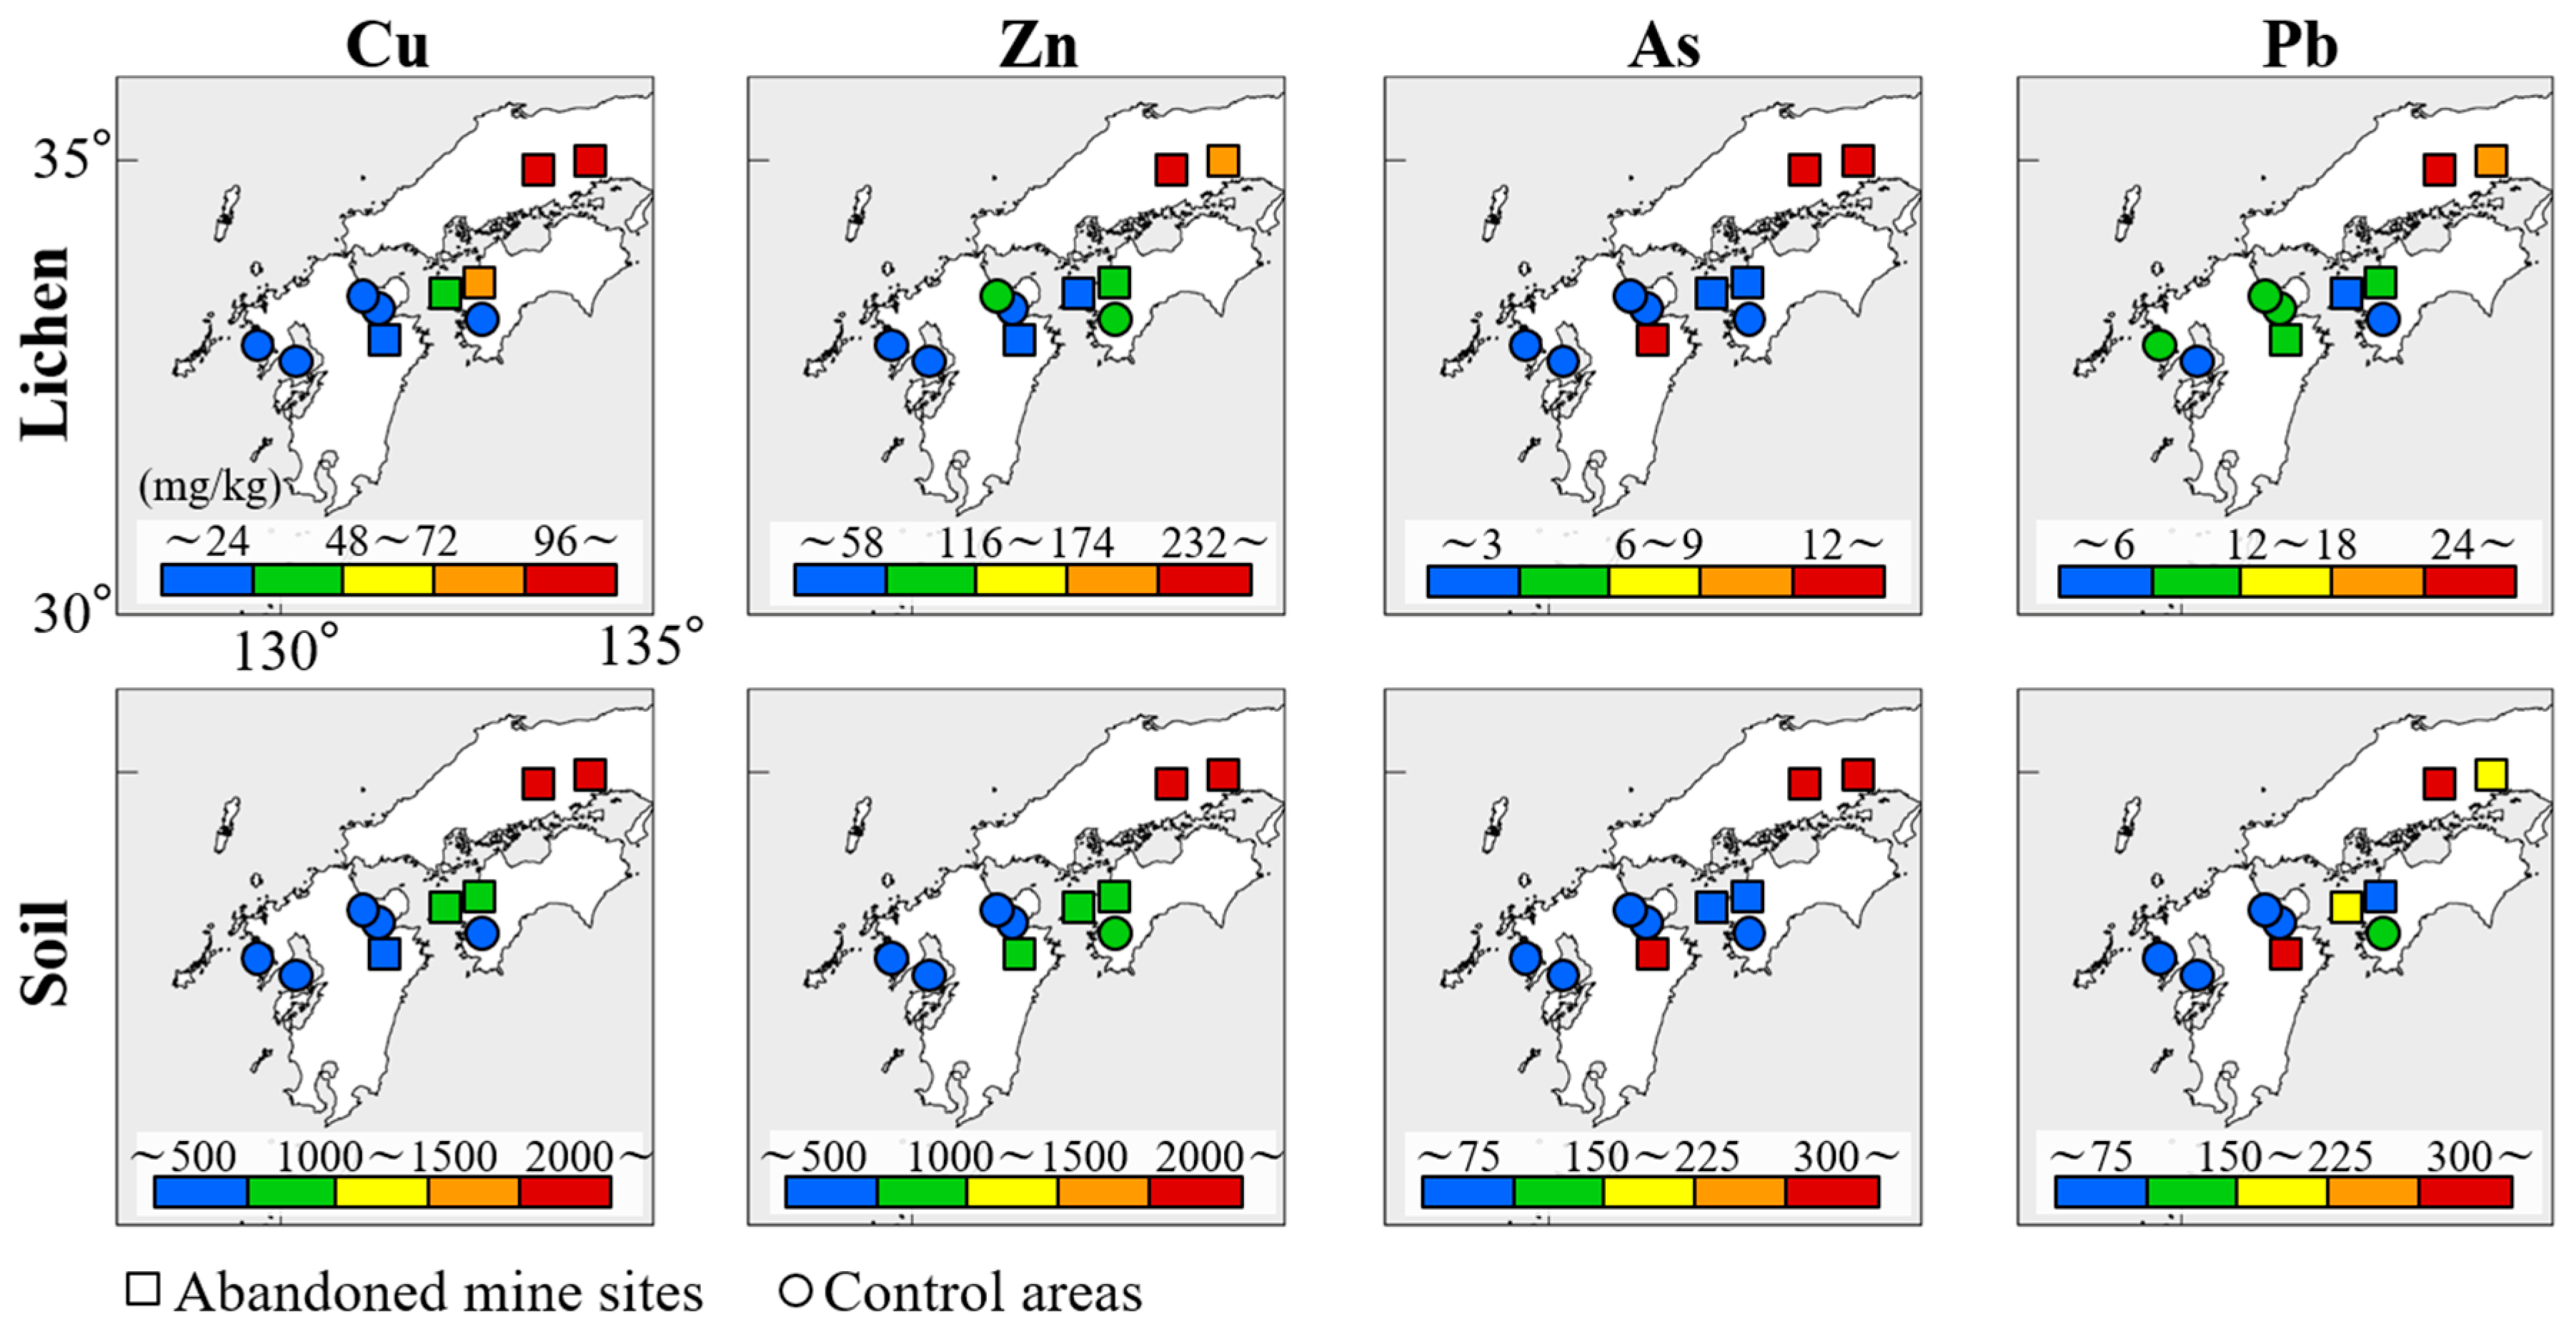
4.2. Practical Application of Lichens as Biomonitors

The relationships between trace element concentrations in lichens and the corresponding substrata have been demonstrated in previous studies [25,30]. Osyczka and Rola [25] demonstrated the relationship between Zn and Cd concentrations in C. subulata thalli and the host substrata using specific non-linear regression models described by a power function. In this study, the concentrations of Cu, Zn, As, and Pb in the lichens were positively correlated with those in the corresponding substrata and were analyzed by linear regression models after logarithmic transformation, similar to Osyczka and Rola [25]. The data of this study included different lichen species, locations, habitats, and conditions of soils in contrast to the previous study. This study, therefore, may be able to provide versatile data for the practical application of lichens compared with other previous studies.
The statistically positive correlations indicated that the lichens have potential as biomonitors of Cu, Zn, As, and Pb pollution in the soil. However, the practical applications of lichens require more than statistical correlations. Accordingly, this study evaluated the practical application of lichens using distribution maps of concentrations, created using the average concentrations of Cu, Zn, As, and Pb in lichens and soils at each sampling region (Figure 8).
The elemental concentrations were divided into five levels, based on the environmental soil standards of Japan. The yellow dots indicate that the concentrations exceeded the environmental standards. The blue and red dots indicate less than half and more than double levels of the standards, respectively. The standard values of trace elements in the soils were: 1000 mg/kg for Cu and Zn, and 150 mg/kg for As and Pb. The standards for Cu and Zn in soil are not set by the Ministry of the Environment in Japan. Although the standards for Cu and Zn were set as 125 mg/kg and 120 mg/kg, respectively, by the Agricultural Land Soil Pollution Prevention Act in Japan, the standards for these elements were set at 1000 mg/kg in this study as the target was not farmland. The estimated environmental standards of Cu, Zn, As, and Pb in lichens were calculated using Equation (2), which is calculated from the linear regression lines in the scatterplot of lichens in Figure 4:
logY = log ( aX b ) = log ( a ) + b × logX ,
Y = aX b ,
where Y is the elemental concentration in lichen, and X is the environmental standard value of soil. The antilogarithmic transformed equation was the same as the regression model obtained by a power function (Equation (3)). Accordingly, the estimated environmental standards of lichens were obtained using this equation.
As shown in Figure 8, the plots of Cu, Zn, and As in the lichens showed similar distributions as those in the soils. The distribution of Pb plots, however, varied widely. The variation in the Pb distribution may be affected by differences of bioavailability and/or the dissolution rate of Pb in metal minerals from those of the other elements. Consequently, the maps created using lichens detected almost all of the Cu, Zn, and As pollution in the soil.

5. Conclusions

To increase the sensitivity of pollution detection, a large number of samples should always be tested. Larger volumes of soil samples are required for analysis compared with lichen samples to meet this condition. Leaching tests may include artificial errors depending on the method chosen. Lichens absorb elements dissolved by surface water from the substrata, as well as wet and dry atmospheric deposition. Accordingly, analysis of lichens is not directly affected by mineral composition and grain size, but is affected by the solubility of elements in metal-rich minerals affecting environmental pollution. Moreover, the analysis of lichens can prevent the artificial contamination of analytical samples by W and the other elements contained in a mill during pulverizing because lichens are easily pulverized by a mortar. As a result, this study advocated that the analysis of lichens may be an alternative method for soil analyses or leaching tests to decrease artificial error, time, cost, and secondary environmental impact for assessment and monitoring of soil pollution, which are important advantages for practical applications. The analysis of lichens may be more applicable than that of soils for monitoring short- and long-term changes in soil pollution because lichens grow on-site over the long term. In conclusion, S. commixtum, C. humilis, C. ramulosa, C. krempelhuberi, C. crispata, C. scabriuscula, C. macilenta, C. rangiferina, and C. trassii could be used in practical applications for biomonitoring and risk assessment of Cu, Zn, and As pollution in surface soil. Lichens occur in a broad range of environments and, therefore, have broad utility as biomonitors of potentially toxic trace elements worldwide.

Acknowledgments

The authors are grateful to Kaoru Kinoshita (Meiji Pharmaceutical University, Japan) for help with LC/MS analysis and Akinori Kawamata (Ehime prefectural science museum, Japan) for help with morphological identification of lichens. We thank the anonymous referees for their perceptive comments and recommendations. This study was partially supported by grants from the Fukada Geological Institute (Fukada Grant-in-Aid, 2013) and JSPS KAKENHI Grant Number 15J04570.

Author Contributions

Yuri Sueoka mainly performed this study and wrote the paper. Masayuki Sakakibara provided advice and recommendations on all analytical methods. Sakae Sano provided advice and recommendations on the ICP-MS analysis. Yoshikazu Yamamoto contributed to the TLC.

Conflicts of Interest

The authors declare no conflict of interest.

Abbreviations

The following abbreviation are used in this manuscript:
TLCThin layer chromatography
LC/MSLiquid chromatography-mass spectrometry
ICP-MSInductively coupled plasma-mass spectrometry
WD-XRFWave dispersive X-ray fluorescence spectrometry
BCFBioconcentration factor

References

  1. Tiwari, M.J.; Bajpai, S.; Dewangan, U.K.; Tamrakar, R.K. Suitability of leaching test methods for fly ash and slag: A review. J. Radiat. Res. Appl. Sci. 2015, 8, 523–537. [Google Scholar] [CrossRef]
  2. Niemi, G.J.; McDonald, M.E. Application of ecological indicators. Annu. Rev. Ecol. Syst. 2004, 35, 89–111. [Google Scholar] [CrossRef]
  3. Graney, R.L., Jr.; Cherry, D.S.; Cairns, J., Jr. Heavy metal indicator potential of the Asiatic clam (Corbicula fluminea) in artificial stream systems. Hydrobiologia 1983, 102, 81–88. [Google Scholar] [CrossRef]
  4. Suter, G.W., II. Applicability of indicator monitoring to ecological risk assessment. Ecol. Indic. 2001, 1, 101–112. [Google Scholar] [CrossRef]
  5. Demirezen, D.; Aksoy, A. Common hydrophytes as bioindicators of iron and manganese pollutions. Ecol. Indic. 2006, 6, 388–393. [Google Scholar] [CrossRef]
  6. Birungi, Z.; Masola, B.; Zaranyika, M.F.; Naigaga, I.; Marshall, B. Active biomonitoring of trace heavy metals using fish (Oreochromis niloticus) as bioindicator species. The case of Nakivubo wetland along Lake Victoria. Phys. Chem. Earth 2007, 32, 1350–1358. [Google Scholar]
  7. Epelde, L.; Becerril, J.M.; Hernández-Allica, J.; Barrutia, O.; Garbisu, C. Functional diversity as indicator of the recovery of soil health derived from Thlaspi caerulescens growth and metal phytoextraction. Appl. Soil Ecol. 2008, 39, 299–310. [Google Scholar] [CrossRef]
  8. Hartley, W.; Uffindell, L.; Plumb, A.; Rawlinson, H.A.; Putwain, P.; Dickinson, N.M. Assessing biological indicators for remediated anthropogenic urban soils. Sci. Total Environ. 2008, 405, 358–369. [Google Scholar] [CrossRef] [PubMed]
  9. Krizkova, S.; Ryant, P.; Krystofova, O.; Adam, V.; Galiova, M.; Beklova, M.; Babula, P.; Kaiser, J.; Novotny, K.; Novotny, J.; et al. Multi-instrumental Analysis of Tissues of Sunflower Plants Treated with Silver (I) Ions—Plants as Bioindicators of Environmental Pollution. Sensors 2008, 8, 445–463. [Google Scholar] [CrossRef] [PubMed]
  10. Chang, J.S.; Yoon, I.H.; Kim, K.W. Heavy metal and arsenic accumulating fern species as potential ecological indicators in As-contaminated abandoned mines. Ecol. Indic. 2009, 9, 1275–1279. [Google Scholar] [CrossRef]
  11. María-Cervantes, A.; Jiménez-Cárceles, F.J.; Álvarez-Rogel, J. As, Cd, Cu, Mn, Pb, and Zn Contents in Sediments and Mollusks (Hexaplex trunculus and Tapes decussatus) from Coastal Zones of a Mediterranean Lagoon (Mar Menor, SE Spain) Affected by Mining Wastes. Water Air Soil Poll. 2009, 200, 289–304. [Google Scholar] [CrossRef]
  12. Moss, J.C.; Hardaway, C.J.; Richert, J.C.; Sneddon, J. Determination of cadmium copper, iron, nickel, lead and zinc in crawfish [Procambrus clarkii] by inductively coupled plasma optical emission spectrometry: A study over the 2009 season in Southwest Louisiana. Microchem. J. 2010, 95, 5–10. [Google Scholar] [CrossRef]
  13. Čeburnis, D.; Steinnes, E. Conifer needles as biomonitors of atmospheric heavy metal deposition: Comparison with mosses and precipitation, role of the canopy. Atmos. Environ. 2000, 34, 4265–4271. [Google Scholar] [CrossRef]
  14. Gerloff, G.C.; Stout, P.R.; Jones, L.H.P. Molybdenum-Manganese-Iron antagonisms in the nutrition of tomato plants. Plant Physiol. 1959, 34, 608–613. [Google Scholar] [CrossRef] [PubMed]
  15. Siedlecka, A. Some aspects of interactions between heavy metals and plant mineral nutrients. Acta Soc. Bot. Pol. 1995, 64, 265–272. [Google Scholar] [CrossRef]
  16. Loppi, S.; Pirintsos, S.A. Epiphytic lichens as sentinels for heavy metal pollution at forest ecosystems (central Italy). Environ. Pollut. 2003, 121, 327–332. [Google Scholar] [CrossRef]
  17. Goyal, R.; Seaward, M.R.D. Metal uptake in terricolous lichens. III. Translocation in the thallus of Peltigera canina. New Phytol. 1982, 90, 58–98. [Google Scholar]
  18. Knops, J.M.H.; Nash III, T.H.; Boucher, V.L.; Schlesinger, W.L. Mineral cycling and epiphytic lichens: Implications at the ecosystem level. Lichenologist 1991, 23, 309–321. [Google Scholar] [CrossRef]
  19. Nash III, T.H. Nutrients, elemental accumulation, and mineral cycling. In Lichen Biology, 2nd ed.; Nash III, T.H., Ed.; Cambridge University Press: Cambridge, UK, 2008; pp. 234–251. [Google Scholar]
  20. Nieboer, E.; Richardson, D.H.S.; Tomassini, F.D. Mineral uptake and release by lichens: An overview. Bryologist 1978, 81, 226–246. [Google Scholar] [CrossRef]
  21. Crittenden, P.D. Nutrient exchange in an Antarctic macrolichen during summer snowfall snow melt events. New Phytol. 1998, 139, 697–707. [Google Scholar] [CrossRef]
  22. Purvis, O.W.; Pawlik-Skowronska, B.; Cressey, G.; Jones, G.C.; Kearsley, A.; Spratt, J. Mineral phases and element composition of the copper hyperaccumulator lichen Lecanora polytropa. Mineral. Mag. 2008, 72, 607–616. [Google Scholar] [CrossRef]
  23. Purvis, O.W.; Bennett, J.P.; Spratt, J. Copper localization, elemental content, and thallus color in the copper hyperaccumulator lichen Lecanora sierrae from California. Lichenologist 2011, 43, 165–173. [Google Scholar] [CrossRef]
  24. Sueoka, Y.; Sakakibara, M.; Sera, K. Heavy Metal Behavior in Lichen-Mine Waste Interactions at an Abandoned Mine Site in Southwest Japan. Metals 2015, 5, 1591–1608. [Google Scholar] [CrossRef]
  25. Osyczka, P.; Rola, K. Response of the lichen Cladonia rei Schaer. To strong heavy metal contamination of the substrate. Environ. Sci. Pollut. Res. Int. 2013, 20, 5076–5084. [Google Scholar] [CrossRef] [PubMed]
  26. Edwards, H.G.M.; Moody, C.D.; Jorge Villar, S.E.; Wynn-Williams, D.D. Raman spectroscopic detection of key biomarkers of cyanobacteria and lichen symbiosis in extreme Antarctic habitats: Evaluation for Mars Lander missions. Icarus 2005, 174, 560–571. [Google Scholar] [CrossRef]
  27. Bačkor, M.; Loppi, S. Interactions of lichens with heavy metals. Biol. Plant. 2009, 53, 214–222. [Google Scholar] [CrossRef]
  28. Favero-Longo, S.E.; Isocrono, D.; Piervittori, R. Lichens and ultramafic rocks: A review. Lichenologist 2004, 36, 391–404. [Google Scholar] [CrossRef]
  29. Rajakaruna, N.; Knudsen, K.; Fryday, A.M.; O’Dell, R.E.; Pore, N.; Olday, F.C.; Woolhouse, S. Investigation of the importance of rock chemistry for saxicolous lichen communities of the New Idria serpentinite mass, San Benito County, California, USA. Lichenologist 2012, 44, 695–714. [Google Scholar] [CrossRef]
  30. Nakajima, H.; Fujimoto, K.; Yoshitani, A.; Yamamoto, Y.; Sakurai, H.; Itoh, K. Effect of copper stress on cup lichens Cladonia. humilis and C. subconistea growing on copper-hyperaccumulating moss Scopelophila cataractae at copper-polluted sites in Japan. Ecotoxicol. Environ. Saf. 2012, 84, 341–346. [Google Scholar] [PubMed]
  31. Rajakaruna, N.; Harris, T.B.; Clayden, S.R.; Dibble, A.C.; Olday, F.C. Lichens of the Callahan Mine, a copper- and zinc-enriched superfund site in Brooksville, Maine, U.S.A. Rhodora 2011, 113, 1–31. [Google Scholar] [CrossRef]
  32. Medeiros, I.D.; Fryday, A.M.; Rajakaruna, N. Additional lichen records and mineralogical data from metal-contaminated sites in Maine. Rhodora 2014, 116, 323–347. [Google Scholar] [CrossRef]
  33. Huneck, S.; Yoshimura, I. Identification of Lichen Substances; Springer: Berlin, Germany, 1996. [Google Scholar]
  34. Imai, N.; Terashima, S.; Itoh, S.; Ando, A. 1996 Compilation of analytical data on nine GSJ geochemical reference samples, “Sedimentary Rock Series”. Geostand. Geoanal. Res. 1996, 20, 165–216. [Google Scholar] [CrossRef]
  35. Imai, N.; Terashima, S.; Itoh, S.; Ando, A. 1998 Compilation of analytical data for five GSJ geochemical reference samples: The “Instrumental Analysis Series”. Geostand. Geoanal. Res. 1998, 23, 223–250. [Google Scholar] [CrossRef]
  36. Kanda, Y. Investigation of the freely available easy-to-use software “EZR” for medical statistics. Bone Marrow Transpl. 2013, 48, 452–458. [Google Scholar] [CrossRef] [PubMed]
  37. McGeer, J.C.; Brix, K.V.; Skeaff, J.M.; DeForest, D.K.; Brigham, S.I.; Adams, W.J.; Green, A. Inverse relationship between bioconcentration factor and exposure concentration for metals: Implications for hazard assessment of metals in the aquatic environment. Environ. Toxicol. Chem. 2003, 22, 1017–1037. [Google Scholar] [CrossRef] [PubMed]
  38. Nishizono, H.; Suzuki, S.; Ishii, F. Accumulation of heavy metals in the metal-tolerant fern, Athyrium yokoscense, growing on various environments. Plant Soil 1987, 102, 65–70. [Google Scholar] [CrossRef]
  39. Morishita, T.; Boratyski, J.K. Accumulation of Cadmium and Other Metals in Organs of Plants Growing around Metal Smelters in Japan. Soil Sci. Plant Nutr. 1992, 38, 781–785. [Google Scholar] [CrossRef]
  40. Yoshihara, T.; Tsunokawa, K.; Miyano, Y.; Arashima, Y.; Hodoshima, H.; Shoji, K.; Shimada, H.; Goto, F. Induction of callus from a metal hypertolerant fern, Athyrium yokoscense, and evaluation of its cadmium tolerance and accumulation capacity. Plant Cell Rep. 2005, 23, 579–585. [Google Scholar] [CrossRef] [PubMed]
  41. Kamachi, H.; Komori, I.; Tamura, H.; Sawa, Y.; Karahara, I.; Honma, Y.; Wada, N.; Kawabata, T.; Matsuda, K.; Ikeno, S.; et al. Lead tolerance and accumulation in the gametophytes of the fern Athyrium yokoscense. J. Plant Res. 2005, 118, 137–145. [Google Scholar] [CrossRef] [PubMed]
  42. Nieboer, E.; Richardson, D.H.S. The replacement of the nondescript term “heavy metals” byabiologically and chemically significant classification of metal ions. Environ. Pollut. Ser. B 1980, 1, 3–26. [Google Scholar] [CrossRef]
  43. Nakajima, H.; Yamamoto, Y.; Yoshitani, A.; Itoh, K. Effect of metal stress on photosynthetic pigments in the Cu-hyperaccumulating lichens Cladonia humilis and Stereocaulon. japonicum growing in Cu-polluted sites in Japan. Ecotoxicol. Environ. Saf. 2013, 97, 154–159. [Google Scholar] [PubMed]
  44. Nakajima, H.; Hara, K.; Yamamoto, Y.; Itoh, K. Effects of Cu on the content of chlorophylls and secondary metabolites in the Cu-hyperaccumulator lichen Stereocaulon japonicum. Ecotoxicol. Environ. Saf. 2015, 113, 447–482. [Google Scholar] [CrossRef] [PubMed]
  45. Osyczka, P.; Rola, K.; Jankowska, K. Vertical concentration gradients of heavy metals in Cladonia lichens across different parts of thalli. Ecol. Indic. 2016, 61, 766–776. [Google Scholar] [CrossRef]
  46. Beckett, R.P.; Brown, D.H. The control of cadmium uptake in the lichen genus Peltigera. J. Exp. Bot. 1984, 35, 1071–1082. [Google Scholar] [CrossRef]
  47. Beckett, R.P.; Brown, D.H. The relationship between cadmium uptake and heavy metal uptake tolerance in the lichen genus Peltigera. New Phytol. 1984, 97, 301–311. [Google Scholar] [CrossRef]
  48. Banfield, J.F.; Baker, W.W.; Welch, S.A.; Taunton, A. Biological impact on mineral dissolution: Application of the lichen model to understanding mineral weathering in the rhizosphere. Proc. Natl. Acad. Sci. USA 1999, 96, 3404–3411. [Google Scholar] [CrossRef] [PubMed]
Figure 1. Locations of this study areas and their climate zone.
Environments 03 00035 g001
Figure 2. Several lichens growing on soil, rock, and/or mine wastes in the study areas.
Environments 03 00035 g002
Figure 3. Distribution maps of lichens on mine waste dumps in the study areas OM1 and OM2.
Environments 03 00035 g003
Figure 4. Scatterplots of Cu, Zn, As, and Pb concentrations in lichens and the corresponding substrata, with regression lines.
Environments 03 00035 g004
Figure 5. Scatterplots of Cu, Zn, As, and Pb concentrations in lichens and the corresponding substrata, separated by lichen species, location, habitat, types of substrata, constituents of substrata, and particle sizes of soils using different colors.
Environments 03 00035 g005
Figure 6. Scatter matrices showing the relationships among each Cu, Zn, As, and Pb concentration in lichens and soils after logarithmic transformation, with regression lines.
Environments 03 00035 g006
Figure 7. Scatterplots showing relationships between the BCFs and the elemental concentrations in soils, separated by lichen species, location, habitat, types of substrata, constituents of substrata, and particle sizes of soils using different colors.
Environments 03 00035 g007
Figure 8. Distribution maps of the average concentrations of Cu, Zn, As, and Pb in lichens and soils at each sampling region in southwest Japan. The yellow dots indicate the environmental standards in Japan.
Environments 03 00035 g008

