
Vegetation Structure and Carbon Stocks of Two Protected Areas within the South-Sudanian Savannas of Burkina Faso

 , , ,
, , ,
Abstract
:1. Introduction
2. Materials and Methods
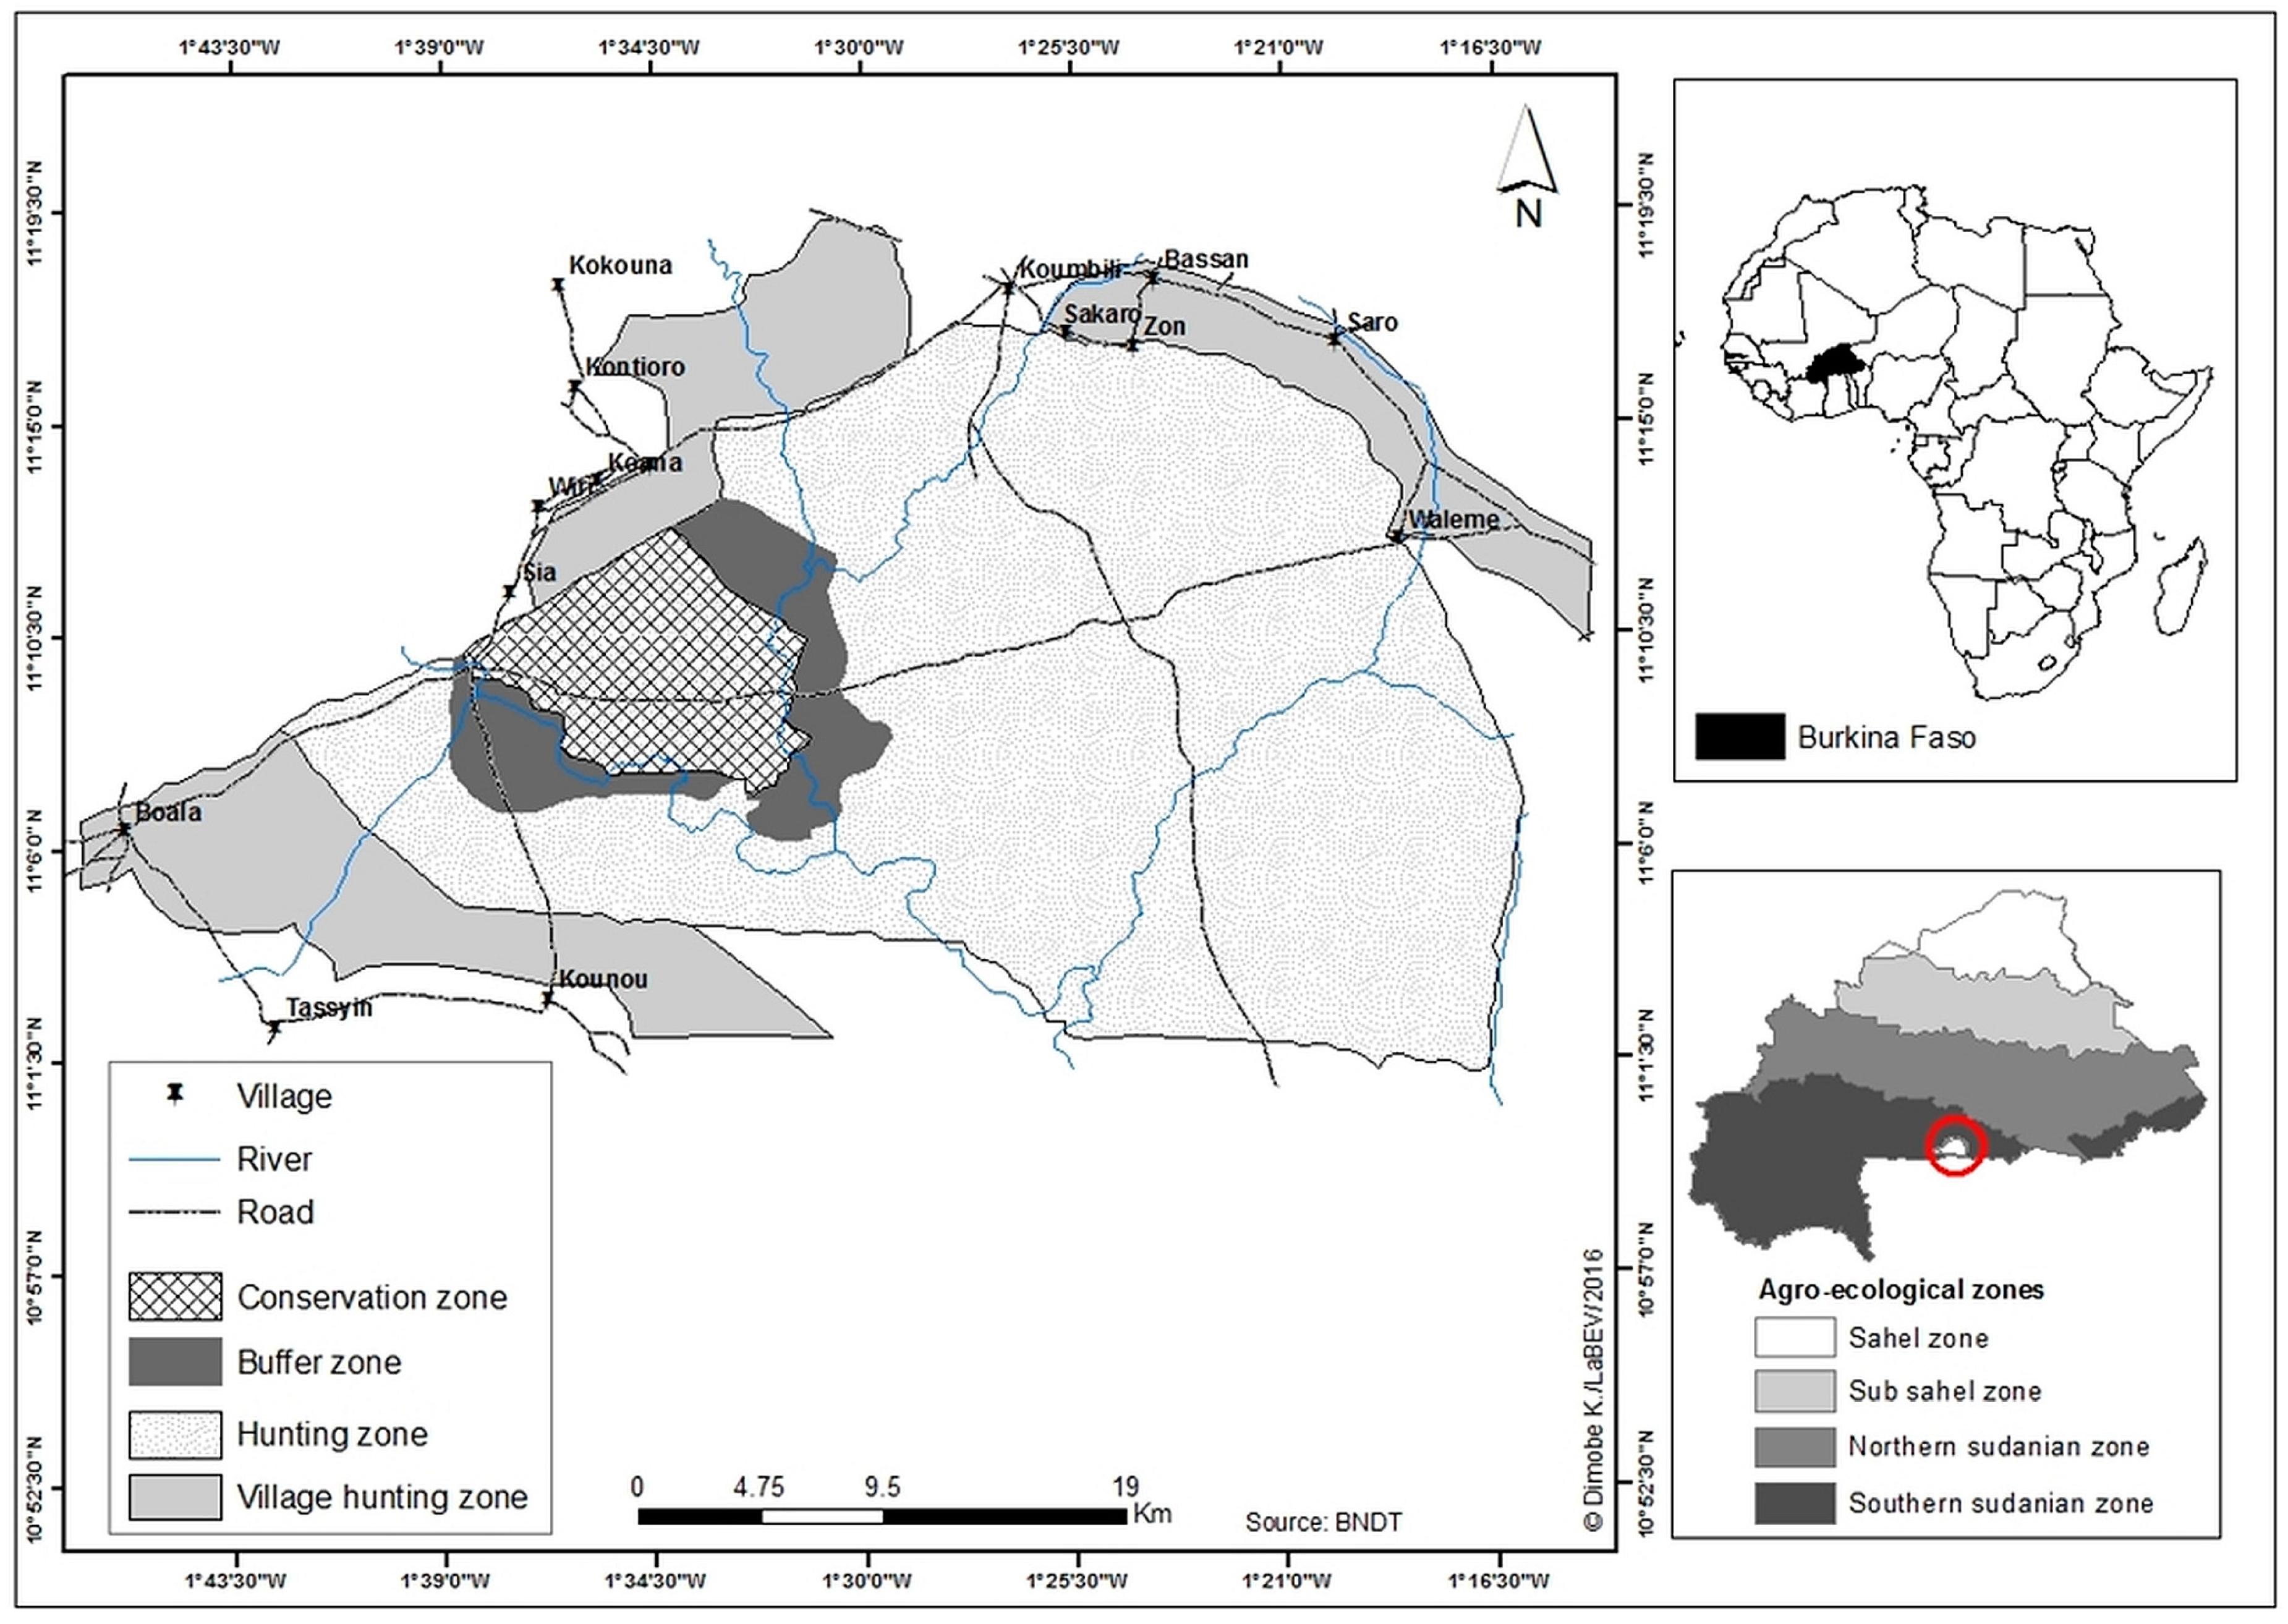
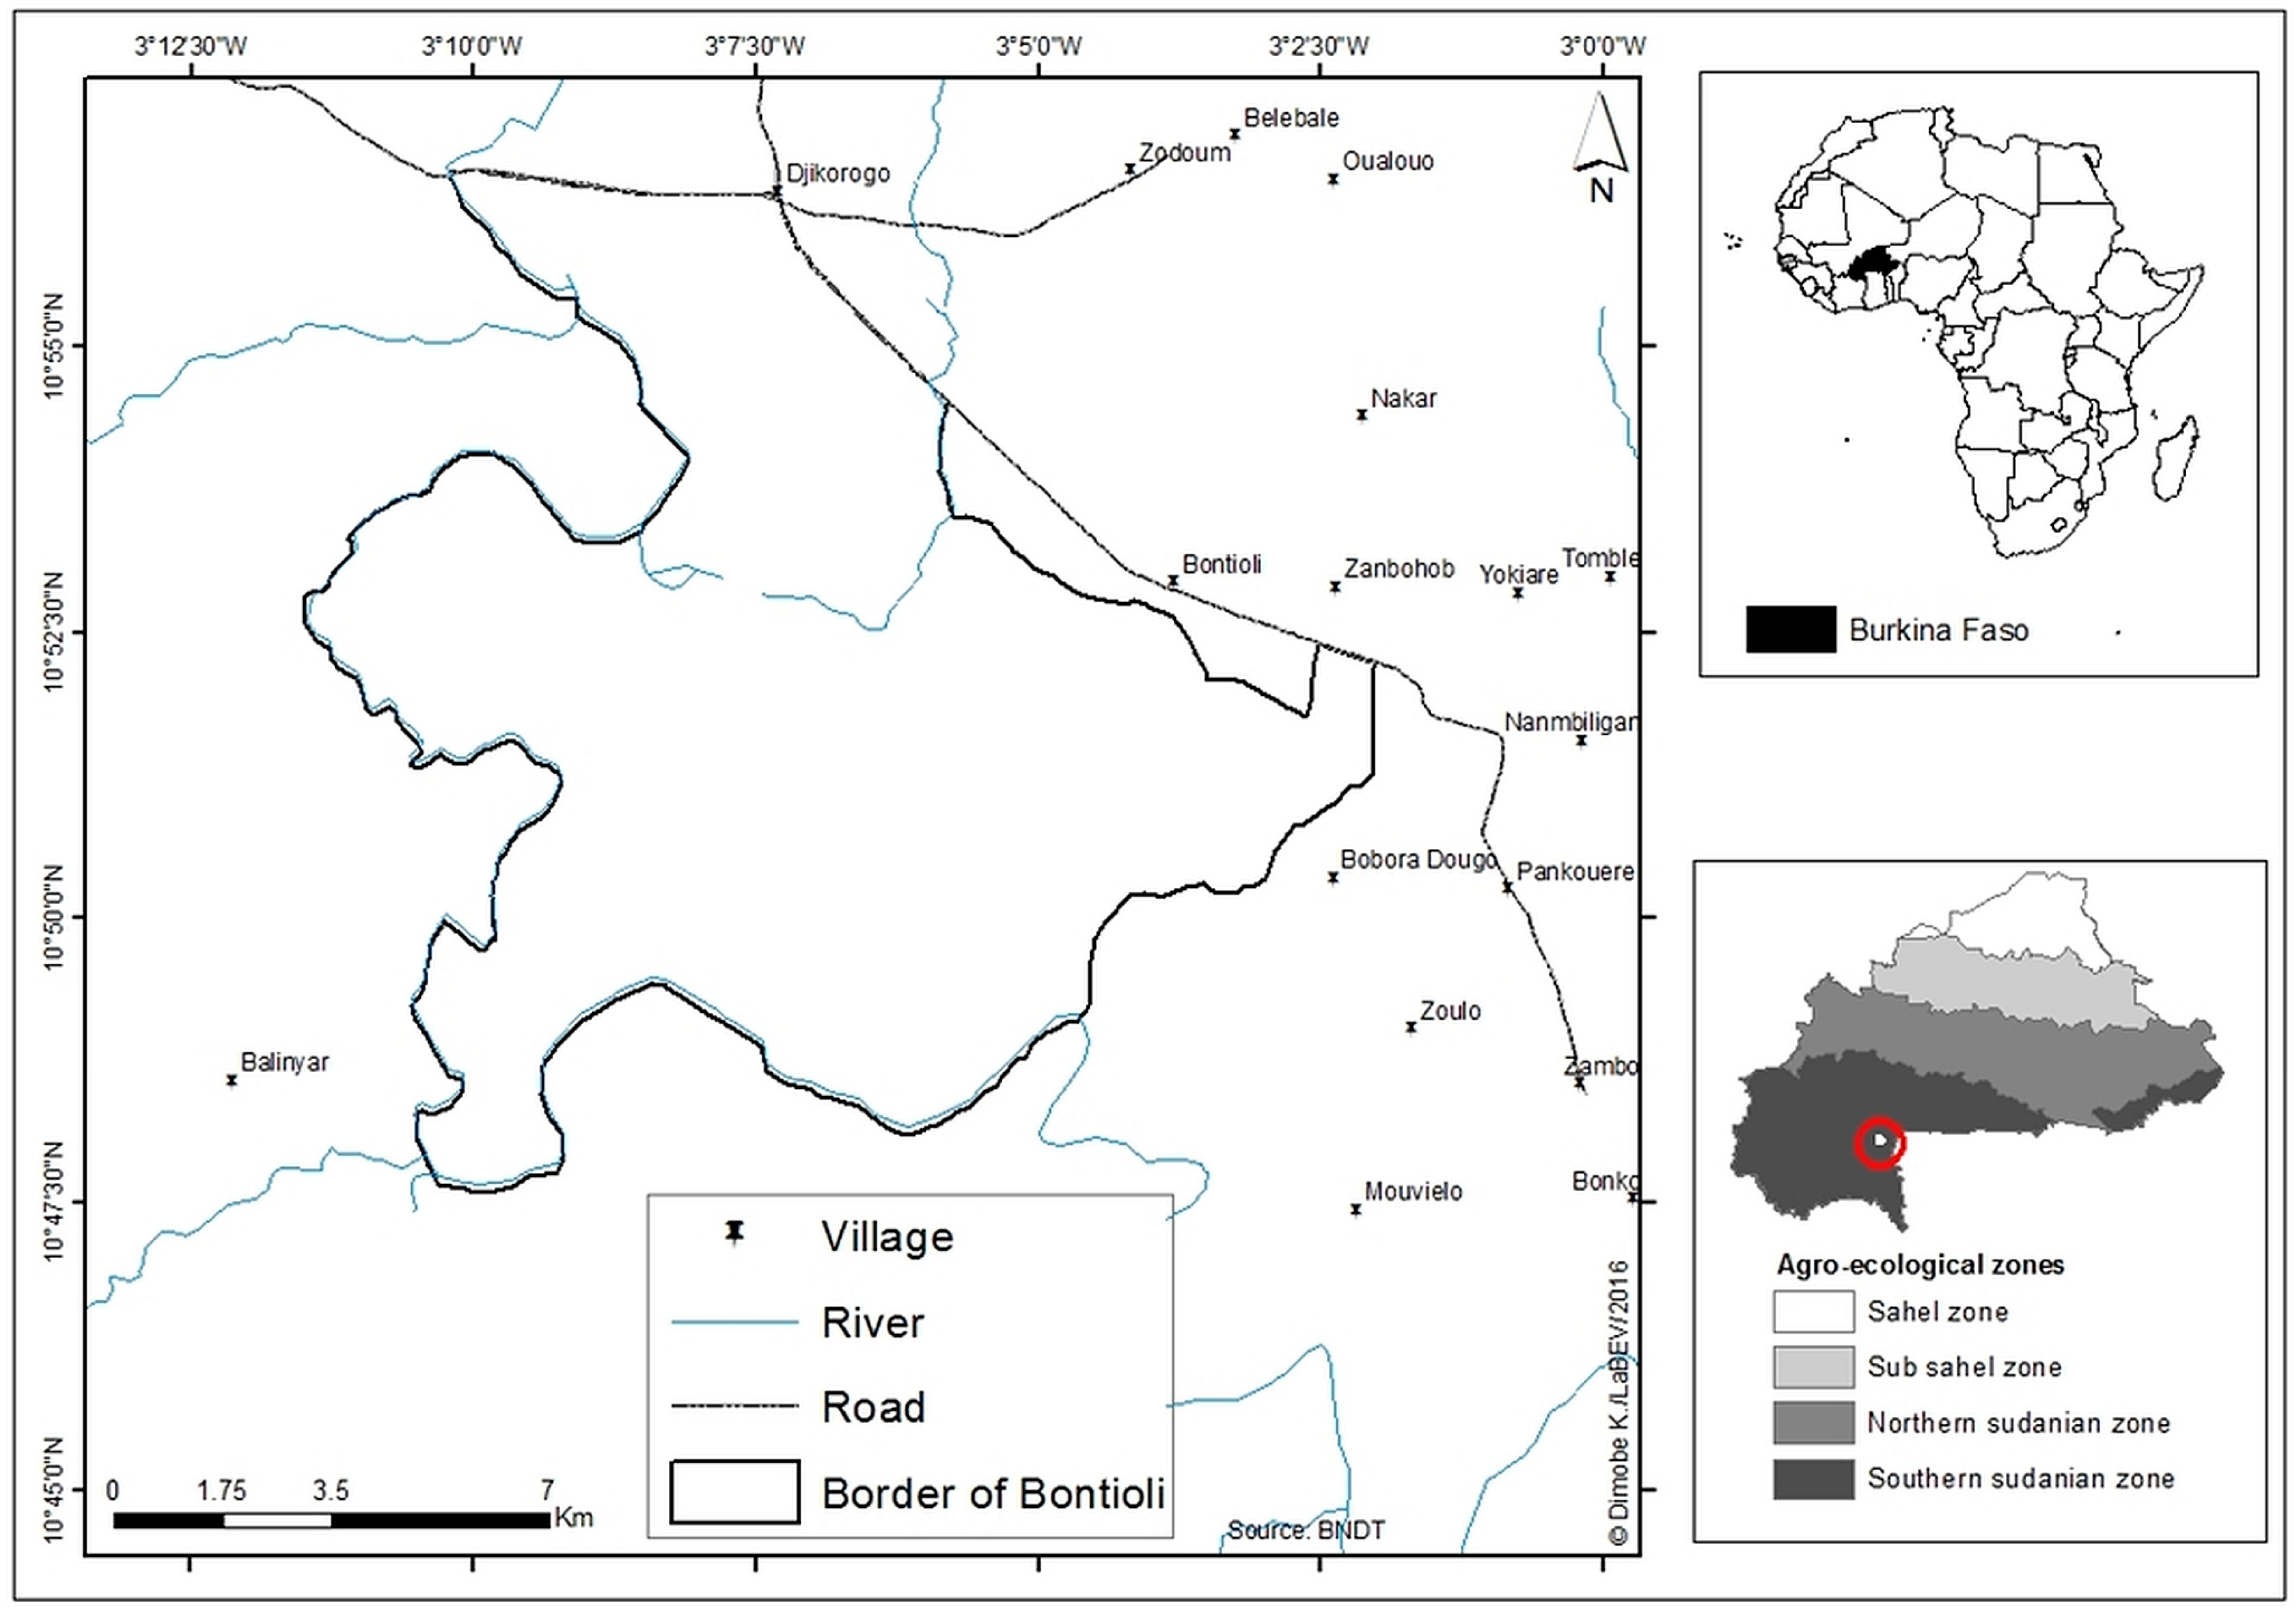
2.1. Study Area
2.2. Sampling Design
2.3. Data Collection and Analysis
2.3.1. AGBdry and Carbon Stock Estimation
2.3.2. Quadratic Mean Diameter and Density
2.3.3. Basal Area (BA), Importance Value Index (IVI), and Family Importance Value (FIV)
2.4. Statistical Analysis
3. Results
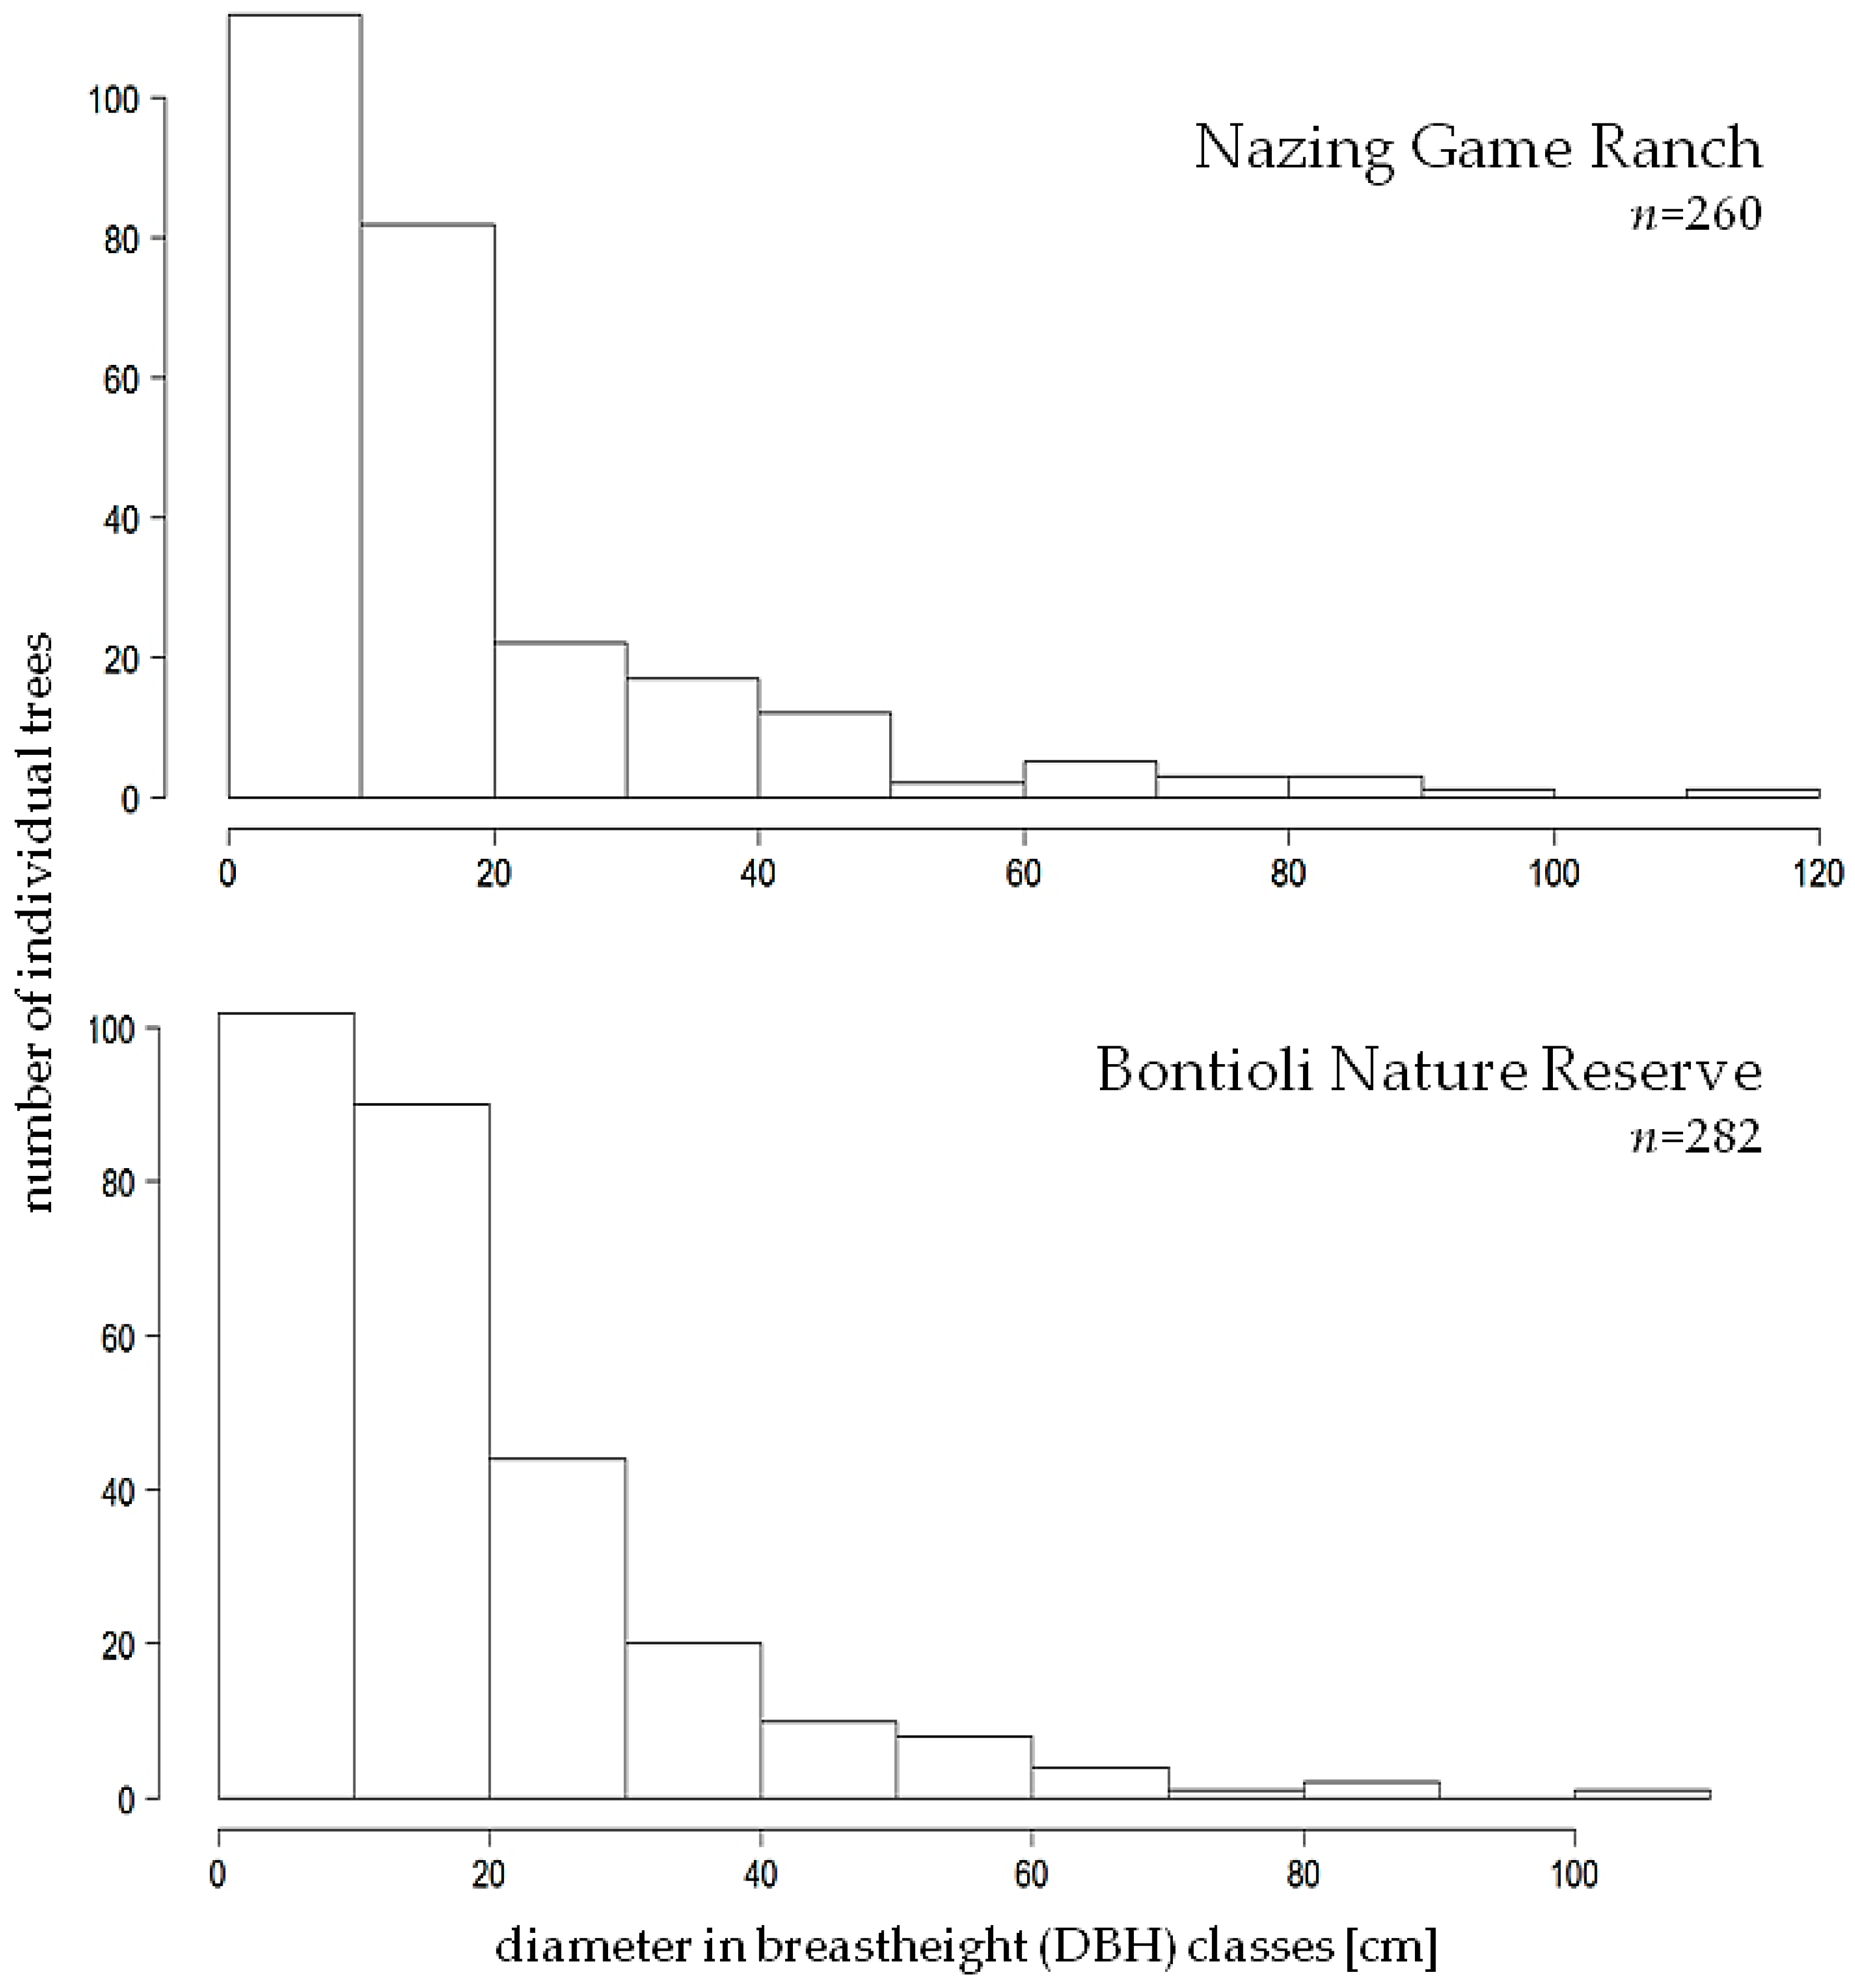
3.1. DBH and Height
3.2. Density and BA
3.3. AGBdry
3.4. Carbon Stocks
3.5. IVI, FIV, and Relative Abundance of Trees
4. Discussion
4.1. DBH and DBH Class Distribution
4.2. Stem Densities, Tree Heights, and BA
4.3. AGBdry and Carbon Stocks
4.4. Floristics
5. Conclusions
Acknowledgments
Author Contributions
Conflicts of Interest
Appendix A

| Species | N | Relative Abundance (%) | Wood Density (g·cm−3) | References | |
|---|---|---|---|---|---|
| Species Level | Generic Level | ||||
| Acacia sieberiana DC. var. villosa A. Chev. | 2 | 0.36 | 0.65 | [54] | |
| Afzelia africana Sm. | 1 | 0.18 | 0.71 | [55] | |
| Anogeissus leiocarpa (DC.) Guill. & Perr. | 152 | 28.04 | 0.73 | [55] | |
| Bridelia scleroneura Müll. Arg. | 3 | 0.55 | 0.81 | [56] | |
| Cassia sieberiana DC. | 16 | 2.95 | 0.72 | [57] | |
| Combretum adenogonium Steud. ex A. Rich. | 13 | 2.39 | 0.64 | [58] | |
| Combretum collinum Fresen. | 8 | 1.47 | 0.79 | [54] | |
| Combretum fragrans F.Hoffm. | 37 | 6.82 | 0.64 | [58] | |
| Combretum glutinosum Perr. ex DC. | 2 | 0.36 | 0.90 | [59] | |
| Daniellia oliveri (Rolfe) Hutch. & Dalz. | 13 | 2.39 | 0.40 | [60] | |
| Detarium microcarpum Guill. & Perr. | 4 | 0.73 | 0.78 | [61] | |
| Diospyros mespiliformis Hochst. ex A. DC. | 1 | 0.18 | 0.72 | [57] | |
| Entada africana Guill. & Perr. | 7 | 1.29 | 0.53 | [57] | |
| Gardenia erubescens Stapf & Hutch. | 1 | 0.18 | 0.64 | [54] | |
| Gardenia ternifolia Schum. & Thonn. | 3 | 0.55 | 0.81 | [56] | |
| Lannea microcarpa Engl. & K. Krause | 1 | 0.18 | 0.51 | [57] | |
| Maytenus senegalensis (Lam.) Exell | 2 | 0.36 | 0.71 | [62] | |
| Mitragyna inermis (Willd.) O. Ktze. | 70 | 12.91 | 0.56 | [62] | |
| Parkia biglobosa (Jacq.) R. Br. ex G. Don f. | 17 | 3.13 | 0.61 | [63] | |
| Pericopsis laxiflora (Benth. ex Bak.) van Meeuwen | 1 | 0.18 | 0.93 | [64] | |
| Piliostigma thonningii (Schum.) Milne-Redhead | 9 | 1.66 | 0.61 | [57] | |
| Pseudocedrela kotschyi (Schweinf.) Harms | 7 | 1.29 | 0.62 | [65] | |
| Pterocarpus erinaceus Poir. | 4 | 0.73 | 0.62 | [57] | |
| Saba senegalensis (A. DC.) Pichon | 6 | 1.10 | 0.62 | [57] | |
| Stereospermum kunthianum Cham. | 3 | 0.55 | 0.60 | [58] | |
| Terminalia laxiflora Engl. & Diels | 65 | 11.99 | 0.71 | [62] | |
| Terminalia macroptera Guill. & Perr. | 23 | 4.24 | 0.71 | [62] | |
| Vitellaria paradoxa C.F. Gaertn. | 67 | 12.36 | 0.72 | [66] | |
| Ximenia americana L. | 4 | 0.73 | 0.95 | [59] | |
| Nazinga Game Ranch | ||||
| Species | Rf (%) | RDe (%) | RDo (%) | IVI |
| Afzelia africana Sm. | 5 | 0.38 | 0.67 | 6.06 |
| Anogeissus leiocarpa (DC.) Guill. & Perr. | 35 | 53.84 | 26.72 | 115.56 |
| Cassia sieberiana DC. | 30 | 6.15 | 16.28 | 52.43 |
| Detarium microcarpum Guill. & Perr. | 10 | 1.53 | 0.25 | 11.79 |
| Diospyros mespiliformis Hochst. ex A. DC. | 5 | 0.38 | 0.04 | 5.43 |
| Maytenus senegalensis (Lam.) Exell | 10 | 0.76 | 0.08 | 10.85 |
| Mitragyna inermis (Willd.) O. Ktze. | 25 | 8.84 | 31.58 | 65.43 |
| Parkia biglobosa (Jacq.) R. Br. ex G. Don f. | 5 | 0.38 | 5.13 | 10.51 |
| Piliostigma thonningii (Schum.) Milne-Redhead | 5 | 0.38 | 0.06 | 5.44 |
| Saba senegalensis (A. DC.) Pichon | 15 | 2.30 | 14.17 | 31.48 |
| Stereospermum kunthianum Cham. | 5 | 0.38 | 0.03 | 5.42 |
| Terminalia laxiflora Engl. & Diels | 25 | 11.15 | 2.14 | 38.29 |
| Vitellaria paradoxa C.F. Gaertn. | 25 | 13.46 | 2.78 | 41.25 |
| Bontioli Nature Reserve | ||||
| Species | Rf (%) | RDe (%) | RDo (%) | IVI |
| Acacia sieberiana DC. var. villosa A. Chev. | 5 | 0.70 | 0.16 | 5.87 |
| Anogeissus leiocarpa (DC.) Guill. & Perr. | 15 | 4.25 | 6.12 | 25.38 |
| Bridelia scleroneura Müll. Arg. | 5 | 1.06 | 0.51 | 6.57 |
| Combretum adenogonium Steud. ex A. Rich. | 15 | 4.60 | 2.00 | 21.61 |
| Combretum collinum Fresen. | 5 | 2.83 | 0.50 | 8.33 |
| Combretum fragrans F.Hoffm. | 15 | 13.12 | 7.62 | 35.75 |
| Combretum glutinosum Perr. ex DC. | 10 | 0.70 | 0.10 | 10.81 |
| Daniellia oliveri (Rolfe) Hutch. & Dalz. | 15 | 4.60 | 9.63 | 29.24 |
| Entada africana Guill. & Perr. | 10 | 2.48 | 0.51 | 12.99 |
| Gardenia erubescens Stapf & Hutch. | 5 | 0.35 | 0.06 | 5.41 |
| Gardenia ternifolia Schum. & Thonn. | 10 | 1.06 | 0.72 | 11.78 |
| Lannea microcarpa Engl. & K. Krause | 5 | 0.35 | 0.26 | 5.61 |
| Mitragyna inermis (Willd.) O. Ktze. | 35 | 16.66 | 46.93 | 98.59 |
| Parkia biglobosa (Jacq.) R. Br. ex G. Don f. | 10 | 5.67 | 5.09 | 20.77 |
| Pericopsis laxiflora (Benth. ex Bak.) van Meeuwen | 5 | 0.35 | 0.18 | 5.53 |
| Piliostigma thonningii (Schum.) Milne-Redhead | 20 | 2.83 | 0.31 | 23.15 |
| Pseudocedrela kotschyi (Schweinf.) Harms | 10 | 2.48 | 1.59 | 14.07 |
| Pterocarpus erinaceus Poir. | 5 | 1.41 | 3.39 | 9.81 |
| Stereospermum kunthianum Cham. | 5 | 0.70 | 0.05 | 5.76 |
| Terminalia laxiflora Engl. & Diels | 20 | 12.76 | 2.92 | 35.69 |
| Terminalia macroptera Guill. & Perr. | 5 | 8.15 | 3.73 | 16.89 |
| Vitellaria paradoxa C.F. Gaertn. | 25 | 11.34 | 7.20 | 43.55 |
| Ximenia americana L. | 15 | 1.41 | 0.30 | 16.72 |
| Nazinga Game Ranch | ||||
| Family | RDi (%) | RDe (%) | RDo (%) | FIV |
| Apocynaceae | 7.69 | 2.30 | 14.17 | 24.17 |
| Bignoniaceae | 7.69 | 0.38 | 0.03 | 8.11 |
| Fabaceae-Caesalpiniaceae | 30.76 | 8.46 | 17.27 | 56.50 |
| Celastraceae | 7.69 | 0.76 | 0.08 | 8.54 |
| Combretaceae | 15.38 | 65 | 28.86 | 109.25 |
| Ebenaceae | 7.69 | 0.38 | 0.04 | 8.12 |
| Fabaceae-Mimosoideae | 7.69 | 0.38 | 5.13 | 13.21 |
| Rubiaceae | 7.69 | 8.84 | 31.58 | 48.12 |
| Sapotaceae | 7.69 | 13.46 | 2.78 | 23.94 |
| Bontioli Nature Reserve | ||||
| Family | RDi (%) | RDe (%) | RDo (%) | FIV |
| Anacardiaceae | 4.34 | 0.35 | 0.26 | 4.96 |
| Bignoniaceae | 4.34 | 0.70 | 0.05 | 5.11 |
| Fabaceae-Caesalpiniaceae | 8.69 | 7.44 | 9.95 | 26.09 |
| Combretaceae | 30.43 | 46.45 | 23.02 | 99.91 |
| Euphorbiaceae | 4.34 | 1.06 | 0.51 | 5.92 |
| Fabaceae-Papilionioideae | 8.69 | 1.77 | 3.58 | 14.04 |
| Meliaceae | 4.34 | 2.48 | 1.59 | 8.42 |
| Fabaceae-Mimosoideae | 13.04 | 8.86 | 5.77 | 27.68 |
| Olacaceae | 4.34 | 1.41 | 0.30 | 6.07 |
| Rubiaceae | 13.04 | 18.08 | 47.72 | 78.84 |
| Sapotaceae | 4.34 | 11.34 | 7.20 | 22.89 |
References
- Sop, T.K.; Oldeland, J.; Schmiedel, U.; Ouedraogo, I.; Thiombiano, A. Population structure of three woody species in four ethnic domains of the sub-sahel of Burkina Faso. Land Degrad. Dev. 2011, 22, 519–529. [Google Scholar] [CrossRef]
- Arevalo, J. Improving woodfuel governance in Burkina Faso: The experts’ assessment. Renew. Sustain. Energy Rev. 2016, 57, 1398–1408. [Google Scholar] [CrossRef]
- Luck, G.W. A review of the relationships between human population density and biodiversity. Biol. Rev. 2007, 82, 607–645. [Google Scholar] [CrossRef] [PubMed]
- Jurisch, K.; Hahn, K.; Wittig, R.; Bernhardt-Römermann, M. Population Structure of Woody Plants in Relation to Land Use in a Semi-arid Savanna, West Africa. Biotropica 2012, 44, 744–751. [Google Scholar] [CrossRef]
- Bayen, P.; Lykke, A.M.; Thiombiano, A. Success of three soil restoration techniques on seedling survival and growth of three plant species in the Sahel of Burkina Faso (West Africa). J. For. Res. 2016, 27, 313–320. [Google Scholar] [CrossRef]
- Schmidt, M.; Traoré, S.; Ouédraogo, A.; Mbayngone, E.; Ouédraogo, O.; Zizka, A.; Kirchmair, I.; Kaboré, E.; Tindano, E.; Thiombiano, A.; et al. Geographical patterns of woody plants’ functional traits in Burkina Faso. Candollea 2013, 68, 197–202. [Google Scholar] [CrossRef]
- Ky-Dembele, C.; Tigabu, M.; Bayala, J.; Odén, P.C. Inter- and intra-provenances variations in seed size and seedling characteristics of Khaya senegalensis A. Agrofor. Syst. 2014, 88, 311–320. [Google Scholar] [CrossRef]
- Fischer, C.; Kleinn, C.; Fehrmann, L.; Fuchs, H.; Panferov, O. A national level forest resource assessment for Burkina Faso - A field based forest inventory in a semiarid environment combining small sample size with large observation plots. For. Ecol. Manag. 2011, 262, 1532–1540. [Google Scholar] [CrossRef]
- Ministry of Environment and Sustainable Development. Readiness Preparation Plan For Redd; Ministry of the Environment and Sustainable Development: Ouagadougou, Burkina Faso, 2012.
- Food and Agriculture Organization (FAO). Global Forest Resources Assessment 2015; FAO: Rome, Italy, 2015; p. 253. [Google Scholar]
- Collins, L.; Penman, T.; Ximenes, F.A.; Binns, D.; York, A.; Bradstock, R. Impacts of frequent burning on live tree carbon biomass and demography in post-harvest regrowth forest. Forests 2014, 5, 802–821. [Google Scholar] [CrossRef]
- Koffi, C.K.; Djoudi, H.; Gautier, D. Landscape diversity and associated coping strategies during food shortage periods: Evidence from the Sudano-Sahelian region of Burkina Faso. Reg. Environ. Chang. 2016, 1–12. [Google Scholar] [CrossRef]
- Bluffstone, R.; Robinson, E.; Guthiga, P. REDD+ and community-controlled forests in low-income countries: Any hope for a linkage? Ecol. Econ. 2013, 87, 43–52. [Google Scholar] [CrossRef]
- Ngo, K.M.; Turner, B.L.; Muller-Landau, H.C.; Davies, S.J.; Larjavaara, M.; Hassan, N.F.; Lum, S. Carbon stocks in primary and secondary tropical forests in Singapore. For. Ecol. Manag. 2013, 296, 81–89. [Google Scholar] [CrossRef]
- Stern, N. Climate. Stern Review: The Economics of Climate Change. N. Engl. J. Public Policy 2007, 21, 4. [Google Scholar]
- Birdsey, R.; Pan, Y.; Houghton, R. Sustainable landscapes in a world of change: Tropical forests, land use and implementation of REDD+: Part II. Carbon Manag. 2013, 4, 567–569. [Google Scholar] [CrossRef]
- Field, C.B.; Barros, V.R.; Dokken, D.J.; Mach, K.J.; Mastrandrea, M.D.; Bilir, T.E.; Chatterjee, M.; Ebi, K.L.; Estrada, Y.O.; Genova, R.C.; et al. IPCC Climate Change 2014: Impacts, Adaptation, and Vulnerability. Part A: Global and Sectoral Aspects. Contribution of Working Group II to the Fifth Assessment Report of the Intergovernmental Panel on Climate Change; Cambridge University Press: New York, NY, USA, 2014. [Google Scholar]
- Woollen, E.; Ryan, C.M.; Williams, M. Carbon Stocks in an African Woodland Landscape: Spatial Distributions and Scales of Variation. Ecosystems 2012, 15, 804–818. [Google Scholar] [CrossRef]
- Attua, E.M.; Pabi, O. Tree species composition, richness and diversity in the northern forest-savanna ecotone of Ghana. J. Appl. Biosci. 2013, 69, 5437–5448. [Google Scholar] [CrossRef]
- Oliveira, P.J.C.; Asner, G.P.; Knapp, D.E.; Almeyda, A.; Galván-Gildemeister, R.; Keene, S.; Raybin, R.F.; Smith, R.C. Land-use allocation protects the Peruvian Amazon. Science 2007, 317, 1233–1236. [Google Scholar] [CrossRef] [PubMed]
- Jenks, J.A.; Klaver, R.W.; Wicks, Z.W., III. Determinants of elephant distribution at Nazinga Game Ranch, Burkina Faso. Pachyderm 2007, 42, 70–80. [Google Scholar]
- Kristensen, M.; Balslev, H. Perceptions, use and availability of woody plants among the Gourounsi in Burkina Faso. Biodivers. Conserv. 2003, 12, 1715–1739. [Google Scholar] [CrossRef]
- Hema, E.M.; Barnes, R.F.W.; Guenda, W. Distribution of savannah elephants (Loxodonta africana africana Blumenbach 1797) within Nazinga game ranch, Southern Burkina Faso. Afr. J. Ecol. 2011, 49, 141–149. [Google Scholar] [CrossRef]
- Dekker, A. Carte de Paysage de la Région du Ranch de Gibier de Nazinga, Burkina Faso; PNUD/FAO, DP/BKF/82/008; Adefa: Buenos Aires, Argentina, 1985. [Google Scholar]
- Tia, L. Modeling of Vegetation Dynamics and Its Contribution to the Water Balance in Semi-Arid Lands of West Africa; Rheinische Friedrich-Wilhelms-Universität Bonn: Bonn, Germany, 2007; p. 174. [Google Scholar]
- Grote, R.; Lehmann, E.; Brümmer, C.; Brüggemann, N.; Szarzynski, J.; Kunstmann, H. Modelling and observation of biosphere-atmosphere interactions in natural savannah in Burkina Faso, West Africa. Phys. Chem. Earth 2009, 34, 251–260. [Google Scholar] [CrossRef]
- Schmidt, M.; Mbayngone, E.; Bachmann, Y.; Hahn, K.; Zizka, G.; Thiombiano, A. The impact of land use on species composition and habitat structure in Sudanian savannas—A modelling study in protected areas and agricultural lands of southeastern Burkina Faso. Candollea 2016, 71, 265–274. [Google Scholar] [CrossRef]
- Dimobe, K.; Ouédraogo, A.; Soma, S.; Goetze, D.; Porembski, S.; Thiombiano, A. Identification of driving factors of land degradation and deforestation in the Wildlife Reserve of Bontioli (Burkina Faso, West Africa). Glob. Ecol. Conserv. 2015, 4, 559–571. [Google Scholar] [CrossRef]
- Fournier-Mary, A. Phenologie, Croissance et Production Vegetales Dans Quelques Savanes D’afrique de L’ouest. Variation Selon un Gradient de Secheresse. Available online: http://horizon.documentation.ird.fr/exl-doc/pleins_textes/pleins_textes_2/etudes_theses/36403.pdf (accessed on 14 August 2016).
- Kabore, E.; Sambare, O.; Ouedraogo, A.; Thiombiano, A. Diversité et structure des cordons ripicoles le long de la sirba (Nord-Est du Burkina Faso). Int. J. Biol. Chem. Sci. 2013, 7, 1929–1950. [Google Scholar] [CrossRef]
- Savadogo, P.; Tigabu, M.; Sawadogo, L.; Odén, P.C. Woody species composition, structure and diversity of vegetation patches of a Sudanian savanna in Burkina Faso. Bois For. Trop. 2007, 294, 5–20. [Google Scholar]
- Holdaway, R.J.; McNeill, S.J.; Mason, N.W.; Carswell, F.E. Propagating uncertainty in plot-based estimates of forest carbon stock and carbon stock change. Ecosystems 2014, 17, 627–640. [Google Scholar] [CrossRef]
- Cienciala, E.; Centeio, A.; Blazek, P.; Soares, M.C.G.; Russ, R. Estimation of stem and tree level biomass models for Prosopis juliflora/pallida applicable to multi-stemmed tree species. Trees 2013, 27, 1061–1070. [Google Scholar] [CrossRef]
- Chave, J.; Andalo, C.; Brown, S.; Cairns, M.A.; Chambers, J.Q.; Eamus, D.; Fölster, H.; Fromard, F.; Higuchi, N.; Kira, T.; et al. Tree allometry and improved estimation of carbon stocks and balance in tropical forests. Oecologia 2005, 145, 87–99. [Google Scholar] [CrossRef] [PubMed]
- Chave, J.; Réjou-Méchain, M.; Búrquez, A.; Chidumayo, E.; Colgan, M.S.; Delitti, W.B.C.; Duque, A.; Eid, T.; Fearnside, P.M.; Goodman, R.C.; et al. Improved allometric models to estimate the aboveground biomass of tropical trees. Glob. Chang. Biol. 2014, 20, 3177–3190. [Google Scholar] [CrossRef] [PubMed]
- Tran, D.B.; Dargusch, P.; Herbohn, J.; Moss, P. Interventions to better manage the carbon stocks in australian melaleuca forests. Land Use Policy 2013, 35, 417–420. [Google Scholar] [CrossRef]
- Iles, K.; Wilson, L.J. A further neglected mean. Math. Teach. 1977, 70, 27–28. [Google Scholar]
- Medawatte, A.W.; Amarasinghe, J.; Iqbal, M.C.; Ranwala, S.M. Restoration of a degraded dry forest using nurse trees at Dambulla, Sri Lanka. Conserv. Evid. 2014, 11, 16–19. [Google Scholar]
- Mori, S.A.; Boom, B.M.; de Carvalino, A.M. Ecological importance of Myrtaceae in an eastern Brazilian wet forest. Biotropica 1983, 15, 68–70. [Google Scholar] [CrossRef]
- R Core Team. R: A Language and Environment for Statistical Computing; R Foundation for Statistical Computing: Vienna, Austria, 2014. [Google Scholar]
- Paré, S.; Tigabu, M.; Savadogo, P.; Odén, P.C.; Ouadba, J.M. Does designation of protected areas ensure conservation of tree diversity in the Sudanian dry forest of Burkina Faso? Afr. J. Ecol. 2010, 48, 347–360. [Google Scholar] [CrossRef]
- Ribeiro, N.S.; Matos, C.N.; Moura, I.R.; Washington-Allen, R.A.; Ribeiro, A.I. Monitoring vegetation dynamics and carbon stock density in miombo woodlands. Carbon Balanc. Manag. 2013, 8, 11. [Google Scholar] [CrossRef] [PubMed]
- Traoré, L.; Ouédraogo, A.; Thiombiano, A. To what extent do protected areas determine the conservation of native flora? A case study in the Sudanian zone of Burkina Faso. ISRN Bot. 2012, 2012. [Google Scholar] [CrossRef]
- Lewis, S.L.; Lloyd, J.; Sitch, S.; Mitchard, E.T.A.; Laurance, W.F. Changing Ecology of Tropical Forests: Evidence and Drivers. Annu. Rev. Ecol. Evol. Syst. 2009, 40, 529–549. [Google Scholar] [CrossRef]
- Food and Agriculture Organization (FAO). Global Forest Resources Assessment 2010: Main Report; FAO: Rome, Italy, 2010; p. 340. [Google Scholar]
- Sawadogo, L.; Savadogo, P.; Tiveau, D.; Dayamba, S.D.; Zida, D.; Nouvellet, Y.; Oden, P.C.; Guinko, S. Allometric prediction of above-ground biomass of eleven woody tree species in the Sudanian savanna-woodland of West Africa. J. For. Res. 2010, 21, 475–481. [Google Scholar] [CrossRef]
- Fearnside, P.M. Wood density for estimating forest biomass in Brazilian Amazonia. For. Ecol. Manag. 1997, 90, 59–87. [Google Scholar] [CrossRef]
- Karlson, M.; Ostwald, M.; Reese, H.; Sanou, J.; Tankoano, B.; Mattsson, E. Mapping tree canopy cover and aboveground biomass in Sudano-Sahelian woodlands using Landsat 8 and Random Forest. Remote Sens. 2015, 7, 10017–10041. [Google Scholar] [CrossRef]
- Dayamba, S.D.; Djoudi, H.; Zida, M.; Sawadogo, L.; Verchot, L. Biodiversity and carbon stocks in different land use types in the Sudanian Zone of Burkina Faso, West Africa. Agric. Ecosyst. Environ. 2016, 216, 61–72. [Google Scholar] [CrossRef]
- Dimobe, K.; Wala, K.; Dourma, M.; Kiki, M.; Woegan, Y.; Folega, F.; Batawila, K.; Akpagana, K. Disturbance and population structure of plant communities in the wildlife reserve of Oti-Mandouri in Togo (West Africa). Annu. Res. Rev. Biol. 2014, 4, 2501–2516. [Google Scholar]
- Bognounou, F.; Thiombiano, A.; Savadogo, P.; Issaka Boussim, J.; Christer Oden, P.; Guinko, S. Woody vegetation structure and composition at four sites along a latitudinal gradient in Western Burkina Faso. Bois For. Trop. 2009, 22, 29–44. [Google Scholar]
- Porembski, S. Phytodiversity and structure of the Comoé river gallery forest (NE Ivory Coast). In Life Forms and Dynamics in Tropical Forests; Borntraeger: Berlin, Germany, 2001; pp. 1–10. [Google Scholar]
- Arbab, A.H. Review on Anogeissus leiocarpus a potent African traditional drug. Int. J. Res. Pharm. Chem. 2014, 4, 496–500. [Google Scholar]
- The United Nations Framework Convention on Climate Change (UNFCCC). UNFCCC Local Data for Wood Densities: Reference No. 16 a; UNFCCC: Bonn, Germany, 1992. [Google Scholar]
- Ogunwusi, A.A.; Onwualu, A.P.; Ogunsanwo, O.Y. Comparative Analysis of Wood Properties of Afzelia Africana and Anogeissus leiocarpus Growing in Nigeria. Chem. Mater. Res. 2013, 3, 8–13. [Google Scholar]
- Agbontalor, E.A. Influence of specific gravity on wood species selection for agroforestry in some Local Government Areas of Oyo State, Nigeria. J. Agric. Res. 2008, 3, 134–139. [Google Scholar]
- Nyg, R.; Elfving, B. Stem basic density and bark proportion of 45 woody species in young savanna coppice forests in Burkina Faso. Ann. For. Sci. 2000, 57, 143–153. [Google Scholar] [CrossRef]
- Brazier, J.D.; Goldsmith, B.; Carter, D.T. The Indigenous Timbers of Zimbabwe. Zimbabwe Bulletin of Forestry Research No 9; JSTOR: Salisbury, Zimbabwe, 1983. [Google Scholar]
- Von Maydell, H.J. Arbres et Arbustes du Sahel: Leurs Caracteristiques et Leurs Utilisations; Deutsche Gesellschaft fur Technische Zusammenarbeit (GTZ) GmbH: Eschborn, Germany, 1983. [Google Scholar]
- Rijsdijk, J.F.; Laming, P.B. Physical and Related Properties of 145 Timbers: Information for Practice; Kluwer Academic Publishers: Dordrecht, The Netherlands, 1994. [Google Scholar]
- Fontodji, J.K.; Tagba, M.S.; Akponikpe, P.B.I.; Adjonou, K.; Akossou, A.Y.J.; Akouehou, G.; Kokutse, A.D.; Nuto, Y.; Kokou, K. Diagnostic analysis of the techniques of carbonization inTogo (West Africa). Sci. J. Environ. Sci. 2013, 2, 106–117. [Google Scholar]
- Brown, S. Estimating Biomass and Biomass Change of Tropical Forests: A Primer; FAO Forestry Paper; Food and Agriculture Organization of the United Nations: Rome, Italy, 1997; Volume 134. [Google Scholar]
- Bolza, E.; Keating, W.G. African Timbers—The Properties, Uses and Characteristics of 700 Species; CSIRO: Melbourne, Australia, 1972. [Google Scholar]
- Louppe, D.; Oteng-Amoako, A.; Brink, M. Prota 7 (1): Timbers/Bois d’oeuvre 1; PROTA: Wageningen, The Netherlands, 2008. [Google Scholar]
- Takahashi, A. Compilation of Data on the Mechanical Properties of Foreign Woods; Shimane University: Matsue, Japan, 1978. [Google Scholar]
- Van der Vossen, H.A.M.; Mkamilo, G.S. Vegetable Oils of Tropical Africa, Conclusions and Recommendations Based on PROTA 14: “Vegetable Oils”; PROTA: Wageningen, The Netherlands, 2007. [Google Scholar]


| Sites | Vegetation Types | Total | |||
|---|---|---|---|---|---|
| Woodland Savanna | Tree Savanna | Gallery Forest | Shrub Savanna | ||
| Nazinga Game Ranch | |||||
| Mean DBH (cm) | 22.12 ± 6.47 | 12.02 ± 2.25 | 45.67 ± 10.51 | 9.36 ± 1.09 | 26.49 ± 15.44 |
| Mean tree height (m) | 9.38 ± 2.55 | 5.26 ± 0.50 | 9.41 ± 1.00 | 4.37 ± 1.27 | 7.11 ± 2.75 |
| Mean Density (trees·ha−1) | 160 ± 8.31 | 80.5 ± 7.52 | 73.75 ± 8.98 | 11.25 ± 1.62 | 325 ± 60.99 |
| Mean BA (m2·ha−1) | 0.96 ± 0.49 | 0.28 ± 0.10 | 4.09 ± 1.70 | 0.17 ± 0.04 | 1.37 ± 1.84 |
| Mean Carbon (Mg·C·ha−1) | 3.01 ± 1.82 | 0.50 ± 0.25 | 9.32 ± 3.71 | 0.24 ± 0.09 | 3.27 ± 4.22 |
| Mean AGBdry (Mg·ha−1) | 6.03 ± 3.64 | 1.00 ± 0.50 | 18.64 ± 7.42 | 0.49 ± 0.19 | 6.54 ± 8.41 |
| Bontioli Nature Reserve | |||||
| Mean DBH (cm) | 19.72 ± 4.24 | 12.94 ± 2.90 | 49.61 ± 23.00 | 13.66 ± 6.98 | 30.15 ± 18.19 |
| Mean tree height (m) | 9.17 ± 1.45 | 6.49 ± 0.40 | 9.52 ± 1.81 | 4.62 ± 1.99 | 7.45 ± 2.50 |
| Mean Density (trees·ha−1) | 145 ± 13.53 | 130 ± 10.98 | 61.25 ± 8.98 | 16.25 ± 3.25 | 352.5 ± 60.21 |
| Mean BA (m2·ha−1) | 1.05 ± 0.41 | 0.45 ± 0.27 | 5.25 ± 5.26 | 0.36 ± 0.41 | 1.78 ± 2.33 |
| Mean Carbon (Mg·C·ha−1) | 3.13 ± 1.14 | 0.98 ± 0.66 | 9.45 ± 9.66 | 0.67 ± 0.76 | 3.56 ± 3.41 |
| Mean AGBdry (Mg·ha −1) | 5.92 ± 2.74 | 1.42 ± 0.42 | 18.91 ± 19.33 | 1.24 ± 1.61 | 6.87 ± 11.63 |
| Both Sites Collectively * | |||||
| Mean DBH (cm) | 22.66 ± 5.43a | 13.73 ± 3.59a | 48.80 ± 16.45b | 11.74 ± 4.95a | 28.38 ± 16.70 |
| Mean tree height (m) | 9.28 ± 1.96a | 5.88 ± 0.77b | 9.47 ± 1.38a | 4.50 ± 1.58b | 7.28 ± 2.60 |
| Mean Density (trees·ha−1) | 305 ± 10.70ac | 210 ± 10.32a | 135 ± 8.57ad | 27.5 ± 2.48b | 677.5 ± 117.40 |
| Mean BA (m2·ha−1) | 1.00 ± 0.43a | 0.37 ± 0.21a | 4.67 ± 3.73b | 0.27 ± 0.29a | 1.58 ± 2.08 |
| Mean Carbon (Mg·C·ha−1) | 3.07 ± 1.43a | 0.74 ± 0.53a | 9.38 ± 6.90b | 0.45 ± 0.56a | 3.41 ± 4.98 |
| Mean AGBdry (Mg·ha−1) | 5.97 ± 3.04a | 1.21 ± 0.49a | 18.77 ± 13.80b | 0.86 ± 1.15a | 6.70 ± 10.02 |
© 2016 by the authors; licensee MDPI, Basel, Switzerland. This article is an open access article distributed under the terms and conditions of the Creative Commons Attribution (CC-BY) license (http://creativecommons.org/licenses/by/4.0/).
Share and Cite
Qasim, M.; Porembski, S.; Sattler, D.; Stein, K.; Thiombiano, A.; Lindner, A. Vegetation Structure and Carbon Stocks of Two Protected Areas within the South-Sudanian Savannas of Burkina Faso. Environments 2016, 3, 25. https://doi.org/10.3390/environments3040025
Qasim M, Porembski S, Sattler D, Stein K, Thiombiano A, Lindner A. Vegetation Structure and Carbon Stocks of Two Protected Areas within the South-Sudanian Savannas of Burkina Faso. Environments. 2016; 3(4):25. https://doi.org/10.3390/environments3040025
Chicago/Turabian StyleQasim, Mohammad, Stefan Porembski, Dietmar Sattler, Katharina Stein, Adjima Thiombiano, and André Lindner. 2016. "Vegetation Structure and Carbon Stocks of Two Protected Areas within the South-Sudanian Savannas of Burkina Faso" Environments 3, no. 4: 25. https://doi.org/10.3390/environments3040025
APA StyleQasim, M., Porembski, S., Sattler, D., Stein, K., Thiombiano, A., & Lindner, A. (2016). Vegetation Structure and Carbon Stocks of Two Protected Areas within the South-Sudanian Savannas of Burkina Faso. Environments, 3(4), 25. https://doi.org/10.3390/environments3040025