Green Economy Modelling of Ecosystem Services along the “Road to Dawei”
Abstract
:1. Introduction
The “Road to Dawei” Case Study
2. Green Economy and Development Planning
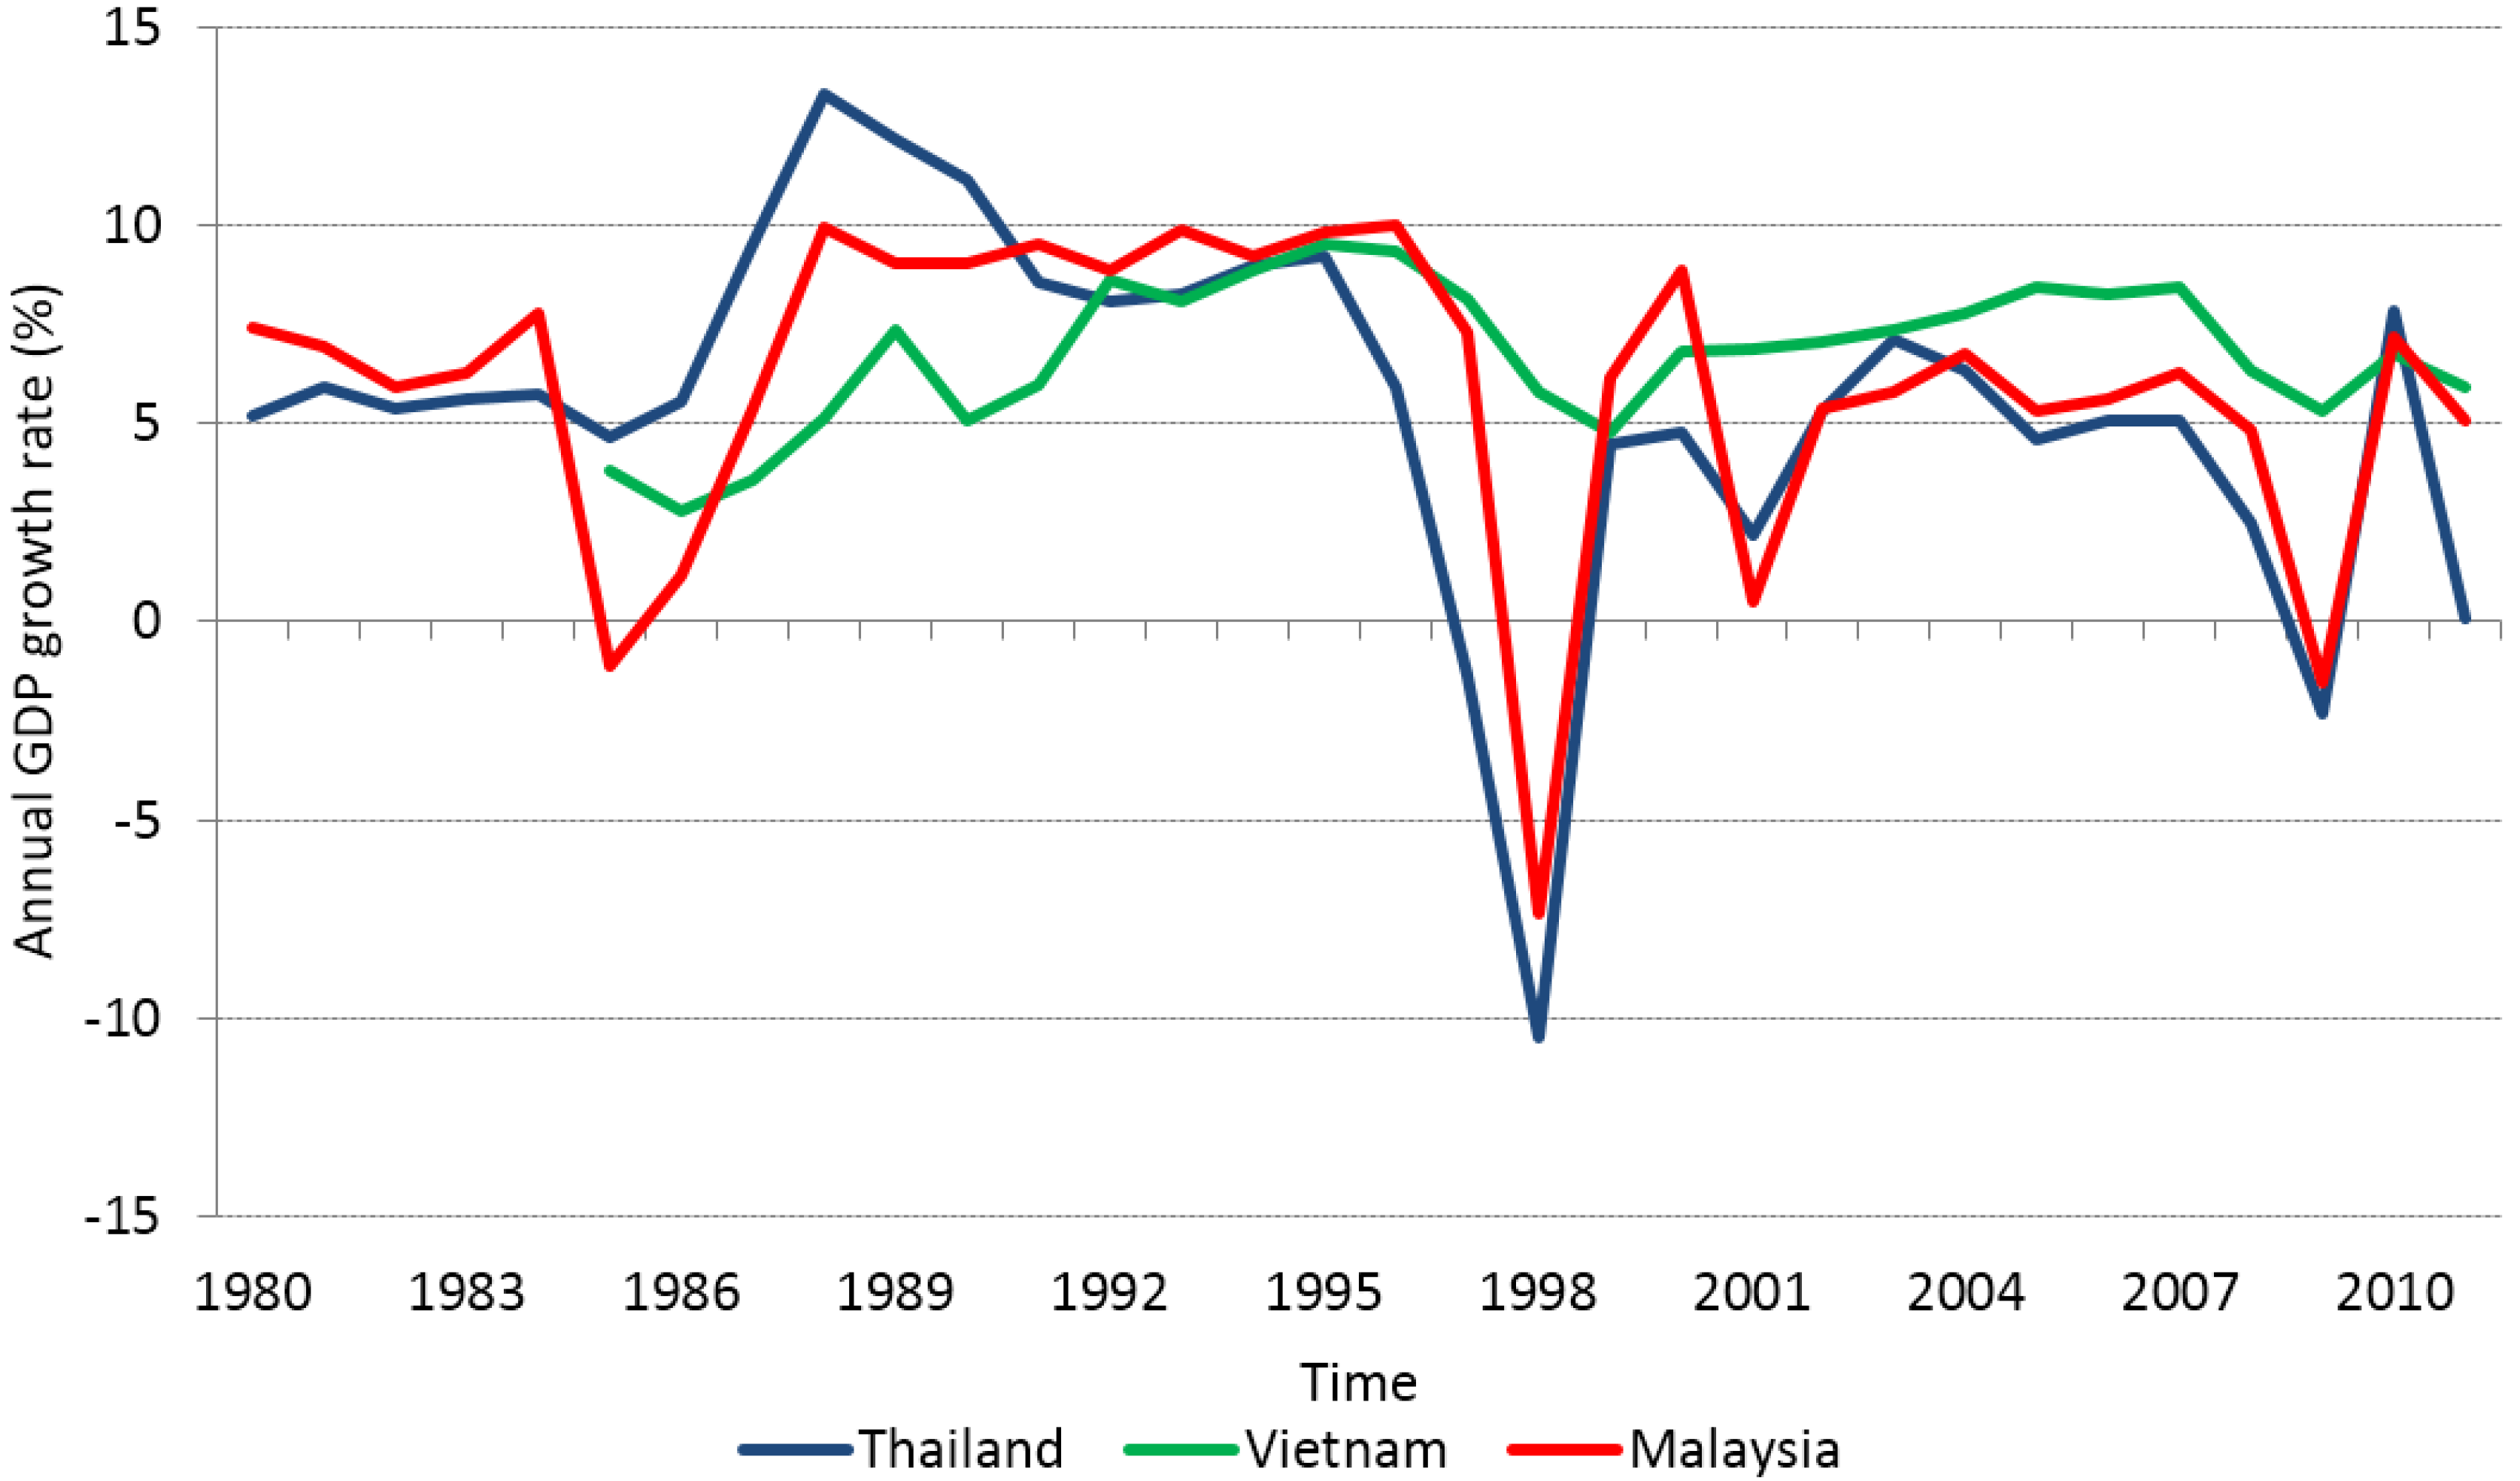
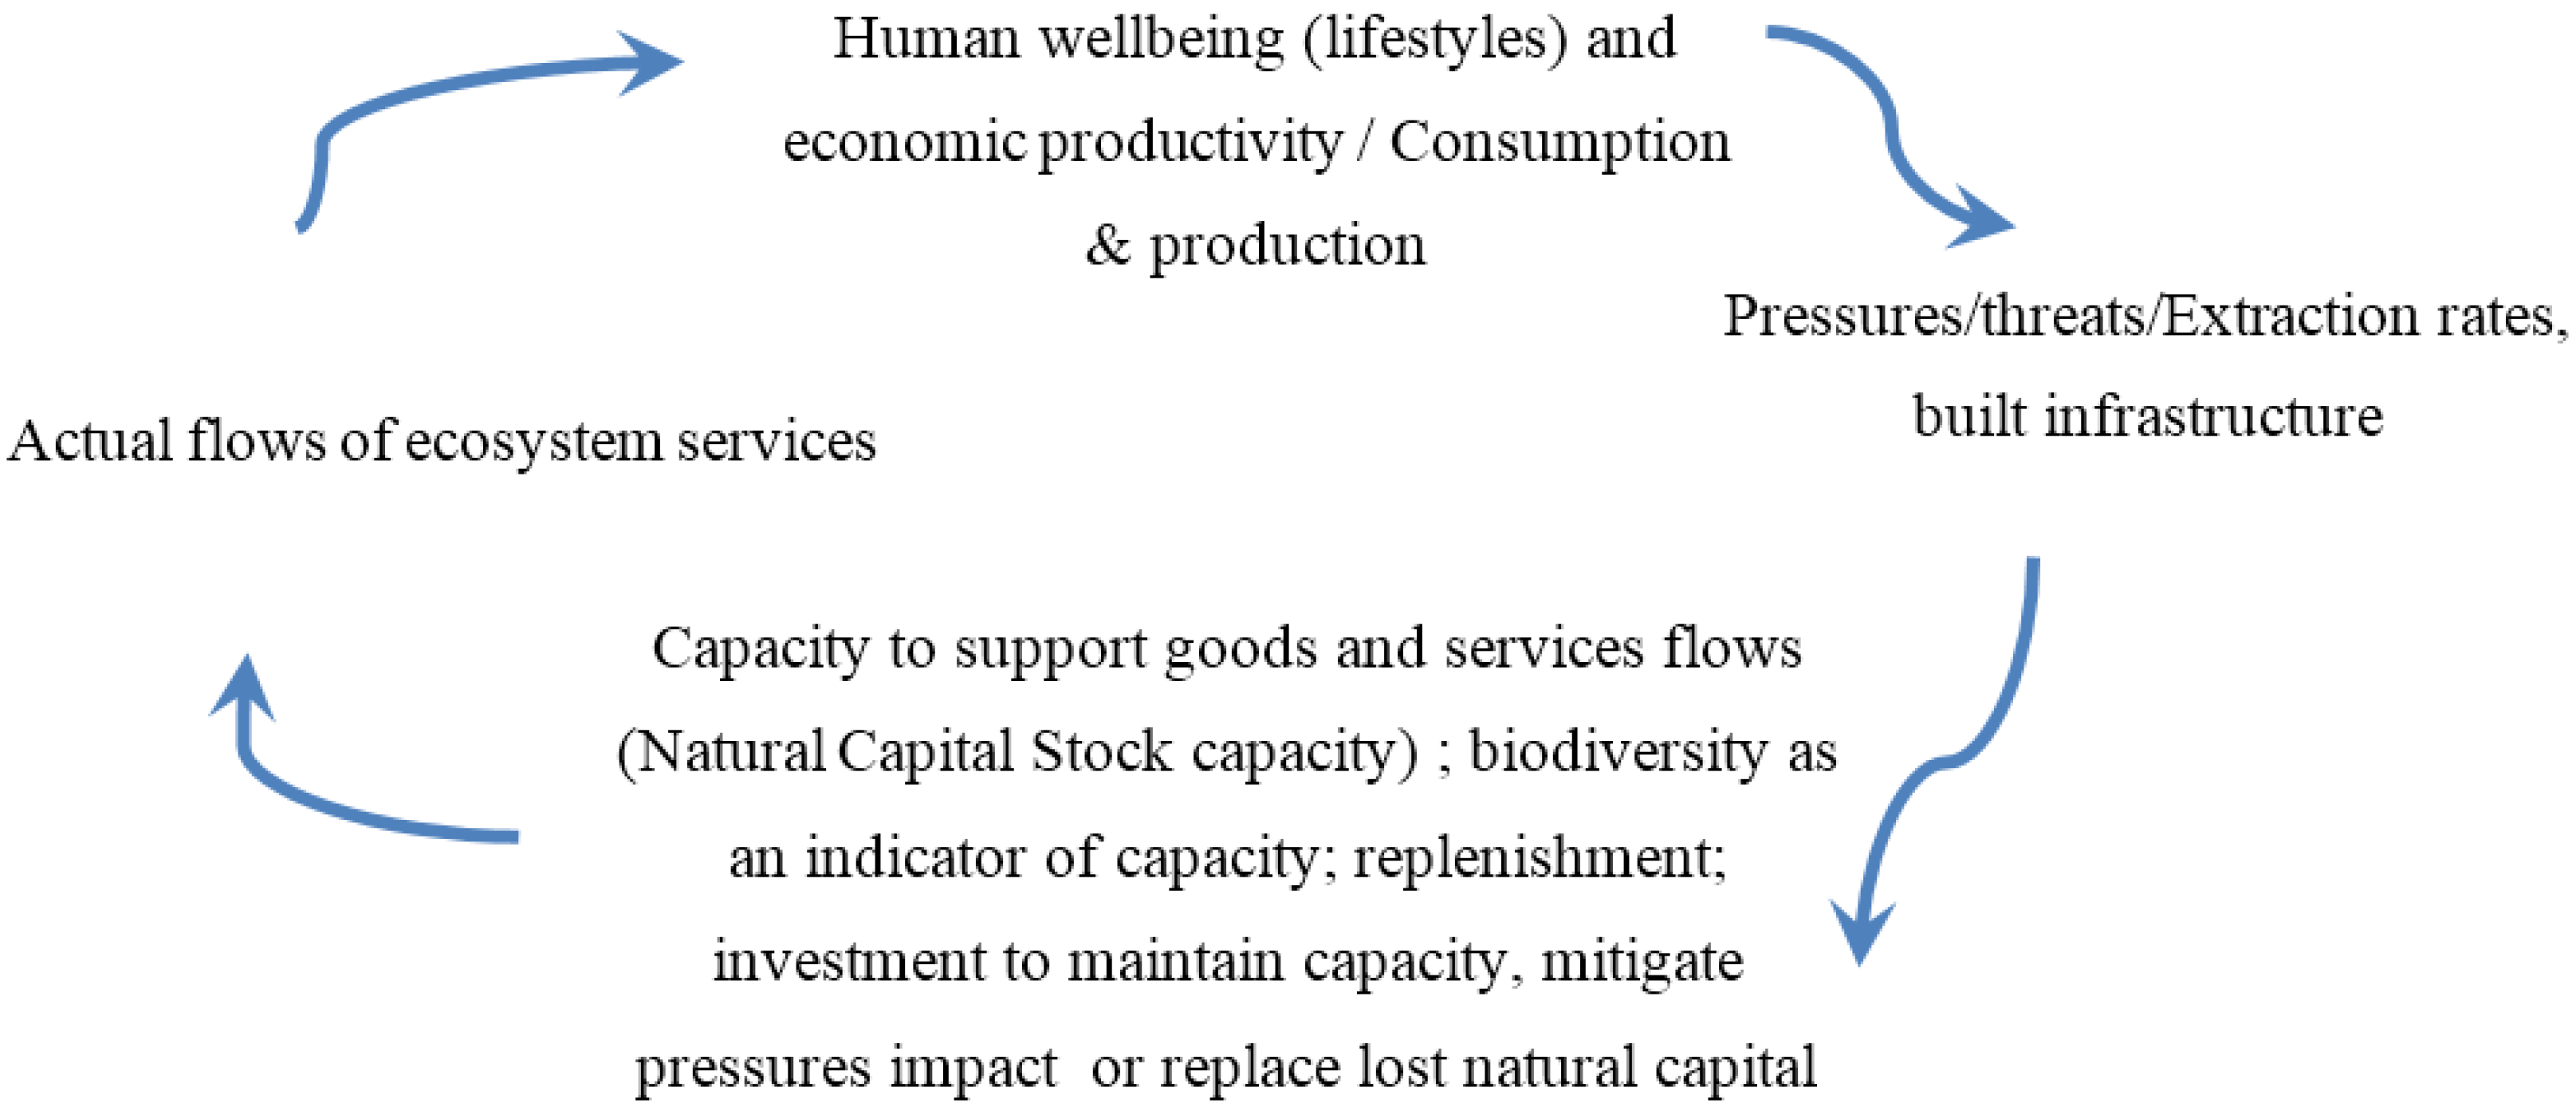
2.1. Beyond the Silo Mentality
2.2. Rationale for Green Economy Interventions
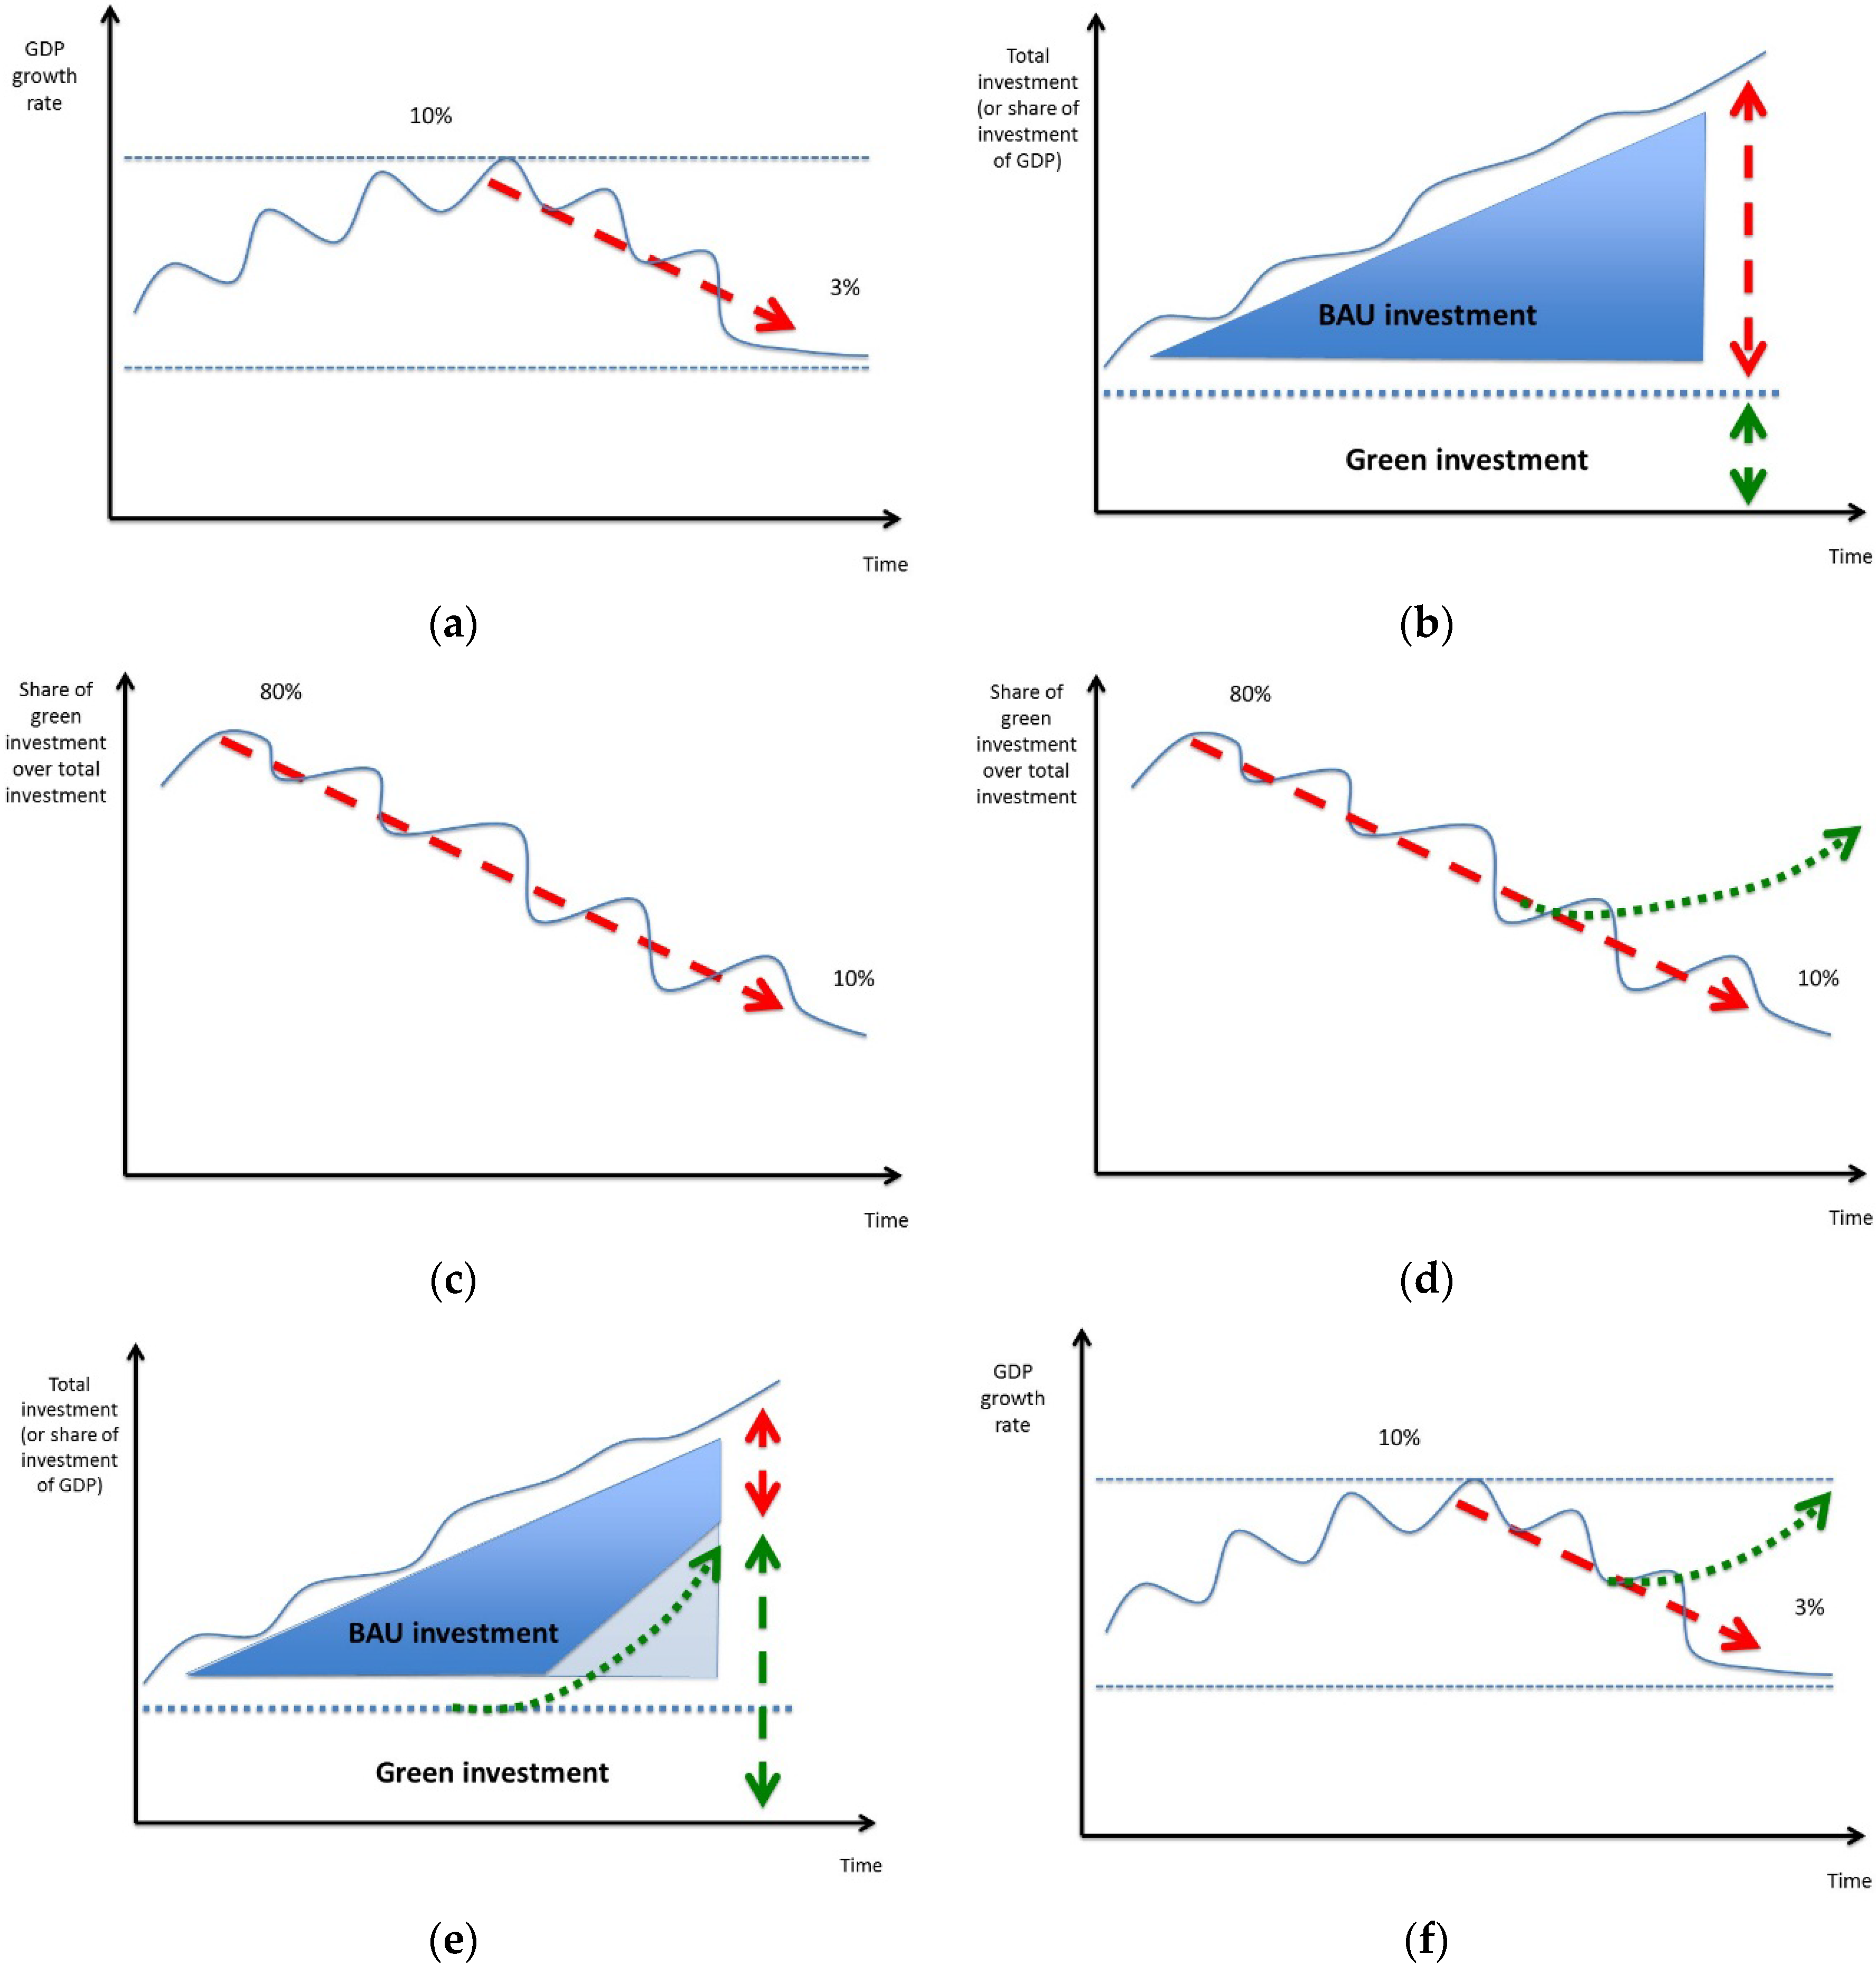
- (a)
- GDP growth declines, in part due to the increasing cost of environmental externalities and degradation in natural capital.
- (b)
- To offset the decline in GDP growth total investment needs to increase over time in a BAU scenario, but typically the portion of green investment remains near constant or even declines.
- (c)
- As natural capital degradation continues, the BAU investments increase and so do externalities and costs. At the same time, the share of green over total investments declines, reflecting an underinvestment in natural capital maintenance.
- (d,e)
- Green economy and green growth advocate for boosting the share of green investment as a share of total investment to compensate for historical underinvestment in natural capital, or as a means to “green” growth trajectories of emerging economies.
- (f)
- The expected outcome of such green investment is an additional boost to GDP—or “green growth” driven by additional benefits and especially by avoided costs—whereas, under BAU scenarios, real growth rates are declining.
2.3. Green Economy Planning
- The establishment of sustainable forest management (SFM) criteria and indicators in conjunction with investments in the reforestation of degraded and abandoned land.
- The development of organic agriculture, with the aim to increase food production, employment and income, while lowering land requirements and preserving natural resources and biodiversity through the use of ecological farming practices.
3. Materials and Methods
3.1. The Integrated Planning for Sustainability (IPS) Model
- Spatial planning tools (e.g., Marxan): Used to plot out optimal physical placement of economic activities, human settlements etc., but often without reference to what this means for socioeconomic effects or monetary valuation of loss/gain in natural capital assets. They are often static assessments that do not “speak to” decision-makers outside of land use/conservation planners.
- Non-market environmental valuation methods (e.g., InVEST): are used to value the external costs/benefits of losing/maintaining ecosystems and their services. Depending on the specific method applied, natural capital valuation illustrates a certain dimension of economic impacts from changes in natural capital. However, producing a dollar figure to represent nature’s value that stand alone and are not related to priorities for policymakers means valuation results often remain on the fringe of economic decision-making.
- System Dynamics macroeconomic models (e.g., Green Economy Model): are used to project growth in GDP, trade trends and inform public policy. The understanding of economic growth informing those models is largely based on the neoclassical growth model and analysis of historic development paths; neither of which account for environmental costs and the impacts of lost stocks of natural assets in the conventional models used.
3.2. Analyzing Cross-Sectoral Dynamics with the Green Economy Model (GEM), in the IPS Framework
3.3. Model Structure, Customization of IPS to the “Road to Dawei”
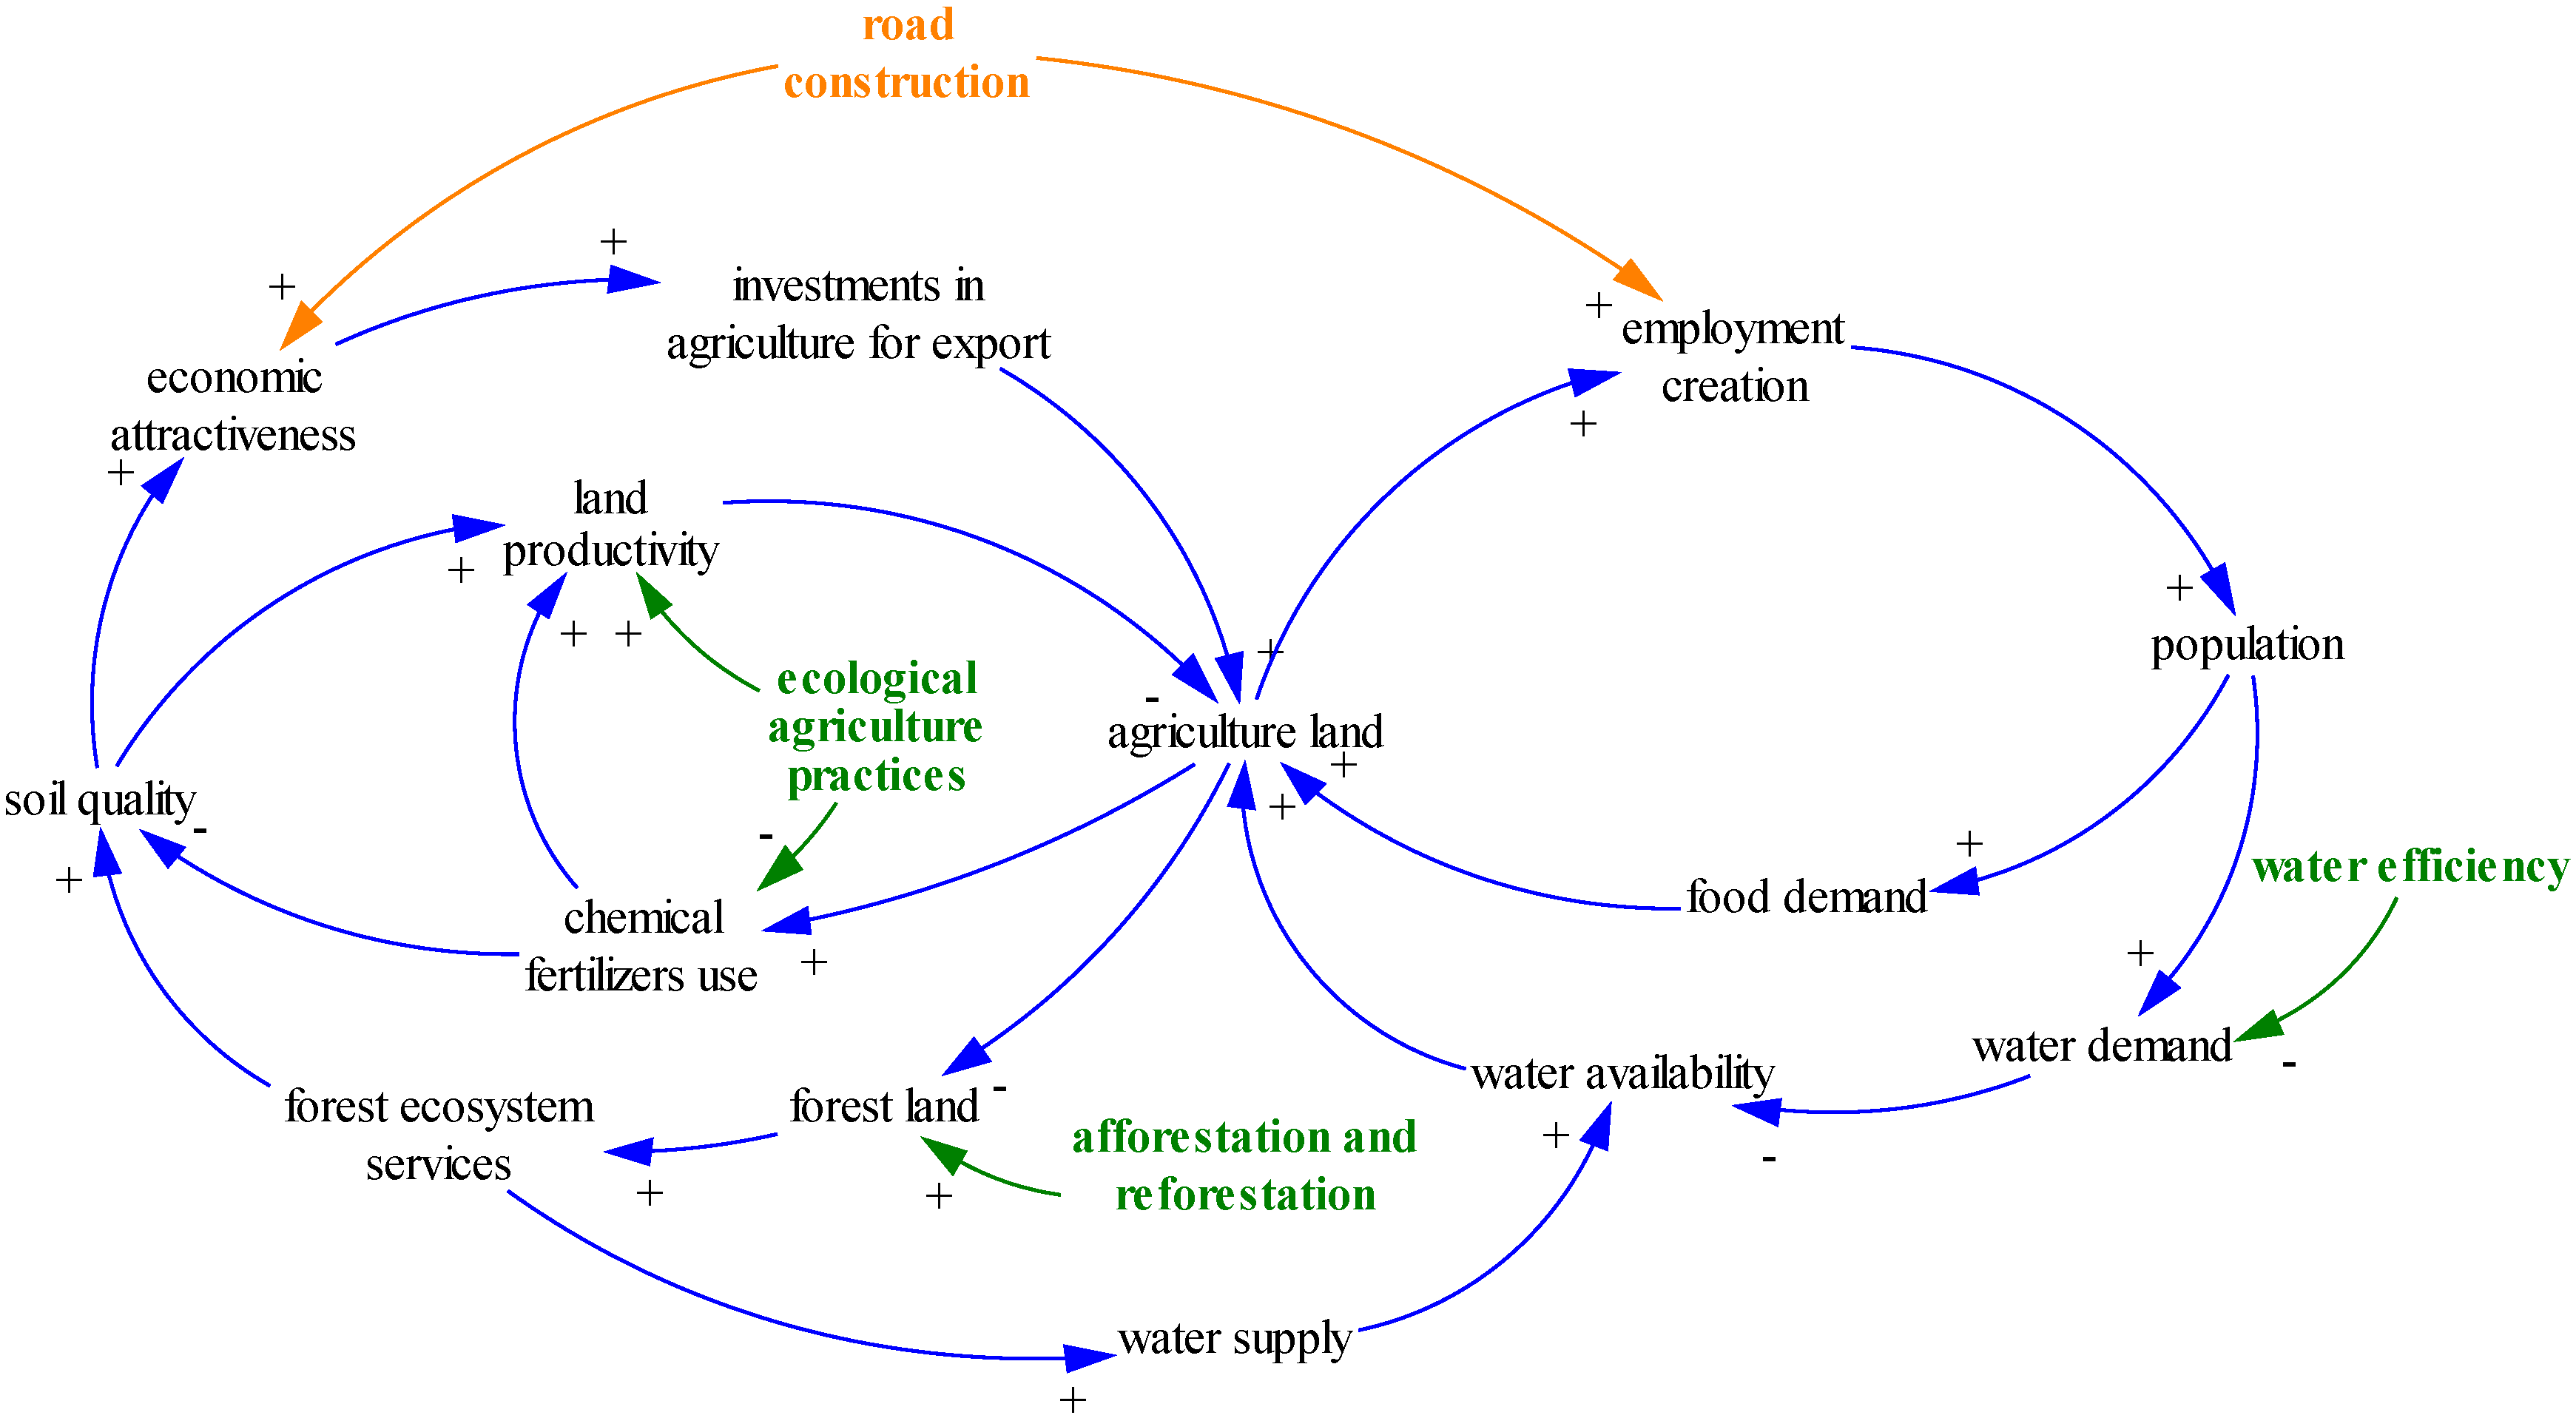
- Social dynamics: Structural changes in local populations are also influenced by the construction of the road, since the need for additional manpower for agriculture and construction works is likely to trigger a reduction in outmigration and growing immigration. On the other hand, immigration and population growth lead to an increase in the demand for urban areas and agricultural land for domestic food production.
- Agricultural practices: A key environmental aspect considered in the model is the impact of unsustainable agricultural practices, such as the intensive use of chemical fertilizers, on soil quality. A green economy investment in organic fertilizers and the development of ecological agriculture can be activated in the model to project impacts on soil quality, agricultural production, and employment.
- Natural capital stocks: The land needed for the construction of the road is assumed to be primarily obtained through deforestation, thereby reducing forestland. Moreover, enhanced transport infrastructure has a positive effect on the economic attractiveness of the area, particularly for the cultivation and export of agricultural products. This produces a further increase in deforestation for the purposes of agricultural production.
- Ecosystem services: The change in land uses will have an influence on the integrity of natural systems in the locality. In particular, the model represents land use and water demand and supply dynamics in the area, among others. The model focuses on a number of key ecosystem services, which were selected based on an initial prioritization provided by local stakeholders and finally included in the model based on data availability:
- Water provisioning. The demand for water is strongly influenced by population and agricultural production.
- Water flow regulation. The availability of water is linked to the frequency and amount of precipitation and the quality of ecosystem services, including the role of forest in water flow regulation and flood prevention.
- Soil erosion (nutrient retention). The primary causes of loss of nutrient retention are deforestation and the use of chemical fertilizers and pesticides.
- Carbon sequestration. The role of forests for carbon capture and storage is represented in the model, as well as their impact on biodiversity. In particular, the forest area is positively influencing the carbon stock stored in biomass.
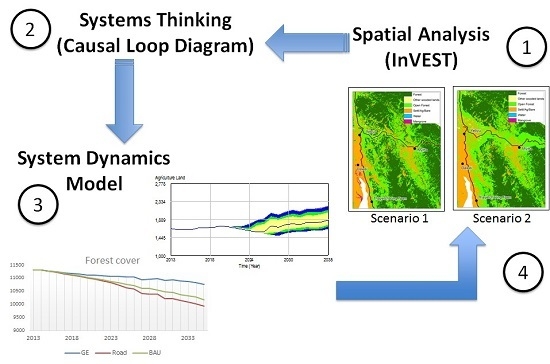
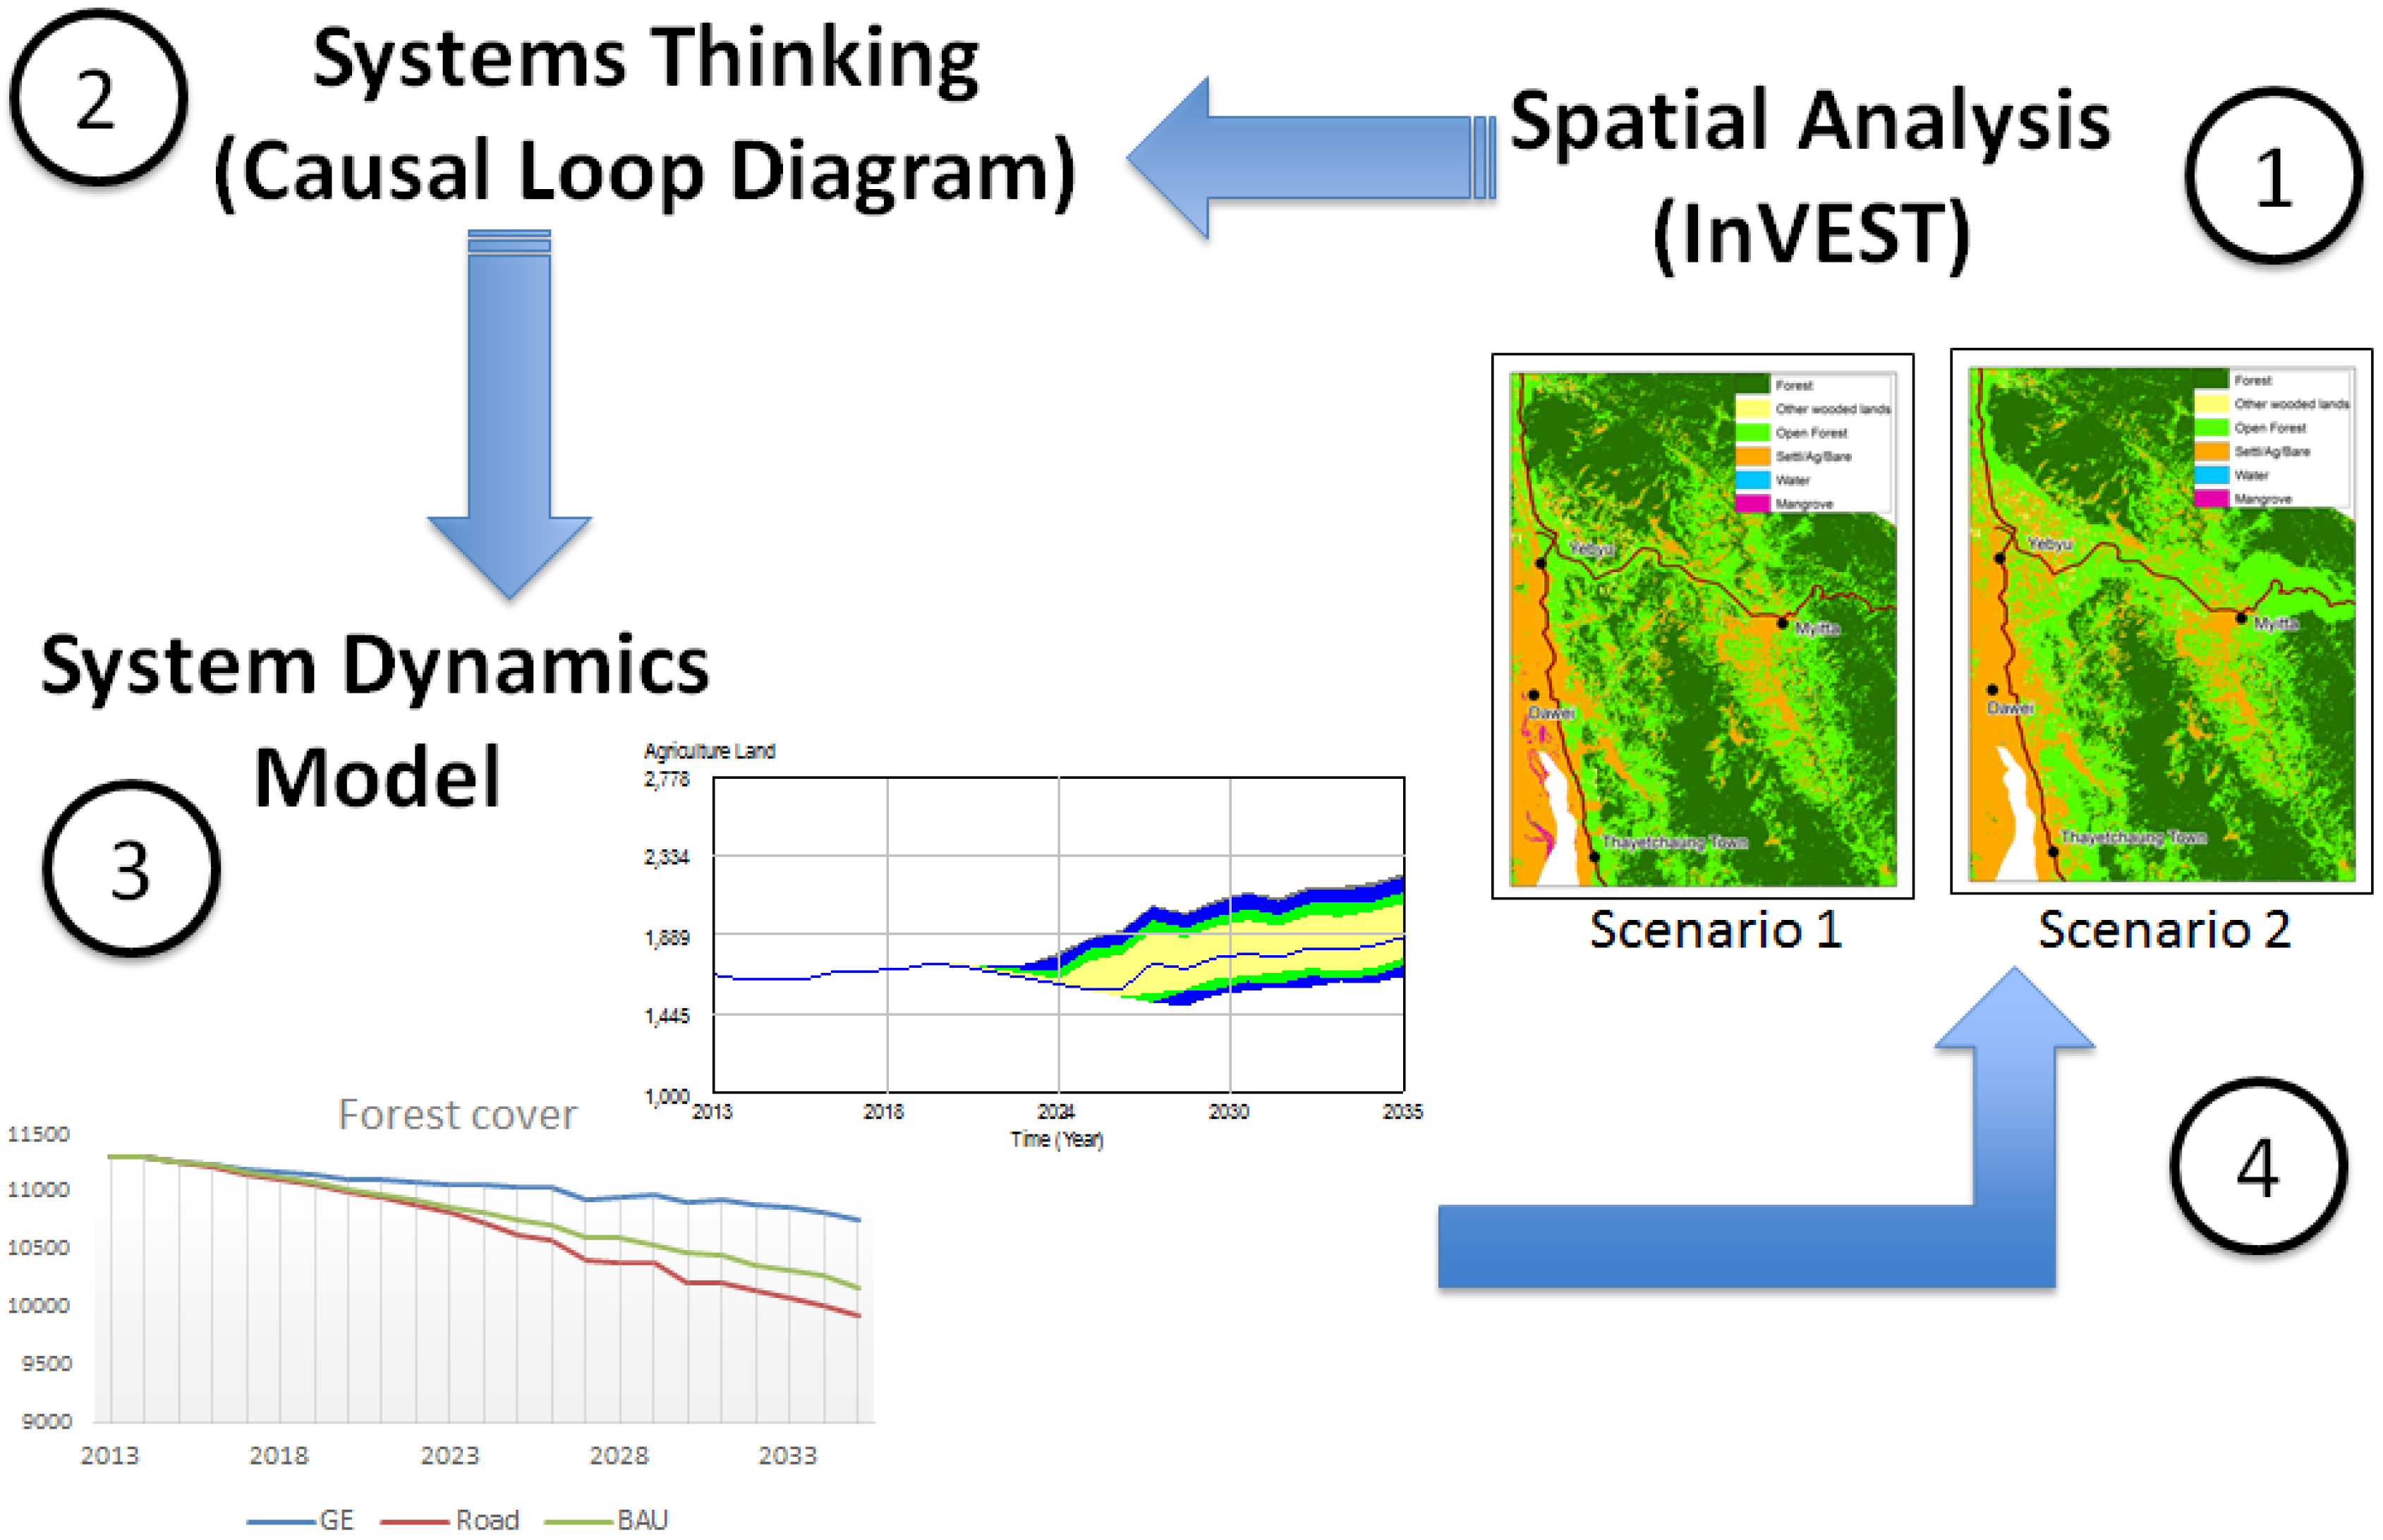
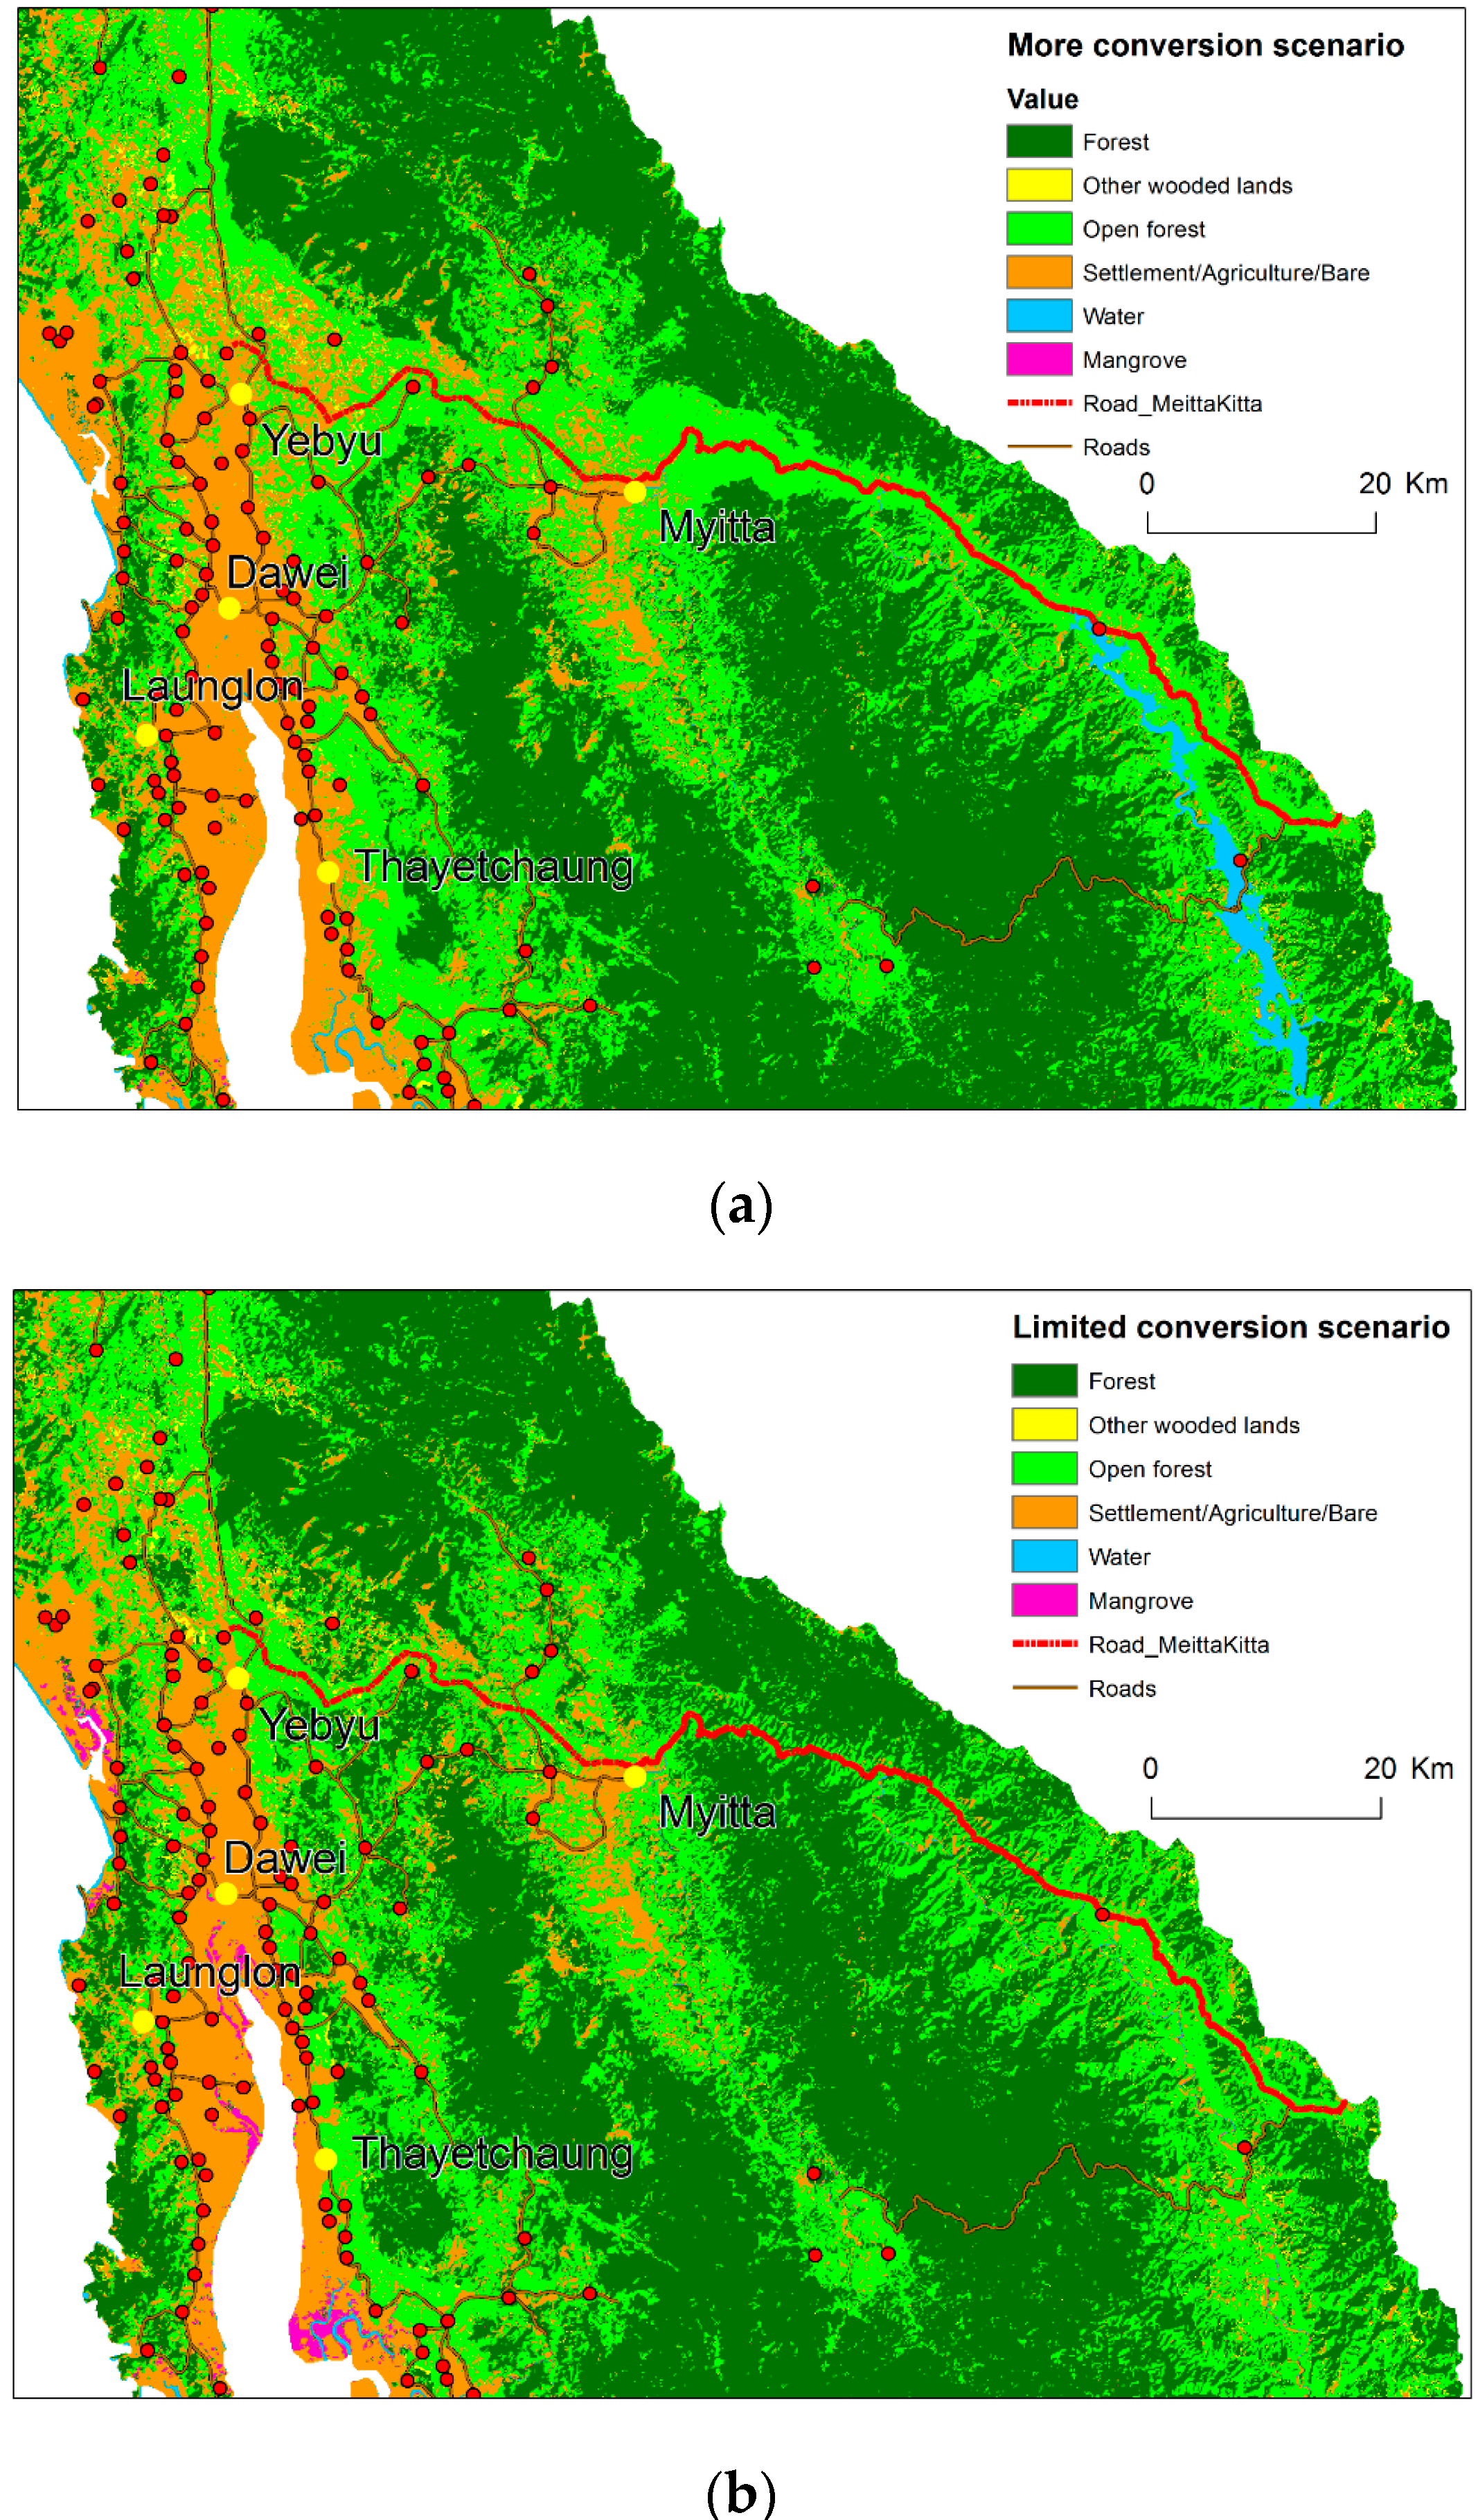
- InVEST, which generates spatial information and estimates natural capital and ecosystem services is used as input for estimated changes in natural capital stocks, i.e., forest land cover change, and resultant estimates of changing values in key ecosystem services. This information coupled with socio-economic analysis is used to create the map of the system (or Causal Loop Diagram) to identify the main drivers and impacts of land use change in the region analysed.
- System Dynamics methods require an integrated mathematical model that incorporates the key drivers of change and impacts. This mathematical model is calibrated using the InVEST outputs, among others through validating the direction and magnitude of relationships between biophysical variables and ecosystem service variables, i.e., changes in surface water flow corresponding to hectares of forest lost as a result of road construction.
3.4. Assumptions and Scenarios
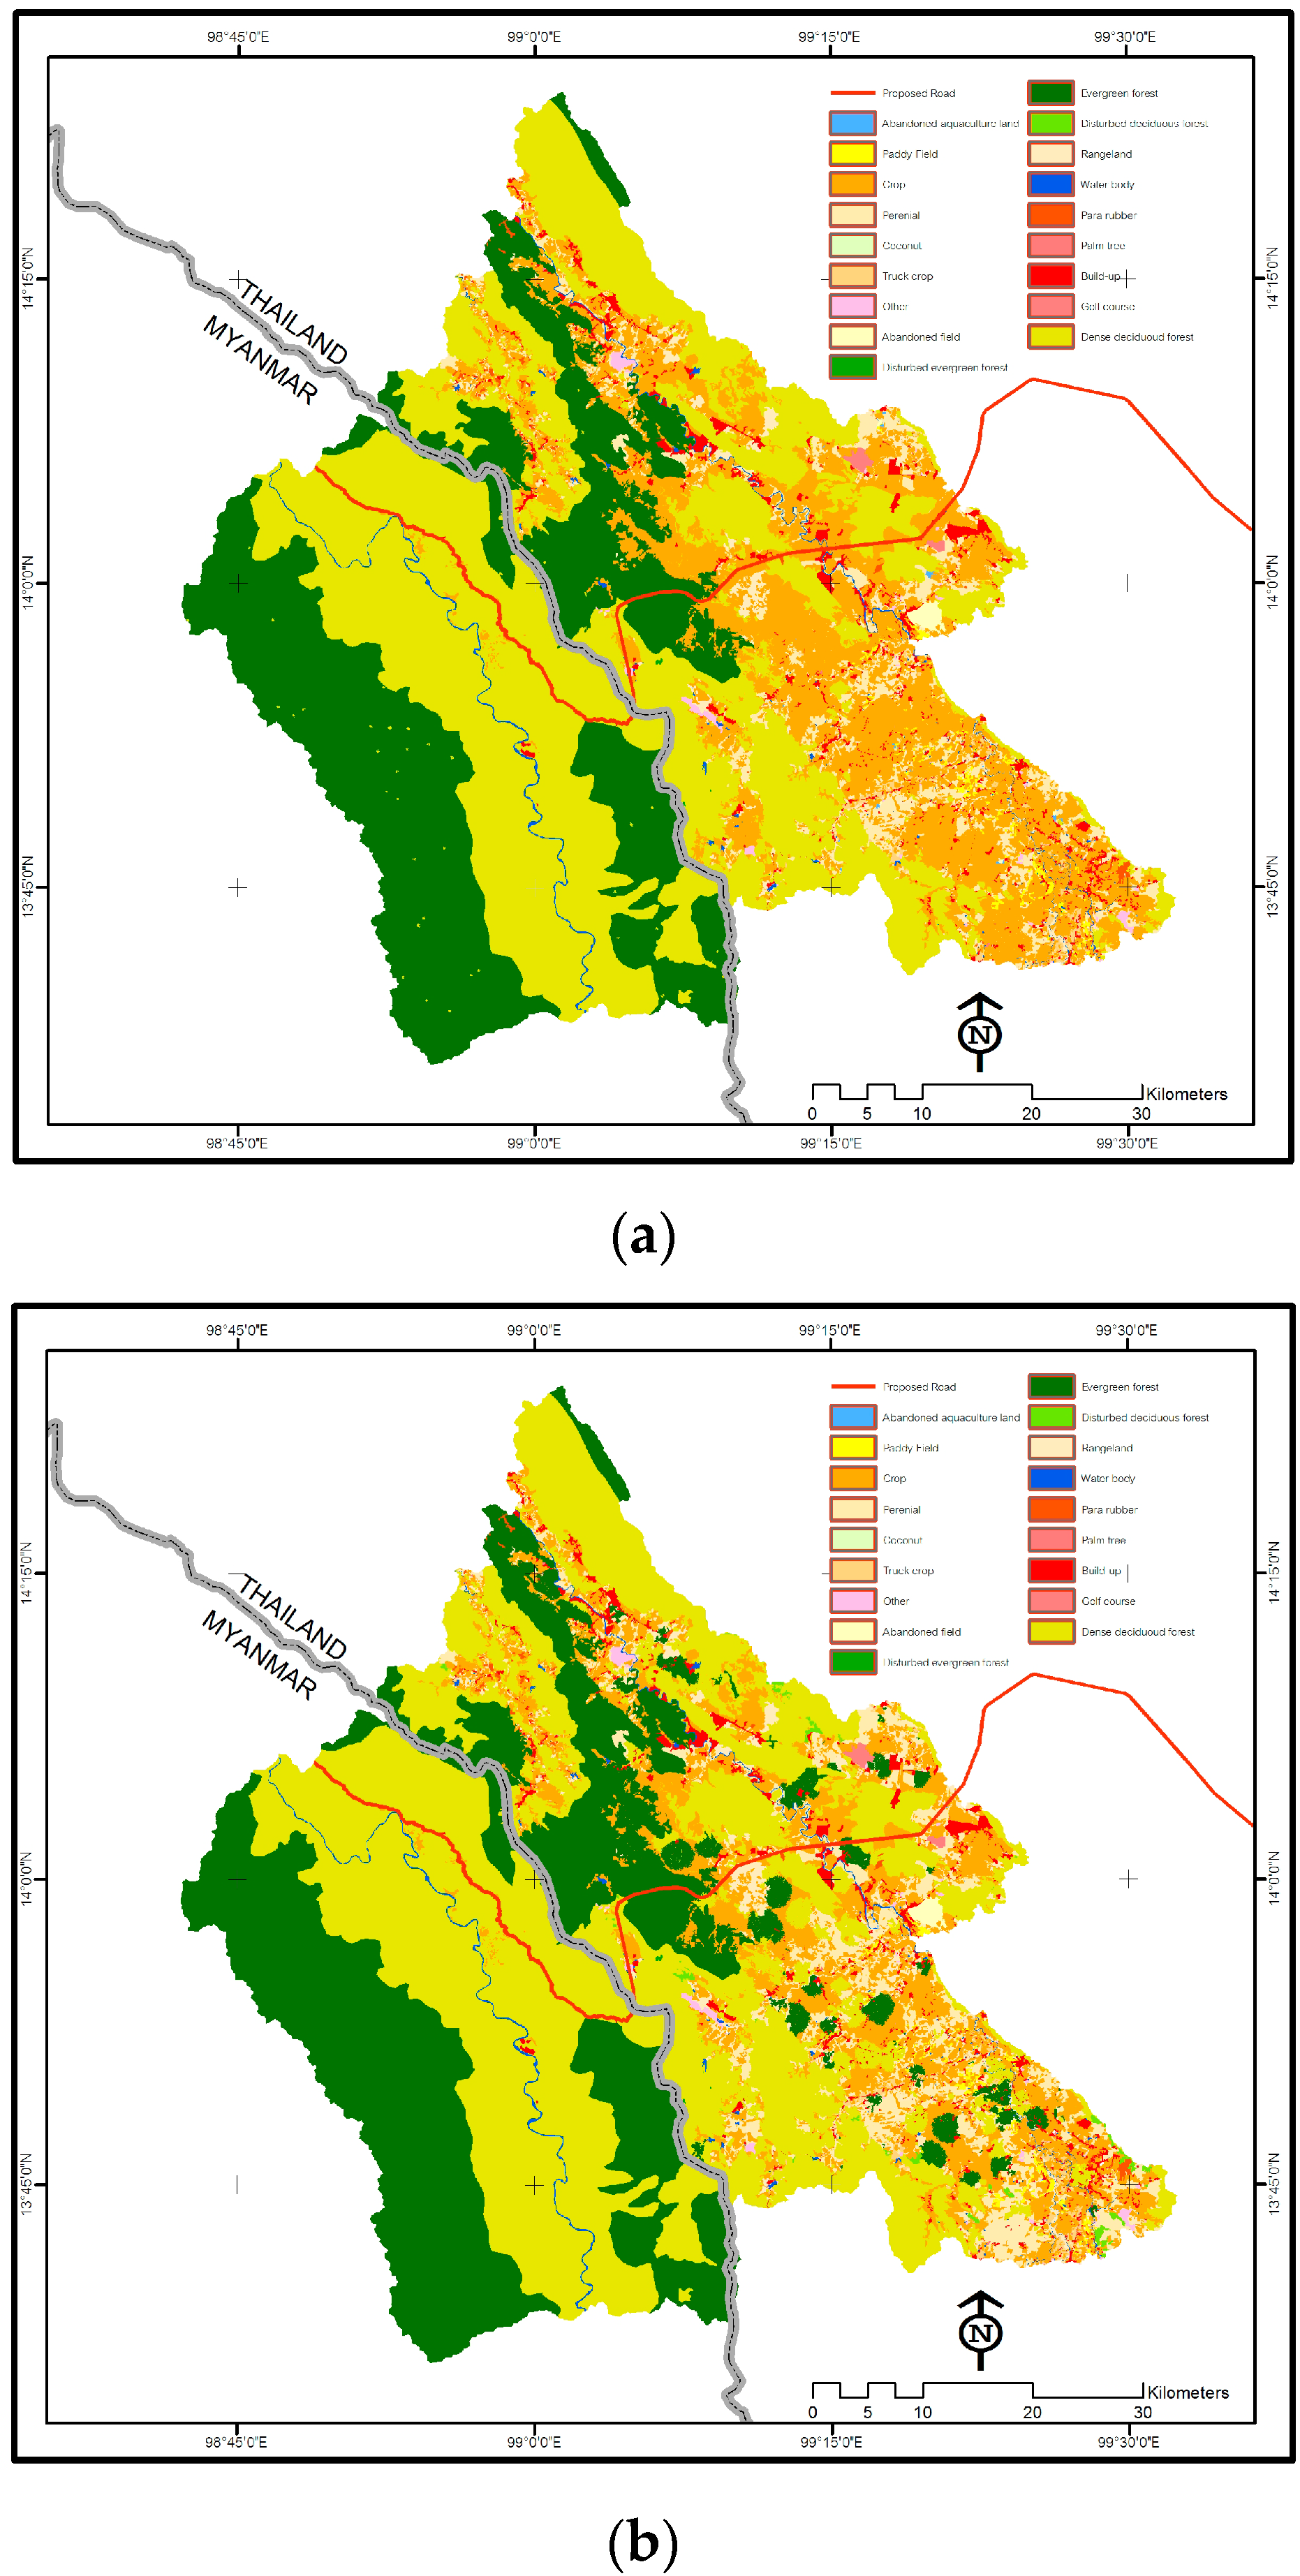
- A No-road scenario, under which the construction of the road is halted. Simulations under this scenario are used as a reference to evaluate projected positive and negative impacts of road construction on the economy, society and environment. The No-road scenario assumes the continuation of historical and present trends.
- A Road scenario case that assumes business as usual construction of the road between Kanchanaburi and the Thailand–Myanmar border (Thai side) and between the border and Dawei (Myanmar side), but no additional policies implemented to mitigate possible negative impacts on natural capital and ecosystems. Under this scenario, the full impact of road construction is projected on the economy, society and environment, considering the complex relations between land use changes, ecosystem services and socio-economic indicators.
- A Road scenario with Green Economy interventions that simulates additional interventions for the protection of natural capital, including investments in ecological agriculture practices to increase yield and reduce soil erosion; water efficiency in agriculture; and reforestation activities. Specifically, starting from 2019 in Thailand and from 2021 in Myanmar, immediately after the completion of the road, investments are introduced to expand organic agriculture land up to 40% of total agriculture land by 2030. Moreover, reforestation activities are initiated in 2015, making use of degraded agricultural land.
4. Results
4.1. Simulation Results: Thailand
4.1.1. “No Road” Scenario
4.1.2. “Road” Scenario
- Increase the economic attractiveness of the area. For example, national and foreign investments could be mobilized for the development of agricultural production for export. In fact, the InVEST analysis and a survey carried out with local farmers shows a likely transition to more intensive agriculture from perennial crop cultivation.
- Reverse the current demographic trends. Under the Road scenario, new employment opportunities are created in the Kanchanaburi area, especially related to road construction and maintenance work, as well as additional workforce needed to sustain the expansion of agricultural production and trade. The residential population would thus be encouraged to remain in the region and exploit new economic opportunities.
- Increase agricultural land and encourage deforestation. Under this scenario, total agriculture land in 2035 is expected to be 64% larger than under the No Road scenario. The expansion of agricultural land is assumed to be done entirely at the expenses of forestland.
- Increase pressure on natural resources and ecosystem services. In particular, the reduction of forest cover is expected to have a destabilizing impact on the regulation of the hydrological cycle, thereby increasing the occurrence of floods associated with heavy rainfall, eventually removing top soil (i.e., increasing soil erosion), increasing river siltation and sedimentation levels, and reducing surface water inflow. On the other hand, water consumption is expected to increase significantly, due to a growing demand for agriculture and residential purposes. As a result, the water balance, calculated as the difference between total water supply and total water demand, is expected to evolve from equilibrium in 2013 to a significant deficit in 2035.
- Trigger a number of simultaneous effects on agricultural productivity through land-use modifications. While the increase in farmers’ density is expected to have positive feedback on productivity, the environmental impacts produced by deforestation and unsustainable agricultural practices would threaten the sustainability of the sector in the medium to longer-term.
4.1.3. “Road” Scenario with Green Economy Interventions
- Population growth under both green economy scenarios is nearly equal to the one expected under the Road scenario. As result, the GE scenario retains the economic benefits of the road scenario.
- Degraded agriculture land is converted for both reforestation and urbanization purposes under the green economy scenario, while it is entirely used for satisfying urban land needs under the road scenario.
- Improved efficiency in the agriculture sector would reduce the expansion of agriculture land (Figure 6). As a result, total forestland would grow, reaching 11,693 km2 under the GE scenario in 2035, being 30.6% larger than in the Road scenario.
- Despite similar demographic growth projections in the GE and Road scenarios, the use of agriculture land is considerably reduced in the former after the introduction of ecological agriculture practices, due to positive impacts on crop yields and soil quality. More specifically, total agriculture land would reach 2863 km2 under the GE scenario in 2035, compared to 3934 under the Road scenario, corresponding to a 27.1% decrease.
- Another impact of green agriculture is the reduction of water use in organic farming. Projections show that total agriculture water demand in 2035 would be 38.2% in the GE scenario relative to the Road case. In addition to the reduction in agriculture water demand, the incidence of floods on river siltation would be reduced under green economy scenario, due to the preservation of forestland and its water cycle regulation service. As a result, the water balance would be radically different between green economy and Road scenarios, with a surplus in the GE case compared to a deficit in the Road simulation.
- Ecological agriculture practices generally require more labour force than conventional agriculture. Despite this positive impact on employment in the GE case, the total amount of people employed in the sector is projected to be larger under the Road scenario, due to the higher expansion of agricultural land relative to the GE scenario. On the other hand, this means that income per farmer would be higher in the GE case.
- Reforestation activities under green economy scenarios would increase the total amount of CO2 absorbed by forests, compared to both the Road and No Road scenarios. More specifically, the stock of carbon capture and sequestration would amount to 105.5 million tonnes of CO2 in the GE scenario in 2035, compared to 83.33 and 96.63 million tonnes of CO2 under the Road and No Road scenarios, respectively. Considering an approximate value of 123 Baht per ton of CO2, the carbon stored in forests could be worth 2.73 billion Baht in the GE scenarios relative to the Road case.
4.2. Simulation Results: Myanmar
4.2.1. “No Road” Scenario
4.2.2. “Road” Scenario
- Increase the economic attractiveness of the area. The increase of employment and population, on the account of road construction in the short term and of agriculture production in the medium and longer term, results in a net increase in agriculture and settlement land, and a net decrease in forestland.
- The urban area is expected to increase following the population trend, reaching close to 1000 km2 in 3025 from approximately 780 km2 in 2013. The land used for settlements is assumed to be converted entirely from degraded land, with no impact on forest cover.
- Forestland would be reduced under the road construction scenario with respect to the No road scenario, due to the impact of agricultural land expansion and land clearance for construction works. In 2035, the forest cover is expected to be 2.5% smaller compared to the No Road scenario, and 13% smaller relative to 2013, going from 11,306 km2 in 2013 to 9913 km2 in 2035.
- The modification of the natural landscape resulting from the construction of the road is projected to increase pressure on natural resources and ecosystem services. On the other hand, projections for the Road scenario show that agriculture productivity would still increase over time, and perform better than in the No Road scenario. This is due to again to a boost in labour productivity, with more farmers and a better organized (and possibly more mechanized) production process. On the other hand, the resilience to floods is projected to gradually decrease due to the reduced forest cover and soil erosion is expected to increase over time, due to both deforestation and the increased use of chemical fertilizers and pesticides.
4.2.3. “Road” Scenario with Green Economy Interventions
- Interventions in the agriculture sector increase productivity, by replacing chemical fertilizers with more sustainable inputs, lower soil erosion and the vulnerability to floods. Further, reforestation on degraded land helps maintain the stock of forest close to its initial value of 2013, reversing the trend observed both in the No Road and in the Road scenarios (Figure 7). Specifically, while forestland by 2035 is projected to decline by 2.4% relative to the No Road scenario, the GE case shows an increase of 6% and 8.6% relative to the No Road and Road simulations. This is also due to the contribution of reforestation, amounting to the conversion of approximately 25 km2 of land, from degraded to reforest. Overall, forestland is projected to reach 10,762 km2 in the GE case by 2035, against 9913 km2 and 10,152 km2 in the Road and No Road scenarios, respectively. This is a 4.8% reduction for the GE scenario relative to 2013, which is much smaller than the projected 12.3% and 10.2% reduction for the Road and No Road cases.
- Avoided deforestation and reforestation activities under green economy scenarios would increase the total amount of CO2 absorbed by forests, compared to both the Road and No Road scenarios. More specifically, the stock of carbon would amount to 129.9 million tonnes of CO2 in the GE scenario in 2035, compared to 121.9 and 124.6 million tonnes of CO2 under the Road and No Road scenarios, respectively. Considering an approximate value of US$ per ton of CO2, the carbon stored in forests could be worth US$128 million more in the GE case relative to the Road scenario.
- Improved efficiency in the agriculture sector would reduce the expansion of agriculture land to 1919 km2 under the GE scenario in 2035 relative to 2211 km2 and 2027 km2 in the Road and No Road scenarios. Still, the level of production remains the same, with a smaller but more productive cultivated area.
- Concerning socio-economic indicators, on top of increased profitability for farmers, population growth under the green economy scenarios remains lower than in the Road scenario, but higher than the No Road simulation. This is due to the reduced land use and higher labour intensity in the agriculture sector. As result, also in the case of Myanmar the GE scenario retains the economic benefits of the road scenario while reducing the impacts on the environment. In fact, the reduction in population also leads to lower urban land relative to the Road scenario. In addition, when adding that degraded agriculture land is converted for both reforestation and urbanization purposes under the green economy scenario (while it is entirely used for satisfying urban land needs under the road scenario) the expansion of urban land will not be a cause of deforestation in the GE case.
- As indicated earlier, ecological agriculture practices generally require more labour force than conventional agriculture (up to 30% higher [20]). Projections for the GE scenario indicate that employment in the agriculture sector will be higher than in the No Road case, but will remain slightly lower than in the Road case (due to the higher efficiency of the production process). Specifically, projections show that approximately 1360 additional jobs could be created every year between 2015 and 2035 under the Road scenario, compared to 1300 under the GE scenario in the same period. As indicated earlier, if we were to keep the same amount of agriculture land as in the Road scenario, employment would be approximately 30% higher in the GE case relative to the Road case, and even higher when compared to the No Road scenario.
- Concerning flood control, the GE scenario is projected to perform 7.4% and 6.5% higher than the Road and No Road simulations, indicating that costs can be avoided (social and economic) and resilience increased when green economy interventions are implemented.
5. Discussion
- First, short-, medium- and longer-term impacts have to be clearly identified. As it was shown, short-term positive impacts (e.g., on economic attractiveness) might be curbed by medium and long-term indirect and induces trends, including negative consequences of environmental degradation. The introduction of targeted green economy interventions for the protection of natural capital and ecosystem services is expected to alleviate environmental pressures, creating the enabling conditions for sustainable and inclusive development. A more detailed study could show the cost of replacing ecosystem services, to objectively compare advantages and disadvantages of various scenarios. In fact, a sudden economic expansion, when coupled with unregulated land exploitation, might lead to speculations that would be made at the expenses of the environment and the well being of the local population, for the exclusive benefit of a limited number of actors. Green economy interventions, such as the establishment of protected forest areas, the adoption of sustainable forest management principles and practices, need to support a fair and inclusive development. While the growth of population and the expansion of agriculture are likely to increase pressure on natural resources (e.g., forest), the adoption of ecological agriculture practices can curb the needs for agriculture land.
- Second, the distribution of costs and benefits across different actors should be clearly assessed. This is particularly important in the context of the valuation of natural capital, because the lowest income classes are generally the most reliant on locally available natural resources and ecosystem services. The lack of knowledge and evidence on the economic value of the environment has, for a long time, prevented the incorporation of natural capital in national development planning. Assessments of potential impacts from regional transport infrastructure projects tend to focus on the development benefits measured in terms of reduced logistics costs, jobs, revenue and increases in standards of living as measured by household income. Yet, transport and other infrastructure profoundly influence the integrity of natural systems on which they impact, as well as patterns of trade and development. As such, the economic opportunity from infrastructure must be balanced against long-term need for natural systems vital to economic and physical resilience. Without this, the economies these corridors drive cannot be sustainable in the long-term because of the high likelihood of loss of critical benefits that nature provides. Given that environmental and social externalities are typically communicated in “soft” numbers—carbon emissions for example—decision-makers are missing information on the direct and indirect contribution of biodiversity and ecosystem services in the economy and to human wellbeing. The study “Green Economy Modelling of Ecosystem Services along the “Road to Dawei” was conceived as a pilot project, aiming at designing an integrated framework to inform and support land use planning support in this context. Three different scenarios were simulated to anticipate possible impacts on economic, social and environmental indicators and impacts for the construction of roads connecting Bangkok to Dawei via Kanchanaburi, in the framework of the Dawei Project. Simulation results show that a conventional approach to road construction is likely to have positive economic impacts in the region, especially in the short term, but also negative consequences for the integrity of the ecosystem, which in turn might also negatively impact on the investment itself (e.g., in relation to the risk of floods and landslides) and its economic outcomes (e.g., concerning land erosion in the case of agriculture and NTFP production) in the medium and longer term. Further, results indicate that green economy interventions would mitigate environmental risks by creating synergies across sectors, systemically.
- Thirdly, an integrated, cross-sectoral approach should be used for the evaluation of costs and benefits, as well as broader advantages and disadvantages, of project implementation. Synergies can be created across sectors. As an example, while the growth of population and the expansion of agriculture are likely to increase pressure on natural resources (e.g., forest), the adoption of ecological agriculture practices can curb the needs for agriculture land. This study employed a model with environmental, social and economic indicators allowing for a more realistic baseline from which to plan for both economic development and conservation and other environmental policy interventions. This type of model may indicate where efficiencies for economic development can be gained from managing natural capital proactively in land use change, through for example, managing water risks for human settlements, or agricultural and industrial activities. From a conservation practitioner point of view, the model can be used to identify successful conservation outcomes (i.e., a pure focus on ecosystem integrity), which then can be “translated” into economic and social benefits from those interventions. Furthermore, recognising that viable conservation will in some cases impose a net cost on public finance (perhaps with conservation benefits too far off in the future or distributed too thinly across human populations to count), a model such as this can help identify policy interventions that minimize these costs. The same approach and information could be easily further customized to analyse a variety of different infrastructure projects, making use of the value created by the innovation that this pilot study presents: the simultaneous use of InVEST, System Thinking and System Dynamics.
6. Conclusions
Acknowledgments
Author Contributions
Conflicts of Interest
Abbreviations
| BAU | Business As Usual |
| DTL | Dawna Tenasserim Landscape |
| DSEZ | Dawei Special Economic Zone |
| EEA | Experimental Ecosystem Accounting |
| GE | Green Economy |
| GEM | Green Economy Model |
| IPS | Integrated Planning for Sustainability |
| REDD+ | Reducing emissions from deforestation and forest degradation |
| SEEA | System of Environmental-Economic Accounting |
| SFM | Sustainable Forest Management |
| UNEP | United Nations Environment Programme |
| WAVES | Wealth Accounting and Valuation of Ecosystem Services |
| WWF | World Wide Fund for Nature |
References
- Goodenough, R.; Page, S. Evaluating the environmental impact of a major transport infrastructure project: The Channel Tunnel high-speed rail link. Appl. Geogr. 1994, 14, 26–50. [Google Scholar] [CrossRef]
- Makki, T.; Fakheran, S.; Moradi, H.; Iravani, M.; Senn, J. Landscape-scale impacts of transportation infrastructure on spatial dynamics of two vulnerable ungulate species in Ghamishloo Wildlife Refuge, Iran. Ecol. Indic. 2013, 31, 6–14. [Google Scholar] [CrossRef]
- Arce, R.; Gullòn, N. The application of Strategic Environmental Assessment to sustainability assessment of infrastructure development. Environ. Impact Assess. Rev. 2000, 20, 393–402. [Google Scholar] [CrossRef]
- Noldan, B.; Janoušková, S.; Hák, T. How to understand and measure environmental sustainability: Indicators and targets. Ecol. Indic. 2012, 17, 4–13. [Google Scholar]
- Jones, M. Accounting for the environment: Towards a theoretical perspective for environmental accounting and reporting. Account. Forum 2010, 34, 123–138. [Google Scholar] [CrossRef]
- De Groot, R.; Alkemade, R.; Braat, L.; Hein, L.; Willemen, L. Challenges in integrating the concept of ecosystem services and values in landscape planning, management and decision making. Ecol. Complex. 2010, 7, 260–272. [Google Scholar] [CrossRef]
- Organisation for Economic Co-operation and Development (OECD). The DAC Guidelines. Strategies for Sustainable Development; OECD: Paris, France, 2001. [Google Scholar]
- United Nations Development Programme (UNDP). Handbook on Planning, Monitoring and Evaluating for Development Results; UNDP: New York, NY, USA, 2009. [Google Scholar]
- United Nations Environment Programme. Integrated Policymaking for Sustainable Development. A Reference Manual; UNEP: Geneva, Switzerland, 2009. [Google Scholar]
- Varone, F.; Nahrath, S.; Aubin, D.; Gerber, J.-D. Functional regulatory spaces. Policy Sci. 2013, 46, 311–333. [Google Scholar] [CrossRef]
- The Economics of Ecosystems and Biodiversity. The Economics of Ecosystems and Biodiversity Ecological and Economic Foundations; Kumar, P., Ed.; Earthscan: London, UK, 2010. [Google Scholar]
- United Nations (UN). Transforming Our World: The 2030 Agenda for Sustainable Development; UN: New York, NY, USA, 2015. [Google Scholar]
- United Nations Statistics Division (UNSD). Revision of the System of Environmental-Economic Accounting (SEEA). SEEA Central Framework; UNSD: New York, NY, USA, 2012. [Google Scholar]
- Wealth Accounting and the Valuation of Ecosystem Services. Users and Uses of Environmental Accounts; The World Bank Group: Washington, DC, USA, 2014. [Google Scholar]
- Intergovernmental Science-Policy Platform on Biodiversity and Ecosystem Services. Available online: http://www.ipbes.net (accessed on 25 May 2016).
- Solow, R. A contribution to the theory of economic growth. Q. J. Econ. 1956, 70, 65–94. [Google Scholar] [CrossRef]
- Solow, R.M. Reflection on growth and development. Ann. Econ. Financ. 2003, 4, 219–229. [Google Scholar]
- Chambers, D.; Guo, J. Natural Resources and Economic Growth: Some Theory and Evidence. Ann. Econ. Financ. 2009, 10, 367–389. [Google Scholar]
- World Bank. World Development Indicators (WDI); World Bank: Washington, DC, USA, 2013. [Google Scholar]
- United Nations Environment Programme (UNEP). Towards a Green Economy: Pathways to Sustainable Development and Poverty Eradication; UNEP: Geneva, Switzerland, 2011. [Google Scholar]
- Asian Development Bank (ADB). Green Growth, Resources and Resilience: Environmental Sustainability in Asia and the Pacific; Asian Development Bank: Manila, Philippines, 2012. [Google Scholar]
- Bassi, A.M. Moving towards integrated policy formulation and evaluation: The Green Economy Model (GEM). Environ. Clim. Technol. 2015, 16, 5–19. [Google Scholar] [CrossRef]
- United Nations Environment Programme (UNEP). Building Inclusive Green Economies in Africa—Experience and Lessons Learned 2010–2015; UNEP: Geneva, Switzerland, 2015. [Google Scholar]
- Baumol, W.J.; Oates, W.E. The Theory of Environmental Policy, 2nd ed.; Cambridge University Press: Cambridge, UK, 1988. [Google Scholar]
- Sterman, J.D. Business Dynamics: Systems Thinking and Modeling for a Complex World; Irwin/McGraw-Hill: Boston, MA, USA, 2000. [Google Scholar]
- Pimentel, D.; Hepperly, P.; Hanson, J.; Douds, D.; Seidel, R. Environmental, energetic, and economic comparisons of organic and conventional farming systems. BioScience 2005, 55, 573–582. [Google Scholar] [CrossRef]
- Herren, H.R.; Bassi, A.M.; Tan, Z.; Binns, W.P. Green Jobs for a Revitalized Food and Agriculture Sector; Food and Agriculture Oorganization off the United Nations: Rome, Italy, 2012. [Google Scholar]
- Donnges, C.; Edmonds, G.A.; Johannessen, B. Rural road Maintenance: Sustaining the Benefits of Improved Access; No. 19; International Labour Organisation: Geneva, Switzerland, 2007. [Google Scholar]
- Emerton, L.; Aung, Y.M. The Economic Value of Forest Ecosystem Services in Myanmar and Options for Sustainable Financing; IMG, Yangon and Ministry of Environmental Conservation and Forests: Naypyidaw, Myanmar, 2013. [Google Scholar]
| Land Use | |
| Total area cleared for road construction | Calculated as 3 times larger than actual road area (2.64 km2 and 10.56 km2 for the Dawna Tenasserim Landscape (DTL), 4.5 km2 and 18.2 km2) due to additional land clearing for construction purposes. |
| Forest land | Forestland is used for the construction of the road and for the expansion of agricultural land. |
| Urban land | Urban areas are built primarily on degraded land. In case degraded land is not available, part of the area cleared for road construction is used for human settlement, up to 30% of its total. Any remaining need for urban land is fulfilled through deforestation. |
| Population | |
| Growth rate | The net population growth rate (birth minus death rate, excluding migration) is assumed to be 3%, based on demographic trends in the Kanchanaburi area and 2% for Myanmar. |
| Out migration | An out migration rate of 5% and 1% is assumed for the BAU scenario for the DTL and Myanmar, respectively. However, the construction of the road is assumed to drive a progressive decline of out migration in Thailand, due to increased employment opportunities deriving from the improvement of transport infrastructure (the out migration flow would stop by the year 2025). In Myanmar, also due to the large industrial development planned in the Dawei area, outmigration to urban areas is assumed not to change. |
| Water | |
| Average annual precipitation | 1500 mm/year for the DTL [19] and 5500 mm/year for Myanmar. |
| Average water use in agriculture | 660 mm/ha/year. |
| Residential water demand/capita | The average amount of m3 per person per year is 39.54 m3 (6500 cubic meters for 60,000 villagers in Thailand, on average, per day). |
| Agriculture | |
| Effect of road construction on agriculture attractiveness | Attractiveness would gradually increase since the starting of road construction works, reaching a four-fold increase after road completion. |
| Impact of investments in agriculture on deforestation | When attractiveness is at the maximum level, a 10% increase in desired land is assumed (desired, not necessarily taking place). |
| Initial average fertilizer use/km2 | 13.79 tonnes per km2 for Thailand [19] and 2.5 tonnes per km2 for Myanmar. |
| Organic fertilizer use | In the range of 30% to 40% of total fertilizer consumption by 2035 under the GE scenario. |
| Investment in organic fertilizer | Approximately $100/ha/year. |
| Ecological agriculture water use | 30% reduction compared to conventional agriculture [26]. |
| Average agriculture land per capita for food production | 0.004 km2 per person = 1 acre per person in Thailand and 0.003 km2 per person in Myanmar. The area needed for food production is assumed to decrease with the increase in agricultural productivity. |
| Agricultural productivity | It is assumed that changes in fertilizer use, soil quality, and labour productivity would have a positive—but not immediate—impact on agricultural productivity. |
| Employment | |
| Potentially active people (labour force) | 60% of total population, calculated on the basis of population cohort between 15 and 59. |
| Residential people employed in agriculture | 45.94% of the population, derived from the fraction of agricultural employment in the Kanchanaburi region and 35% in Myanmar (assumed). |
| Initial average income of farmer’s household | 15,326 Baht for Thailand [19], not estimated for Myanmar. |
| Average farmers needed/km2 | 69.86 farmers/km2 in the No-road and BAU scenarios, derived from initial values of people employed in agriculture and initial area of agricultural land in the Kanchanaburi region. Same assumption used for Myanmar. In the green economy scenarios, the adoption of ecological agriculture practices is expected to produce a 30% increase in employed farmers [27] |
| Average household income: road construction/maintenance | Assumed to be 50% higher than initial average income of farmer’s households. |
| Workers needed for road construction | 11.3 per km of road. |
| Road maintenance labour | 1 worker for 3 km of road [28]. |
| Natural Capital and Ecosystem Services | |
| Average CO2 absorbed by forests | 8600 tonnes of CO2 per km2 of forest in the DTL; 11,954 tonnes of CO2 per km2 of forest, 300 for crops and 38 tonnes of CO2 per km2 for other wooded land in the case of Myanmar (InVEST). |
| Price per ton of CO2 | 123 Baht, or $4 in Thailand, and a range between $16/ha and $38/ha in Myanmar [29], which results in a value close to $1/ton in the high case. |
| Flood control | $419.12 per ha in Myanmar [29]. |
| NTFP | $177 per household Myanmar [29]. People per household: 4.8 (Department of Population, Ministry of Population and Immigration). |
© 2016 by the authors; licensee MDPI, Basel, Switzerland. This article is an open access article distributed under the terms and conditions of the Creative Commons Attribution (CC-BY) license (http://creativecommons.org/licenses/by/4.0/).
Share and Cite
Bassi, A.M.; Gallagher, L.A.; Helsingen, H. Green Economy Modelling of Ecosystem Services along the “Road to Dawei”. Environments 2016, 3, 19. https://doi.org/10.3390/environments3030019
Bassi AM, Gallagher LA, Helsingen H. Green Economy Modelling of Ecosystem Services along the “Road to Dawei”. Environments. 2016; 3(3):19. https://doi.org/10.3390/environments3030019
Chicago/Turabian StyleBassi, Andrea M., Louise A. Gallagher, and Hanna Helsingen. 2016. "Green Economy Modelling of Ecosystem Services along the “Road to Dawei”" Environments 3, no. 3: 19. https://doi.org/10.3390/environments3030019
APA StyleBassi, A. M., Gallagher, L. A., & Helsingen, H. (2016). Green Economy Modelling of Ecosystem Services along the “Road to Dawei”. Environments, 3(3), 19. https://doi.org/10.3390/environments3030019


