Article

Protected Area Monitoring in the Niger Delta Using Multi-Temporal Remote Sensing

1
Lancaster Environment Centre, Lancaster University, Lancaster, LA1 4YQ, UK
2
Department of Surveying and Geoinformatics, Nnamdi Azikiwe University, Awka, Anambra State, 420110, Nigeria
3
Centre for Landscape and Climate Research, University of Leicester, Leicester, LE1 7RH, UK
*
Author to whom correspondence should be addressed.
Environments 2015, 2(4), 500-520; https://doi.org/10.3390/environments2040500
Submission received: 12 July 2015 / Revised: 25 September 2015 / Accepted: 10 October 2015 / Published: 26 October 2015
(This article belongs to the Special Issue Land Use Change in the Changing Environment)

Abstract

:
Despite their importance, available information on the dynamics of forest protected areas and their management in the Niger delta are insufficient. We present results showing the distribution and structure of forest landscapes across protected areas in two states (Cross River and Delta) within the Niger Delta using multi-temporal remote sensing. Satellite images were classified and validated using ground data, existing maps, Google Earth, and historic aerial photographs over 1986, 2000 and 2014. The total area of forest landscape for 1986, 2000 and 2014 across the identified protected areas were 535,671 ha, 494,009 ha and 469,684 ha (Cross River) and 74,631 ha, 68,470 ha and 58,824 ha (Delta) respectively. The study showed annual deforestation rates for protected areas across both states from 1986 to 2000 were 0.8%. However, the overall annual deforestation rate between 2000 and 2014 was higher in Delta (1.9%) compared to Cross River (0.7%). This study shows accelerated levels of forest fragmentation across protected areas in both states as a side effect of the prevalence of agricultural practices and unsupervised urbanisation. The results show the need for government intervention and policy implementation, in addition to efforts by local communities and conservation organisations in protected area management across ecologically fragile areas of Nigeria.

1. Introduction

The Niger Delta region is a biodiversity hotspot and has been classed as the second most sensitive environment in all of Africa [1]. The vast variety of fauna and flora in the region are put to a number of uses such as: fuel, fishing, agriculture, food, drugs and beverages, textile and leather production, paper production, and construction [2]. The region has the largest proportion of tropical forests in the country and is ravaged by diverse environmental problems of which deforestation is most prominent [3,4]. The impact of human related activities such as land clearing for agriculture, urban development, fuel wood harvesting and timber logging are major causes of deforestation and forest degradation in tropical forest regions of the world, particularly in Africa [5,6,7]. A number of studies have investigated the devastating effects of human activities on the alteration of the earth’s ecosystems [6,8,9]. Land use conversion effects have evolved from local environmental impacts to matters of global importance as such changes are driven by pressures from the global population [6]. The establishment of protected areas (PAs) as a means of forest conservation and combating threats of deforestation is a globally recognised approach [10]. The International Union for Conservation of Nature (IUCN) defines PAs as areas of land or sea “dedicated to the protection and maintenance of biological diversity and of natural and associated cultural resources, managed through legal or other effective means” [11].
At present, there is limited information on the extent, distribution, and structure of forest landscapes across PAs in the ecologically fragile Niger Delta. Such information is vital in creating reliable baseline data and providing an up-to-date database of forest information needed for forest conservation, monitoring, and management. The measure of spatial and temporal trends of deforestation across large expanses of varied landscape can be accomplished using a combination of multi-temporal remote sensing and ground-based observations [12,13,14,15]. A number of studies have successfully utilised a combination of satellite remote sensing and ground data to determine land cover changes within and around PAs [16,17,18,19]. For example, Curran et al. [16] utilised satellite, geographic information systems (GIS), and field-based analysis to estimate forest decline in PAs of the Indonesian Borneo. The study identified high levels of deforestation across its PAs (<56% forest loss between 1985 and 2001) caused by logging of trees for international markets. Similar approaches were adopted by [17], which assessed spatial changes in land cover across the Pranahita Wildlife Sanctuary in India using a combination of medium resolution Landsat and IRS satellite data for deforestation mapping. In the study conducted by [18], the authors demonstrated the importance of remote sensing data in providing valuable baseline data on deforestation trends in parts of Angola as a preparatory mechanism required for the implementation of the United Nations programme “Reducing Emissions from Deforestation and Forest Degradation (REDD+)”. In [14], the authors demonstrate the applicability of utilising multi-spectral remote sensing Landsat imagery combined with high resolution Satellite Pour l’Observation de la Terre (SPOT5) imagery for accuracy assessment to better understand human-induced activities on forest cover change across forest landscapes in Italy from 2002 to 2011. The methodology adopted in most of the literature reviewed included estimating forest loss (deforestation) through the analysis of spatial changes in forest cover and temporal analysis of classified forest maps.
Habitat loss and fragmentation have been identified as key issues of concern facing conservation efforts of protected areas across the world [19,20,21,22]. The occurrence of habitat fragmentation caused by interplay of varied anthropogenic and natural disturbances impacts negatively on species dispersion and habitat colonisation, decreased connectivity between habitats, population diversity of species, and species mortality and rates of reproduction [19,23,24]. Hence, a qualitative analysis of landscape structure dynamics is crucial in better understanding the structure of forest PAs. For example, Midha and Mathur [23] assessed the level of forest fragmentation within two conservation priority landscapes using classified images. The results revealed that forests in one of the PAs was less fragmented and had better habitat quality in comparison to the other. This was informed by results of FRAGSTATS: Spatial Pattern Analysis program computed class level metrics (such as percentage of forest landscape, mean patch size, edge density, mean shape index, mean core area, mean nearest neighbor, and interspersion and juxtaposition index). In a similar study, Girvetz et al. [25] used the effective mesh size to compare relative impacts of different land use disturbance in a statewide multi-scale study across California in the United States of America. These methods of monitoring anthropogenic and natural disturbances suggest that the combined uses of habitat transition analysis and landscape fragmentation are useful indicators for baseline studies relating to PAs conservation. At present, such information is currently lacking for key PAs within the study area thereby further justifying the need for this study. A number of studies have demonstrated the use of landscape metrics for better understanding the process of forest landscape structural change over time [26,27,28,29].
The establishment of PAs across states in the Niger Delta region is critical in conserving the existing biodiversity, which is under immense pressure from a number of factors [30,31]. Hence, for this study PAs across two major states (Cross River state (CRS) and Delta state (DS)) with contrasting forest policy and management practices were investigated. CRS is one of the very few states across Nigeria that has actively reviewed its forestry policies to reflect current issues relating to forest conservation and protection of its remaining biodiversity. Though DS is currently taking steps to develop its forest policies, CRS has over the years taken more proactive steps to update its forest policies to better promote biodiversity and conservation. In 2010, the CRS Government enacted a deforestation moratorium in line with the UN-REDD initiative [32,33]. Another review of forest policy in CRS was the establishment of a mobile court charged with the responsibility of prosecuting any person(s) involved in unlicensed or unlawful harvesting of forest produce and killing or hunting of any animal (or endangered species) as listed in the CRS Forestry Commission Law No.3 of 2010 [34] in 2014. Considering that forest laws governing Nigeria vary from state to state, there is an urgent need to have a harmonised system of governance from state to federal levels to enable forest conservation, particularly for forest PAs. In CRS, the approved government agency (CRS Forestry Commission) charged with the responsibility of managing forests across the state employs community-oriented forest conservation where possible, in addition to other management strategies. This level of community engagement in forest management across the state is demonstrated in the establishment of Forest Management Committees representing numerous forest-dependent communities [35].
The overall aim of this study was to provide an up-to-date inventory of forest transitional patterns for selected PAs in the Niger Delta region through the use of multi-temporal remote sensing. This was accomplished through implementing the following objectives: (i) to determine the current extent of forest transition and rates of change for PAs in the study area; and (ii) to quantitatively estimate the extent of forest fragmentation across PAs over 1986, 2000 and 2014.

2. Materials and Methods
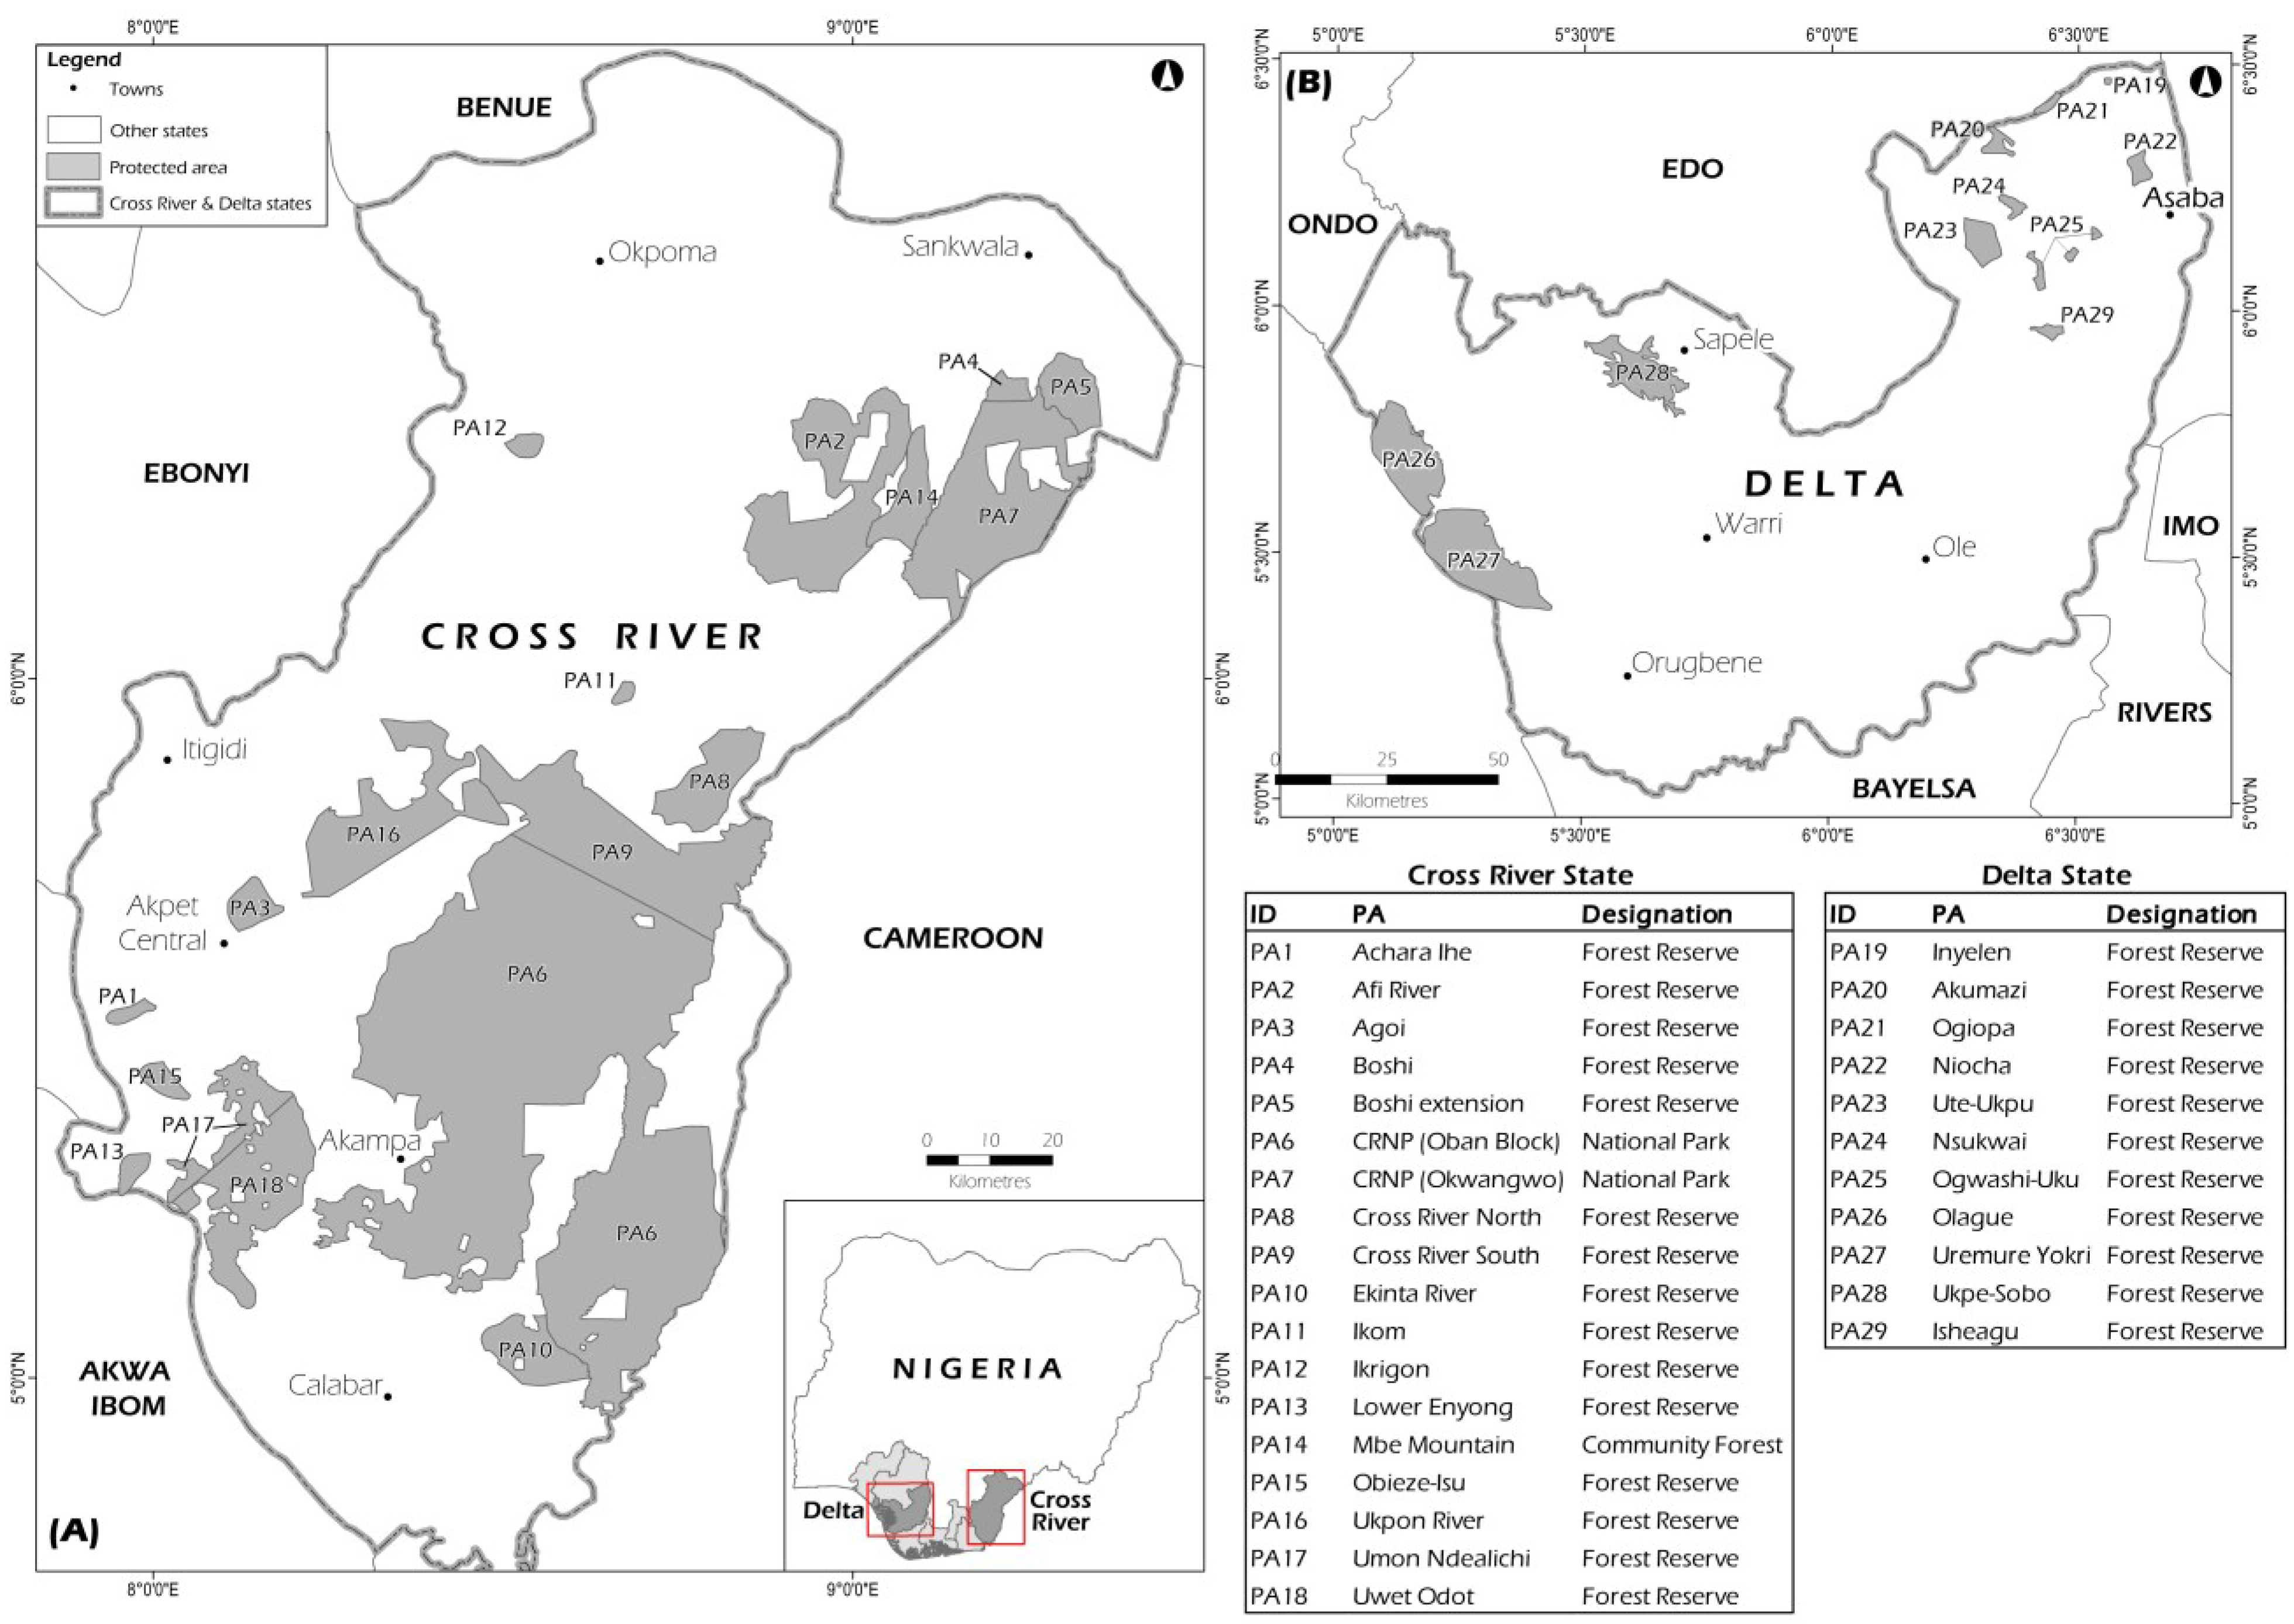
2.1. Study Areas

The study areas, Cross River and Delta states, are situated in the south eastern and south western parts of the Niger delta region of Nigeria. Cross River State (CRS) lies within latitudes 4°40′ N and 6°54′ N and longitudes 7°50′ E and 9°28′ E, covering an approximate area of 20,156 square kilometres. The ecological zone of CRS is characterised by lowland rain forests, fresh water swamp forests, mangrove vegetation, montane forests and savannah vegetation [36]. The southwestern Delta state (DS) lies within latitudes 4°50′ N and 6°30′ N and longitudes 4°58′ E and 6°47′ E, covering an approximate area of 17,106 square kilometres. The vegetation of DS ranges from fresh water swamp forest along the coast to lowland rainforest in the centre areas and derived savannah in the northern extremes. Twenty-six forests with protected areas status and spread across both states were investigated in this study. These include 15 forest reserves in CRS, 11 forest reserves in DS, one community forest in CRS, two national parks in CRS and two game reserves in DS (Figure 1).
Figure 1. Map of study area showing distribution of protected areas in (A) Cross River and (B) Delta states, located in the Niger delta region of Nigeria.
Environments 02 00500 g001

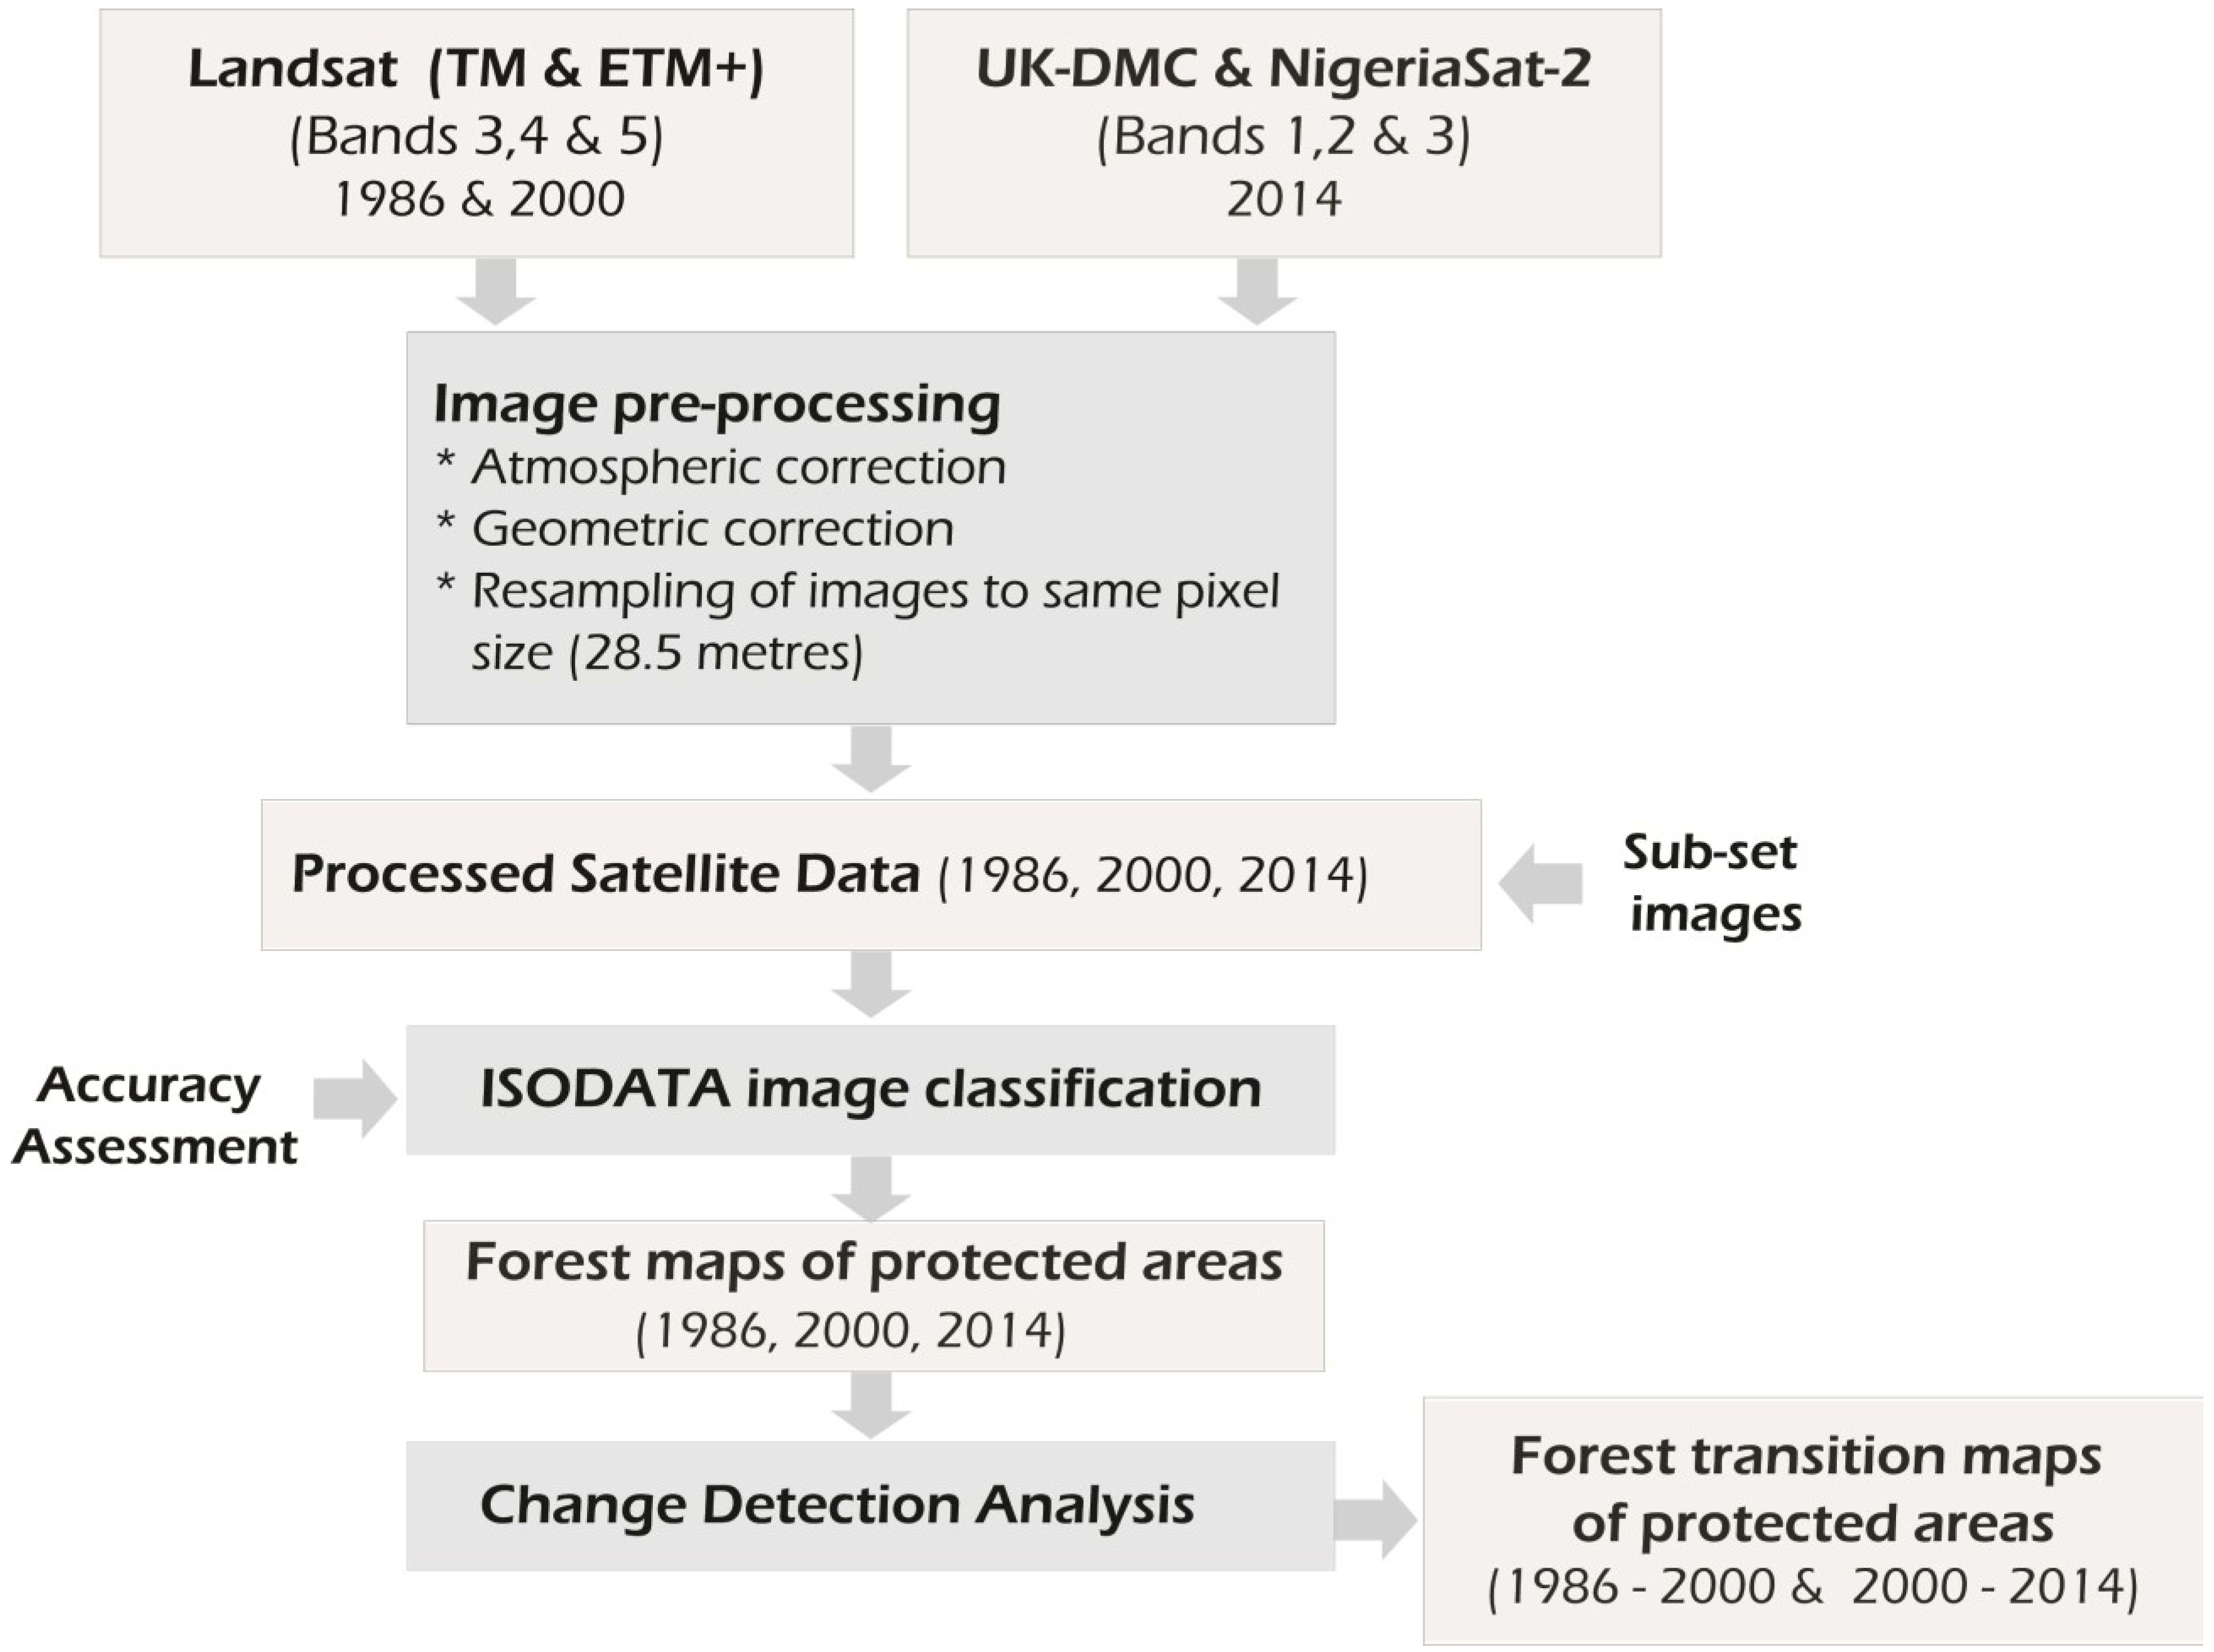
2.2. Remote Sensing Analysis

Figure 2 presents the key stages of image processing in this study. The satellite images used for subsequent analysis were acquired over three epochs namely 1986/87, 2000/2001 and 2014 respectively. The Landsat-5 Thematic Mapper (TM), Landsat-7 Enhanced Thematic Mapper Plus (ETM+), NigeriaSat 2 and UK-DMC-2 images were used for image classification and change detection analysis. The criteria for the selection of satellite data used in the study were scenes with minimal cloud cover or totally cloud free images. The Landsat images were downloaded from the United States Geological Survey (USGS) and Earth Explorer website (http://earthexplorer.usgs.gov/) while the UK-DMC-2 and NigeriaSat images were supplied by the Nigeria Space Agency, NASRDA (National Space Research and Development Agency). Given that the UK-DMC-2 and NigeriaSat sensors are cross calibrated with Landsat sensors, the near infrared, red, and green bands of the aforementioned images (i.e., bands 1–3) are equivalent to Landsat bands 4, 3 and 2 (http://www.dmcii.com/). Details of the satellite images used and characteristics are presented in Table 1 below. All Landsat images used in the study had the Scan Line Correctors (SLC) turned on, consequently eliminating issues of line gap problems after acquisition. In order to avoid issues of seasonality variation, the satellite images used in the study were acquired during the same season (i.e., dry season between November to February) [37].
To ensure the raw satellite images covering the study area were geometrically correct, a polynomial geometric model in ERDAS imagine was used [38]. In order to maximise spectral information contained in the satellite images, the process of eliminating effects from atmospheric particles due to absorption and scattering of the earth’s surface radiation as at the time of acquisition was conducted [39].
Before performing image classification, the spectral radiance of each band contained in the imagery used was converted to at-satellite reflectance values using methods outlined in the Landsat 7 Science Handbook [40]. The raw digital numbers (DN) of Landsat (TM and ETM+), UK-DMC-2 and NigeriaSat-2 images were converted to at-reflectance values in order to remove all forms of noise introduced from instrumental errors, changes in views and illumination and atmospheric effects [41,42]. Equations (1)–(3) were used for the computation.
L λ = ( D N λ G a i n λ ) + B i a s λ
L μ = ( D N μ G a i n μ ) + B i a s μ
ρ λ / μ = π L λ / μ d 2 E S U N λ / μ S i n θ s e
where Ll/m = Spectral radiance at aperture of Landsat and UK-DMC-2/NigeriaSat sensor [W/(m2·sr·µm)]; DNl/m = Digital number values of Landsat and UK-DMC-2/NigeriaSat images; Gainl/m = gain values of specific bands in the image header files Landsat & UK-DMC-2/NigeriaSat images; Biasl/m = gain values for specific bands in the image header files; π = 3.14159; d = Earth-Sun distance [astronomical distance]; ESUNl/m = Mean exoatmospheric solar irradiance [W/(m2·µm)]; θse = Solar/Sun elevation angle (degrees) [42,43]. It is important to state here that the cosine of solar zenith is the same as the sine of solar elevation. The value of solar elevation is provided in the metadata file that comes with the downloaded Landsat image and accompanied with the UK-DMC-2/NigeriaSat satellite images.
After applying atmospheric and geometric corrections, the satellite images were mosaicked and sub-set using ERDAS Imagine software. In order to normalise the spatial scale differences between bands of imagery used in the study, all bands used were resampled to a pixel size of 28.5 m. The images were subsequently used in ISODATA classification and change detection analysis (Figure 2).
Figure 2. Methodology for remote sensing analysis.
Environments 02 00500 g002
Table 1. Characteristics of space borne satellite images used in the study.
StatePlatform/SensorSpectral ResolutionDate of AcquisitionPathRowSpatial Resolution (m)
Cross River StateLandsat-5 TM
(bands 3–5)
B3: 0.52–0.60 µm (Green)
B4: 0.63–0.69 µm (Red)
B5: 0.76–0.90 µm (NIR)
12 December 19861875528.5
12 December 19861875628.5
12 December 19861875728.5
19 December 19861885528.5
19 December 19861885628.5
19 December 19861885728.5
Landsat-7 ETM+
(bands 3–5)
B3: 0.52–0.60 µm (Green)
B4: 0.63–0.69 µm (Red)
B5: 0.77–0.90 µm (NIR)
27 January 20011875528.5
10 December 20001875628.5
10 December 20001875728.5
17 December 20001885528.5
17 December 20001885628.5
17 December 20001885728.5
UK-DMC-2
(bands 1–3)
B1: 0.52–0.62 µm (Green)
B2: 0.63–0.69 µm (Red)
B3: 0.76–0.90 µm (NIR)
7 January 2014N/AN/A22
Delta StateLandsat-5 TM
(bands 3–5)
B3: 0.52–0.60 µm (Green)
B4: 0.63–0.69 µm (Red)
B5: 0.76–0.90 µm (NIR)
21 December 19871895628.5
15 January 19861905628.5
Landsat-7 ETM+
(bands 3–5)
B3: 0.52–0.60 µm (Green)
B4: 0.63–0.69 µm (Red)
B5: 0.77–0.90 µm (NIR)
28 January 20021895628.5
17 February 20011905628.5
NigeriaSat2
(bands 1–3)
B1: 0.52–0.62 µm (Green)
B2: 0.63–0.69 µm (Red)
B3: 0.76–0.90 µm (NIR)
18 January 2014N/AN/A22

2.2.1. Image Classification and Accuracy Assessment

For image classification, the unsupervised Iterative Self Organising Data Analysis (ISODATA) technique was used to analyse the satellite images [44]. This was performed using the ISODATA algorithm in ERDAS Imagine software [38]. A total of six broad classes were used in the study, based on the Intergovernmental Panel on Climate Change land use classification scheme [45]. The six broad classes comprised of forestland, cropland, grassland, wetlands, settlements, and other land classes. These classes were further re-categorised into two distinct classes for the purpose of this study, namely forest and non-forest.
The training of the image and performance of accuracy assessment of the classified images was performed using independent training and testing data. The sources for these data used for accuracy assessment included a combination of global positioning system (GPS) data obtained on site for the PAs across the study areas, information from Google Earth, visual interpretation of the satellite imagery, and historic aerial photographs. Accuracy assessment was calculated using the ERDAS Imagine Accuracy Assessment command.

2.2.2. Forest Cover Change Analysis

The forest cover maps for 1986, 2000 and 2014 were generated using the Land Cover Modeler of IDRISI 17.0 Selva [46]. The forest transition maps for both time intervals (1986–2000 and 2000–2014) showed the extent of deforestation, afforestation, and unchanged forest landscapes across the study area. In this study, deforestation referred to the net area converted from forest area in one image to non-forest in the next, while afforestation occurred in reverse (i.e., non-forest to forest).
In order to calculate annual rates of forest transition, both forest cover and forest transition maps were used as inputs. These calculations were based on the assumption that the annual deforestation and afforestation in total forest cover will not be constant, as demonstrated in previous studies [47,48]. The formula for calculating annual deforestation and afforestation rates are presented in Equations (4) and (5) below:
Annual deforestation rate = log F b log ( F a B ) t a t b 100
Annual afforestation rate = log F b log ( F a C ) t a t b 100
where Fa and Fb is the forested area in hectares, at times ta (earlier) and tb (later); B is the deforested area between earlier and later dates; and C is the afforested area between earlier and later dates.

2.2.3. Forest Fragmentation Analysis

In this study, the level of forest fragmentation analysis was derived using FRAGSTATS spatial pattern analysis software (version 4.1) designed to compute landscape metrics [49]. Based on results of previous studies [23,50,51], the class metrics used in this study included the total number of patches (NP), percentage of landscape (PLAND), edge density (ED), mean patch area (MPA), mean shape index (MSI), mean core area index (MCAI), and effective mesh size (MESH). The class level aggregation metrics (NP and MESH) allow for characterising forest landscape structure in the study. Using the core-area, shape, and area-edge derived metrics it is possible to have a better understanding of edge effects and interior habitat [26,28,29,52]. PLAND (a class level composition metric) is a fundamental measure of the landscape composition that describes how much of the landscape is comprised of a particular land cover type. In forest fragmentation analysis, it is essential to know how much of the target land cover type (e.g., forests) exists within the landscape [49]. An 8-cell neighbourhood rule for delineating patches was optimised using the generated “forest and non-forest maps” of PAs across each state from 1986 to 2014.

3. Results and Discussion

3.1. Forest Classification Accuracy Assessment

The accuracy assessment results for CRS and DS forest cover classifications for 1986, 2000 and 2014 are presented in Table 2 and Table 3 respectively. The 1986, 2000 and 2014 overall classifications accuracy of classified forest maps for CRS were 84%, 88% and 82% while for DS were 91%, 89% and 91%.
Table 2. Error matrix of 1986, 2000 and 2014 classified forest maps for Cross River State.
Forest Map—1986
Classified DataForestNon ForestRow TotalUsers Accuracy (%)
Forest3706943984.3
Non Forest3116019183.8
Column Total401229630
Producer’s Accuracy (%)92.370.0
Overall Accuracy (%)83.1
Forest Map—2000
Classified DataForestNon ForestRow TotalUsers Accuracy (%)
Forest2988338178.2
Non Forest332132499.1
Column Total301404705
Producer’s Accuracy (%)99.079.5
Overall Accuracy (%)87.8
Forest Map—2014
Classified DataForestNon ForestRow TotalUsers Accuracy (%)
Forest1554419977.9
Non Forest4424228684.6
Column Total199286485
Producer’s Accuracy (%)77.984.6
Overall Accuracy (%)81.9
Table 3. Error matrix of 1986, 2000 and 2014 classified forest maps for Delta State.
Forest Map—1986
Classified DataForestNon ForestRow TotalUsers Accuracy (%)
Forest1182714581.4
Non Forest418318797.9
Column Total122210332
Producer’s Accuracy (%)96.787.1
Overall Accuracy (%)90.7
Forest Map—2000
Classified DataForestNon ForestRow TotalUsers Accuracy (%)
Forest1262615282.9
Non Forest816016895.2
Column Total134186320
Producer’s Accuracy (%)94.086.0
Overall Accuracy (%)89.4
Forest Map—2014
Classified DataForestNon ForestRow TotalUsers Accuracy (%)
Forest8168793.1
Non Forest1613715389.5
Column Total97143240
Producer’s Accuracy (%)83.595.8
Overall Accuracy (%)90.8

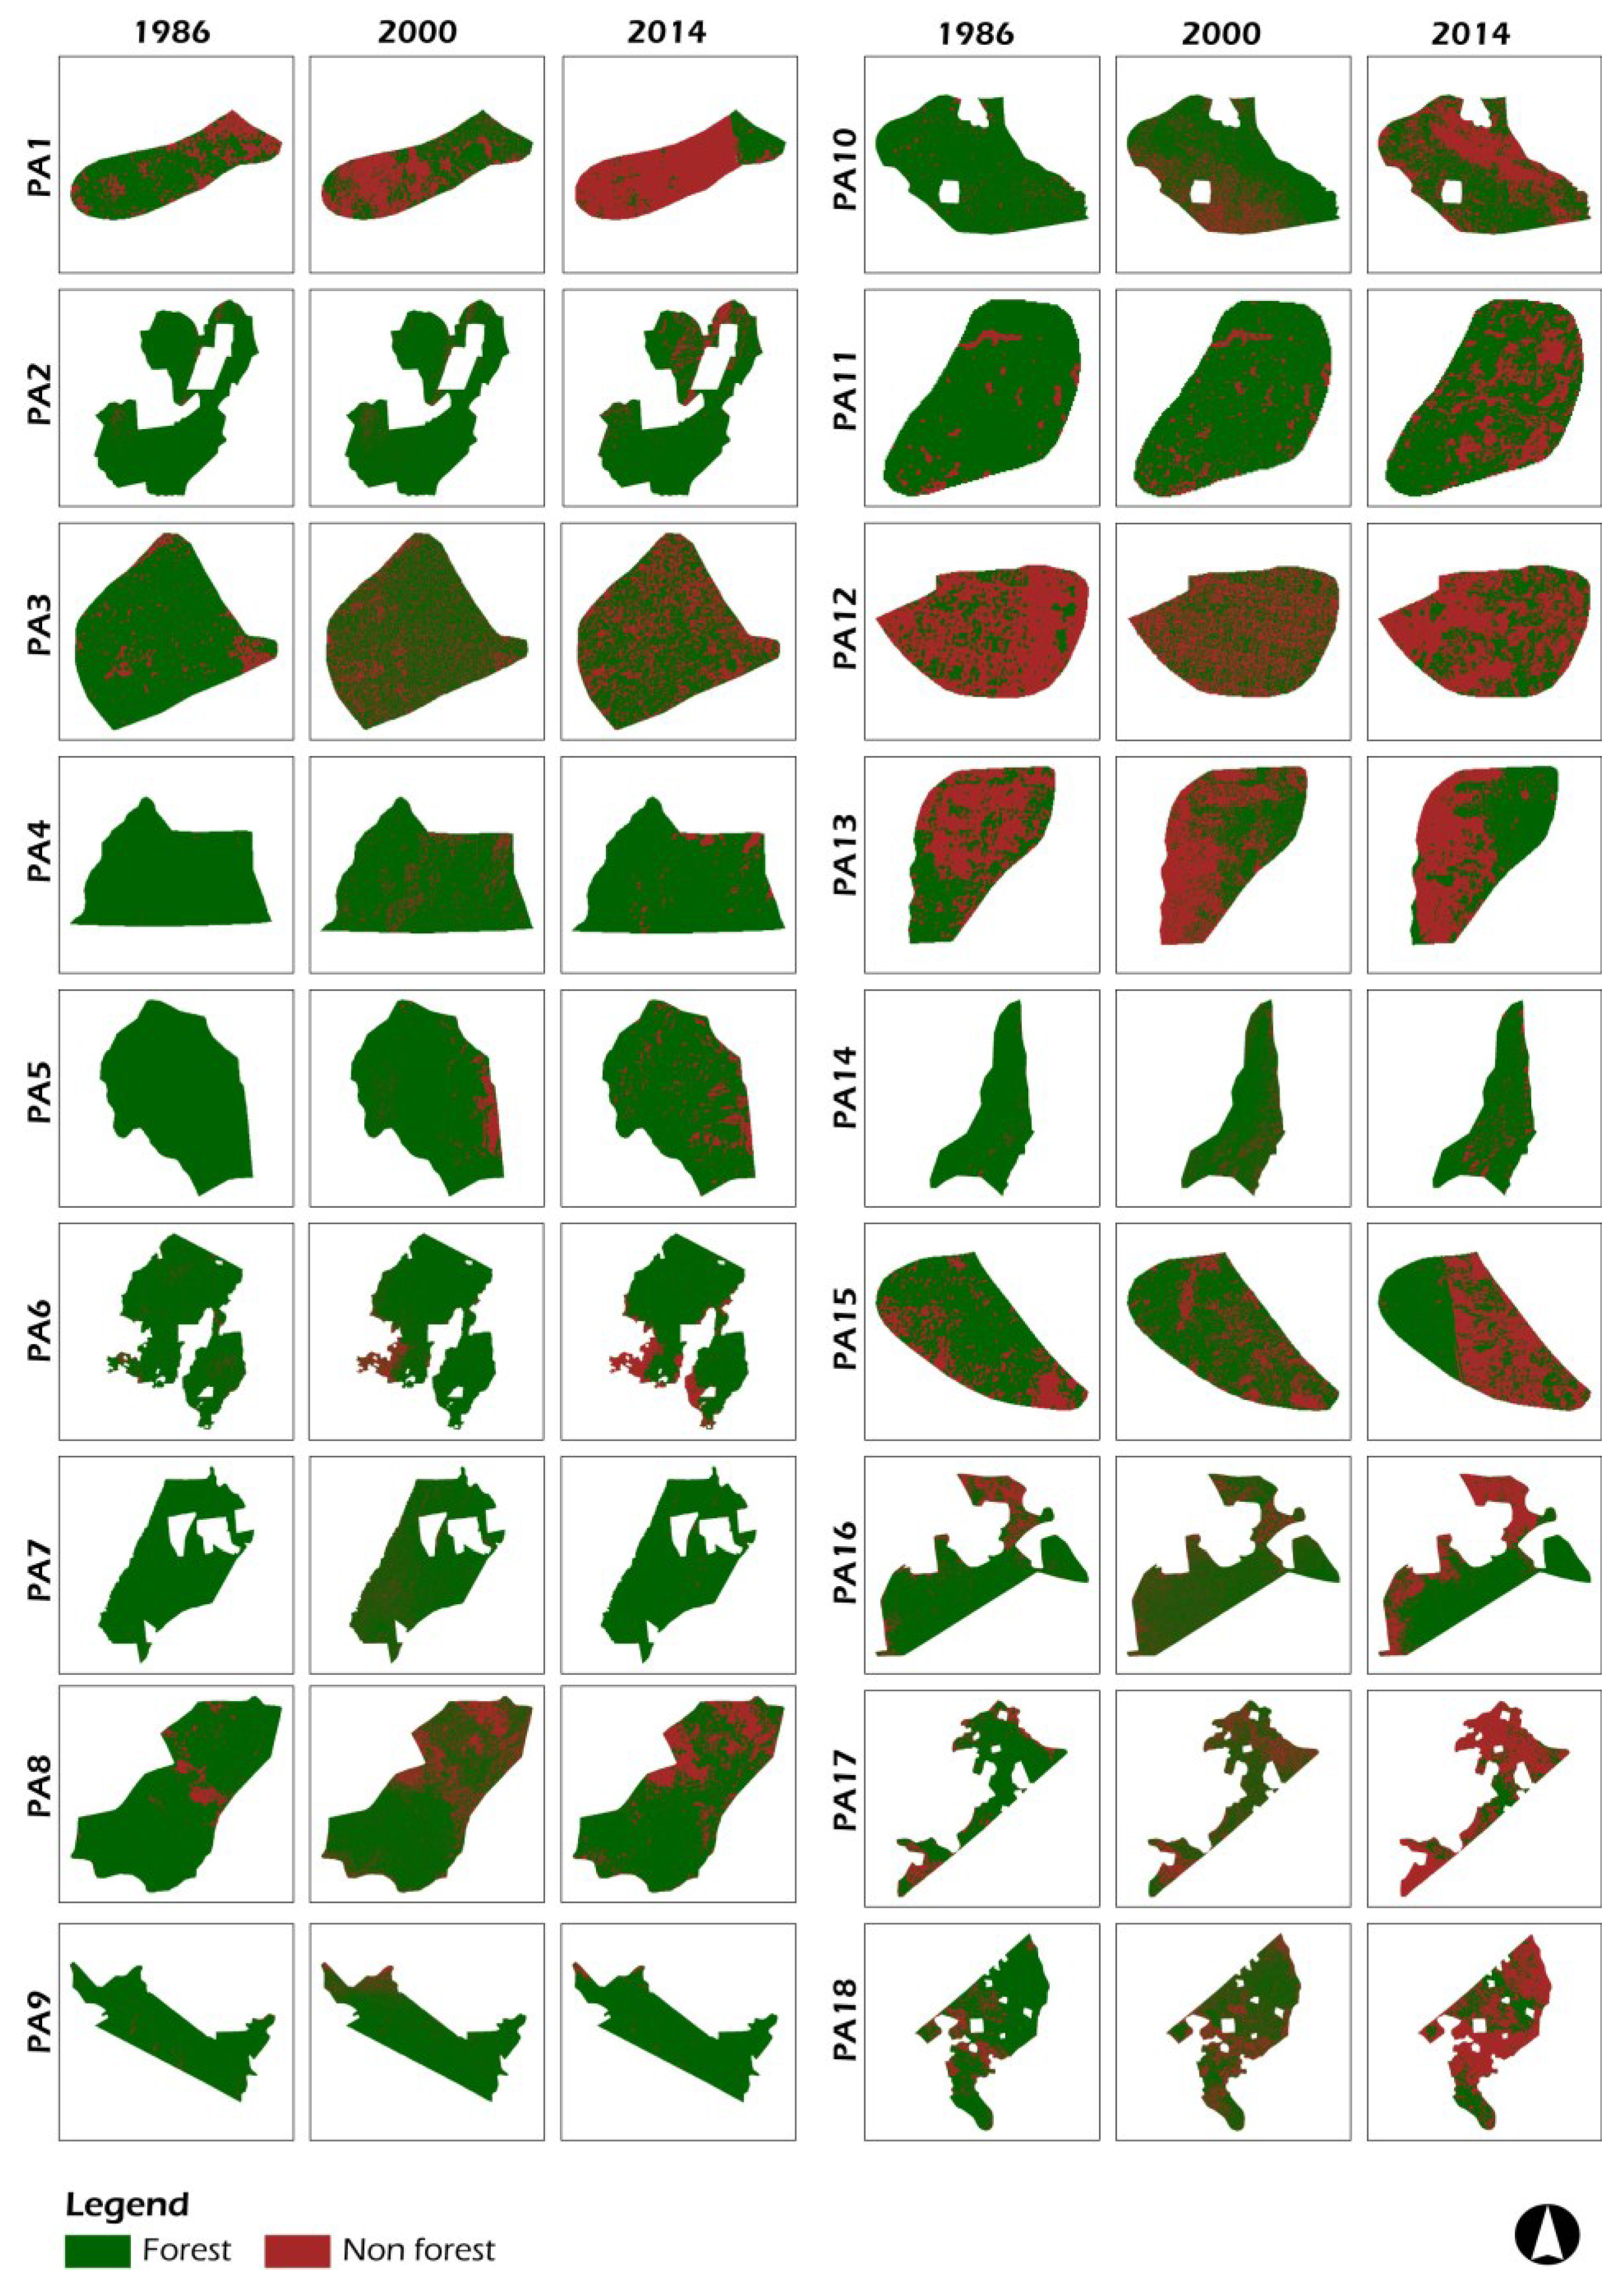
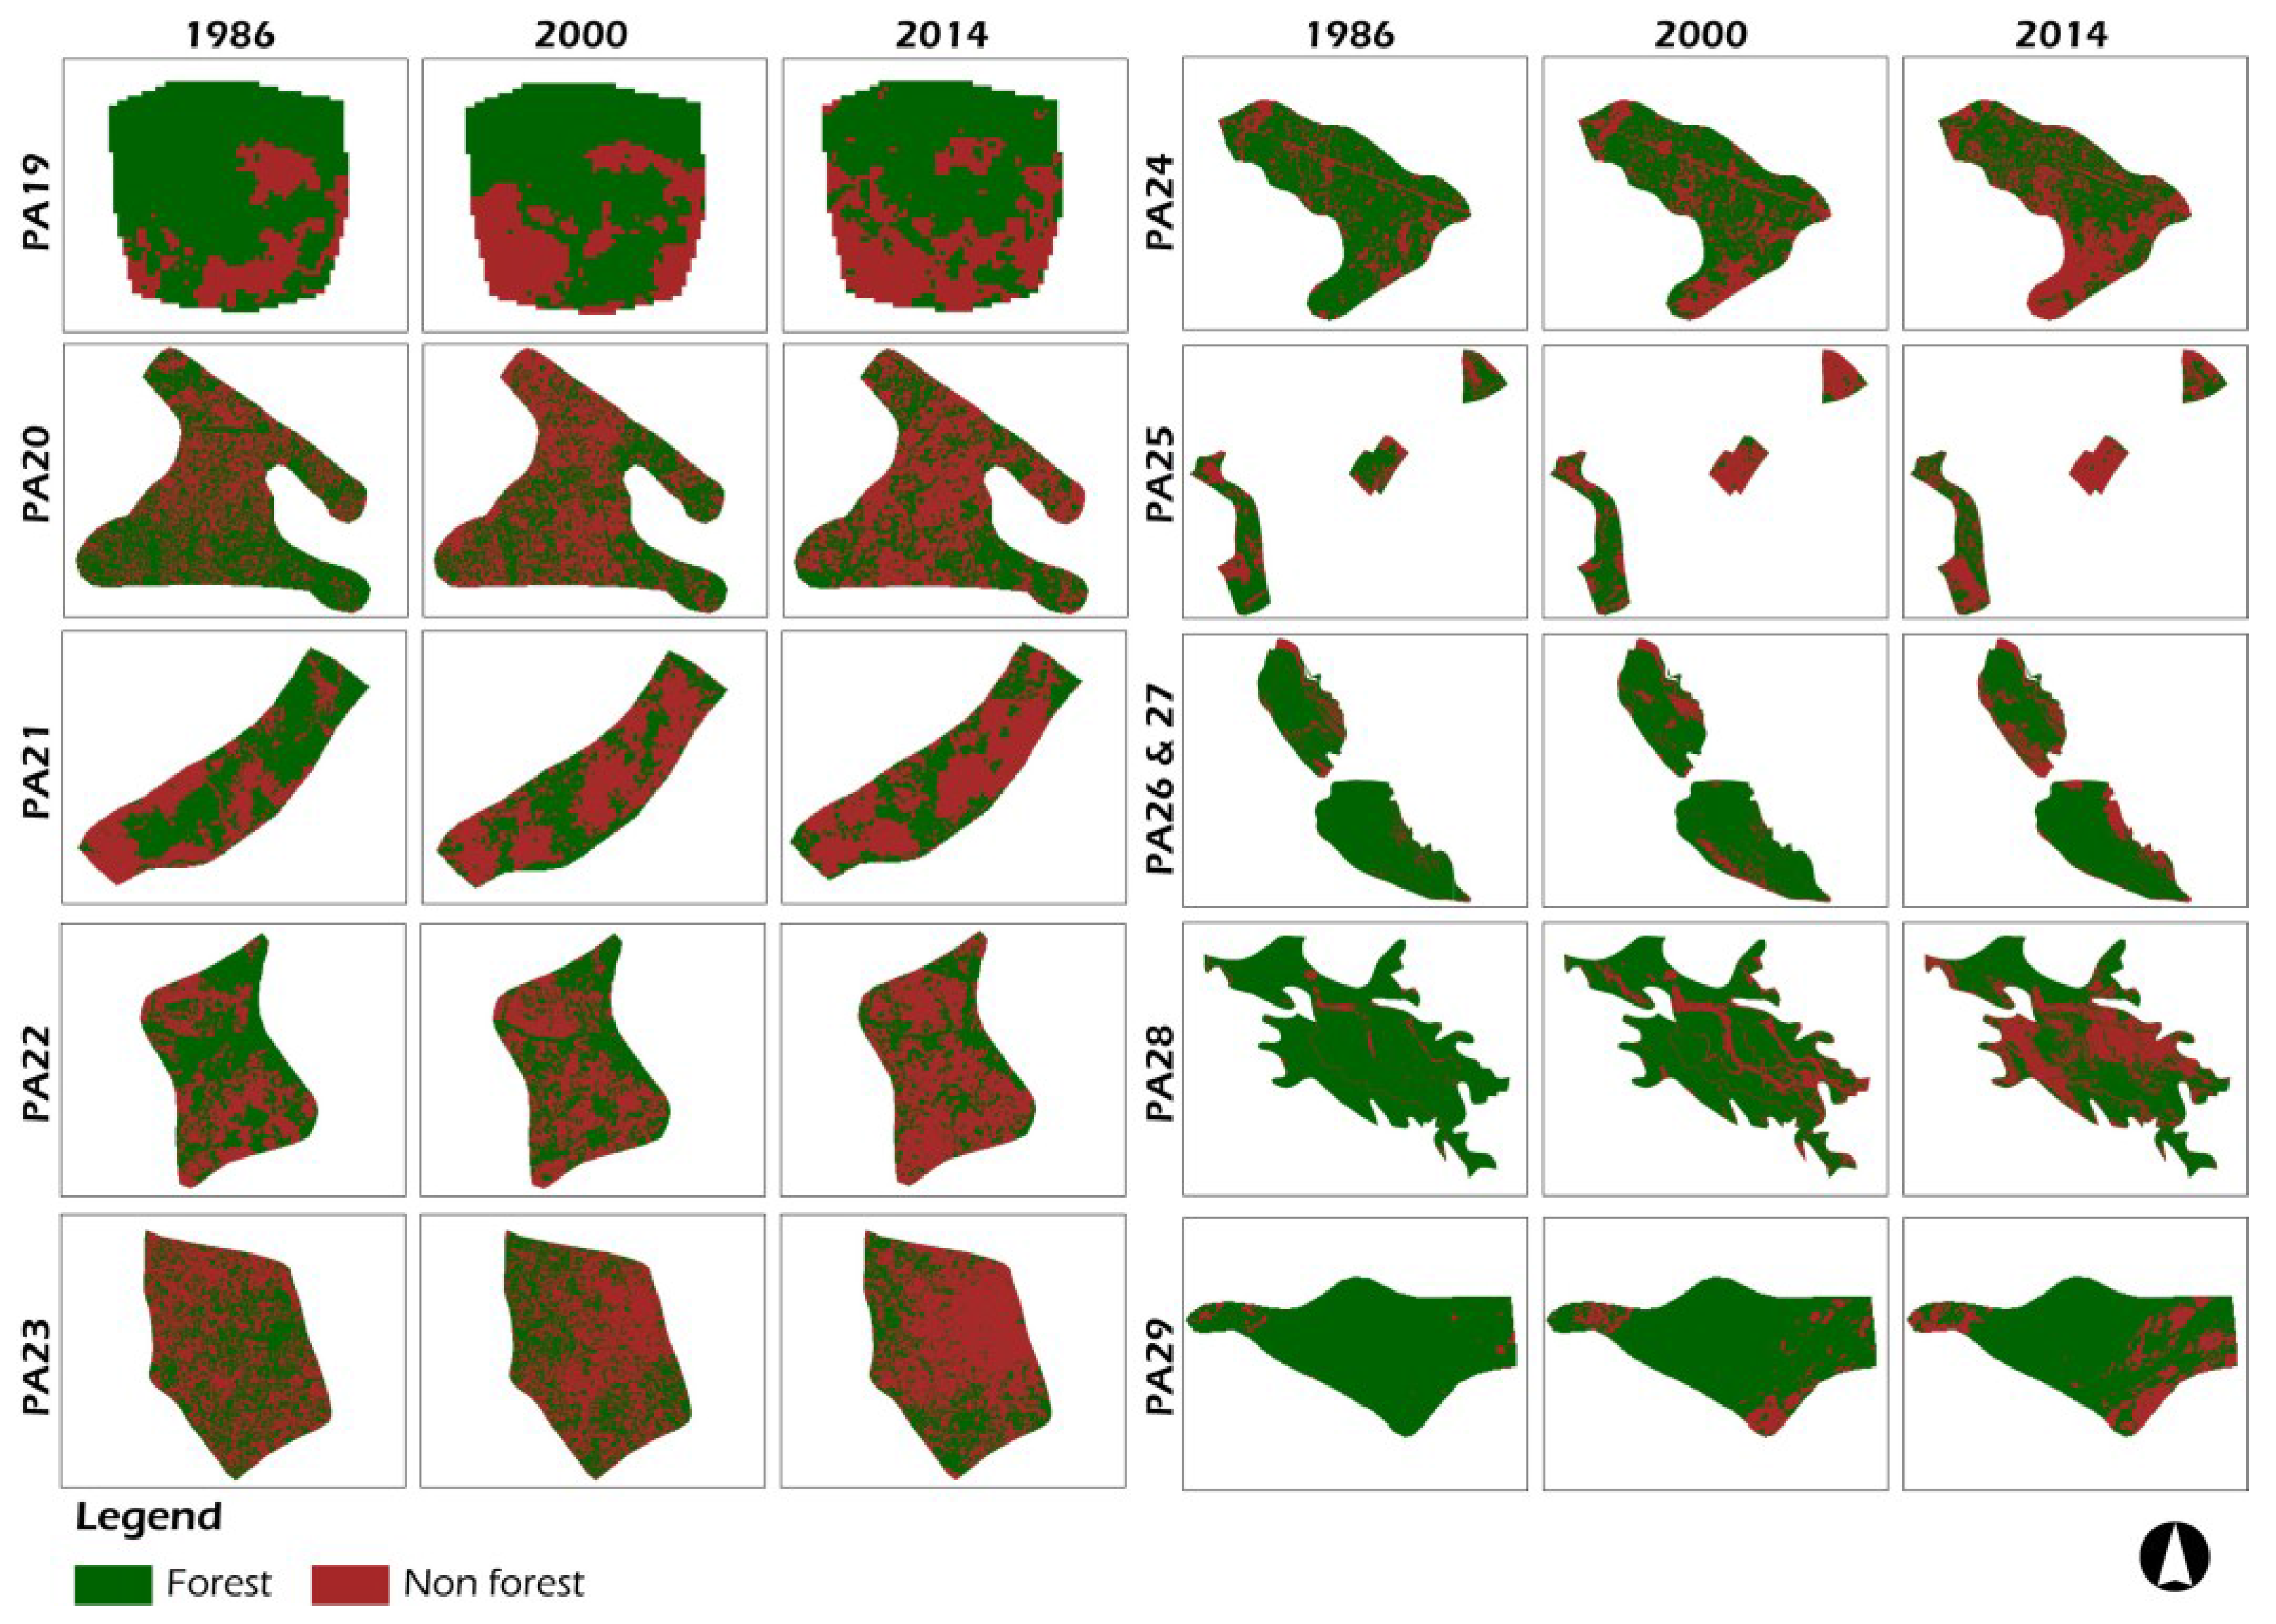
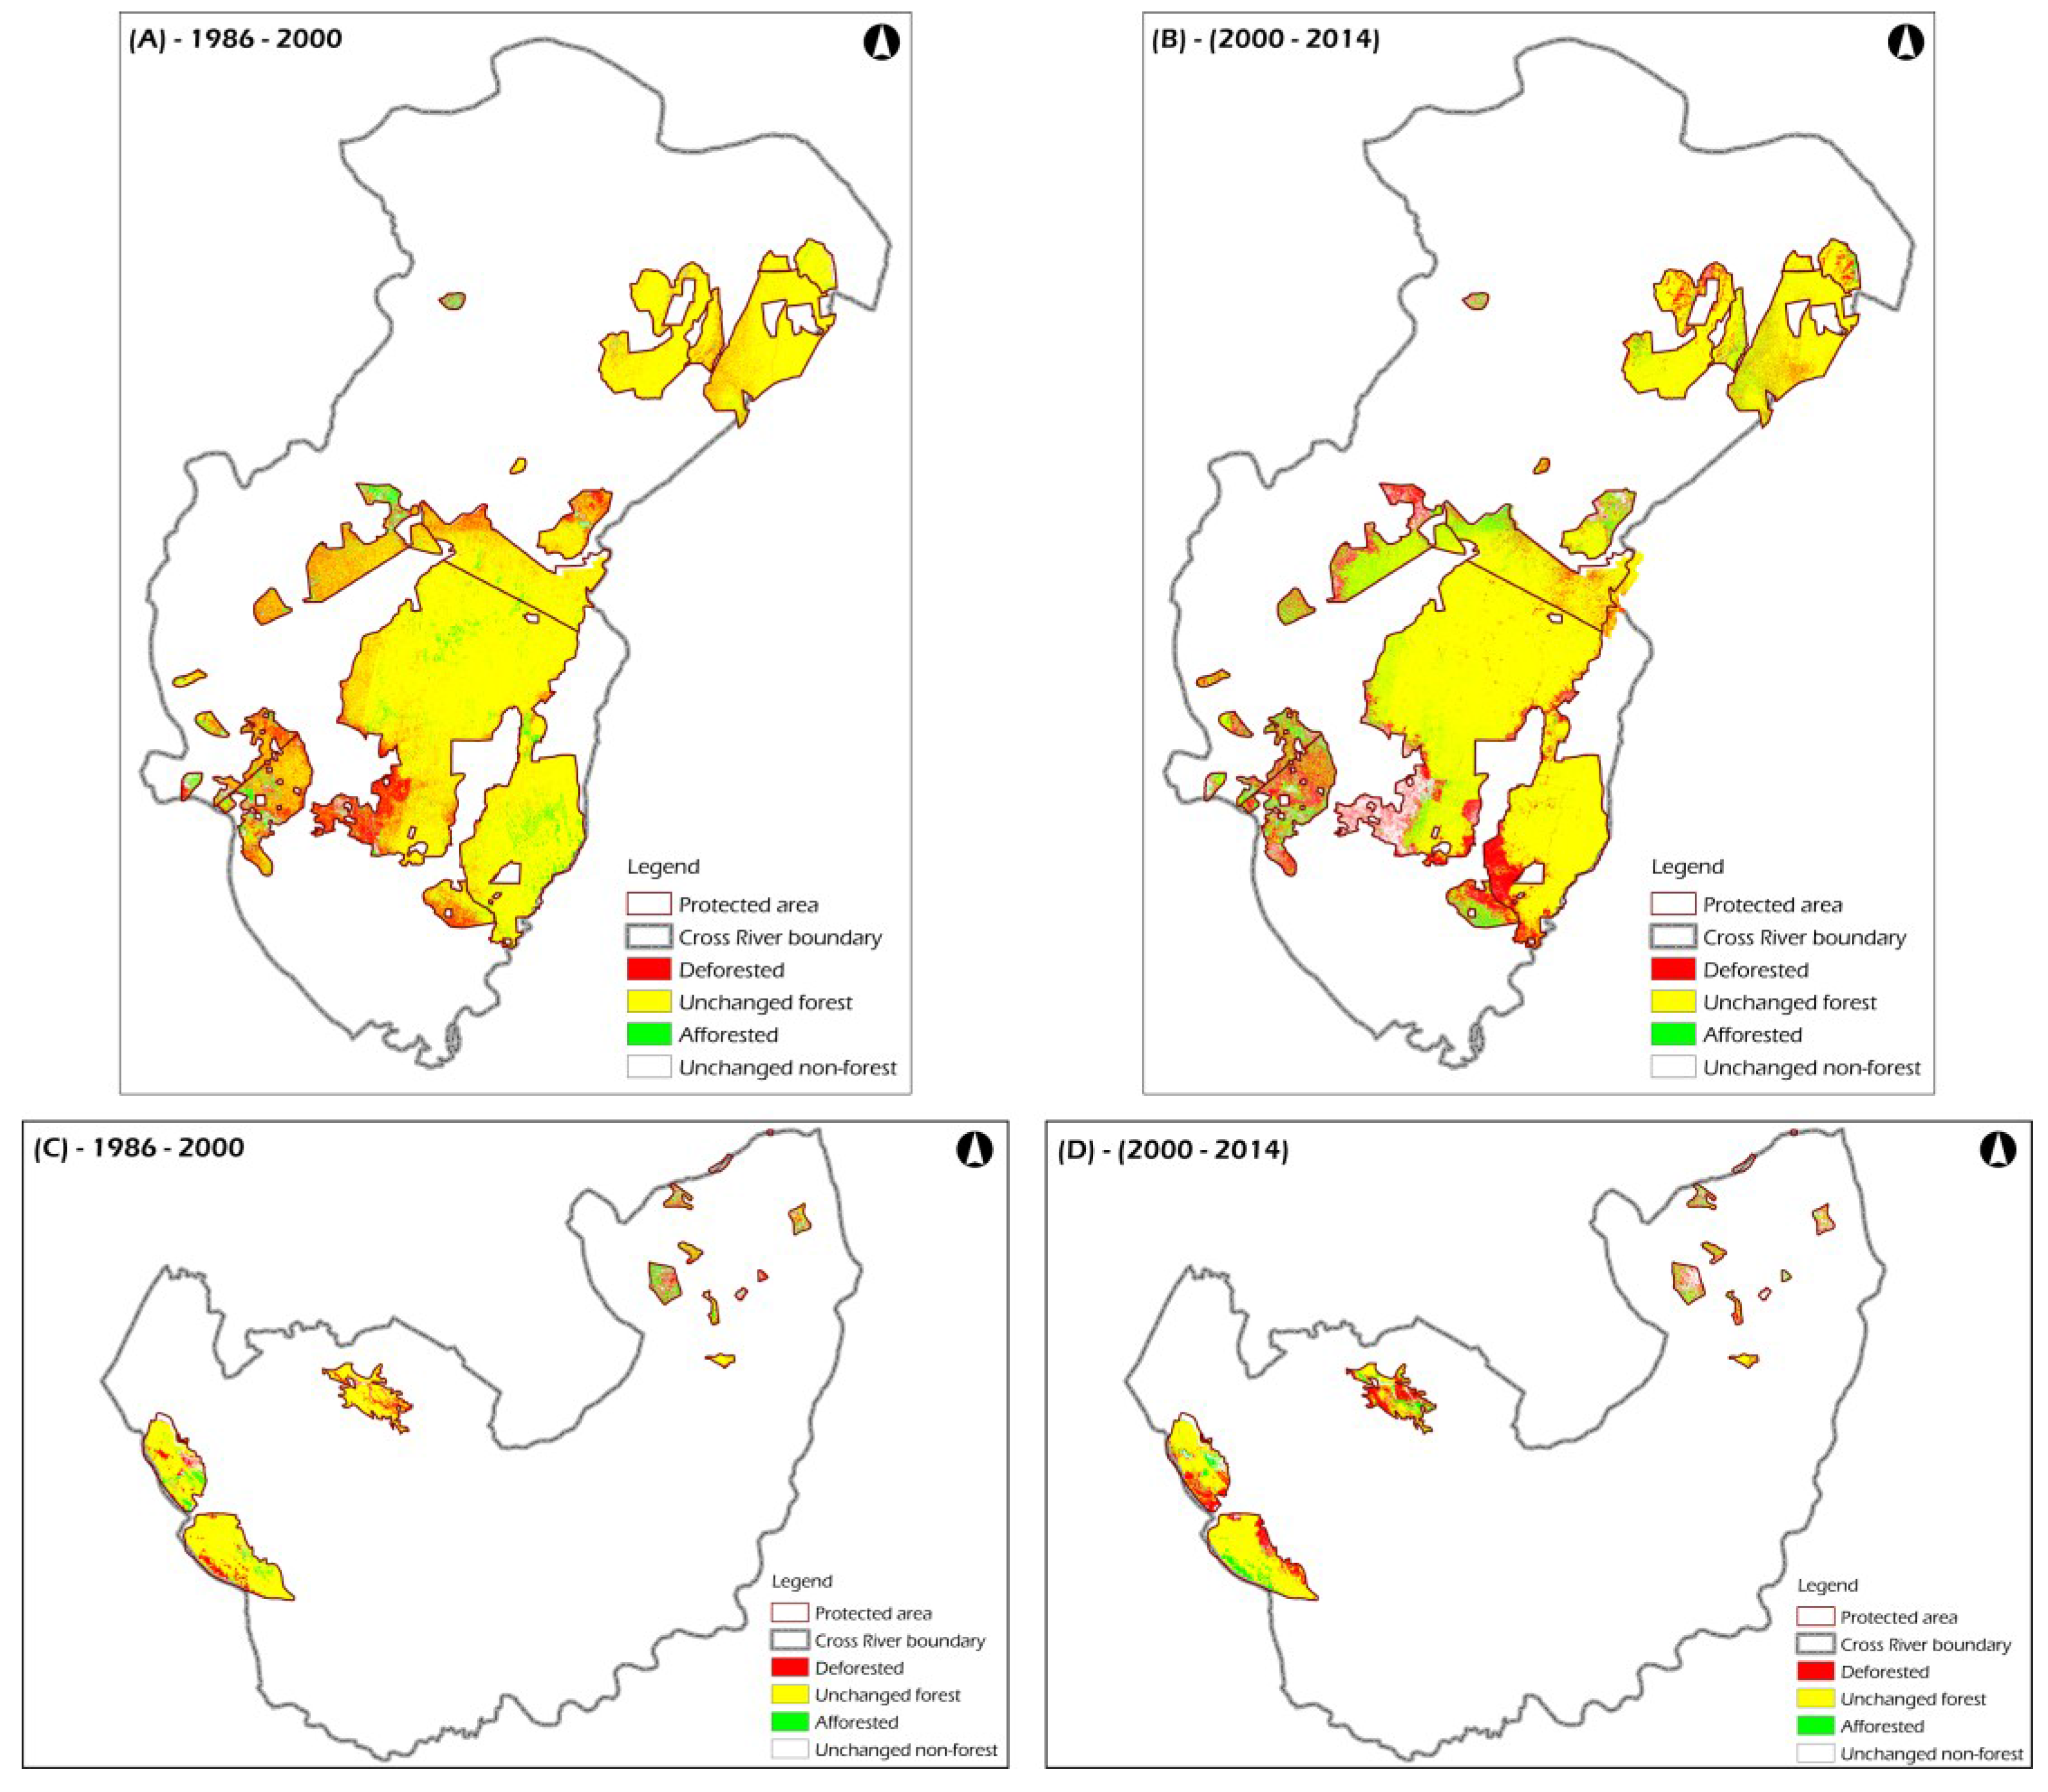
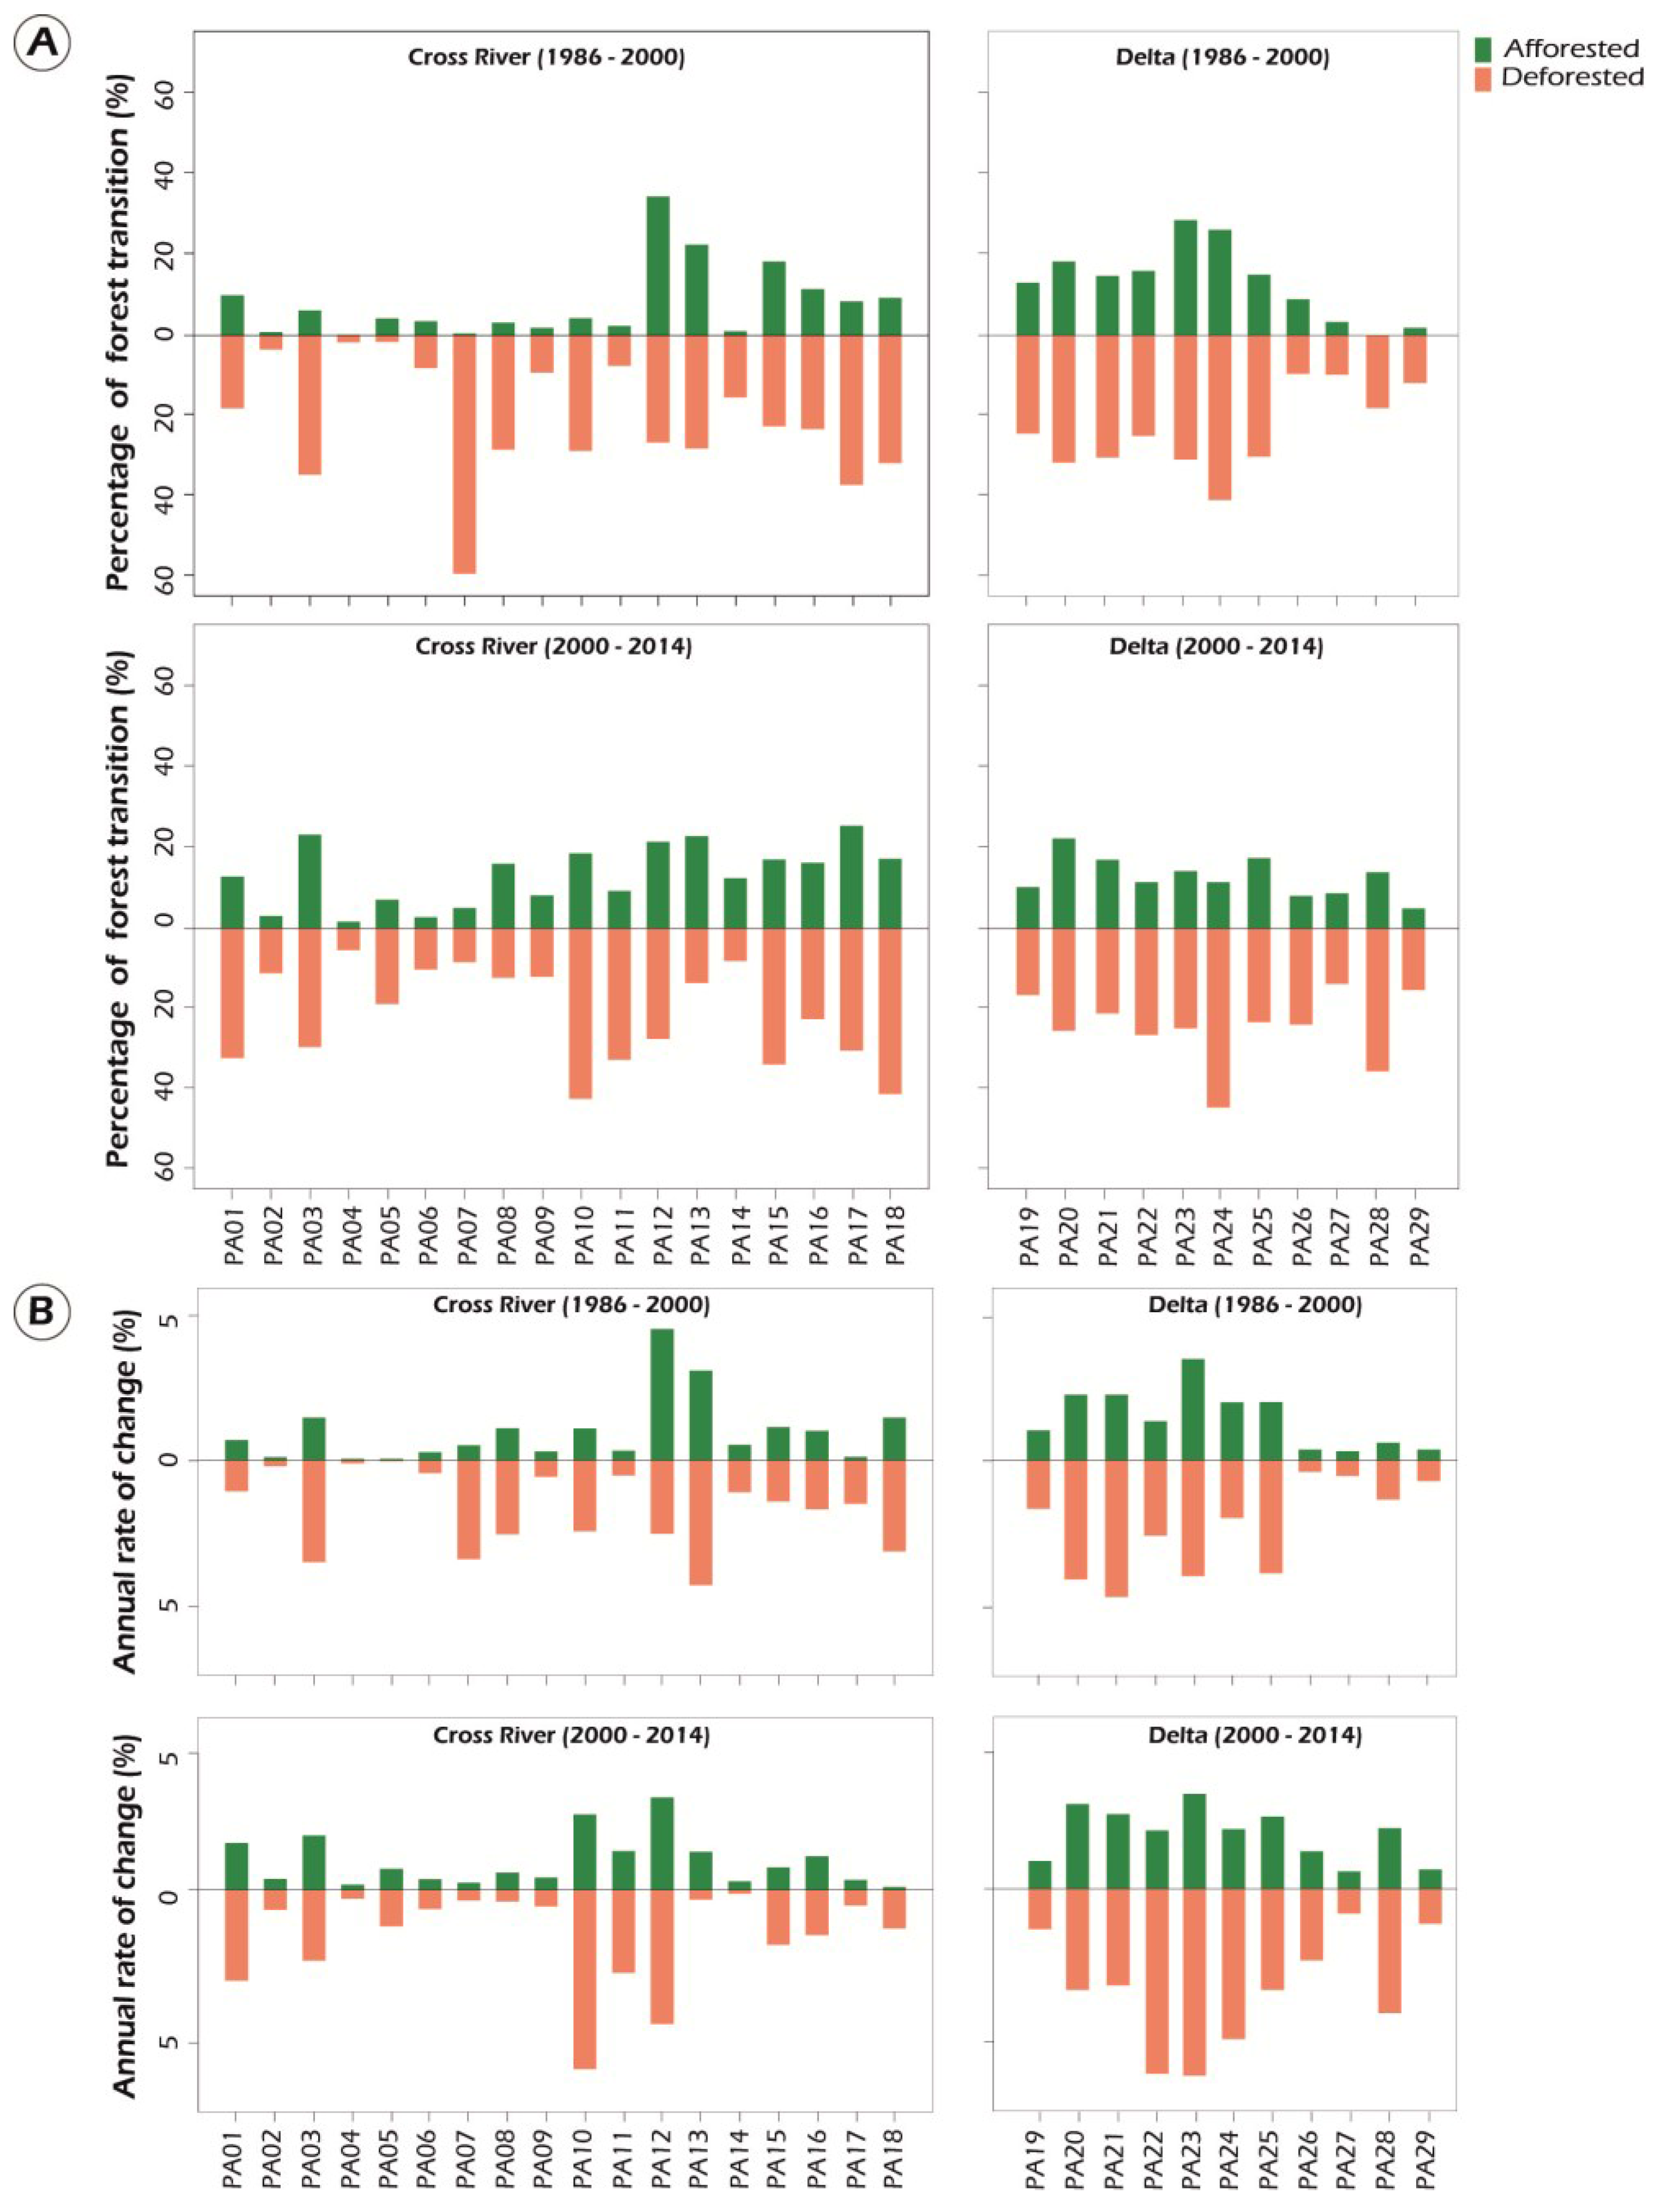
3.2. Forest Cover Transition and Rates of Change

The spatial extent of forest landscape across PAs in both states was determined using image classification techniques applied to multi-temporal satellite data. The total area of forest across PAs in CRS for years 1986, 2000 and 2014 was 535,671 ha, 494,009 ha and 469,684 ha respectively. For DS, the total forest cover of PAs for the same years was 74,631 ha, 68,470 ha and 58,824 ha. Figure 3 and Figure 4 are the forest and non-forest maps of PAs in CRS and DS for years 1986, 2000 and 2014. The forest transition maps for protected areas across CRS and DS over both time periods (1986–2000 and 2000–2014) are presented in Figure 5. Table 4 and Table 5 present results of forest transition analysis and annual rates of change for PAs in CRS and DS. The results showed that for CRS, the percentage of deforested landscape declined from 15% in the first 14-year period (1986–2000) to 13% in the second 14-year period (2000–2014). The percentages of afforested landscape for the same 14-year periods were 3.7% and 6.1% respectively. For DS, the percentages of deforested landscape during the first and second 14-year periods were 14% and 21% respectively. The percentage of afforested landscape for PAs in DS increased from 7% to 10% over the two 14-year periods.
When compared, the overall annual deforestation rate in the first 14-year period (1986–2000) was the same for both states (0.8%). However, the annual deforestation rate of PAs over the second 14-year period (2000–2014) was higher in DS (1.9%) in comparison to CRS, which at 0.7%, was one third of the rate in DS. Figure 6 shows the percentage of forest transition and average annual rates of change across protected areas in CRS and DS from 1986 to 2014. The results show most PAs in CRS and DS experienced a rise in the percentage of forest landscape affected by deforestation over both 14-year periods investigated (Figure 6A and Table 4). In CRS, the PAs with the highest rise in annual deforestation rates over both 14-year periods were PA10 and PA11, with percentage rise of 3.5% and 2.2%. Similarly, the PAs with the highest rise in annual deforestation rates in DS were PA22 and PA24 with percentage rises of 3.5% and 3% over the 14-year periods analysed (Figure 6B, Table 5).
The significant difference in the annual rates of deforestation across PAs in both states between 2000 and 2014 was an indication of the positive effects that conservation efforts across CRS [53] and implementation of government policy have had on forest conservation over the years. CRS has consistently made efforts to implement both federal and state government forest conservation policies. An example of the positive role conservation organisations and local community participation have had in combating deforestation is demonstrated across two PAs (PA7 and PA14) in CRS. These identified PAs, Cross River National Park, Okwangwo division (PA7) and Mbe Mountains (PA14), managed by conservation organisations with local community participation [54,55,56] have experienced decline in the annual deforestation rates over both 14-year periods investigated (Table 4).
Figure 3. Forest and non-forest maps of protected areas in Cross River for 1986, 2000 and 2014.
Environments 02 00500 g003
Figure 4. Forest and non-forest maps of protected areas in Delta state for 1986, 2000 and 2014.
Environments 02 00500 g004
Figure 5. Forest transition maps of protected areas across Cross River (A and B) and Delta states (C and D) for time periods 1986–2000 and 2000–2014.
Environments 02 00500 g005
Table 4. Forest transition and annual rates of change for PAs across Cross River from 1986 to 2014.
Site CodeProtected AreaForest Area (ha)Deforested (ha)Ann. Deforestation Rate (%)Afforested (ha)Ann. Afforestation Rate (%)
1986200020141986–20002000–20141986–20002000–20141986–20002000–20141986–20002000–2014
PA1Achara Ihe1309.41206.2924.8253.9450.630.992.90139.6180.990.641.50
PA2Afi River39,606.538,602.435,6101297.94133.80.190.63293.91141.40.100.35
PA3Agoi3899.42761.82513.31390.71181.73.242.26249.2935.41.361.74
PA4Boshi2479.12440.72351.939.2121.10.100.282.937.890.050.17
PA5Boshi Extension7136.37330.96452.9121.11415.80.031.16315.7537.80.050.67
PA6CRNP (Oban Block)286,099273,160252,70922,572.928,184.50.410.619658.17752.00.260.34
PA7CRNP (Okwangwo)51,429.944,274.143,259.725,591.83601.23.140.34198.72192.940.480.23
PA8Cross River North13,484.510,112.910,621.337831631.62.350.374192145.51.020.55
PA9Cross River South48,703.945,369.943,771.14250.85497.40.530.538483754.90.280.39
PA10Ekinta River10,569.58063.75622.22945.643472.255.724371917.81.012.41
PA11Ikom801.7746.6573.259.1255.70.482.6518.273.00.301.24
PA12Ikrigon574.3685.3600.1414.7427.62.334.28536.6335.24.192.95
PA13Lower Enyong878.8772952.2527.6253.33.970.31422.6430.72.861.22
PA14Mbe Mountain8973.37755.48144.81291.4677.71.020.1287.81047.10.490.27
PA15Obieze-Isu1848.61745.81789.7531.2796.11.301.75432.3404.11.060.72
PA16Ukpon River25,866.522,425.620,621.56746.065311.551.443322.44728.20.941.07
PA17Umon Ndealichi8378.68867.310,393.23487.12843.71.370.50791.62395.70.110.32
PA18Uwet Odot23,63217,688.922,773.28389.510,882.42.891.232458.84578.61.360.09
Total535,671.2494,009.5469,68483,693.473,232.10.830.6820,632.134,589.10.360.37
Table 5. Forest transition and annual rates of change for PAs across Delta from 1986 to 2014.
Site CodeProtected AreaForest Area (ha)Deforested (ha)Ann. Deforestation Rate (%)Afforested (ha)Ann. Afforestation Rate (%)
1986200020141986–20002000–20141986–2000 2000–2014 1986–20002000–20141986–20002000–2014
PA19Inyelen150.8131.1120.242.328.41.531.2922.717.70.950.89
PA20Akumazi1334.61047980.7686.6551.63.793.23399.0485.42.092.71
PA21Ogiopa624.5459.2418.5320.1222.74.353.08155.8180.52.092.38
PA22Niocha1395.51188.4843.1576.4610.72.395.91283.1133.31.251.86
PA23Ute-Ukpu2612.22487.71888.51754.61410.83.685.971630.2811.63.233.03
PA24Nsukwai1150.1977737.5365.8478.11.834.80369.2161.71.851.91
PA25Ogwashi-Uku1381.51054.3936.6655.1505.33.593.23327.9379.71.862.31
PA26Olague18,442.518,31114,903.82067.55156.20.372.281935.91749.10.341.20
PA27Uremure Yokri30,964.729,003.127,476.12977.14186.80.500.791003.12659.80.290.56
PA28Ukpe-Sobo15,204.212,567.69407.12656.75210.71.243.9720.22050.20.561.94
PA29Isheagu1370.81243.41111.5151195.30.661.1123.663.50.340.62
Total535,671.268,469.758,823.612,253.218,556.60.821.926170.48692.50.521.13
Figure 6. (A) Percentage of forest transition and (B) Average annual rates of change across protected areas in Cross River and Delta for (1986–2000) and (2000–2014).
Environments 02 00500 g006

3.3. Changes in Forest Landscape Structure

Table 6 presents the changes in forest landscape structure across PAs in CRS and DS from 1986 to 2014. The extent of forest fragmentation was measured using PLAND, NP, ED, MPA, MSI, MCAI and MESH. The PLAND metric of forest PAs in CRS and DS experienced significant decline over both 14-year periods investigated (i.e., 1986–2000 and 2000–2014). The decline in percentages of forest cover shows dynamics and corresponding impacts on forest landscape spatial structure over both states. The decline in percentage cover of forest landscape (PLAND) corresponds to changes in NPs. In CRS, PLAND metric declined from 94.3% in 1986 to 87.8% in 2000 and 80.5% in 2014. For DS, NP metric increased over both 14-year periods while PLAND metric declined from 83.1% (1986) to 75.7% (2000) and 63.5% (2014). The rise in NP indicates increased fragmentation across forest landscape while reduction signifies forest re-growth or regeneration. In this study, the MPA refers to the average size of patch that corresponds to forest class. A reduction in the MPA indicates more fragmentation in the forest landscape. The results indicate that MPA for CRS and DS decreased between 1986 and 2014, a further indication of forest fragmentation in designated PAs. For PAs in CRS, the ED metric increased from approximately 19 m/ha in 1986 to 76 m/ha in 2000, and further declined to approximately 47 m/ha (Table 6). In DS, ED increased over years 1986, 2000 and 2014 with approximately 39, 40 and 52 m/ha (Table 6). The rise in ED of both states signifies the initial stage of forest fragmentation as indicated in [23]. The MSI for PAs in CRS and DS over 1986, 2000 and 2014 were greater than one, signifying that the average patch shape of forest classes were irregular [23,49]. The irregularity of forest cover raster cells analysed indicates occurrence of forest fragmentation in CRS and DS from 1986 to 2014.
The MCAI signifies the average core area of patches that correspond to forest class. A main effect of fragmentation to landscapes is the conversion of interior habitat to edge habitat. The amount of core area is expected to decrease as a result of fragmentation. In this study, the MCAI metric for CRS and DS declined over 1986 to 2014 indicating high levels of forest fragmentation. The effective mesh size landscape metric (MESH) shows the possibility of any randomly selected clusters within a region to be connected or not. The MESH metric for both states declined over 1986 to 2014, indicating intensified forest fragmented across designated PAs. Overall, results of landscape metrics indicate the forest landscapes in PAs for both states were highly fragmented over the period analysed.
The process of land-cover change as demonstrated in this study and others [23,52] has long-term effects on the structure of forest habitats and the continued existence of dependent wildlife or native plant species. The level of forest fragmentation is a reflection on how well PAs are managed and dependent wildlife is conserved. An example is demonstrated in Niocha FR (PA22) situated along the east-west road of DS. PA22 (with the highest annual deforestation rate of approximately 6%) is affected by combined pressures from intensified agriculture, unsupervised urbanisation, road access within the reserve, and rising populations from surrounding communities. These factors have resulted in the disturbance of the southern part of the reserve and experienced high levels of forest fragmentation (Figure 7A,B).
Table 6. Results of landscape metrics used in study for Cross River and Delta from 1986 to 2014.
MetricsCross River Delta
198620002014 198620002014
Percentage of forest landscape (%)94.387.880.5 83.175.763.5
Number of patches298513,69411,036 139418323706
Effective Mesh Size (× 1000 ha)250223182 151310
Edge Density (m / ha) 1976.446.7 394052
Mean Patch Area (ha)179.335.641.7 53.7237.2415.46
Mean Shape Index (MSI)1.281.301.29 1.381.311.29
Mean Core Area Index (%)169.928.936.5 48.13013
Figure 7. Map showing disturbed forest landscape within Niocha forest reserve (PA22) in Delta state for (A) 2002 and (B) 2014. (Source: “Niocha forest reserve, Delta state”. 6°17′08.77″ N, 6°37′27.60″ E. Google Earth. 5 July 2015).
Environments 02 00500 g007

4. Conclusions

Despite the importance and significance of PAs in forest conservation, the understanding of their current status and distribution across the Niger Delta is inadequate. In response to this gap, we have demonstrated the usefulness of utilising medium resolution satellite imagery, aerial photographs and ground data to map the distribution changes and structure of forest PAs across parts of the Niger Delta. The study provides vital baseline results on forest transition across PAs in CRS and DS for years 1986, 2000 and 2014. The annual deforestation rates for PAs across both states from 1986 to 2000 were the same (0.8%). However, this uniform deforestation rate changed between 2000 and 2014 with DS experiencing deforestation rates (1.9%) that are three times higher than the rates in CRS (0.7%). The results of landscape fragmentation analysis showed that forest habitats across PAs in both states experienced intensified levels of fragmentation.
These results are a wake up call for the Nigerian government and other key stakeholders involved in forest conservation (particularly NGOs, interested parties, and local communities) to intensify conservation efforts of forest PAs nationwide. The place of local community participation and government policy implementation to the long-term conservation of PAs cannot be over emphasised. The decline in annual rates of deforestation across PAs in CRS was influenced by the combined roles of conservation organisations, local community participation, and designated government organisations.
In conclusion, we have generated valuable information on the current extent, distribution, and structure of forest landscapes of designated PAs in the Niger Delta using remote sensing. With such baseline data, forest conservation programmes aimed at combating threats from deforestation and promoting conservation would have access to current and localised baseline data required for successful programme implementation (such as UN-REDD, Conservation Organisation etc.).

Acknowledgments

The authors would like to appreciate the National Space Research and Development Agency (NASRDA) for providing the NigeriaSat-2 and UK-DMC-2 satellite images used in the study.

Author Contributions

Alex Onojeghuo processed and analysed the satellite images used in the study. The manuscript was prepared by Alex Onojeghuo and reviewed by Ajoke Onojeghuo. Ajoke greatly contributed to the discussion and compilation of results in this manuscript.

Conflicts of Interest

The authors declare no conflict of interest.

References

  1. World Bank. Defining an Environmental Development Strategy for the Niger Delta; World Bank: Washington, DC, USA, 1995. [Google Scholar]
  2. NDES. Niger Delta Environmental Survey Phase 1 Report: Volume I—Environmental and Socio-Economic Characteristics; Environmental Resources Managers Limited: Lagos, Nigeria, 1997. [Google Scholar]
  3. Kinako, P.D. Conserving the mangrove forest of the Niger Delta. Biol. Conserv. 1977, 11, 35–39. [Google Scholar] [CrossRef]
  4. Onojeghuo, A.O.; Blackburn, G.A. Forest transition in an ecologically important region: Patterns and causes for landscape dynamics in the Niger Delta. Ecol. Indic. 2011, 11, 1437–1446. [Google Scholar] [CrossRef]
  5. Amelung, T.; Diehl, M. Deforestation of Tropical Rain Forests. Economic Causes and Impact on Development; J.C.B. Mohr Publisher: Tübingen, Germany, 1992. [Google Scholar]
  6. Scheffer, M.; Carpenter, S.; Foley, J.A.; Folke, C.; Walker, B. Catastrophic shifts in ecosystems. Nature 2001, 413, 591–596. [Google Scholar] [CrossRef] [PubMed]
  7. Alongi, D.M. Present state and future of the world’s mangrove forests. Environ. Conserv. 2002, 29, 331–349. [Google Scholar] [CrossRef]
  8. Vitousek, P.M.; Mooney, H.A.; Lubchenco, J.; Melillo, J.M. Human domination of earth’s ecosystems. Science 1997, 277, 494–499. [Google Scholar] [CrossRef]
  9. Foley, J.A.; DeFries, R.; Asner, G.P.; Barford, C.; Bonan, G.; Carpenter, S.R.; Chapin, F.S.; Coe, M.T.; Daily, G.C.; Gibbs, H.K. Global consequences of land use. Science 2005, 309, 570–574. [Google Scholar] [CrossRef] [PubMed]
  10. Andam, K.S.; Ferraro, P.J.; Pfaff, A.; Sanchez-Azofeifa, G.A.; Robalino, J.A. Measuring the effectiveness of protected area networks in reducing deforestation. Proc. Natl. Acad. Sci. U. S. A. 2008, 105, 16089–16094. [Google Scholar] [CrossRef] [PubMed]
  11. IUCN. Guidelines for Applying Protected Area Management Categories; IUCN: Fontainebleau, France, 2008. [Google Scholar]
  12. Elias, M.; Hensel, O.; Richter, U.; Hülsebusch, C.; Kaufmann, B.; Wasonga, O. Land conversion dynamics in the Borana rangelands of Southern Ethiopia: An integrated assessment using remote sensing techniques and field survey data. Environments 2015, 2, 1–31. [Google Scholar] [CrossRef]
  13. Mondal, M.S.; Sharma, N.; Kappas, M.; Garg, P. Critical assessment of land use land cover dynamics using multi-temporal satellite images. Environments 2015, 2, 61–90. [Google Scholar] [CrossRef]
  14. Borrelli, P.; Modugno, S.; Panagos, P.; Marchetti, M.; Schütt, B.; Montanarella, L. Detection of harvested forest areas in Italy using Landsat imagery. Appl. Geogr. 2014, 48, 102–111. [Google Scholar] [CrossRef]
  15. Hansen, M.C.; Potapov, P.V.; Moore, R.; Hancher, M.; Turubanova, S.; Tyukavina, A.; Thau, D.; Stehman, S.; Goetz, S.; Loveland, T. High-resolution global maps of 21st-century forest cover change. Science 2013, 342, 850–853. [Google Scholar] [CrossRef] [PubMed]
  16. Curran, L.M.; Trigg, S.N.; McDonald, A.K.; Astiani, D.; Hardiono, Y.; Siregar, P.; Caniago, I.; Kasischke, E. Lowland forest loss in protected areas of Indonesian Borneo. Science 2004, 303, 1000–1003. [Google Scholar] [CrossRef] [PubMed]
  17. Giriraj, A.; Babar, S.; Reddy, C.S. Monitoring of forest cover change in Pranahita Wildlife Sanctuary, Andhra Pradesh, India using remote sensing and GIS. J. Environ. Sci. Technol. 2008, 1, 73–79. [Google Scholar]
  18. Htun, N.Z.; Mizoue, N.; Kajisa, T.; Yoshida, S. Deforestation and forest degradation as measures of Popa Mountain Park (Myanmar) effectiveness. Environ. Conserv. 2009, 36, 218–224. [Google Scholar] [CrossRef]
  19. Liu, J.; Linderman, M.; Ouyang, Z.; An, L.; Yang, J.; Zhang, H. Ecological degradation in protected areas: The case of Wolong Nature Reserve for giant pandas. Science 2001, 292, 98–101. [Google Scholar] [CrossRef] [PubMed]
  20. Kouki, J.; Löfman, S.; Martikainen, P.; Rouvinen, S.; Uotila, A. Forest fragmentation in Fennoscandia: Linking habitat requirements of wood-associated threatened species to landscape and habitat changes. Scand. J. For. Res. 2001, 16, 27–37. [Google Scholar] [CrossRef]
  21. Tabarelli, M.; Mantovani, W.; Peres, C.A. Effects of habitat fragmentation on plant guild structure in the Montane Atlantic forest of Southeastern Brazil. Biol. Conserv. 1999, 91, 119–127. [Google Scholar] [CrossRef]
  22. DeFries, R.; Hansen, A.; Newton, A.C.; Hansen, M.C. Increasing isolation of protected areas in tropical forests over the past twenty years. Ecol. Appl. 2005, 15, 19–26. [Google Scholar] [CrossRef]
  23. Midha, N.; Mathur, P. Assessment of forest fragmentation in the conservation priority Dudhwa landscape, India using fragstats computed class level metrics. J. Indian Soc. Remote Sens. 2010, 38, 487–500. [Google Scholar] [CrossRef]
  24. Nagendra, H.; Lucas, R.; Honrado, J.P.; Jongman, R.H.G.; Tarantino, C.; Adamo, M.; Mairota, P. Remote sensing for conservation monitoring: Assessing protected areas, habitat extent, habitat condition, species diversity, and threats. Ecol. Indic. 2013, 33, 45–59. [Google Scholar] [CrossRef]
  25. Girvetz, E.H.; Thorne, J.H.; Berry, A.M.; Jaeger, J.A. Integration of landscape fragmentation analysis into regional planning: A statewide multi-scale case study from California, USA. Landsc. Urban Plan. 2008, 86, 205–218. [Google Scholar] [CrossRef]
  26. Carranza, M.L.; Frate, L.; Acosta, A.T.; Hoyos, L.; Ricotta, C.; Cabido, M. Measuring forest fragmentation using multitemporal remotely sensed data: Three decades of change in the dry Chaco. Eur. J. Remote Sens. 2014, 47, 793–804. [Google Scholar] [CrossRef]
  27. Wang, X.; Blanchet, F.G.; Koper, N. Measuring habitat fragmentation: An evaluation of landscape pattern metrics. Methods Ecol. Evol. 2014, 5, 634–646. [Google Scholar] [CrossRef]
  28. Long, J.A.; Nelson, T.A.; Wulder, M.A. Characterizing forest fragmentation: Distinguishing change in composition from configuration. Appl. Geogr. 2010, 30, 426–435. [Google Scholar] [CrossRef]
  29. Neel, M.C.; McGarigal, K.; Cushman, S.A. Behavior of class-level landscape metrics across gradients of class aggregation and area. Landsc.Ecol. 2004, 19, 435–455. [Google Scholar] [CrossRef]
  30. Mmom, P.C.; Arokoyu, S.B. Mangrove forest depletion, biodiversity loss and traditional resources management practices in the Niger Delta, Nigeria. Res. J. Appl. Sci. Eng. Technol. 2010, 2, 28–34. [Google Scholar]
  31. Akani, G.C.; Luiselli, L.; Politano, E. Ecological and conservation considerations on the reptile fauna of the Eastern Niger Delta (Nigeria). Herpetozoa 1999, 11, 141–153. [Google Scholar]
  32. Kehinde, A.; Akande, J.; Ntabe, E. Forest stakeholder’s awareness of reduced impact logging (RIL) in Nigeria and Cameroon. J. Hortic. For. 2009, 1, 176–181. [Google Scholar]
  33. Schoneveld, G.C. The politics of the forest frontier: Negotiating between conservation, development, and indigenous rights in Cross River State, Nigeria. Land Use Policy 2014, 38, 147–162. [Google Scholar] [CrossRef]
  34. CRS. Cross River State of Nigeria Gazette; Ministry of Information: Calabar, Nigeria, 2014.
  35. UN-REDD. Nigeria REDD+ Readiness Programme (2012–2015). Available online: mptf.undp.org/document/download/10974 (accessed on 20 October 2015).
  36. Oyebo, M.; Bisong, F.T.M. A Preliminary Assessment of the Context for REDD in Nigeria. Available online: http://www.gcftaskforce.org/meeting/documents/Nigeria_National_Update_GCF_2011.pdf (accessed on 20 October 2015).
  37. Malingreau, J.; Achard, F.; D’souza, G.; Stibig, H.; D’souza, J.; Estreguil, C.; Eva, H. AVHRR for global tropical forest monitoring: The lessons of the TREES project. Remote Sens. Rev. 1995, 12, 29–40. [Google Scholar] [CrossRef]
  38. ERDAS. ERDAS Imagine 2014; Hexagon Geospatial: Norcross, GA, USA, 2014. [Google Scholar]
  39. Lu, D.; Mausel, P.; Brondizio, E. Assessment of atmospheric correction methods applicable to Amazon Basin IBA research. Int. J. Remote Sens. 2002, 23, 2651–2671. [Google Scholar] [CrossRef]
  40. NASA. Landsat 7 Science Data Users Handbook; NASA: Washington, DC, USA, 2000.
  41. Huang, C.; Wylie, B.; Yang, L.; Homer, C.; Zylstra, G. Derivation of a tasselled cap transformation based on Landsat 7 at-satellite reflectance. Int. J. Remote Sens. 2002, 23, 1741–1748. [Google Scholar] [CrossRef]
  42. Iqbal, M. An Introduction to Solar Radiation; Elsevier: Amsterdam, Netherlands, 2012. [Google Scholar]
  43. Chander, G.; Markham, B.L.; Helder, D.L. Summary of current radiometric calibration coefficients for Landsat MSS, TM, ETM+, and EO-1 ALI sensors. Remote Sens. Environ. 2009, 113, 893–903. [Google Scholar] [CrossRef]
  44. Ball, G.H.; Hall, D.J. ISODATA, a Novel Method of Data Analysis and Pattern Classification; SRI: Menlo Park, CA, USA, 1965. [Google Scholar]
  45. Smith, P.; Bustamante, M.; Ahammad, H.; Clark, H.; Dong, H.; Elsiddig, E.A.; Haberl, H.; Harper, R.; House, J.; Jafari, M.; et al. Agriculture, forestry and other land use (AFOLU). In Climate Change 2014: Mitigation of Climate Change. Contribution of working group III to the Fifth Assessment Report of the Intergovernmental Panel on Climate Change; Cambridge University Press: Cambridge, UK, 2014. [Google Scholar]
  46. IDRISI. IDRIS Selva Version 17; Clark University: Worcester, MA, USA, 2014. [Google Scholar]
  47. Armenteras, D.; Rudas, G.; Rodriguez, N.; Sua, S.; Romero, M. Patterns and causes of deforestation in the Colombian Amazon. Ecol. Indic. 2006, 6, 353–368. [Google Scholar] [CrossRef]
  48. Lele, N.; Joshi, P. Analyzing deforestation rates, spatial forest cover changes and identifying critical areas of forest cover changes in North-East India during 1972–1999. Environ. Monit. Assess. 2009, 156, 159–170. [Google Scholar] [CrossRef] [PubMed]
  49. McGarigal, K.; Cushman, S.A.; Neel, M.C.; Ene, E. Fragstats: Spatial Pattern Analysis Program for Categorical Maps. Available online: http://www.umass.edu/landeco/research/fragstats/documents/fragstats_documents.html (accessed on 20 October 2015).
  50. Corry, R.C.; Nassauer, J.I. Limitations of using landscape pattern indices to evaluate the ecological consequences of alternative plans and designs. Landsc. Urban Plan. 2005, 72, 265–280. [Google Scholar] [CrossRef]
  51. Botequilha Leitão, A.; Ahern, J. Applying landscape ecological concepts and metrics in sustainable landscape planning. Landsc. Urban Plan. 2002, 59, 65–93. [Google Scholar] [CrossRef]
  52. Batistella, M.; Robeson, S.; Moran, E.F. Settlement design, forest fragmentation, and landscape change in Rondônia, Amazônia. Photogramm. Eng. Remote Sens. 2003, 69, 805–812. [Google Scholar] [CrossRef]
  53. Chhatre, A.; Agrawal, A. Trade-offs and synergies between carbon storage and livelihood benefits from forest commons. Proc. Natl. Acad. Sci. U. S. A. 2009, 106, 17667–17670. [Google Scholar] [CrossRef] [PubMed]
  54. Imong, I.; Eban, J.; Mengnjo, C. Using technology to save Gorillas in the Mbe Mountains. Gorilla J. 2014, 48, 15–17. [Google Scholar]
  55. Eban, J. Annual Cybertracker Report: 2014 Mbe Mountains; Wildlife Conservation Society: Calabar, Nigeria, 2014. [Google Scholar]
  56. Ite, U.E.; Adams, W.M. Forest conversion, conservation and forestry in Cross River State, Nigeria. Appl. Geogr. 1998, 18, 301–314. [Google Scholar]

