4.1. Geographical Characteristics of Resettled Villages in Laos
Among a total of 8643 villages in Laos, the LCA2011 reported 872 villages to have been resettled between 2000 and 2011. This represents 11.2% of all villages in Laos. On average, new sites of resettled villages are still located at higher altitudes and further away from district centers than non-resettled villages (
Table 2). One can also observe that resettled villages have a greater forest cover than the national village average. Finally, the location of resettled villages (
Figure 2) shows a general concentration of resettled villages in mountainous and forested areas. Since high forest cover and higher altitudes are also characteristics of shifting cultivation villages, these observations suggest a clear link between resettlements, upland settlements, and shifting cultivation.
Table 2 also shows that the total forest loss per village (in ha) between 2000 and 2012 is higher in resettled than in non-resettled villages, though this must be related to resettled villages having larger areas and higher baseline forest cover. When considered relative to baseline forest cover, forest loss is lower in resettled than in non-resettled villages.
Table 2.
Characteristics of resettled vs. non-resettled villages in Laos.
Table 2.
Characteristics of resettled vs. non-resettled villages in Laos.
| Villages | Non-Resettled | Resettled (2000–2011) | No Information |
|---|
| Number of villages | 7752 | 872 | 19 |
| Altitude (mean) | 524 | 785 | 402 |
| Travel time to district capital (hours, mean) | 3.9 | 6.6 | 4.1 |
| Area (ha, mean) | 2560 | 3547 | 2534 |
| Forested area in 2000 (ha, mean) | 1980 | 3222 | 1816 |
| Forest cover in % (2000) | 56.9 | 82.7 | 55.5 |
| Forest loss 2000–2012 (ha, mean) | 122 | 207 | 133 |
| Forest loss in % of 2000 cover (mean) | 11.1 | 9.9 | 9.3 |
There are differences in the proportion of resettled villages by province. Please note that the list and map of Lao provinces corresponds to the situation in December 2012, and thus does not include the province of Xaisombum, created December 2013. Most provinces along the lower Mekong (Vientiane, Savannakhet, and Champasak provinces) have experienced fewer resettlements. On the other hand, resettlements appear to be especially relevant in the whole Northern region of the country, as well as in the far South-East. In two provinces of each of these two regions, more than 20% of all villages were resettled between 2000 and 2011.
Table 3 examines the relationships between resettled villages and reported change in living conditions as assessed by the LCA2011. Though most villages report better living conditions, the proportion of villages reporting no change or a decline in living conditions is slightly higher (10% for each category) in resettled villages than in non-resettled villages (7%). On the other hand, the proportion of villages reporting the existence of shifting cultivation is also higher (27%) in resettled villages than in non-resettled villages (15%).
Figure 2.
New site location of resettled villages between 2000 and 2011 in Laos.
Figure 2.
New site location of resettled villages between 2000 and 2011 in Laos.
Table 3.
Living conditions and presence of shifting cultivation practices in resettled and non-resettled villages.
Table 3.
Living conditions and presence of shifting cultivation practices in resettled and non-resettled villages.
| | Living Conditions | Shifting Cultivation Practiced |
|---|
| | Improved | Stayed Same | Declined | No answer | No | Yes | No Answer |
|---|
| Resettled villages | 80% | 10% | 10% | 0% | 73% | 27% | 0% |
| Not resettled villages | 85% | 7% | 7% | 0.2% | 84% | 15% | 1% |
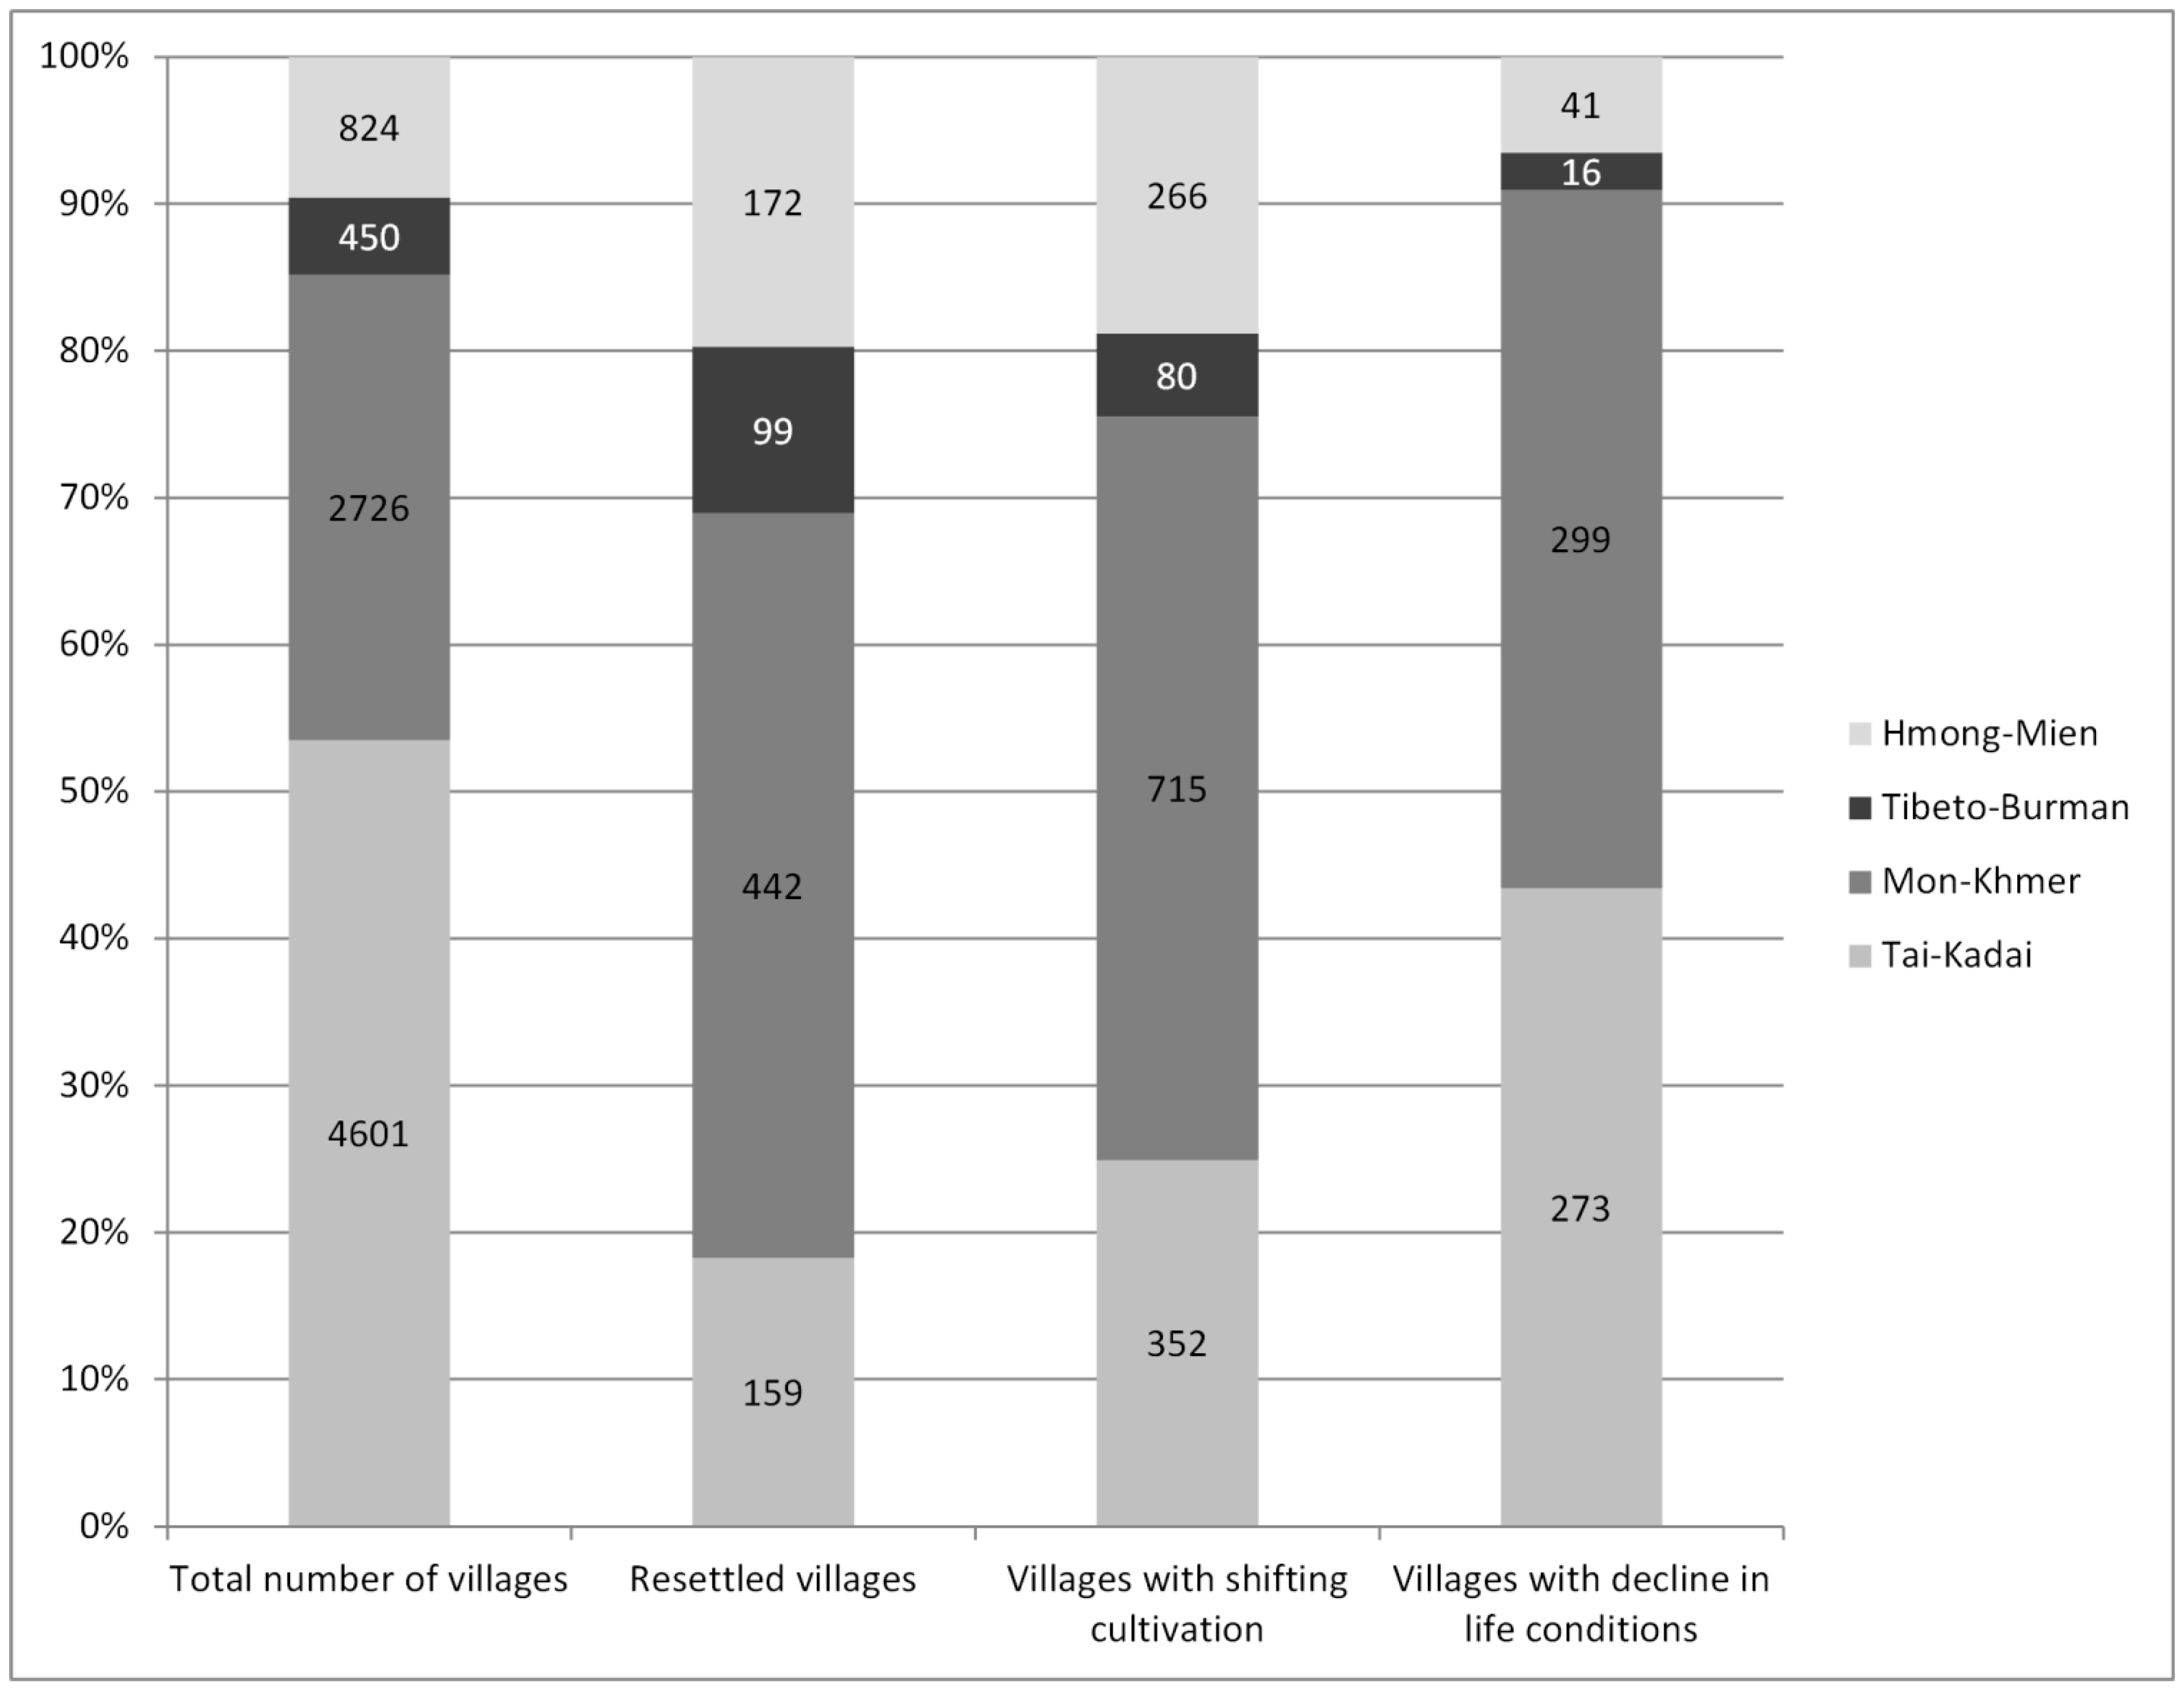
Figure 3 shows the distribution of resettled villages as well as villages reported to practice shifting cultivation and to have experienced a decline in living conditions, in relation to the aggregated four ethnolinguistic families. Resettled villages exist among the four main ethnolinguistic families. However, minorities (non-Tai-Kadai) are indeed clearly overrepresented in resettled villages. About 50% of resettled villages but only 30% of all villages have populations dominated by Mon-Khmer ethnic groups. Inversely, only 20% of resettled villages but more than 50% of all villages are dominated by Tai-Kadai groups.
Villages where shifting cultivation still exists are also mostly predominantly populated with ethnic minorities in about 75% of the cases. There, Mon-Khmer and Hmong-Mien have a larger contribution to the total number of villages with shifting cultivation than in most villages, but this is not the case for Tibeto-Burman groups.
Decline in living conditions is not a characteristic of villages dominated by ethnic minorities only, with 40% of villages reporting declining living conditions dominated by Tai-Kadai groups. However, Mon-Khmer groups are also relatively overrepresented in villages with declining living conditions. Hmong-Mien and Tibeto-Burman show the inverse trend, with a lower proportion of villages experiencing declining living conditions as compared to all villages overall.
Figure 3.
Distribution of resettled villages and their characteristics in relation with aggregated ethnolinguistic families.
Figure 3.
Distribution of resettled villages and their characteristics in relation with aggregated ethnolinguistic families.
4.2. Forest Cover Change in Laos
According to our analysis of the Hansen
et al. [
13] dataset, 79.15% of the whole territory of Laos exhibited tree cover of 50% or more by 2000. Between 2000 and 2012, 1.13 Million hectares of these areas lost their forest cover, which represents an annual forest cover loss rate of 0.52%. Meanwhile, there were 0.3 Million hectares of observed gained forest, and 0.15 Million hectares with both gain and loss of forests from 2000 to 2012.
Figure 4 shows forest cover, loss and gain by province, derived from the Hansen
et al. [
13] dataset. Many Northern provinces still have significant forest cover. The largest amount of lost forest can be found in the provinces of Houaphan, Bolikhamxai, Vientiane, Luang Prabang and Luang Namtha. On the other hand, Houaphan and Luang Prabang show the largest amount of forest regrowth. In general, Northern provinces show both high forest loss and forest gain.
When related to the dominant aggregated ethnolinguistic families by village (
Table 4), forest cover in 2000 appears to be clearly higher in villages dominated by ethnic minorities, with statistically significant (
p < 0.05) differences between Tai-Kadai as well as Tibeto-Burman villages and all other groups. Mon-Khmer and Hmong-Mien dominated villages show similar forest covers, while the highest forest cover occurs in Tibeto-Burman dominated villages. Forest cover loss occurs in all categories of villages by ethnolinguistic families. However, the overall difference in total forest loss with relation to ethnolinguistic families was not significant at
p < 0.05 level, suggesting that the variability in forest cover change is higher within ethnolinguistic families than among them. Though variable at the village level, the average forest loss rate appears to be higher in villages dominated by Tai-Kadai groups, with 13% forest loss between 2000 and 2012, taking into account that these villages also had lower forest cover in 2000. In general, Tai-Kadai dominated villages have higher population densities. Unfortunately, since only one category—the “main” ethnicity by village—was listed in the LCA2011 database, we have no information on ethnic representation within the villages.
Figure 4.
Forest cover change by province in Laos.
Figure 4.
Forest cover change by province in Laos.
Table 4.
Aggregated ethnolinguistic families and forest cover change.
Table 4.
Aggregated ethnolinguistic families and forest cover change.
| 4a. Average Forest Area and Loss of Villages by Main Ethnolinguistic Family |
| | Proportion of Forested area in 2000 (%, Mean) | Forest Loss (% 2000–2012, Mean) | Number of Villages |
| Tai-Kadai | 43 | 13 | 4601 |
| Mon-Khmer | 77 | 9 | 2726 |
| Tibeto-Burman | 87 | 10 | 450 |
| Hmong-Mien | 78 | 10 | 824 |
| 4b. Significance Matrix of Differences in Proportion of Forested Area according to Ethnolinguistic Families |
| | Tai-Kadai | Mon-Khmer | Tibeto-Burman | Hmong-Mien |
| Tai-Kadai | | 0.00 | 0.00 | 0.00 |
| Mon-Khmer | 0.00 | | 0.00 | 0.554 |
| Tibeto-Burman | 0.00 | 0.00 | | 0.00 |
| Hmong-Mien | 0.00 | 0.554 | 0.00 | |
| 4c. Significance Matrix of Differences in Relative Forest Loss according to Ethnolinguistic Families |
| | Tai-Kadai | Mon-Khmer | Tibeto-Burman | Hmong-Mien |
| Tai-Kadai | | 0.231 | 0.684 | 0.421 |
| Mon-Khmer | 0.231 | | 0.259 | 0.915 |
| Tibeto-Burman | 0.684 | 0.259 | | 0.309 |
| Hmong-Mien | 0.421 | 0.915 | 0.309 | |
4.3. Resettlement and Forest Cover Change
Table 5 and
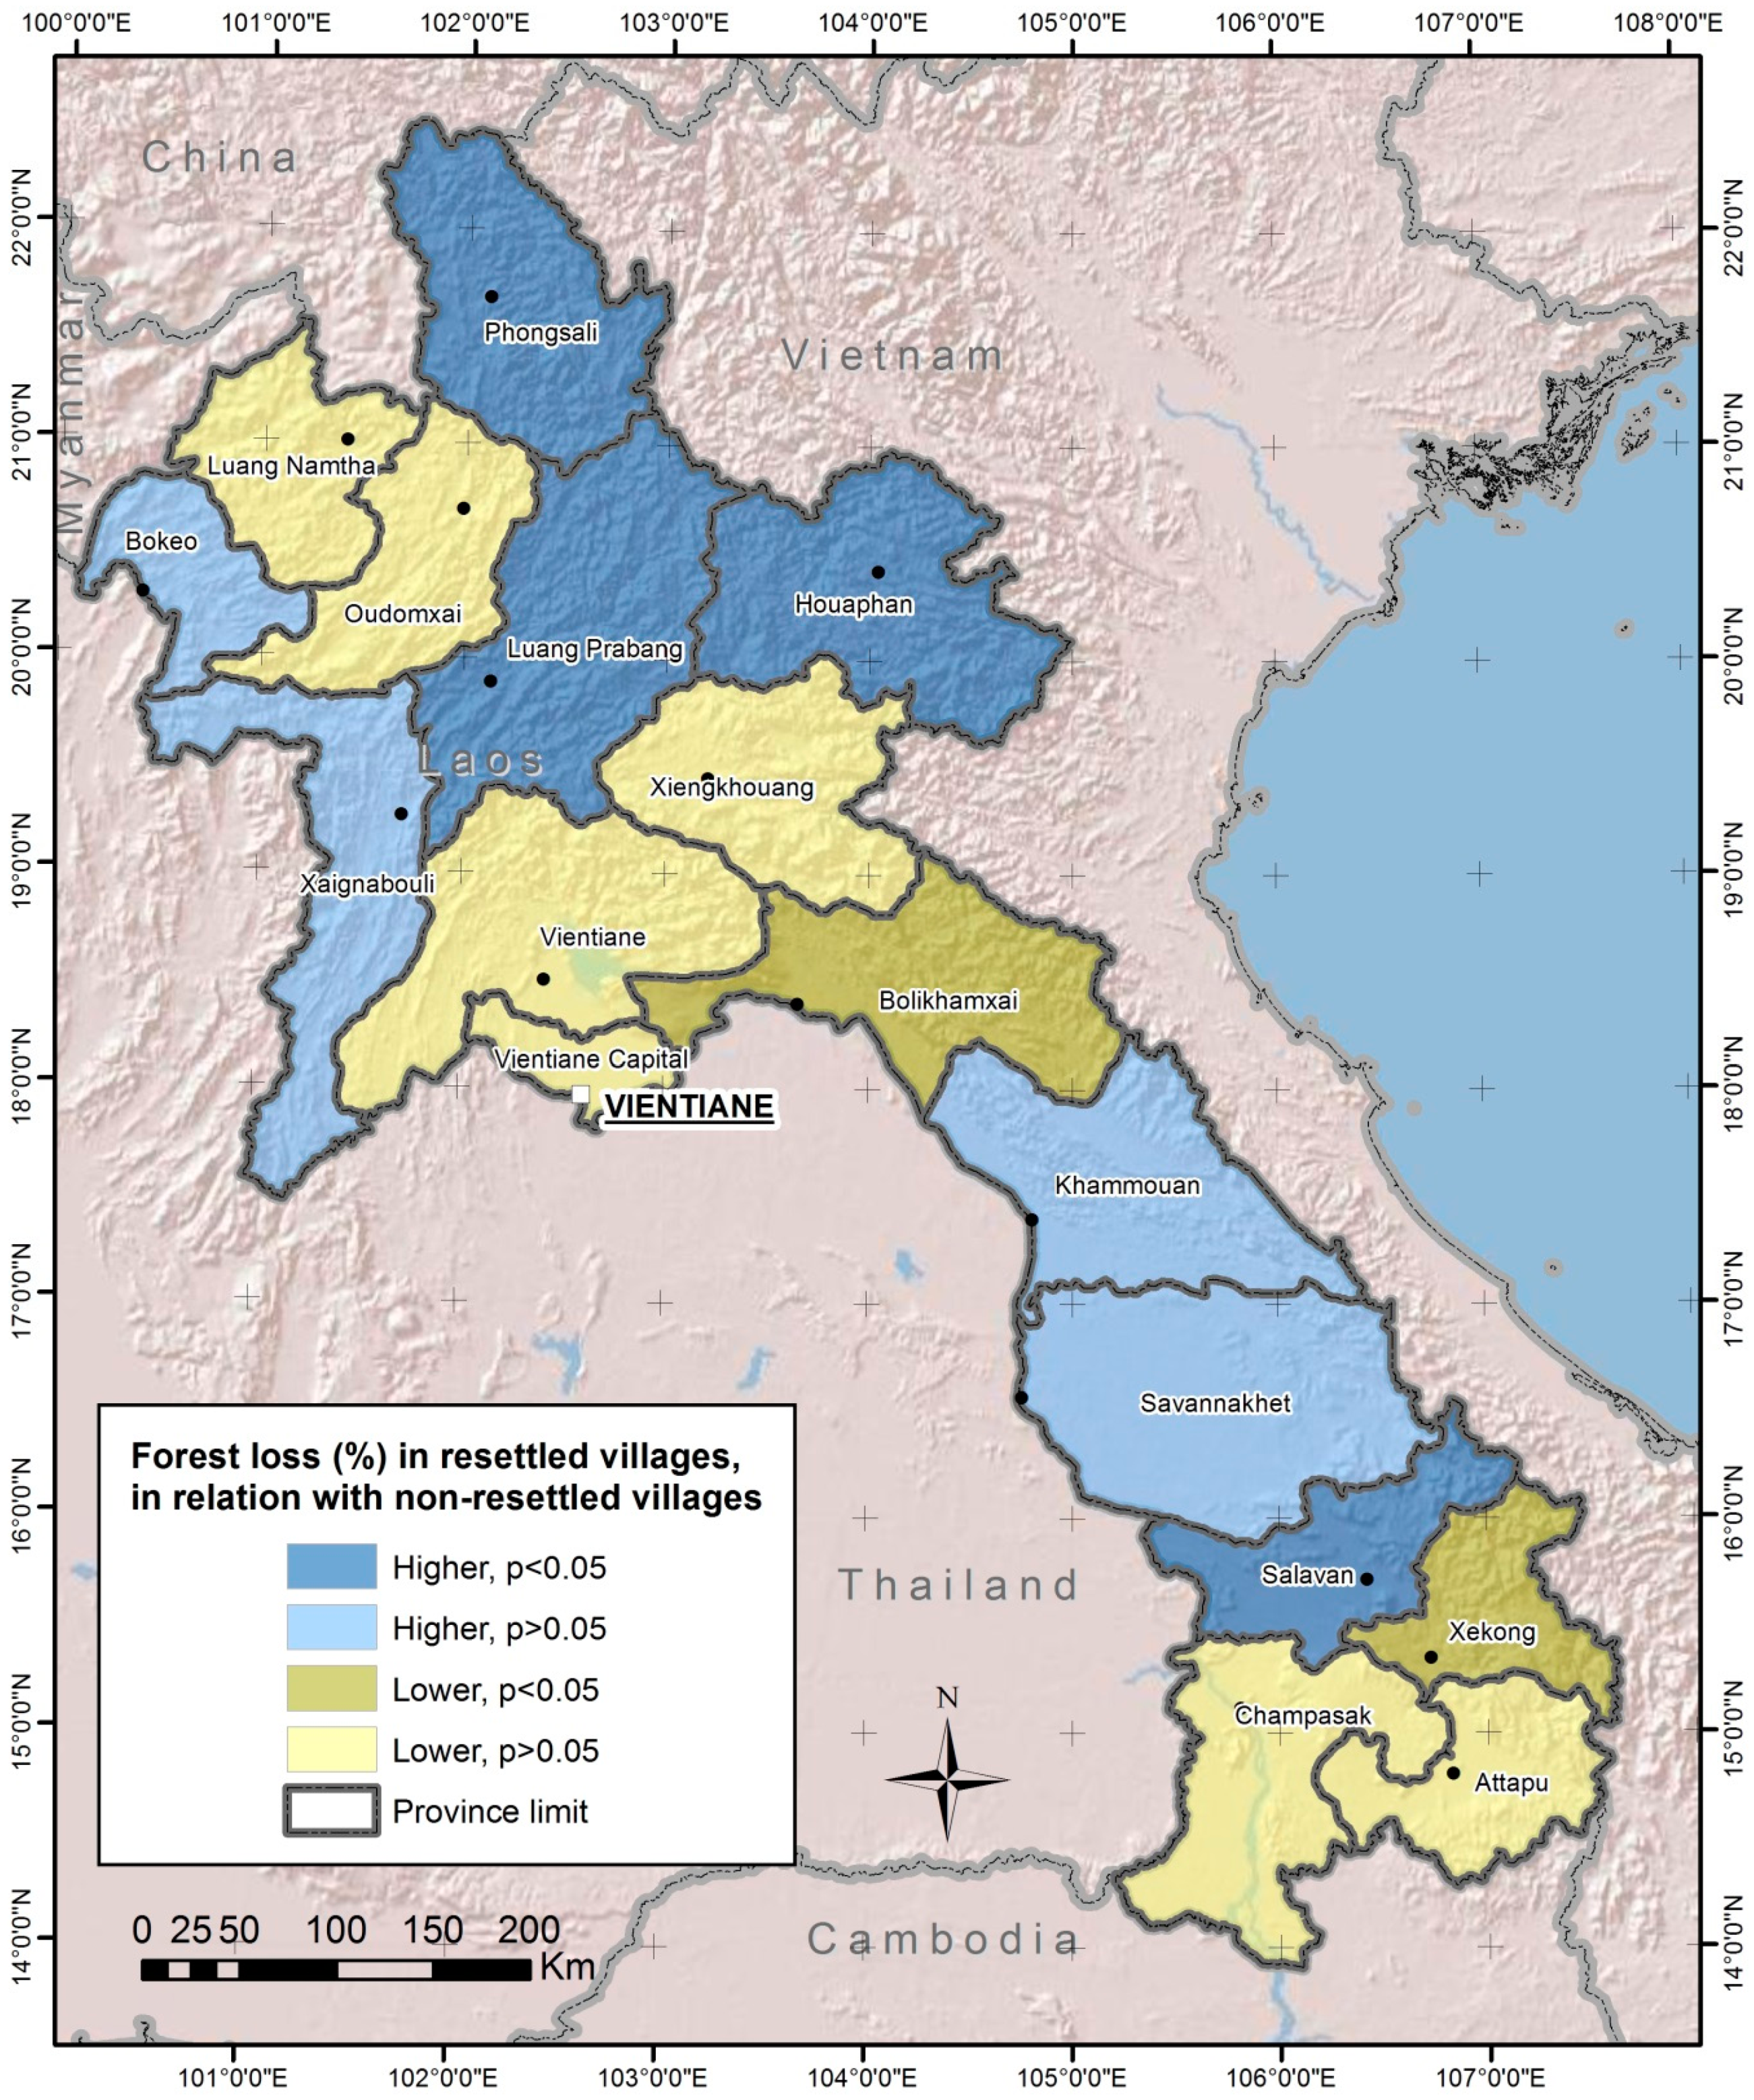
Figure 5 show the average forest cover change metrics (loss, gain, and both loss and gain) by province for resettled and non-resettled villages. In all provinces, forest cover is significantly higher in resettled villages (
p < 0.05,
Table 5). This explains the fact that in nine of the 17 provinces, forest loss relative to the whole village area is also higher in resettled villages (
Table 5). When forest loss is considered relative to the baseline forest cover measured in 2000, however, only four provinces show higher forest loss in resettled villages (
Figure 5): Phongsaly, Luang Prabang, Houaphan and Salavan.
Two provinces (Bolikhamxai and Xekong), as well as the country measured in whole, exhibit the inverse trend of presenting less relative forest loss in resettled villages. All provinces with significant differences in forest loss between resettled and non-resettled villages have experienced resettlements in more than 10% of villages, with the exception of Salavan.
Table 5.
Forest cover change statistics for resettled and non-resettled villages by province.
Table 5.
Forest cover change statistics for resettled and non-resettled villages by province.
| Province Name | Resettled Since 2000 | Number of Villages | Forest Cover 2000 | % Forest Loss (to Forest) (Mean) | % Forest Loss (to Area; Mean) | % Forest Gain (to Area; Mean) | % Loss and Gain (to Area; Mean) |
|---|
| 01 | Vientiane capital | no | 485 | 41.1 | 11.3 | 3.6 | 0.7 | 0.3 |
| | | yes | 1 | 34.2 | 8.9 | 4.6 | 0.4 | 0.1 |
| 02 | Phongsaly | no | 425 | 87.4 * | 5.5 * | 4.9 * | 1.8 | 0.7 * |
| | | yes | 110 | 91.2 * | 6.3 * | 5.8 * | 2.1 | 0.8 * |
| 03 | Luang Namtha | no | 297 | 74.7 * | 17.6 | 11.6 | 2.4 | 1.2 |
| | | yes | 57 | 89.9 * | 15.0 | 11.4 | 2.7 | 1.4 |
| 04 | Oudomxai | no | 348 | 78.7 * | 7.9 | 6.1 | 2.0 | 0.8 * |
| | | yes | 122 | 88.0 * | 7.5 | 6.5 | 2.1 | 0.9 * |
| 05 | Bokeo | no | 256 | 68.9 * | 16.4 | 8.1 * | 1.3 * | 0.6 * |
| | | yes | 26 | 79.7 * | 19.8 | 11.3 * | 1.9 * | 0.9 * |
| 06 | Luang Prabang | no | 676 | 74.1 * | 5.7 * | 4.4 * | 1.8 * | 0.7 * |
| | | yes | 103 | 87.1 * | 7.0 * | 6.2 * | 2.3 * | 1.1 * |
| 07 | Houaphan | no | 615 | 80.0 * | 10.9 * | 8.4 * | 3.1 * | 1.4 * |
| | | yes | 103 | 86.1 * | 13.5 * | 11.5 * | 4.4 * | 2.2 * |
| 08 | Xaignabouly | no | 421 | 61.0 * | 6.9 | 4.5 * | 0.8 * | 0.2 * |
| | | yes | 23 | 78.4 * | 8.8 | 7.1 * | 1.3 * | 0.5 * |
| 09 | Xiengkhouang | no | 450 | 63.5 * | 9.6 | 5.4 * | 1.5 * | 0.6 * |
| | | yes | 61 | 79.1 * | 7.3 | 6.2 * | 1.9 * | 0.7 * |
| 10 | Vientiane | no | 472 | 57.7 * | 11.8 | 5.3 | 1.7 | 0.6 |
| | | yes | 33 | 79.3 * | 8.0 | 5.5 | 1.5 | 0.6 |
| 11 | Bolikhamxai | no | 291 | 66.5 * | 20.7 * | 12.2 | 2.3 | 1.4 |
| | | yes | 32 | 84.6 * | 15.0 * | 10.8 | 2.1 | 1.3 |
| 12 | Khammouan | no | 547 | 54.1 * | 9.9 | 6.0 | 1.9 | 1.2 |
| | | yes | 38 | 70.4 * | 10.4 | 7.2 | 1.5 | 0.8 |
| 13 | Savannakhet | no | 967 | 37.0 * | 12.2 | 4.8 * | 1.5 * | 0.6 * |
| | | yes | 42 | 53.6 * | 12.8 | 7.6 * | 1.8 * | 0.8 * |
| 14 | Salavan | no | 564 | 43.5 * | 6.3 * | 3.1 * | 0.9 * | 0.3 * |
| | | yes | 37 | 67.9 * | 10.2 * | 8.1 * | 2.0 * | 0.9 * |
| 15 | Xekong | no | 186 | 75.6 * | 14.0 * | 9.4 | 2.2 | 1.2 |
| | | yes | 47 | 89.9 * | 8.2 * | 7.4 | 2.2 | 1.1 |
| 16 | Champasak | no | 628 | 31.3 * | 10.0 | 3.3 * | 0.5 * | 0.2 * |
| | | yes | 12 | 57.4 * | 6.8 | 4.6 * | 0.8 * | 0.3 * |
| 17 | Attapeu | no | 124 | 58.2 * | 16.3 | 9.9 | 2.1 * | 1.1 * |
| | | yes | 25 | 81.4 * | 14.7 | 12.0 | 3.8 * | 2.1 * |
| | All villages | no | 7752 | 56.9 * | 11.7 * | 5.8 * | 1.6 * | 0.7 * |
| | | yes | 872 | 82.7 * | 9.9 * | 7.9 * | 2.4 * | 1.1 * |
In ten provinces, forest gain (relative to the village area) appears to be higher in resettled villages, and for areas with both forest loss and gain, which is the case in 12 provinces out of 17. These trends are also visible for the whole country. The difference in forest gain and both forest loss and gain between resettled and non-resettled villages is particularly high in the provinces that experienced more forest loss in resettled villages, namely: Phongsaly, Luang Prabang, Houaphan and Salavan. Inversely, the two provinces with less forest loss in resettled villages (Bolikhamxai and Xekong) show no significant differences in forest gain or forest loss and gain between resettled and non-resettled villages.
Figure 5.
Comparison of forest loss in resettled and non-resettled villages by province.
Figure 5.
Comparison of forest loss in resettled and non-resettled villages by province.
4.4. Summary of Findings from National Assessment
We found out that, for the whole of Laos, there is a trend of resettled villages being located at higher altitudes, in less accessible and more forested areas. Many resettled villages are located in the North and the far South-East of the country. Resettled villages also experienced a slightly higher proportion of decline in living conditions and persistent engagement in shifting cultivation. Furthermore, ethnic minorities are overrepresented in resettled villages, especially the Mon-Khmer family, which is also overrepresented in villages with lowered living conditions.
Northern provinces on average have more forest cover, which is also true for villages dominated by ethnic minorities. In the country as a whole, the average absolute forest loss per village is higher in resettled villages, but not relative to the baseline forest cover. However, we observed higher relative forest loss in four provinces, among them three Northern provinces, and the inverse trend in two provinces. Furthermore, forest gain occurs more in resettled villages than in non-resettled villages in 10 out of 17 provinces, and patches that experienced both gain and loss also occur more in resettled villages in 12 out of 17 provinces.
These results show that there is a relationship between resettlements, high forest cover and ethnic minorities, but also that forest losses vary in relation to resettlements. The considered case studies enable a finer analysis of how resettlements can contribute to forest cover change.
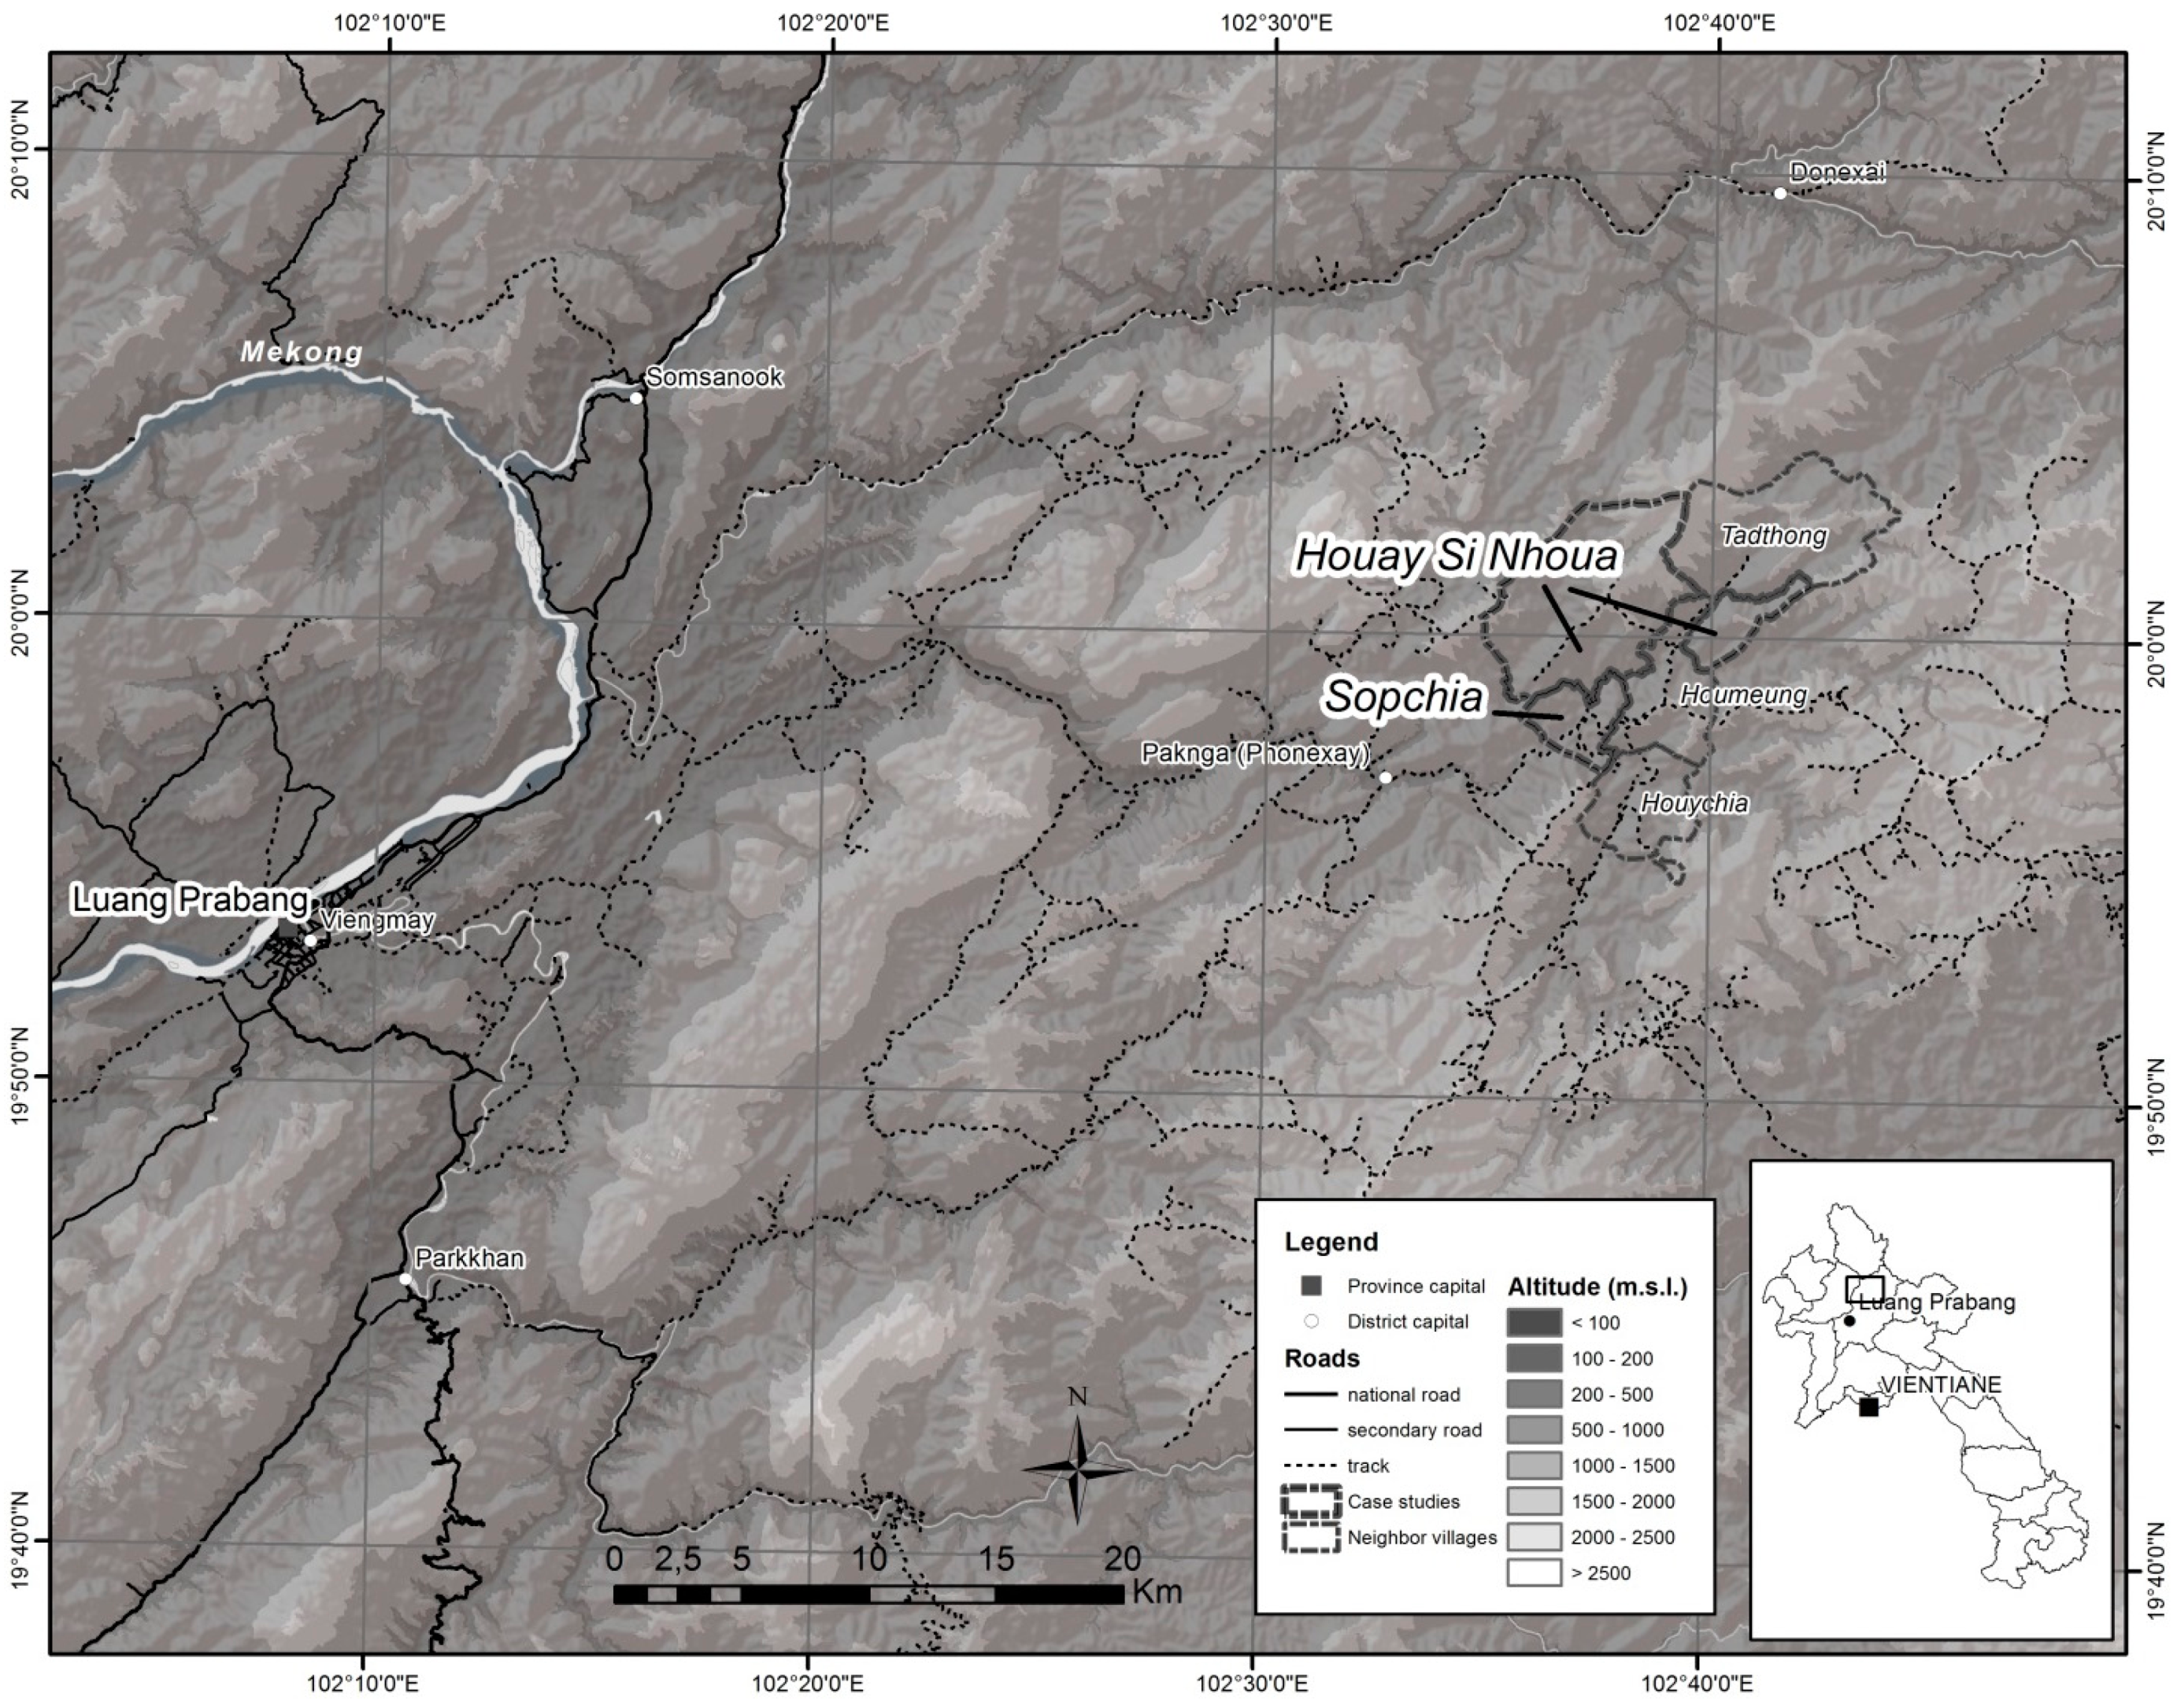
4.6. Resettlements and Land Distribution in Two Resettled Villages: A Case Study in Luang Prabang
This section is based on the case study performed by Stich (2013; [
41]). The two surveyed villages, Sopchia and Houay Si Nhoua, are intimately linked by the resettlement process. In 1999, land use planning was performed in Sopchia, and villagers were given land use certificates and the village boundaries were fixed [
42]. In 2003, three villages (Houay Si Nhoua, Houaypot and Moklaharn) were “clustered” into a new administrative unit, the
khum baan, or village group. Next, 93 households from these villages were relocated to a new site called “new” Houay Si Nhoua, in the framework of the VRCS, which stipulates that villages with less than 50 households must be merged into larger villages [
42]. The new dwelling site was located near the paddy fields of Sopchia, in an area which the Sopchia villagers considered part of their territory. The state did not grant newcomers any access to land, since Sopchia villagers already held titles stemming from the LFA performed in 1999. This situation led to land conflicts and some villagers moved back to their former production areas (in Thadthong) that had been occupied in the meantime by another resettlement event. LUPLA in Houay Si Nhoua was performed in 2008 [
42]. In 2009, the Phonexay DAFO authorities allowed part of the Houay Si Nhoua villagers together with the other village’s population to move back to their old sites [
42]. In 2011, a more participatory process of land use planning updates, Participatory Land Use Planning (PLUP), was performed in both villages with the help of The Agro-Biodiversity Initiative (TABI) project, supported by the Swiss Agency for Development and Cooperation (SDC). This process defined areas of fallow rotation (4 in Sopchia and 6 in Houay Si Nhoua), where shifting cultivation is now allowed. A revision of the PLUP was done in Houay Si Nhoua in 2012 as the first PLUP was only partially implemented because agricultural land was not included [
41].
As a result of these changes, the newcomers from the three villages resettled at the new Houay Si Nhoua site near Sopchia were considered migrants, and the village of Sopchia was not registered as resettled. Inversely, the people who moved back to the Houay Si Nhoua old site (originally from three villages) were registered as “clustered” into a resettled village. “Clustered” is a term used in Laos when people move from neighboring villages and are grouped together with the destination village into a
khum baan (cluster). This means that though only three households per village were labelled “resettled”, most people labelled as “clustered households” or reporting to have undergone migration were indeed relocated due to the resettlement policy (
Figure 6). This means that by 2013, 69% and 58% of people residing in Sopchia and Houay Si Nhoua respectively were newcomers that were not born in the village [
41].
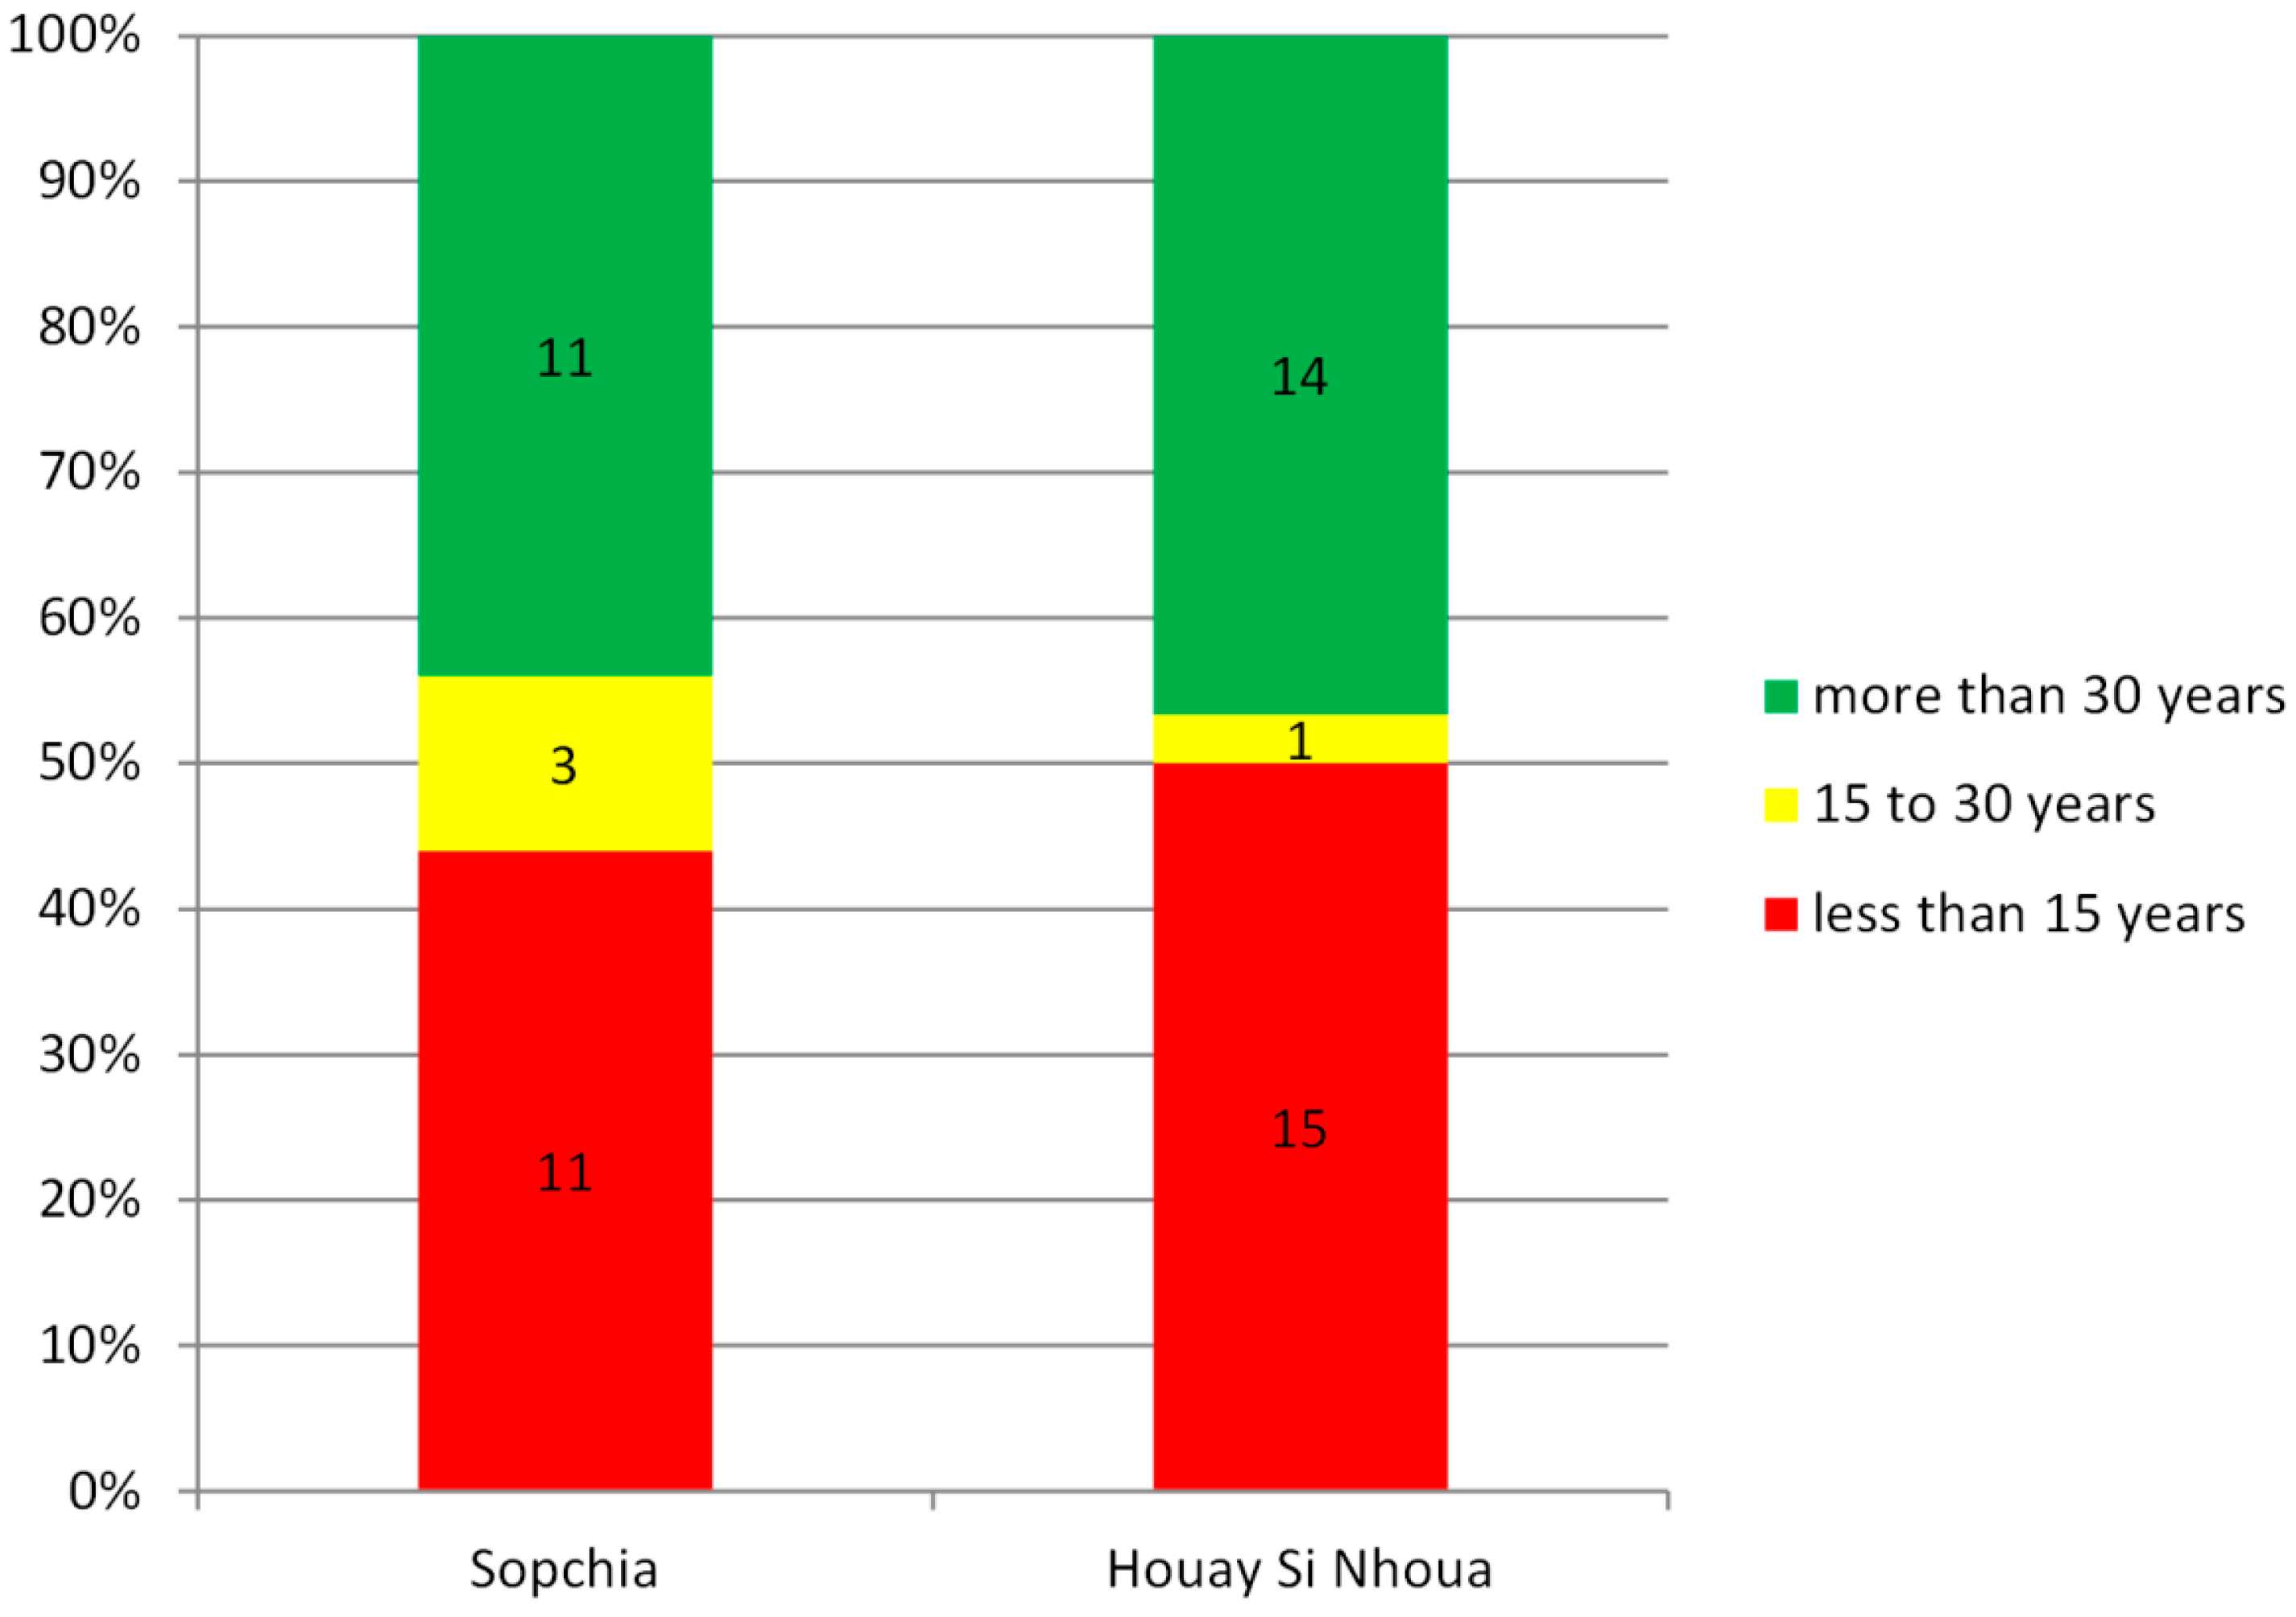
By 2013, around half of the 55 surveyed households from Sopchia and Houay Si Nhoua had lived for less than 15 years in the two villages, while nearly the other half were living there for more than 30 years (
Figure 7). The household survey found land access to be highly unequal between original settlers and newcomers, especially regarding access to highly productive paddy rice land in the case of Sopchia: 64% of the households who had access to paddy rice land had been living for more than 20 years in the village, 18% between 10 and 20 years, and only 18% had resided there for less than 10 years. This shows that newcomers are unlikely to get access to highly productive, irrigated land [
41].
In Sopchia, 24% of the surveyed households reported having experienced land losses, and 35% in Houay Si Nhoua [
41]. In Sopchia, the main reasons mentioned for land loss were the LUPLA process (29%), and land left to other households (29%). The latter indicates that land was redistributed to another household by DAFO authorities, or sold to another household to avoid redistribution. Fallow is mentioned in 14% percent of the cases. Fallow has to be linked to LUPLA, since after the LUPLA process, land owners with fallow left for more than three years lose their land rights to that plot. In Houay Si Nhoua, the reasons for land loss are more diverse. A total of 50% of land loss is directly or indirectly linked with the LUPLA process, with households mentioning LUPLA, the establishment of a conservation area, the allocation of land to another household or land loss for not paying taxes the most prominent explanation for drivers of land loss. Reasons linked with the resettlement process (meaning here “moved to another village” or migration) account for a total of 40% of the land loss cases [
41].
Figure 6.
Origin of households in Sopchia and Houay Si Nhoua (Source: Stich [
41]).
Figure 6.
Origin of households in Sopchia and Houay Si Nhoua (Source: Stich [
41]).
Figure 7.
Settlement duration of households in Sopchia and Houay Si Nhoua (Source: Stich [
41]).
Figure 7.
Settlement duration of households in Sopchia and Houay Si Nhoua (Source: Stich [
41]).
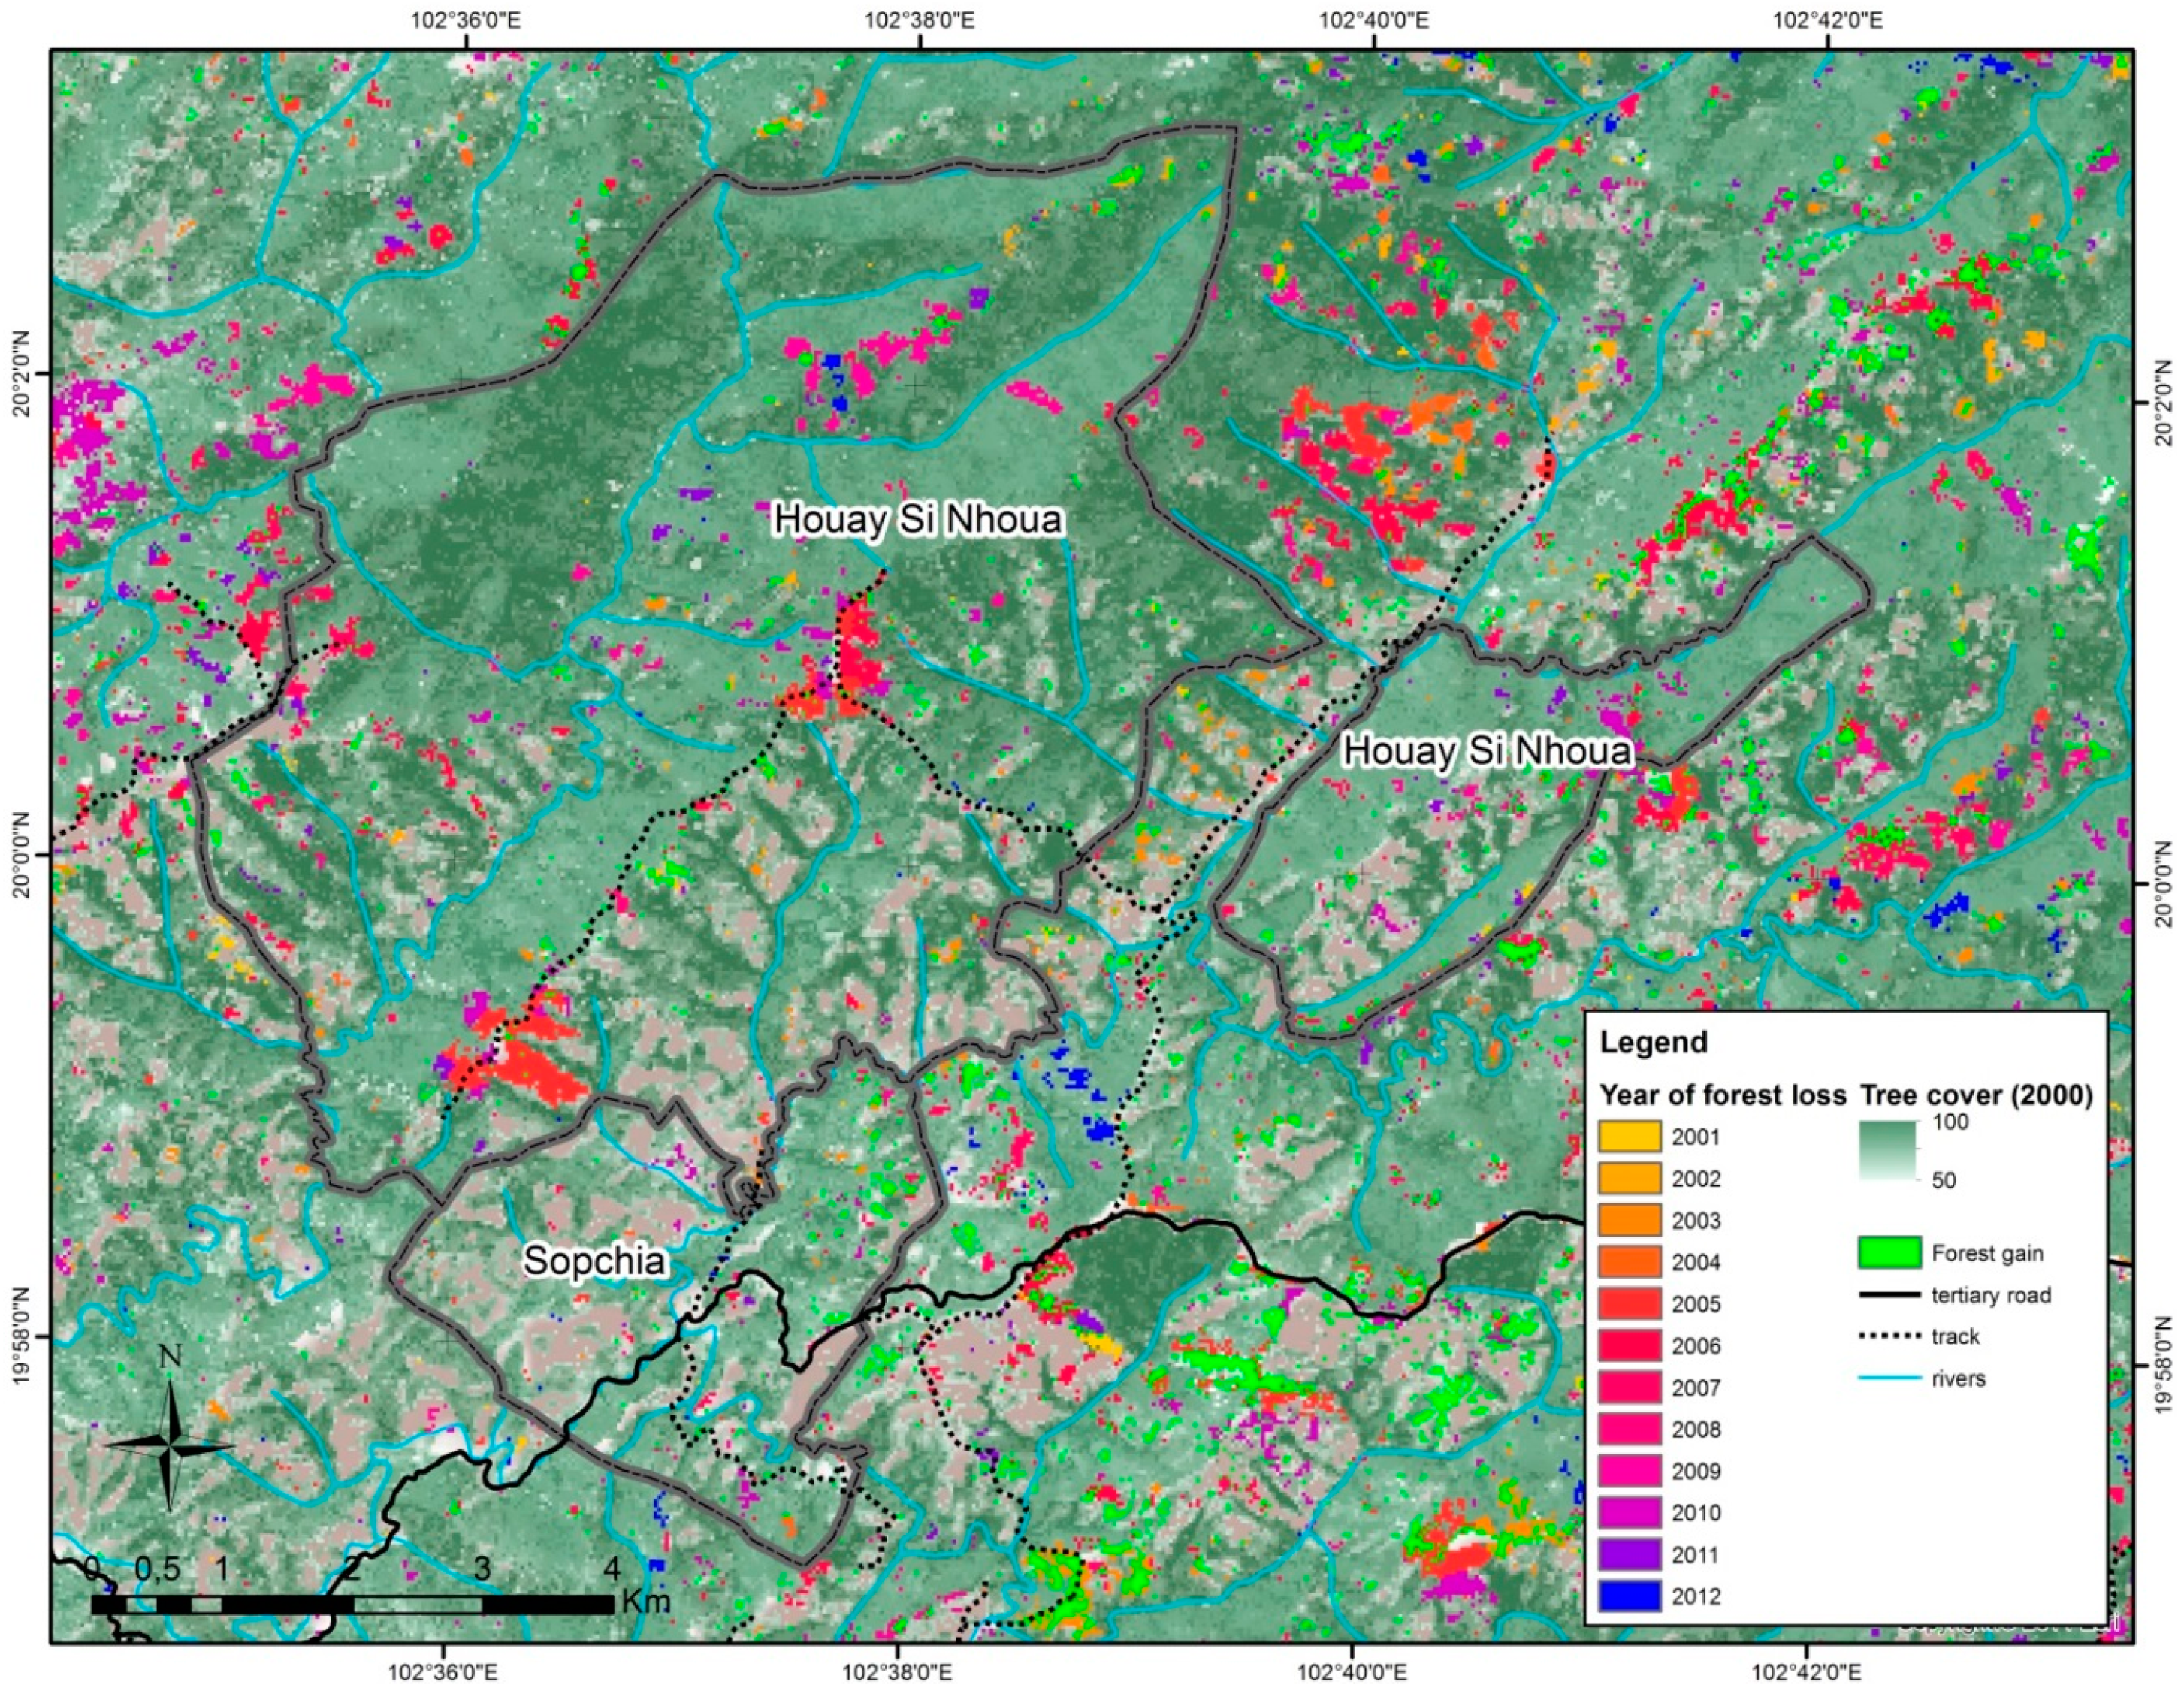
As stated in the methods section, it was not possible to get direct information on forest cleared by surveyed villagers. An observation of forest losses in the village areas by year of loss (
Figure 8) using the Hansen
et al. [
13] data shows that in Sopchia, little forest loss has occurred between 2000 and 2012. However, in the case of Houay Si Nhoua, important forest clearings are visible along track roads from 2005 to 2007. A total of 97.8 hectares were cleared during that time, accounting for 46% of all forest clearings from 2000 to 2012. This also partially covers the period between the resettlement and LUP (2008) and PLUP (2011) processes. Other areas of cleared forest appear in 2009 and 2010 in more remote sites, just after the conclusion of the LUPLA process and the return of some villagers to their initial areas, totaling 66 hectares (31% of forest clearings). One can also observe that the most densely forested areas (North-West of Houay Si Nhoua area), were left untouched.
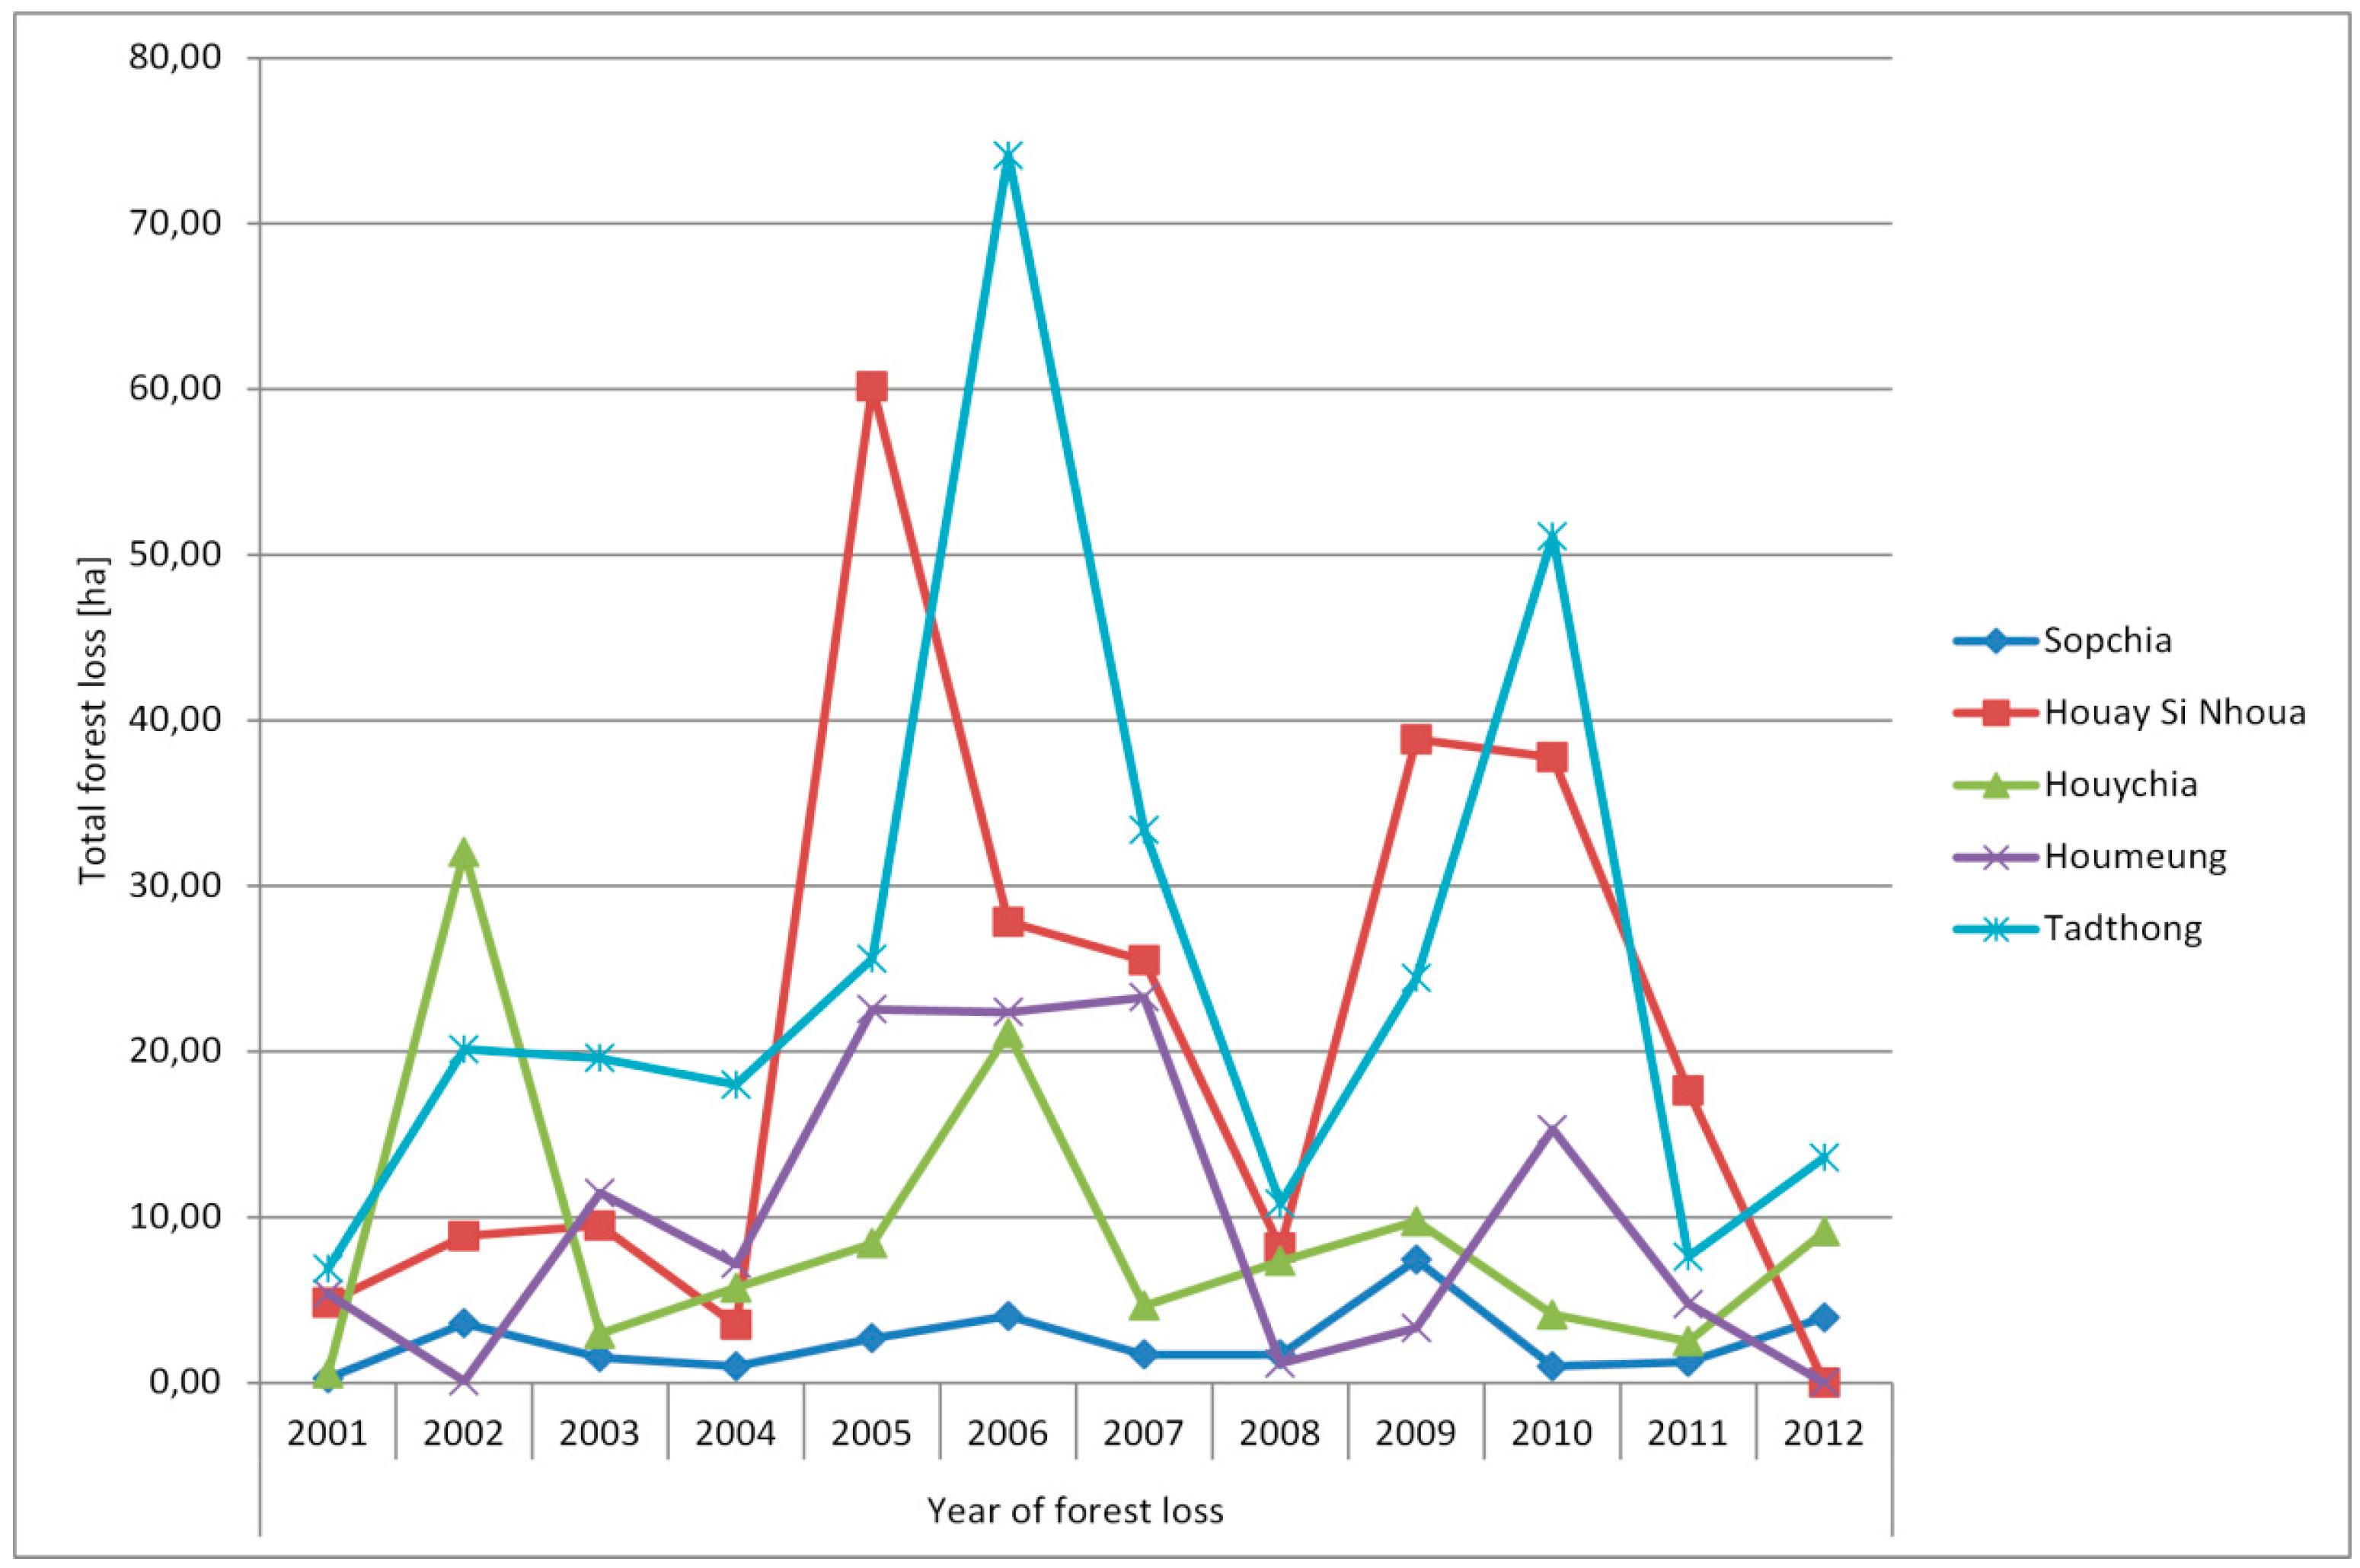
Considering the yearly forest loss since 2001 of both villages, as well as in the neighboring villages of Houychia, Houmeung and Tadthong (see also
Figure 1), we observe a similar pattern, except for Sopchia, which performed LUP in 1999 (
Figure 9). The villages of Tadthong and Houychia have also been resettled, but not Houmeung. Though we do not have information on when LUPLA was performed in all villages, the village of Tadthong shows the same timing for peaks of forest loss as Houay Si Nhoua, which corresponds to a period after which villagers returned to their original homes.
Figure 8.
Forest cover change in Sopchia and Houay Si Nhoua by year of forest loss. Forest cover and years of loss after Hansen
et al. [
13].
Figure 8.
Forest cover change in Sopchia and Houay Si Nhoua by year of forest loss. Forest cover and years of loss after Hansen
et al. [
13].
Figure 9.
Yearly forest cover loss [ha] in five villages from the case study area.
Figure 9.
Yearly forest cover loss [ha] in five villages from the case study area.
4.7. Discussion
Despite a common desired effect of resettlements on development and conservation, resettlement policies have had different impacts across the country on the local landscape. At the national scale, we found that forest loss is occurring in resettled villages, with important differences observed throughout the country. In four provinces (Luang Prabang, Phongsaly, Houaphan and Salavan), the relative forest loss rates are higher in resettled villages. Three of these provinces are located in Northern Laos, which has few flat areas, difficult access, high poverty and a significant proportion of ethnic minority groups. On the other hand, there are provinces (Bolikhamxai and Xekong) where relative forest loss is lower in resettled than in non-resettled areas.
Possible explanations of these observations must be linked with the different drivers of forest cover change in Laos. In the Northern provinces, where cultivation is mostly performed by smallholders, resettlements might have a comparatively larger effect than other drivers of forest loss. This might be confirmed by the observation that resettled villages in these areas also experience more forest gain than non-resettled ones, suggesting that forms of shifting cultivation might still take place there. In other cases, however, forest loss can be linked to the expansion of cash crops, like clearings to establish rubber plantations in Luang Namtha, or sugarcane and bananas in Oudomxay [
30]. Some areas have experienced significant clearing of forests in agricultural development concessions given to foreign companies. For example, in the province of Attapeu, about 5000 hectares of forest were cleared between 2007 and 2009 for a Vietnamese company to establish rubber plantations [
46]. Finally, in the central provinces of Bolikhamxay and Khammouane, large dams on the Nam Theun and Nam Ngouang rivers have been at the origin of most recent resettlements, and these might have a different dynamic than in the Northern provinces.
Considering villages in the provinces with higher forest loss in resettled villages to be predominantly inhabited by smallholders would support the hypothesis that changes linked with resettlements contribute to forest cover change. In other regions, however, this contribution appears masked by other forest cover changes linked with the expansion of large- or middle-scale cash crops and other development initiatives like hydropower.
Unfortunately, the LCA2011 does not provide information on the former locations of resettled villages and their actual used areas. The village polygons used in the national assessment of this study are extrapolated areas and delineate likely areas of influence of villages, dividing up all space and allocating it to each village. This implies on the one hand that observed land use might not necessarily be related to the villages’ populations. On the other hand, areas of former village locations, which are now likely to be left fallow, are counted in one or the other village. These areas can show forest gain, or forest loss, depending on the resettlement time. Thus, the actual impact of resettlements on forest cover change is masked by the merging of resettled and abandoned areas. A clearer figure could be obtained by using actual used areas of villages before and after resettlement at the scale of a district or province where these are available.
Existing case studies also show different outcomes of resettlements, and a close relationship between those outcomes and land planning processes. Especially in the study by Castella
et al., [
28] resettlement and LUP led to a segregation of landscapes between regenerating forests and areas with fallow shortening and degradation. Fallow shortening would especially occur after land planning, which leads to the enforcement of regulations on land use.
The case study performed in Luang Prabang highlights further the issue of land access before and after resettlement. Though migrants recently settled in Sopchia, no important forest losses could be observed within the village boundaries during this time. Two reasons could explain this: First, migrants kept access to their former lands or returned to their initial villages, and second, the population already established in Sopchia had sufficient access to intensive, permanent agriculture areas. In this case, the resettled population had no access to land with intensification potential and returned to their formerly used areas.
Can the observed forest losses in Houay Si Nhoua be attributed to the persistence of shifting cultivation? If this were the case, a more or less regular pattern of forest clearing that characterizes shifting cultivation would be visible each year. Instead, we found two forest loss peaks, one shortly after resettlement and the other just after villagers returned to their former fields. Both peaks were also found just before the LUP and PLUP processes. These observations suggest that both resettlement and LUP policies have a direct impact on forest cover: After resettlement, villagers’ strategy would be to clear more forest to establish new fields, but before the LUP process which, once concluded, does not allow them to clear forest any more. Land shortages after completion of a resettlement and LUP cycle would then lead people either to clear forest in more remote areas where they are not likely to be caught and fined by DAFO authorities, or negotiate for permission to return to their initial cultivation areas.
Furthermore, resettlement alone does not imply abandonment of used areas, as our case suggests. Reporting villages as resettled implies their physical relocation, but in some cases can mean administrative merging with no changes in settlement configurations. Given these considerations, determining whether resettlement is curbing shifting cultivation or not is dependent on the definition of resettlement as reported in the LCA2011 (physical relocation or administrative merging), as well as what exactly was reported as shifting cultivation (especially whether long or short fallow periods are included as determinants). This makes the observation that only 27% of resettled villages were reported to practice shifting cultivation difficult to interpret.
Rather than an abandonment of shifting cultivation, resettlements are likely to contribute to “respatializing” shifting cultivation by clustering forest clearing years together due to relocation and the land allocation process. This might lead to fallow shortening by disrupting the regular shifting system. While forest losses near resettled villages might be offset by gains in abandoned areas to some extent, other areas experience fallow shortening and degradation, which in turn has an impact on yields and livelihoods. The considered case studies suggest two pathways of change occurring shortly after resettlement and LUP: (1) separation of land into abandoned and overused and degraded areas [
28], and (2) persistence of use in the areas supposed to be abandoned with modified patterns of shifting cultivation.
Did intensification take place in resettled and planned villages? No such processes were observed in our case since resettled villages had no access to land with intensification potential. In the six case studies reviewed from the literature, resettlement and LUP never corresponded with agricultural intensification, but intensification processes did occur where only planning had been performed. There are three possible explanations to this lack of intensification: (1) intensification is a middle-term process which cannot occur shortly after resettlement and planning when land access is still insecure, (2) the involved households were unable to perform the initial investments needed for intensification and lacked support to do so, and (3) recent resettlements have occurred in areas with little physical potential for intensification.
Can examining the geography of resettled villages provide answers or differentiate between these possible explanations? We observed an overrepresentation of ethnic minority groups in resettled villages. Among them, groups belonging to the Mon-Khmer ethnolinguistic family are by far the most heavily involved in resettlements. Also called “middle-Lao”, these groups traditionally occupy middle altitudes and high slope areas, and are linked with shifting cultivation [
24]. Being on average poorer than other groups, Mon-Khmer minorities might be particularly vulnerable to resettlements and their impacts, and face more socio-economic limitations to intensification. However, as stated by Lestrelin [
33], they also develop resistance strategies which, as was observed in our case study, could lead villagers to return to their areas of origin and engage in modified shifting cultivations systems with possibly shorter fallow periods.
Our third hypothesis, that resettled villages are not necessarily located in the most accessible areas, is confirmed by the observation that resettled villages are still more remote, located at higher altitudes and have higher forest cover than other villages. Because farmers are likely to settle where land is available, this suggests the presence of voluntary, traditional resettlement, rather than “forced” resettlement. The case of Sopchia and Houay Si Nhoua demonstrates this: While local authorities intended to resettle people to Sopchia, which is more accessible and is more suitable to intensive agriculture, land resources were already occupied by its original population. On the one hand, this confirms the observation by Vandergeest [
22], who showed that paddy land owners—mostly ethnic Lao—have been the main beneficiaries of LUPLA processes and land titling up to now. On the other hand, this situation forces the resettled farmers to occupy “intermediary” sites, with better access to markets and services than their old sites but not necessarily bearing the potential for intensification. As a consequence, villagers are either pushed to migrate elsewhere (as observed by Baird
et al. [
11]), or clear forest at sites less suitable for cultivation and more prone to erosion and degradation. This means that recently resettled villages are also less likely to engage in intensification in the short term.


