Article

Effects of Climate Change on Urban Rainwater Harvesting in Colombo City, Sri Lanka

by
Kwong Fai A. Lo
1,* and
Suranjith Bandara Koralegedara
2,3
1
Graduate Institute of Earth Science, Chinese Culture University, 55, Hwa-Kang Rd., Yangmingshan, Taipei 11114, Taiwan
2
Taiwan International Graduate Programme, Research Center for Environmental Changes, Academia Sinica, Nankang, Taipei 115, Taiwan
3
College of Earth Science, National Central University, Jhongli City, Taoyuan 32001, Taiwan
*
Author to whom correspondence should be addressed.
Environments 2015, 2(1), 105-124; https://doi.org/10.3390/environments2010105
Submission received: 15 October 2014 / Revised: 3 March 2015 / Accepted: 4 March 2015 / Published: 11 March 2015

Abstract

:
Cities are becoming increasingly vulnerable to water-related issues due to rapid urbanization, installation of complex infrastructure and changes in rainfall patterns. This study aims at assessing the impacts of climate change on rainwater harvesting systems (RWH) in the tropical urban city, Colombo, Sri Lanka. The future climate change projections are downscaled from global circulation models to the urban catchment scale using the Long Ashton Research Station Weather Generator (LARS-WG), described in the Intergovernmental Panel on Climate Change (IPCC) Fourth Assessment Report (AR4), coupled with Inter Comparison Project (CMIP3) model results. Historical rainfall data from 1981–2010 is used to simulate long-term future rainfall data from 2011–2099. The percentage change of the rainfall is calculated. The rainfall patterns are analyzed based on the daily, monthly, seasonal and annual time scales. Water requirements are calculated based on the selected scenario types. Rainfall and water demand data are incorporated into a water balance model. Climate change impacts for the selected RWH scenarios are calculated based on the water security analysis for each scenario. Analysis of the future rainfall data of Colombo reveals that several extreme weather events with very heavy rainfall may occur in the future. However, the frequency of these big events may not occur too often. Most of the selected global circulation models (GCMs) in this study predict that there will be more rainfall towards the end of this century (2080-2099). Residential RWH systems will be more affected than non-residential systems. RWH systems in Colombo should include potential future climate changes in their future design and planning and be prepared for excess runoff and additional measures against potential overflow and urban floods.

1. Introduction

Evidence of global warming in response to rising atmospheric carbon dioxide and other greenhouse gases levels is accumulating [1,2]. Based on atmospheric ocean-coupled global circulation models (AOGCMs), it has been suggested that a doubling of ambient carbon dioxide (CO2) concentrations could increase the global mean air temperature by 1.5 °C to 4.5 °C (with high confidence) [2]. Climate change and global warming will result in increased temperatures, strongly affecting many aspects of hydrological systems, water resources, coastal zones and oceans [2,3].
Rainwater harvesting (RWH) has been practiced for centuries in many parts of the world. Rainwater harvesting has been widely accepted around the world as one of the main alternative sources of water [4,5,6,7] and also is considered one of the best practices in combating urban floods. RWH has been practiced for many years in Sri Lanka. Sri Lanka is a good candidate for practicing RWH due to the fact that Sri Lanka receives abundant rainfall throughout the year [8]. In the recent past, RWH was commonly used in the urban context, as well as in rural areas. With the increased trend in urban green buildings and amendments to recent laws, RWH has become a mandatory requirement of modern buildings [9]. It is evident that there will be more RWH systems added to the total existing number in the near future.
Possible climate changes in Colombo will affect the existing and future RWH systems. Though there have been some studies carried out elsewhere in the world, little is known about the effects of climate change on RWH practices in the Asian region. Arnbjerg-Nielsen et al., (2013) in their review report conclude that in spite of significant advances [10], there are still many limitations in the understanding of how to describe precipitation patterns in a changing climate in order to design and operate urban drainage infrastructure. Case studies from the existing RWH systems in Colombo have shown that there are significant economic savings, as well as environmental benefits [11]. Any effects of these systems therefore will have an impact on the practitioner’s economy and the local environment.
GCMs are tools designed to simulate a time series of climate variables in the world, accounting for the effects of the concentration of greenhouse gases in the atmosphere. It was initially developed to simulate average and synoptic-scale atmospheric circulation patterns for specified external forcing conditions. Results obtained from the AOGCM are considered as the most reliable climate change projections in the world, as this work involved many of the most world-renowned academic and research institutions. Despite the significant increase in computational power in recent years, climate models still remain relatively coarse in space and time resolution and are unable to resolve significant features at finer scales of urban drainage systems. The coarse scale and bias in the rainfall results of climate models require some sort of downscaling techniques.
Dynamic downscaling techniques based on physical/dynamical links between climates at large and at small scales and statistical downscaling methods using empirical relationships between large-scale atmospheric variables and observed daily local weather variables are the two main techniques used. The statistical downscaling (SD) technique is a method used to derive local-scale information from a larger scale through inference from the cross-scale relationship using some random and/or deterministic functions [12]. One method of statistical downscaling is through stochastic rainfall modelling. The model can be used with the parameters that have probability distributions, conditionally based on the coarse-scale climatic predictor. The parameters of the stochastic model are obtained from statistical analysis of time series and can be altered in accordance with climate model simulation results. This study uses the LARS-WG model as the main weather generator model for predicting the future rainfall. LARS-WG is a stochastic WG based on the series approach [13], with a detailed description given in Semenov (2007) [14]. LARS-WG produces synthetic daily time series of maximum and minimum temperatures, precipitation and solar radiation. The WG uses observed daily weather for a given site to compute a set of parameters for probability distributions of weather variables, as well as correlations between them [15]. The LARS-WG model has been successfully applied in many similar case studies [15,16,17,18]. The LARS-WG model itself consists of 15 different AOGCM model results according to different emission scenarios. However, only six AOGCMs have all three Special Range of Emissions Scenarios (SRES) scenarios (A1B, A2, B1) available. Therefore, this study utilizes these six models for performing the analysis (Table 1). The outputs from these AOGCMs are available as monthly means of climatic variables, including precipitation, maximum and minimum temperatures and radiation for the baseline period corresponding to 1960–1990 and the periods 2011–2030, 2046–2065 and 2081–2100 [15].
Table 1. Some selected atmosphere ocean-coupled global climate models (AOGCMs) available for the LARS-WG Model B: baseline; T1: 2011–2030; T2: 2046–2065; T3: 2081–2100. Adopted from Semenov and Stratonovitch, 2010 [15]. SRES, Special Range of Emissions Scenarios.
Model NameAvailable SRES ScenariosGrid Resolution Time PeriodsAgency
CM2.1-AOGCM-GFDL-(GFCM21)A1B/A2/B12.0 × 2.5°B, T1,T2,T3U.S. Dept. of Commerce /NOAA/Geophysical Fluid Dynamics Laboratory (GFDL) (USA)
UKMO-HadCM3 (HADCM3)A1B/A2/B12.5 × 3.75°B, T1,T2,T3Hadley Center (Had) for Climate Prediction and Research/Met Office (MO) (U.K.)
INM-CM3.0 (INCM3)A1B/A2/B14 × 5°B, T1,T2,T3Institute of Numerical Mathematics (INM), Russian Academy of Science, Russia.
IPSL-CM4 (IPCM4)A1B/A2/B12.5 × 3.75°B, T1,T2,T3Institut Pierre Simon Laplace (IPSL) (France)
MPI_ECHAM5 (MPEH5)A1B/A2/B11.9 × 1.9°B, T1,T2,T3Max Planck Institute (MPI) for Meteorology (Germany)
CCSM3/ NCCCSMA1B/A2/B11.4 × 1.4°B, T1,T2,T3National Climate Center (NCC) (USA)
The main objective of this paper is to review and compare the climate change impacts on the RWH systems in Colombo City, Sri Lanka. This study hypothesis results from the potential climate change scenarios on the RWH systems in the Colombo City. This study also identifies the past changes in the rainfall regimes of Colombo and performs a detailed analysis of LARS-WG by downscaling the GCM projections, as well as a comparison of past data with projected future rainfall data. Finally, with an overview of the possible future changes in rainfall, the effects of the rainfall change on the RWH systems in Colombo City are identified with possible future climate change.

2. Methodology

2.1. Study Area

Sri Lanka is an island in the Indian Ocean and located south of the Indian subcontinent (65,610 km2 in area) with a central mountain range surrounded by coastal lowlands. Nearly 75% of the land is flat or undulating. Sri Lanka has a warm climate, moderated by ocean winds and considerable moisture. However, this island has highly varying climatic conditions and rainfall patterns [19].
The rainfall climate of Sri Lanka is strongly governed by the seasonally varying monsoon system, associated air masses and planetary wind regimes over South Asia. Due to the alternating monsoon circulation systems throughout the year, two principal monsoon rainfall seasons and two transitional periods, called inter-monsoon seasons, can be identified in Sri Lanka [20].
The Central Highlands of Sri Lanka act as the major climatic barrier for the monsoonal winds. This is also the major factor discriminating the two major climate zones of the country, namely: Wet Zone and Dry Zone. Colombo City is in the Wet Zone (mostly comprised by the south-western part of the island), which is exposed to the southwest monsoon (SWM) winds. Apart from the SWM, the first inter-monsoon also produces high rainfall in the Wet Zone [20].
One of the major rivers of Sri Lanka flows in the northern border of Colombo City, the “Kalani Ganga”. The main potable water supply for the Colombo City is from the National Water Supply & Drainage Board (NWS & DB), and their main source of water is from the surface water from Kalani Ganga River at Ambatale and the two impounding reservoirs, namely Kalatuwawa and Labugama. According to NWS & DB, they have provided an average water supply coverage of 81.6% (northeast Colombo City, 96.6%; and southwest Colombo City, 66.6%) [21]. About 94.95% of the households in the city use pipe-borne water as their main source of water.

2.2. Data

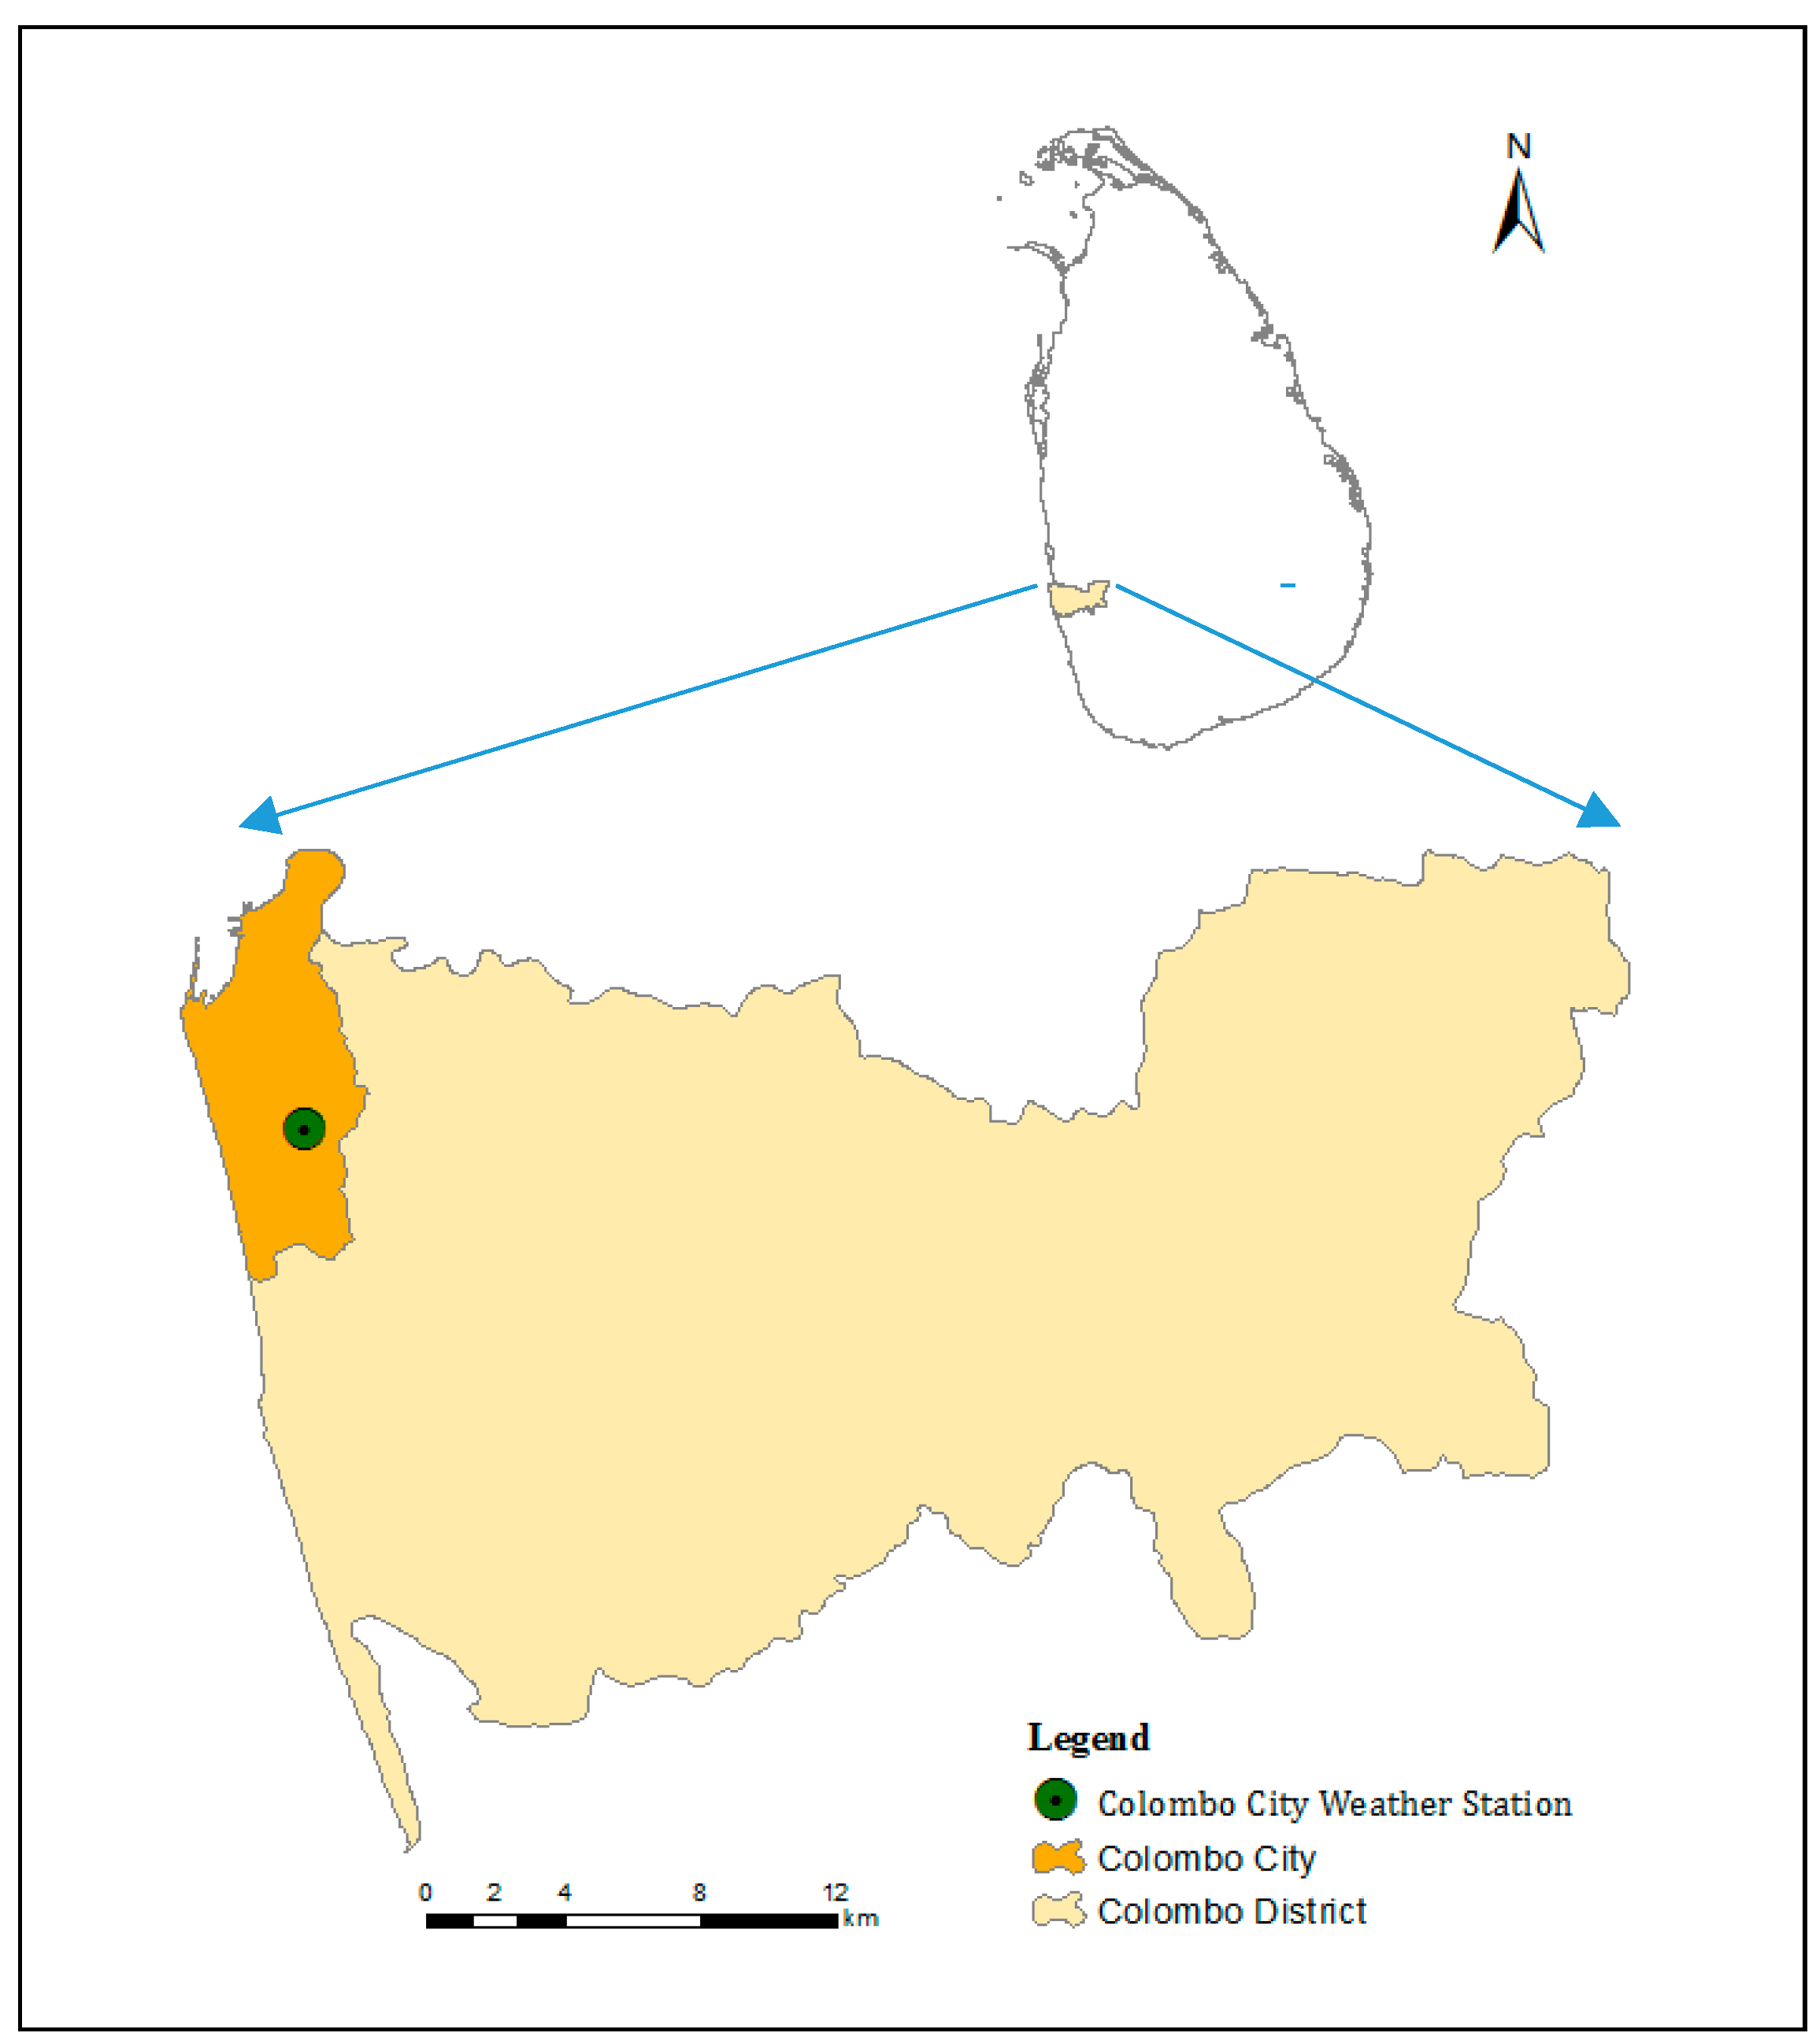
Historical daily rainfall data (1981 to 2010) of Colombo City weather station were purchased from the Department of Meteorology, the official institution for weather-related data in Sri Lanka (Figure 1). The future climate data used in this work are obtained from the statistical downscaling using the LARS-WG model. Other data related to the water usage and demographics are obtained from the Department of Census and Statistics and from NWS & DB.
Figure 1. Location map of Colombo City weather station and Colombo City within the Colombo District in Sri Lanka.
Environments 02 00105 g001

2.3. Statistical Downscaling of Climate Change Projections

Semenov and Barrow developed the Long Ashton Research Station Weather Generator (LARS-WG) in 1997. This stochastic model was capable of simulating future local climate variation in response to climate change by downscaling AOGCM outputs. Version 5.5 of LARS-WG is used [18]. Historical datasets, as input, are capable of simulating a daily weather time-series of unlimited lengths.
Three steps are performed in the LARS-WG model to develop the synthetic weather data. The model first calibrates and validates the past 30 years of the historical daily rainfall data of Colombo City, using the ‘site analysis’ (Step 01) and ‘Q Test’ (Step 02) options. LARS-WG does its model calibration and validation using several statistical tests for different distributions and the scales of the climate parameters. The synthetic climate data generation, the ‘generator’ (Step 03) is done based on the selected IPCC 4 (CMIP3) climate models (Table 1), each at a time, for 100 years of daily data from 2010 and for simulation periods of 2011–2030, 2046–2065 and 2080–2099 separately. For each AOGCM model, a mean daily rainfall value is calculated from the three simulations (2011–2030, 2046–2065 and 2080–2099). The generated future weather data from the above steps are used in the site analysis step to obtain the basic statistics for the comparison with the statistics of the historical rainfall. The LARS-WG is a site-specific and model-specific tool. Thus, this procedure is repeated for each selected climate model. These steps are further explained by Semenov and Barrow and Semenov and Stratonovitch with examples [15,18].
The LARS-WG model integrates 15 climate models from the multi-model ensemble used in the IPCC Fourth Assessment Report (AR4) to reduce uncertainty in climate predictions resulting from structural differences in the global climate models, as well as uncertainty due to variations in initial conditions or model parameterizations [15]. The LARS-WG model is still in the development phase and not stable at all times. Lutz et al. [22] compare the latest climate change projections generated for the IPCC report (CMIP5) and projections used in the fourth IPCC assessment (CMIP3); the spread in projections of future glacier extent in Central Asia is similar for both ensembles. Uncertainties in climate change projections increase with the length of the time horizon. In the near-term (the 2020s), climate model uncertainties play the most important role; while over longer time horizons, uncertainties due to the selection of the emissions scenario become increasingly significant [23].
Evaluating global/regional impacts from possible climate change on urban drainage requires a methodology to estimate extreme and short-duration rainfall statistics for the time period and the geographical region of interest. The generation of daily series of future climate projections for each selected model output is based on the SRES (Special Range of Emissions Scenarios) A1B. This scenario represents an average future condition based on a 2-degree warming trend. With a higher warming trend, the expected impacts will be much higher than the calculated. This study has opted to involve the other two extreme emission scenario cases, A2 and B1, only in the annual rainfall evaluation phase and used the A1B emission scenario results for the future analysis.

2.4. Climate Change Detection

Projected future rainfall data are studied, as this is the most important climatological variable in hydrologic modelling of RWH systems. Statistical comparison of the simulated rainfall values with their equivalent historical values are carried out to detect possible changes, both qualitatively and quantitatively.
The average projected rainfall values are compared with each AOGCM model. The model projections are analyzed for the percentage change compared to baseline values to identify changes using Equation (1). A positive value indicates an increase and a negative value indicates a decrease in total rainfall. A zero percentage change indicates no change between future and observed parameters.
Percentage Change =  ( Projected Observed ) Observed  ×100%  

2.5. Rainwater Harvesting System Modelling

The basic water balance model is utilized to determine the hydrological parameters of the RWH system. Hypothetical cases of average RWH systems and average households are used for the system calculations. The system values for each case type are chosen to represent the real-world systems in Colombo City. This study calculates the water demand for both outdoor and indoor, small to large average households and the potential runoff from the catchments. These values are then applied to the water balance model and subsequent water security analysis.
Total indoor non-potable water consumption and the total outdoor water consumption are calculated in m3, and the sum of these two demands is considered as the total monthly non-potable water demand for the RWH system. Household scenarios consider average urban households, whereas non-residential scenarios refer to an urban office or commercial building with non-resident workers. Non-potable water consumption is considered in households. The water consumption rates are based mainly on toilet flushing, car washing and other uses (Table 2).
Landscape evapotranspiration (ETL) from the outdoor landscapes accounts for the major outdoor water demand. Equation (2) is used to estimate its value [24].
ET  L =  K L  ×  ET o
KL = landscape coefficient, ETo = reference evapotranspiration.
Table 2. Hypothetical scenario types of the rainwater harvesting (RWH) systems of Colombo City.
Scenario TypeWater UseWater Use Rate (L/Day)Average Number of People in ConcernCatchment Area CategoryAverage Catchment Area Size (m2)Average Size of the Rainwater Storage Tank (m3)Potential Irrigated Area (m2)
Residential Type ALow1004Small200502
Residential Type B High200 4Small200502
Non-residential
Type A
Low15 50Medium200020010
Non-residential
Type B
High30 50Medium200020010
Non-residential large scale (indoor) Type CMedium202500Large25,0001000500
Non-residential large scale (outdoor) Type DMedium20750Large25,000100025,000
Reference evapotranspiration (ETo) is estimated from a Class A evaporation pan. ETo values are collected from the weather station assigned to the study site [25]. This study uses the average monthly ETo values of Colombo City. Landscape coefficients (KL) are calculated using the following three factors: species (KS), density (Kd) and microclimate (Kmc). Since the study site is in Colombo City, an urban setting with lots of absorbing and reflective surfaces, the microclimate factor Kmc is assumed to have a “high” value (0.8), species factor KS a “moderate” factor value (1.0) and an “average” density factor Kd value (1.0).
Landscape evapotranspiration values obtained from Equation (2) are used to calculate the total monthly outdoor water requirement (Qout), based on the average irrigated land area and Equation (3) [24].
Q out  =  ET L ×A×D
ETL = average landscape evapotranspiration (m), A = irrigated land area (m2), D = days for the month.
It is assumed that the total monthly non-potable water demand is first fulfilled by the RWH system. The generated runoff from the RWH system catchment is diverted to the storage tank. The available storage capacity is compared with the accumulated runoff. If the accumulated runoff is greater than the available storage volume, excess water will be deducted from the accumulated runoff and will be released as excess water. Total water demand is deducted from the accumulated/harvested rainwater. If the total water demand is greater than the harvested rainwater in the tank, the model assumes that the remaining water demand is met by the public water supply or another source. A monthly water balance model, Equation (4), is set up using Microsoft Excel software to compute the average volume of rainwater used each month and the average volume left behind in the tank at the end of the month.
Q tank t1 = Q tank t0 + Q in Q out
Qtank t1 = water stored at any month, Qtank t0 = water remaining in the tank from the previous month, Qin = monthly harvested rainwater volume, Qout = monthly gross non-potable water requirement.
The above computational procedure is repeated with different system variables for the given scenario types (Table 2). The performances of the designed RWH systems are compared with the present and future scenarios.

2.6. Water Security

The ratio of water demand to water supply represents water stress resulting from an imbalance between water use and water resources [26]. This study uses “water security” as the key index to determine the climate change impact on the RWH systems. Water security can be defined as the percentage of the household water demand fulfilled by the RWH system. This allows the calculation of the amount of water used and the amount of rainwater utilized, under a given daily rainfall time series, when water demand and the roof area are known.
WS= Q abs Q req ×100
WS = water security (%), Qabs = withdrawn volume of water from the tank, Qreq = total volume of the household water requirement.
This study analyzes the water securities with projected future rainfall values from the model output and to detect the potential future changes in the water security of the standard RWH systems for each scenario type (Table 2). A change in the water securities with respect to the different RWH scenario types is calculated in order to get a closer look at the impacts using water security values of the historical and projected averages, and based on Equation (1).

3. Results and Discussions

3.1. Weather Data Analysis
This study utilizes the past 30 years of daily rainfall data, which is the minimum requirements for most climate related studies, and selects the weather station in the center of Colombo City.
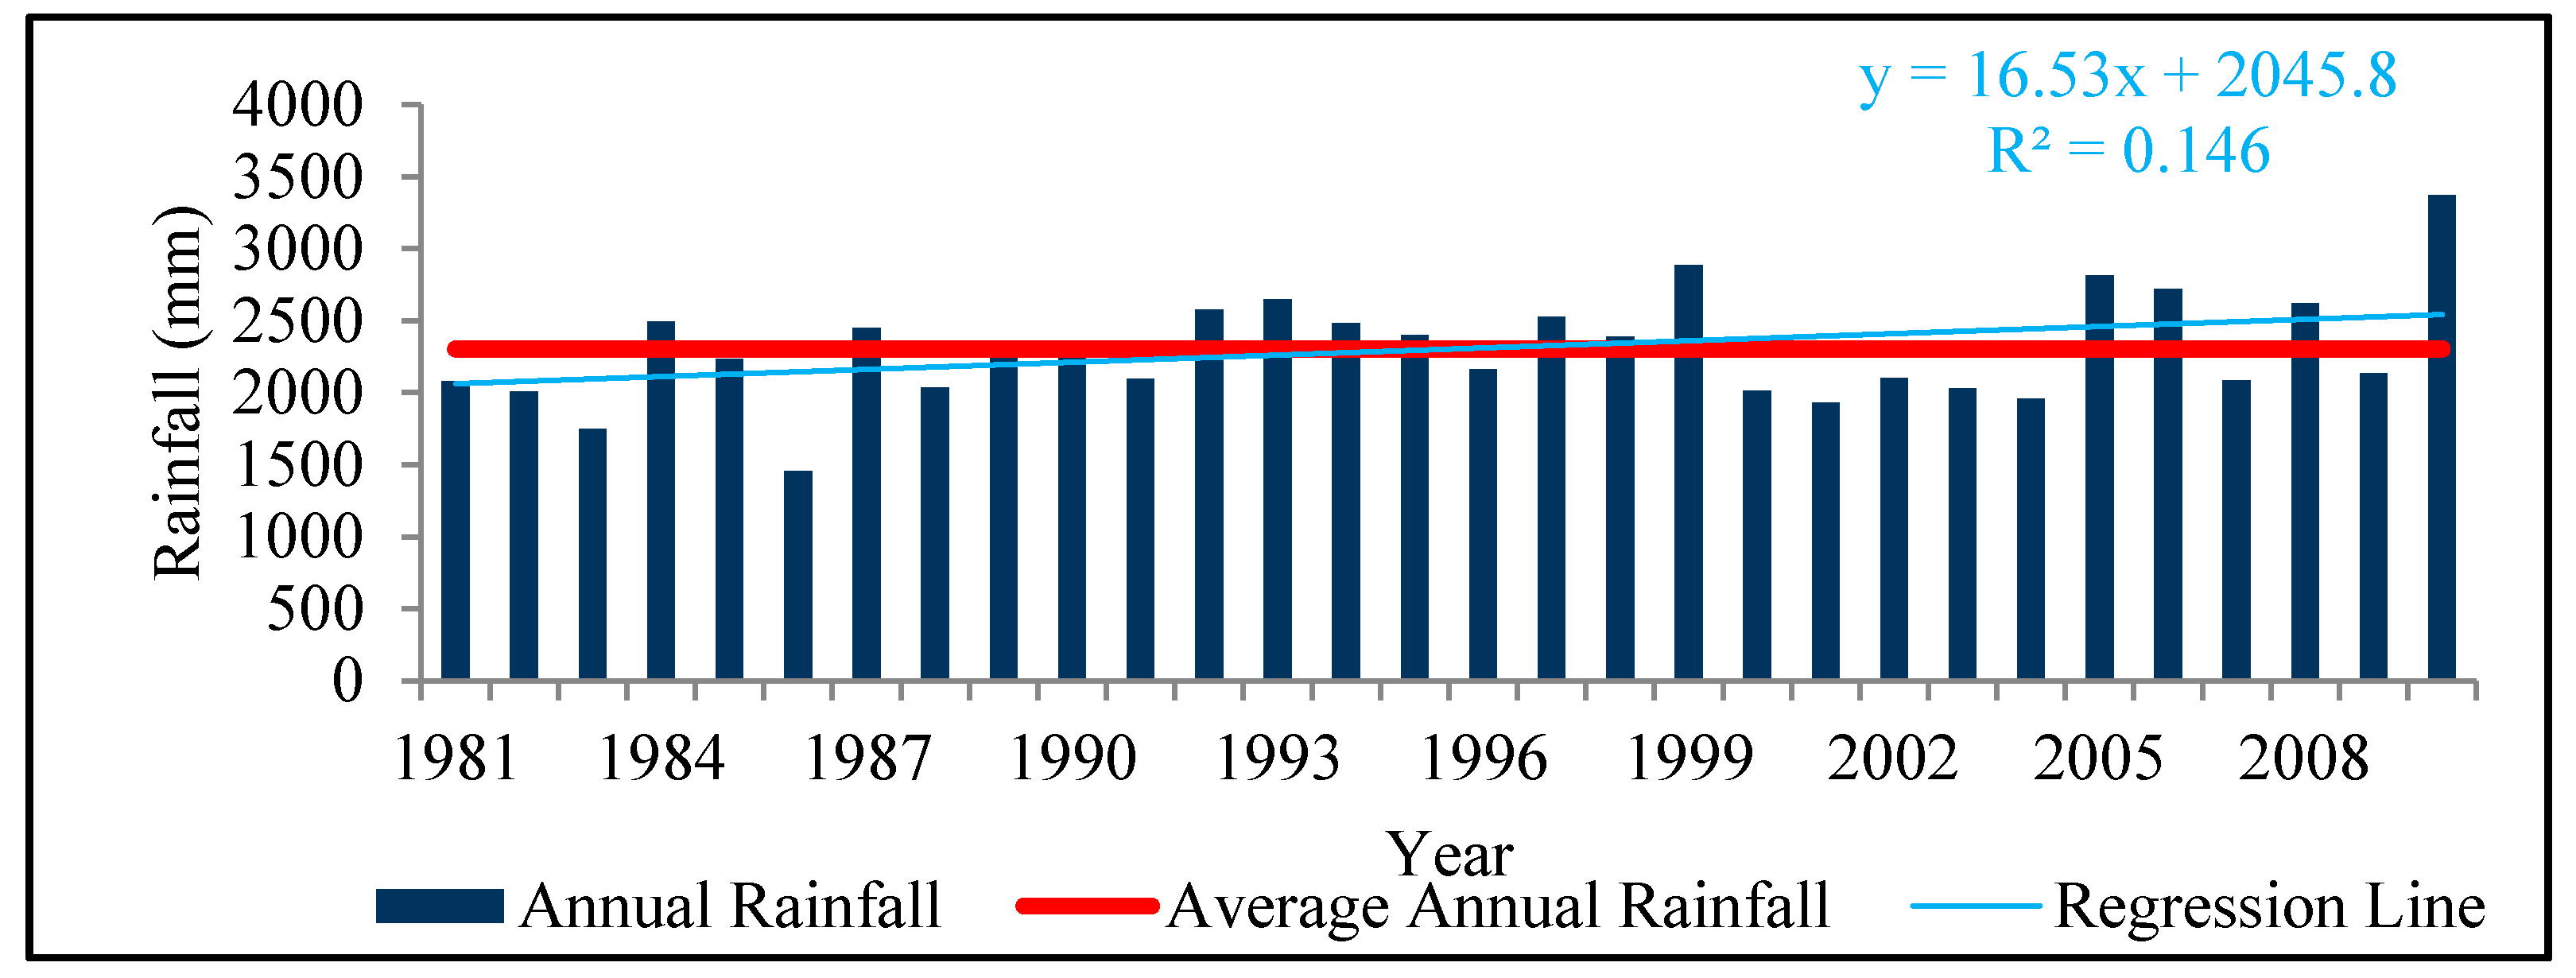
Average annual rainfall for Colombo City is 2302 mm. The long-term trend of this annual rainfall records shows that there is a slight increase (R2 = 0.146) with some record high rainfall values occurring in the recent past (Figure 2). Historical records show that Colombo City receives an adequate amount of rainfall for many water sources to thrive, including the RWH system. However, there are more dry days than wet days in Colombo City, marking the importance of additional water supplies, such as RWH. It is also interesting to note the large standard deviation (about 375 mm) of the annual rainfall (Table 3). This further emphases the importance of RWH systems as a supportive water source during dry periods.
Figure 2. Average annual rainfall in the Colombo city area (1981–2010).
Environments 02 00105 g002
Table 3. Basic descriptive statistic data for the annual rainfall data at the Colombo study site (1981–2010).
ParametersValues
Time period (years)30
Mean (mm)2,301.98
Median (mm)2,249.05
Maximum (mm)3,369.90
Minimum (mm)1,456.60
Standard deviation374.45
Average annual wet days171.84
Average annual dry days193.41
Wet/total ratio0.47
Dry/total ratio0.53
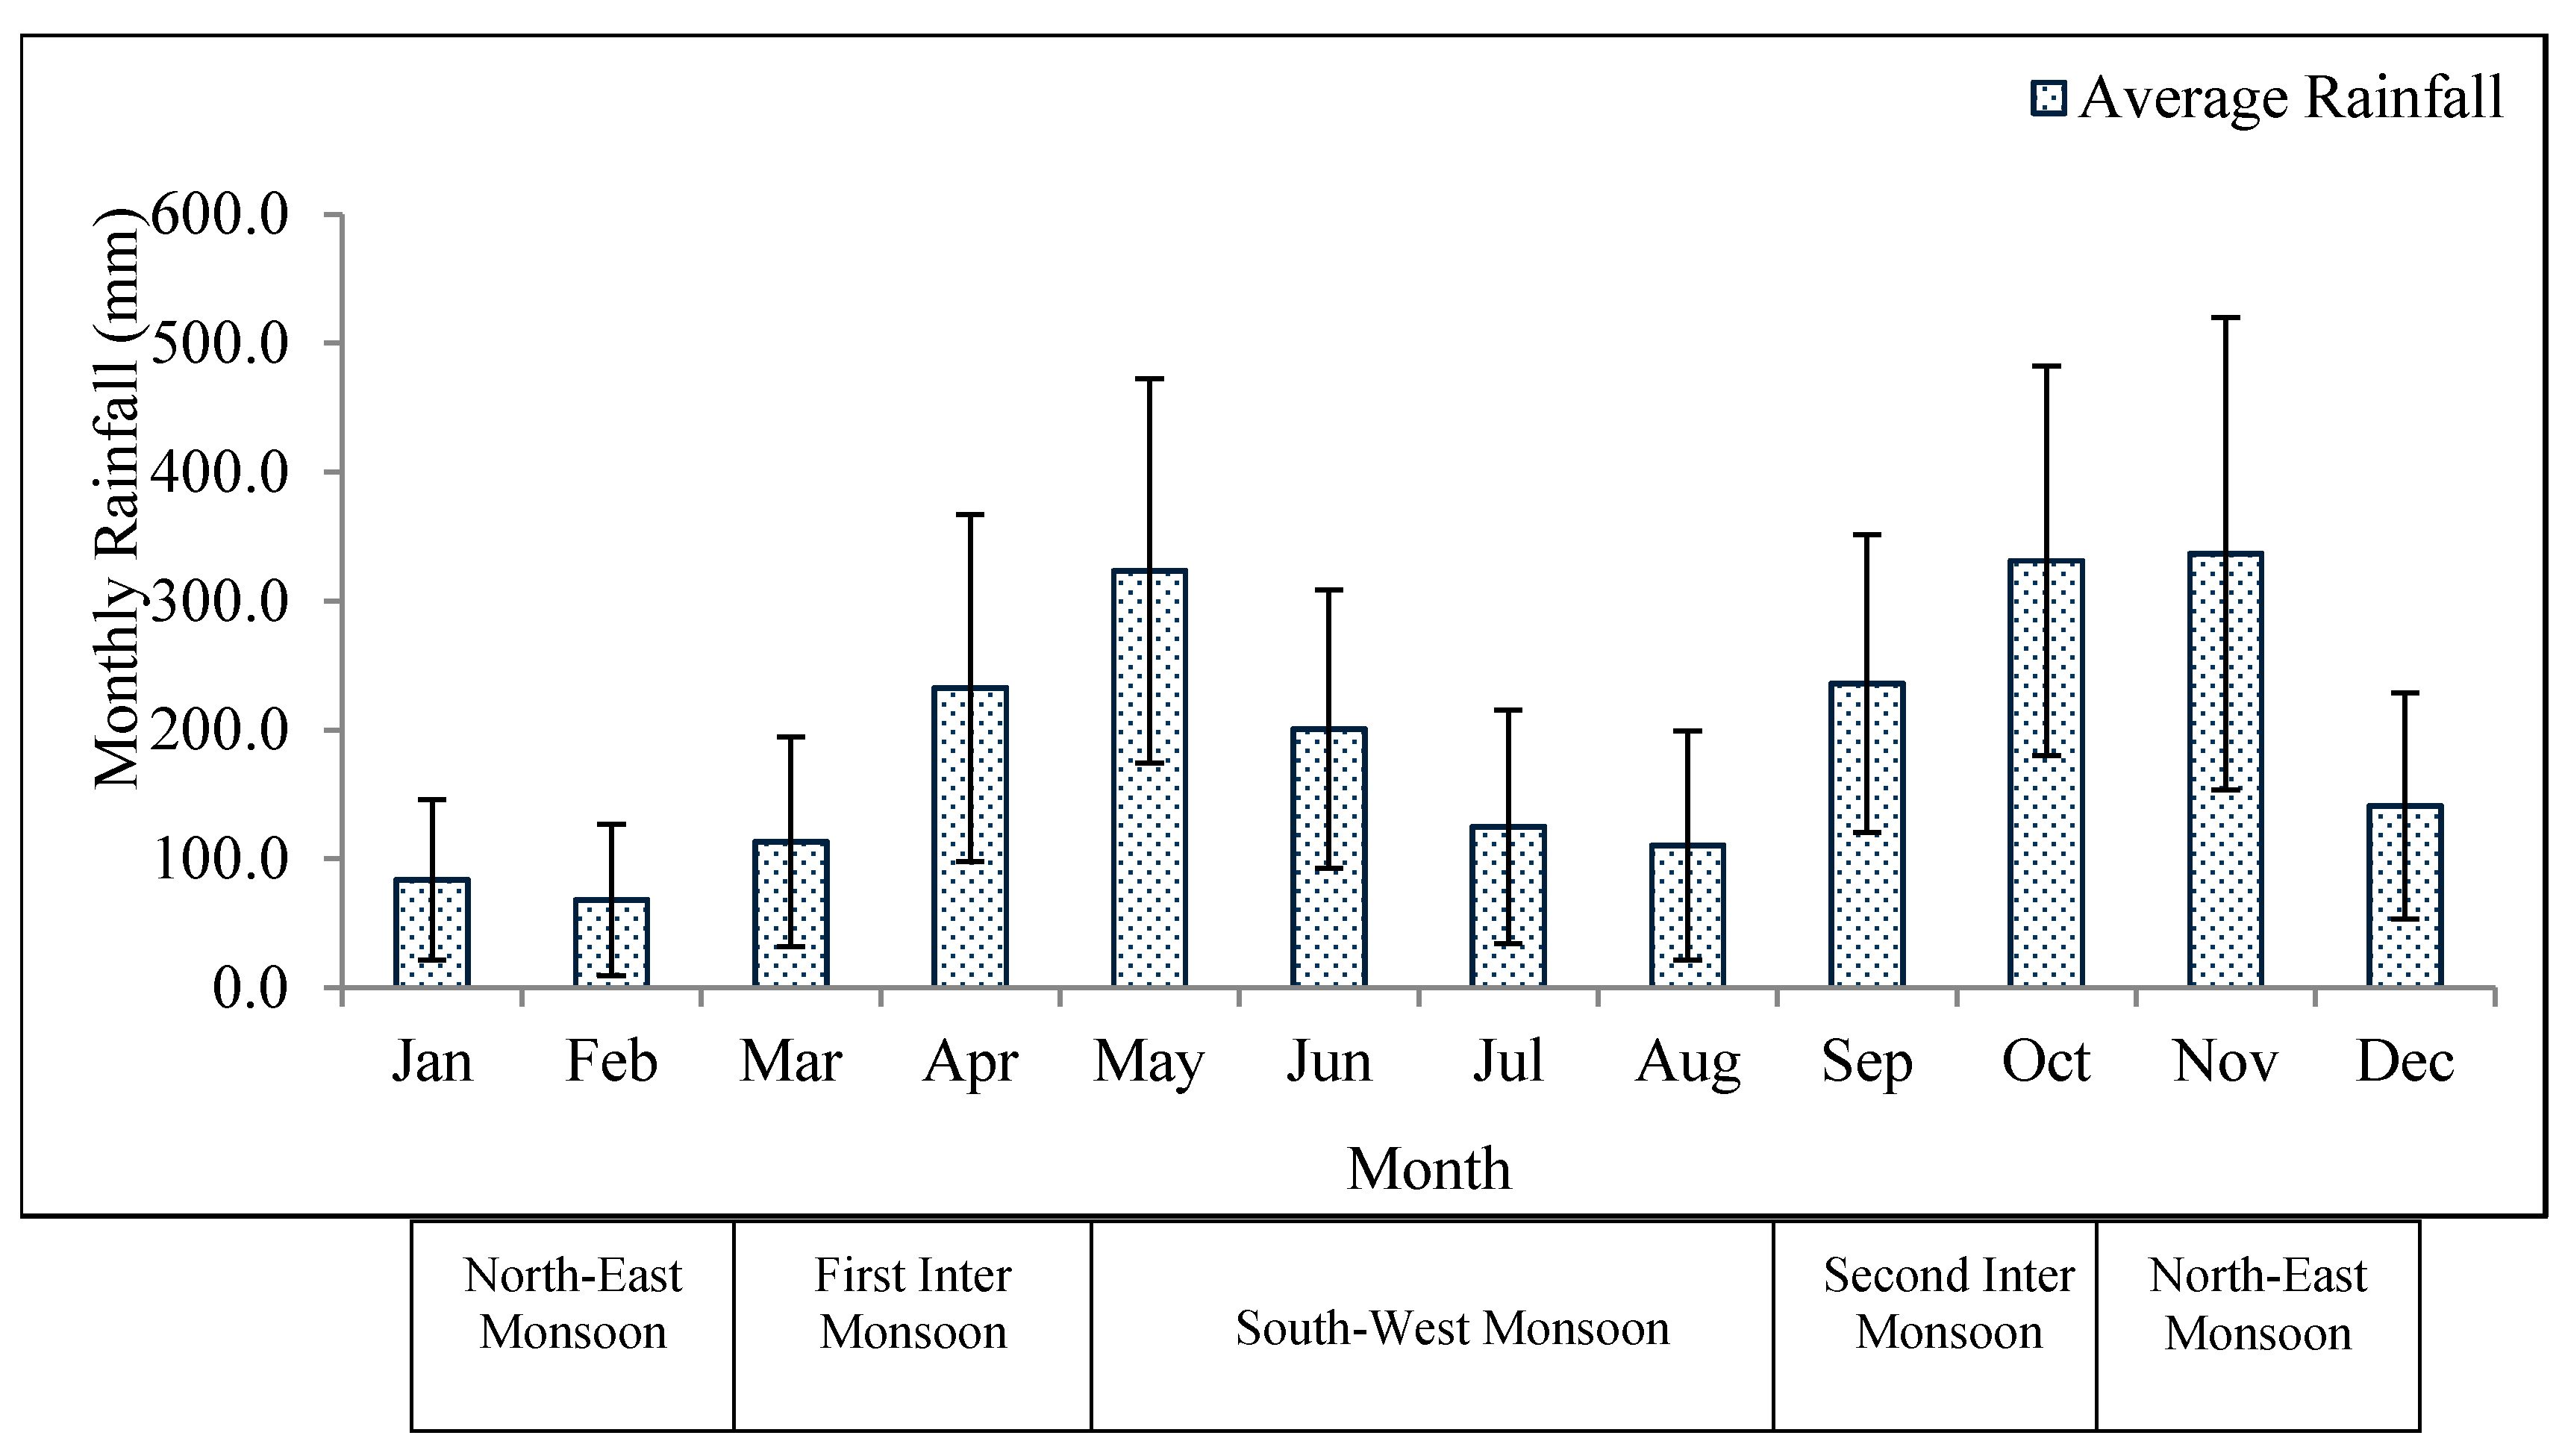
The rainfall climate of Sri Lanka is characterized by a bimodal distribution with peaks around May and September due to the passage of the inter-tropical convergence zone over the area during these times of the year [27]. In addition, the monsoonal influences and cyclonic storms from the Bay of Bengal contribute to high rainfall from October to December (Figure 3). In fact, the large standard deviations also coincide with these periods.
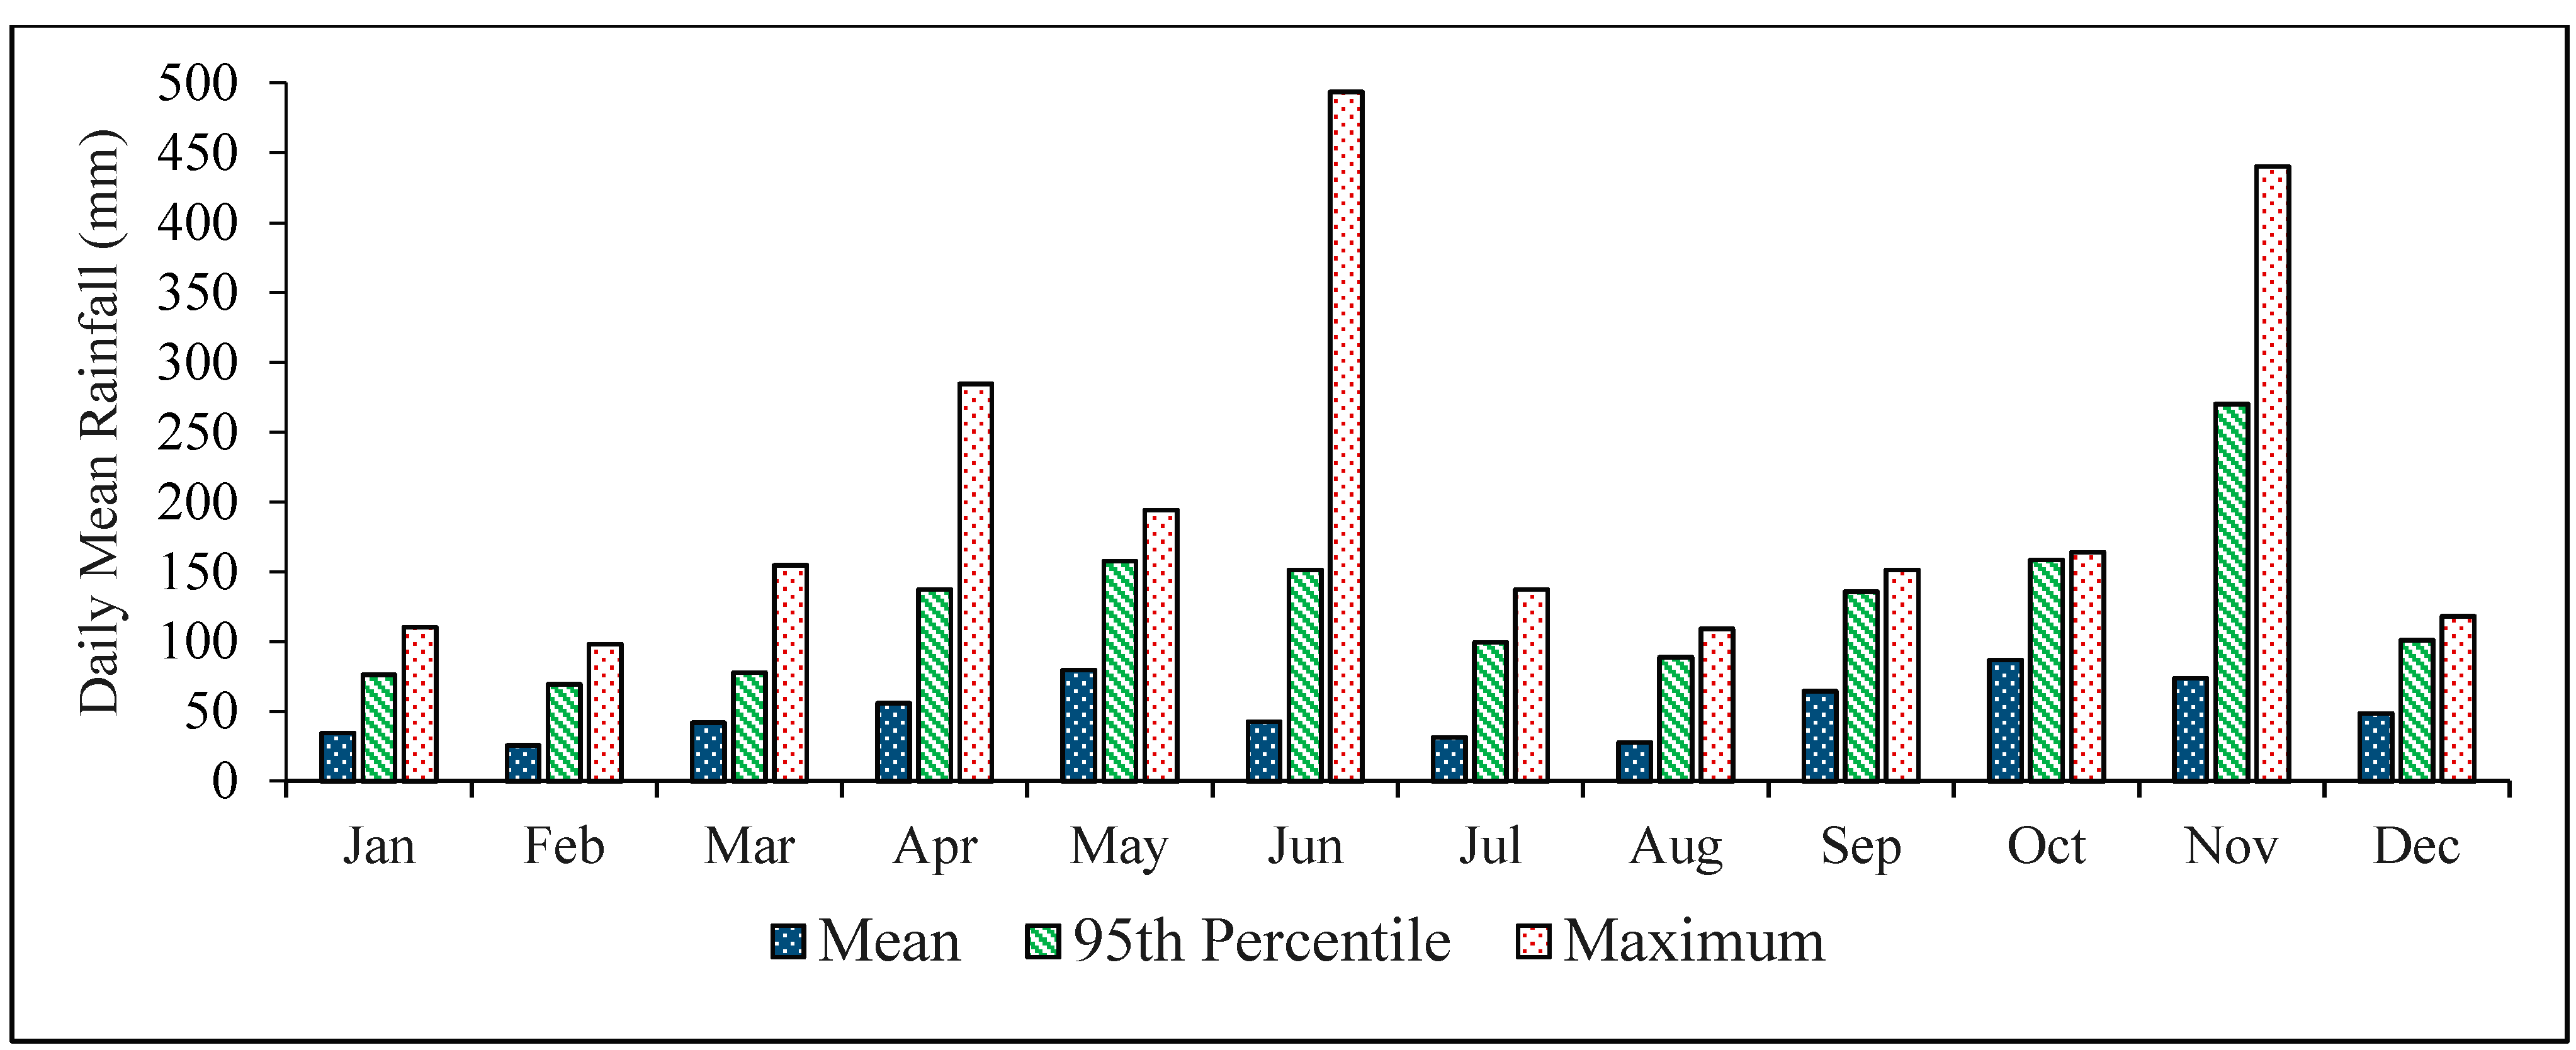
Maximum daily rainfall records have a significant influence on the daily rainfall distribution in the study site. Especially April, June and November clearly show a large amount of contribution from the maximum rainfall records (Figure 4). In April, there are usually convective afternoon thunderstorms in Sri Lanka due to higher seasonal temperatures. June and November are within the southwest monsoon and northeast monsoon, respectively. These climatological phenomena may have an influence on the higher daily rainfall amount, which accounts for the maximum rainfall of the daily series. Most of this maximum rainfall will result in excessive runoff, sometimes even leading to flash flood occurrences. In general, RWH systems are not designed to capture all of the rainfall, which is also not practical. However, RWH systems in Colombo need to consider the fact that, following these peak rainfall months there is a relatively long dry period. Therefore, a sufficient amount of water from the high rainfall should be captured by the RWH system to be utilized in the dry period. Excess rainfall captured by RWH systems during the wet periods may be able to alleviate flash flood incidents also.
Figure 3. Monthly rainfall variation at the Colombo Weather station (1981–2010) (whiskers on this histogram shows one standard deviation above and below the mean value).
Environments 02 00105 g003
Figure 4. Variation of the daily rainfall maximum records at the Colombo weather station (1981–2010).
Environments 02 00105 g004
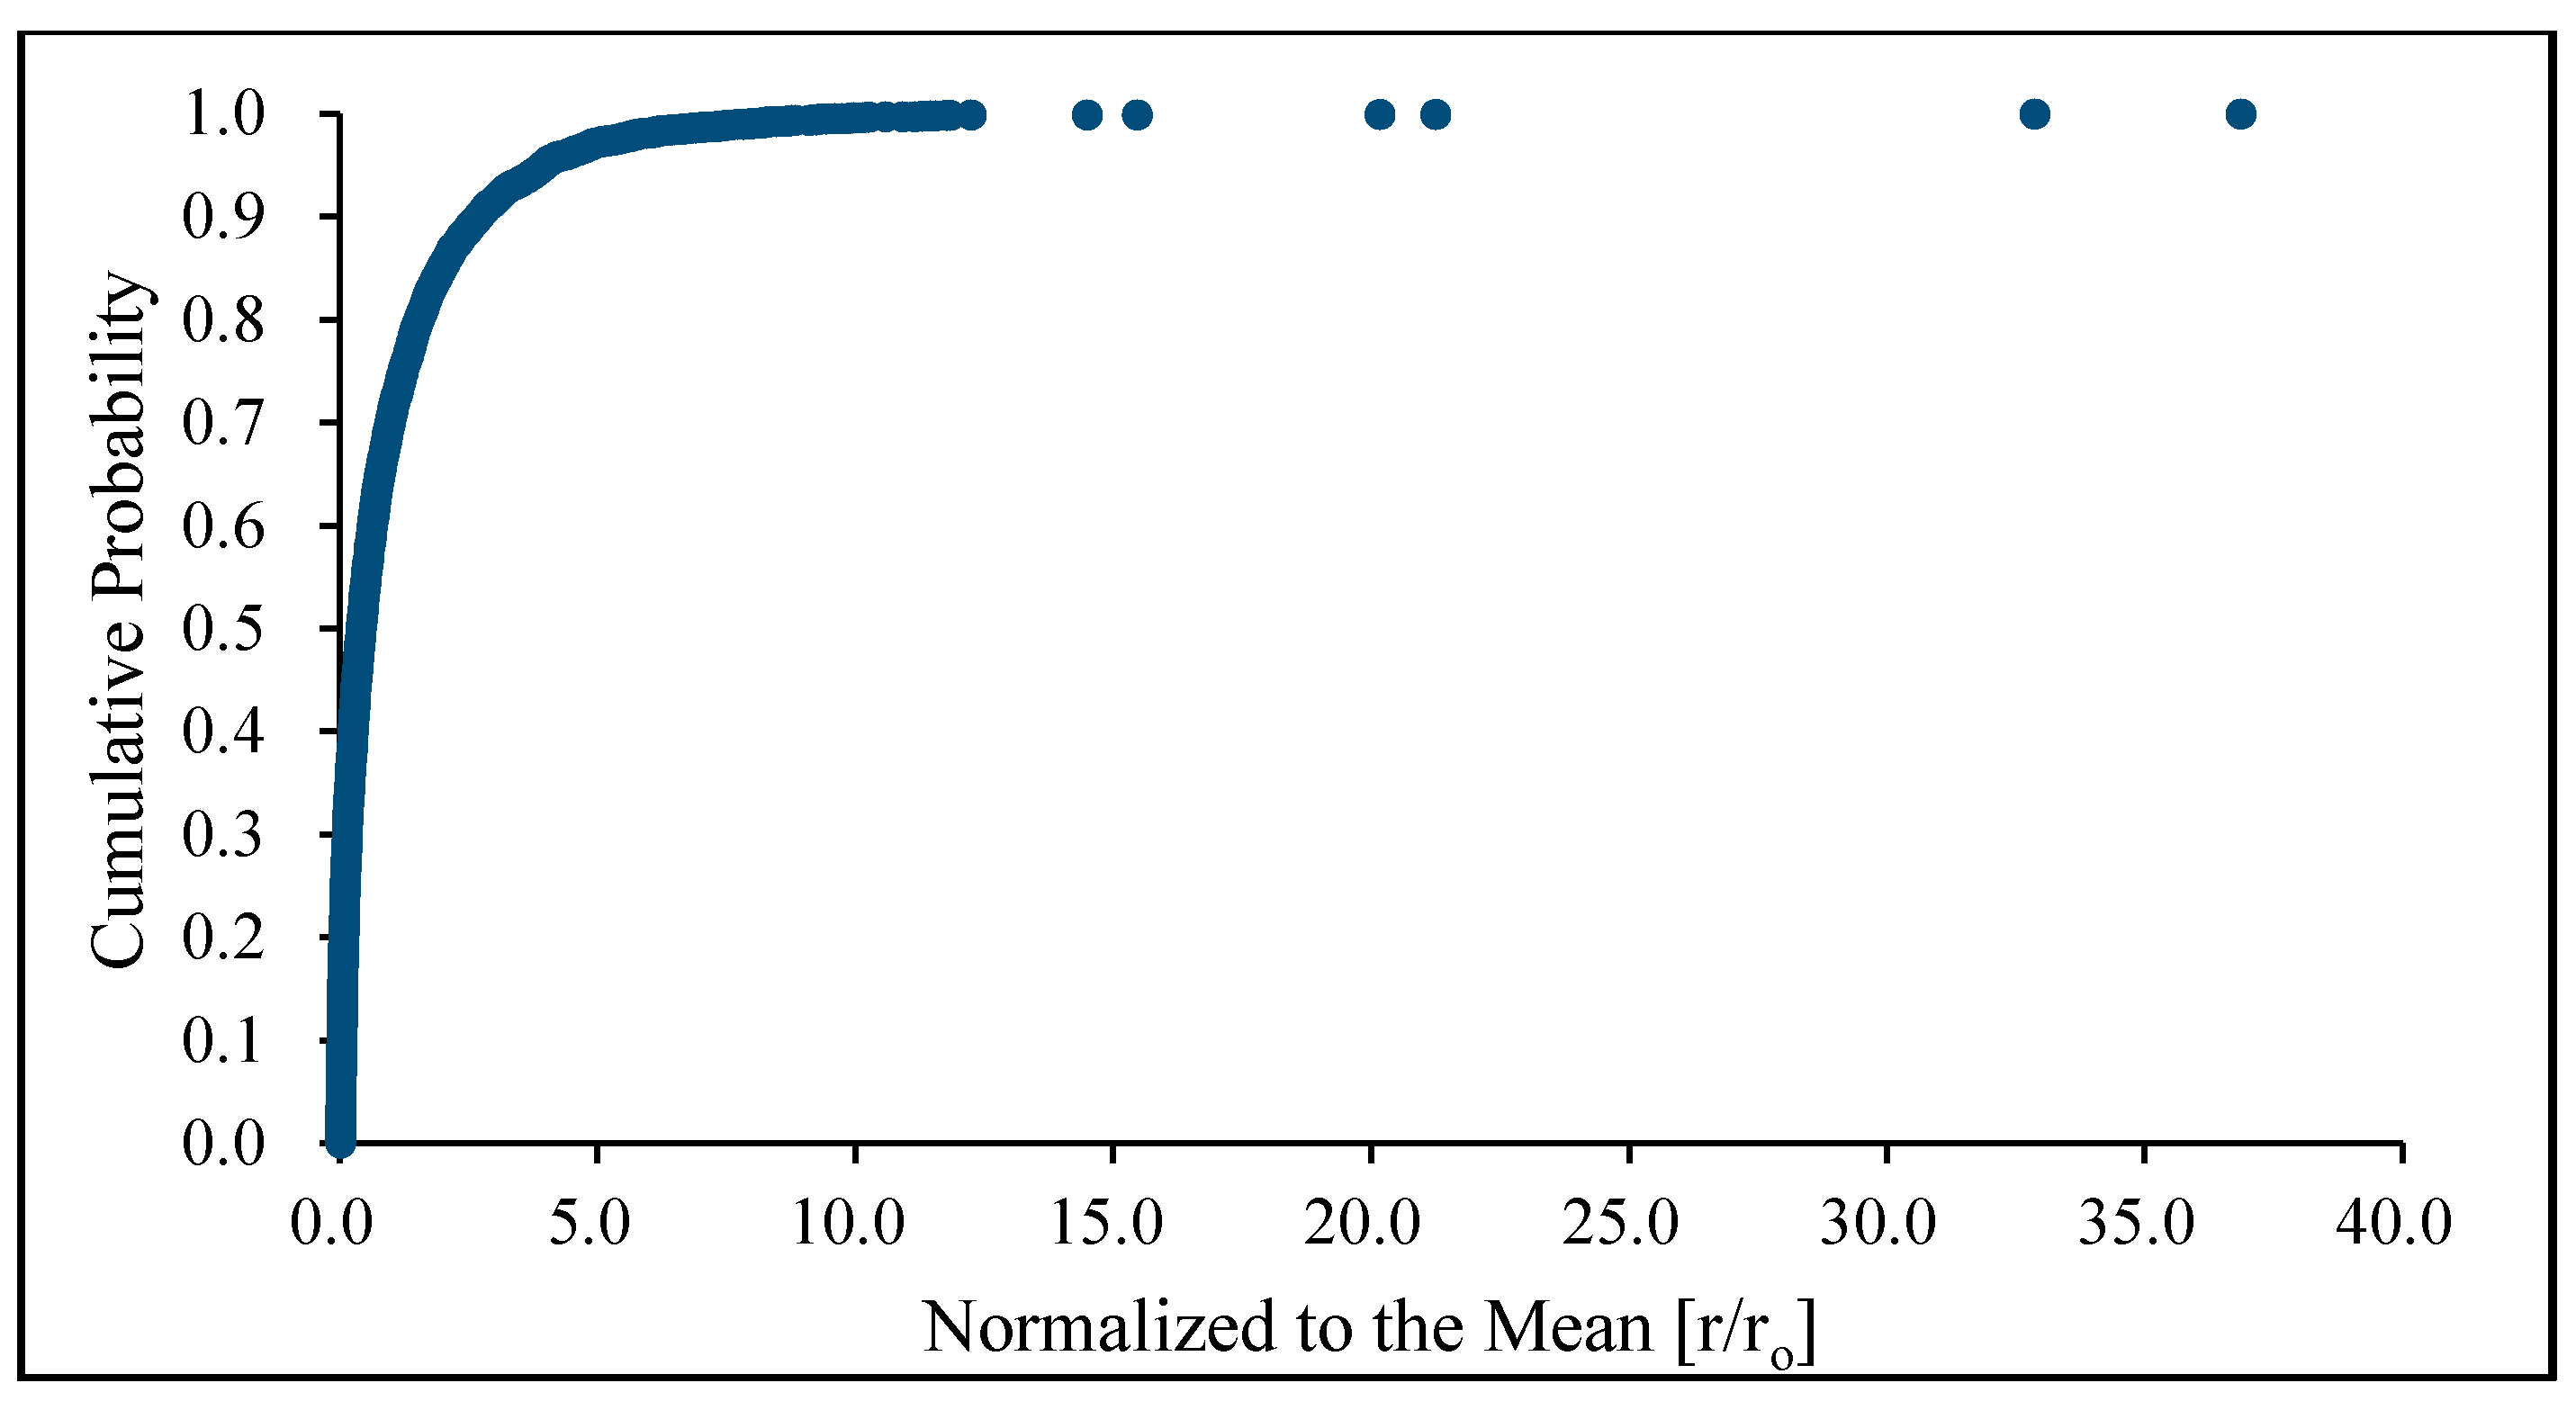
Figure 5 shows the cumulative probability distribution of the historical daily rainfall distribution in Colombo from 1981–2010. The rainfall distribution follows a power law function, whereas the extreme rainfall records (the outliers) follow a linear pattern. Colombo City shows several extreme daily rainfall cases within the past 30-year period.
Figure 5. Cumulative probability distribution of daily rainfall in Colombo (1981–2010) X-axis-normalized daily rainfall values (rainfall(x)/Average rainfall(xo)).
Environments 02 00105 g005

3.2. Statistical Downscaling of Climate Change Projections
It is more effective to use different types of AOGCMs and emission scenarios in determining future climate change. This helps to identify a wide spectrum of different climate change projections and allows a possible comparison between different emission scenarios. Although most AOGCM outputs are available for all three emission scenarios, this study selects only six AOGCM model results.
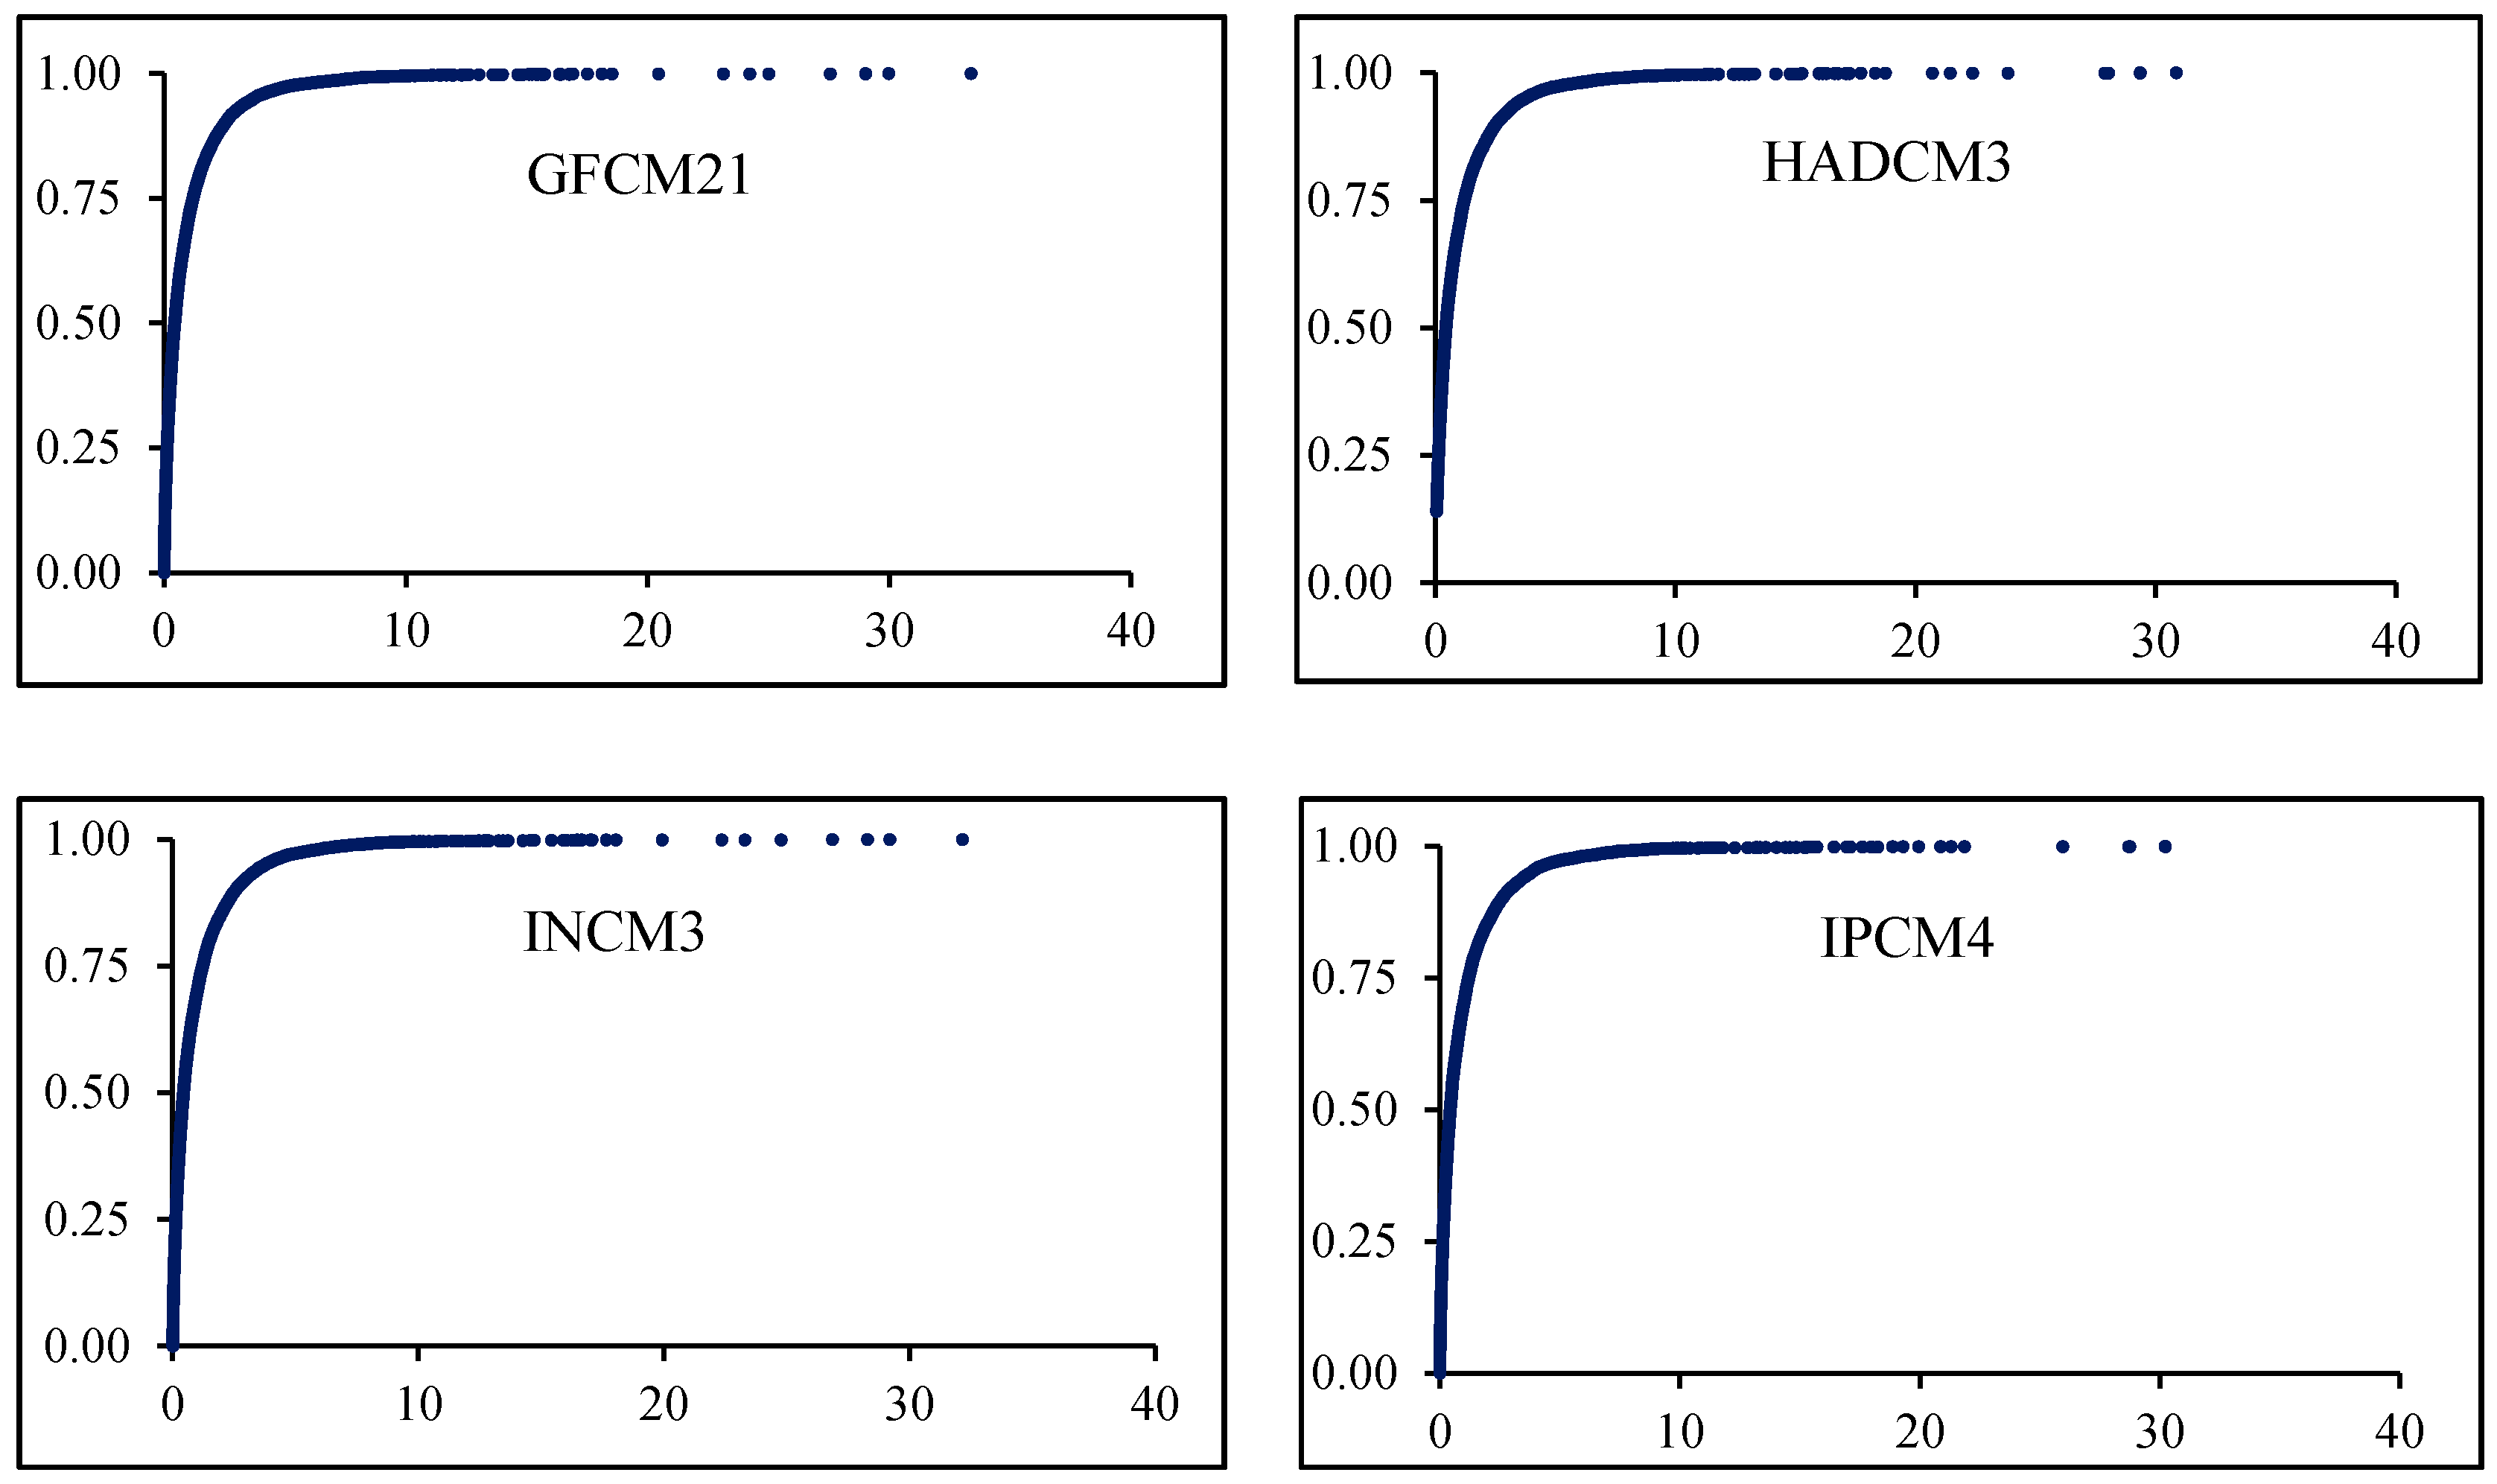
The cumulative probability distribution of the projected future daily rainfall records for Colombo shows that there will be some extreme events with great intensities. The distribution patterns for all six model outputs show more or less similar extreme events (Figure 6).
Figure 6. Cumulative probability distribution of the projected daily rainfall for the Colombo study area from the selected climate models under the A1B emission scenario (2011–2099). Note: X-axis-normalized daily rainfall values (rainfall(x)/rainfall(mean)).
Environments 02 00105 g006aEnvironments 02 00105 g006b
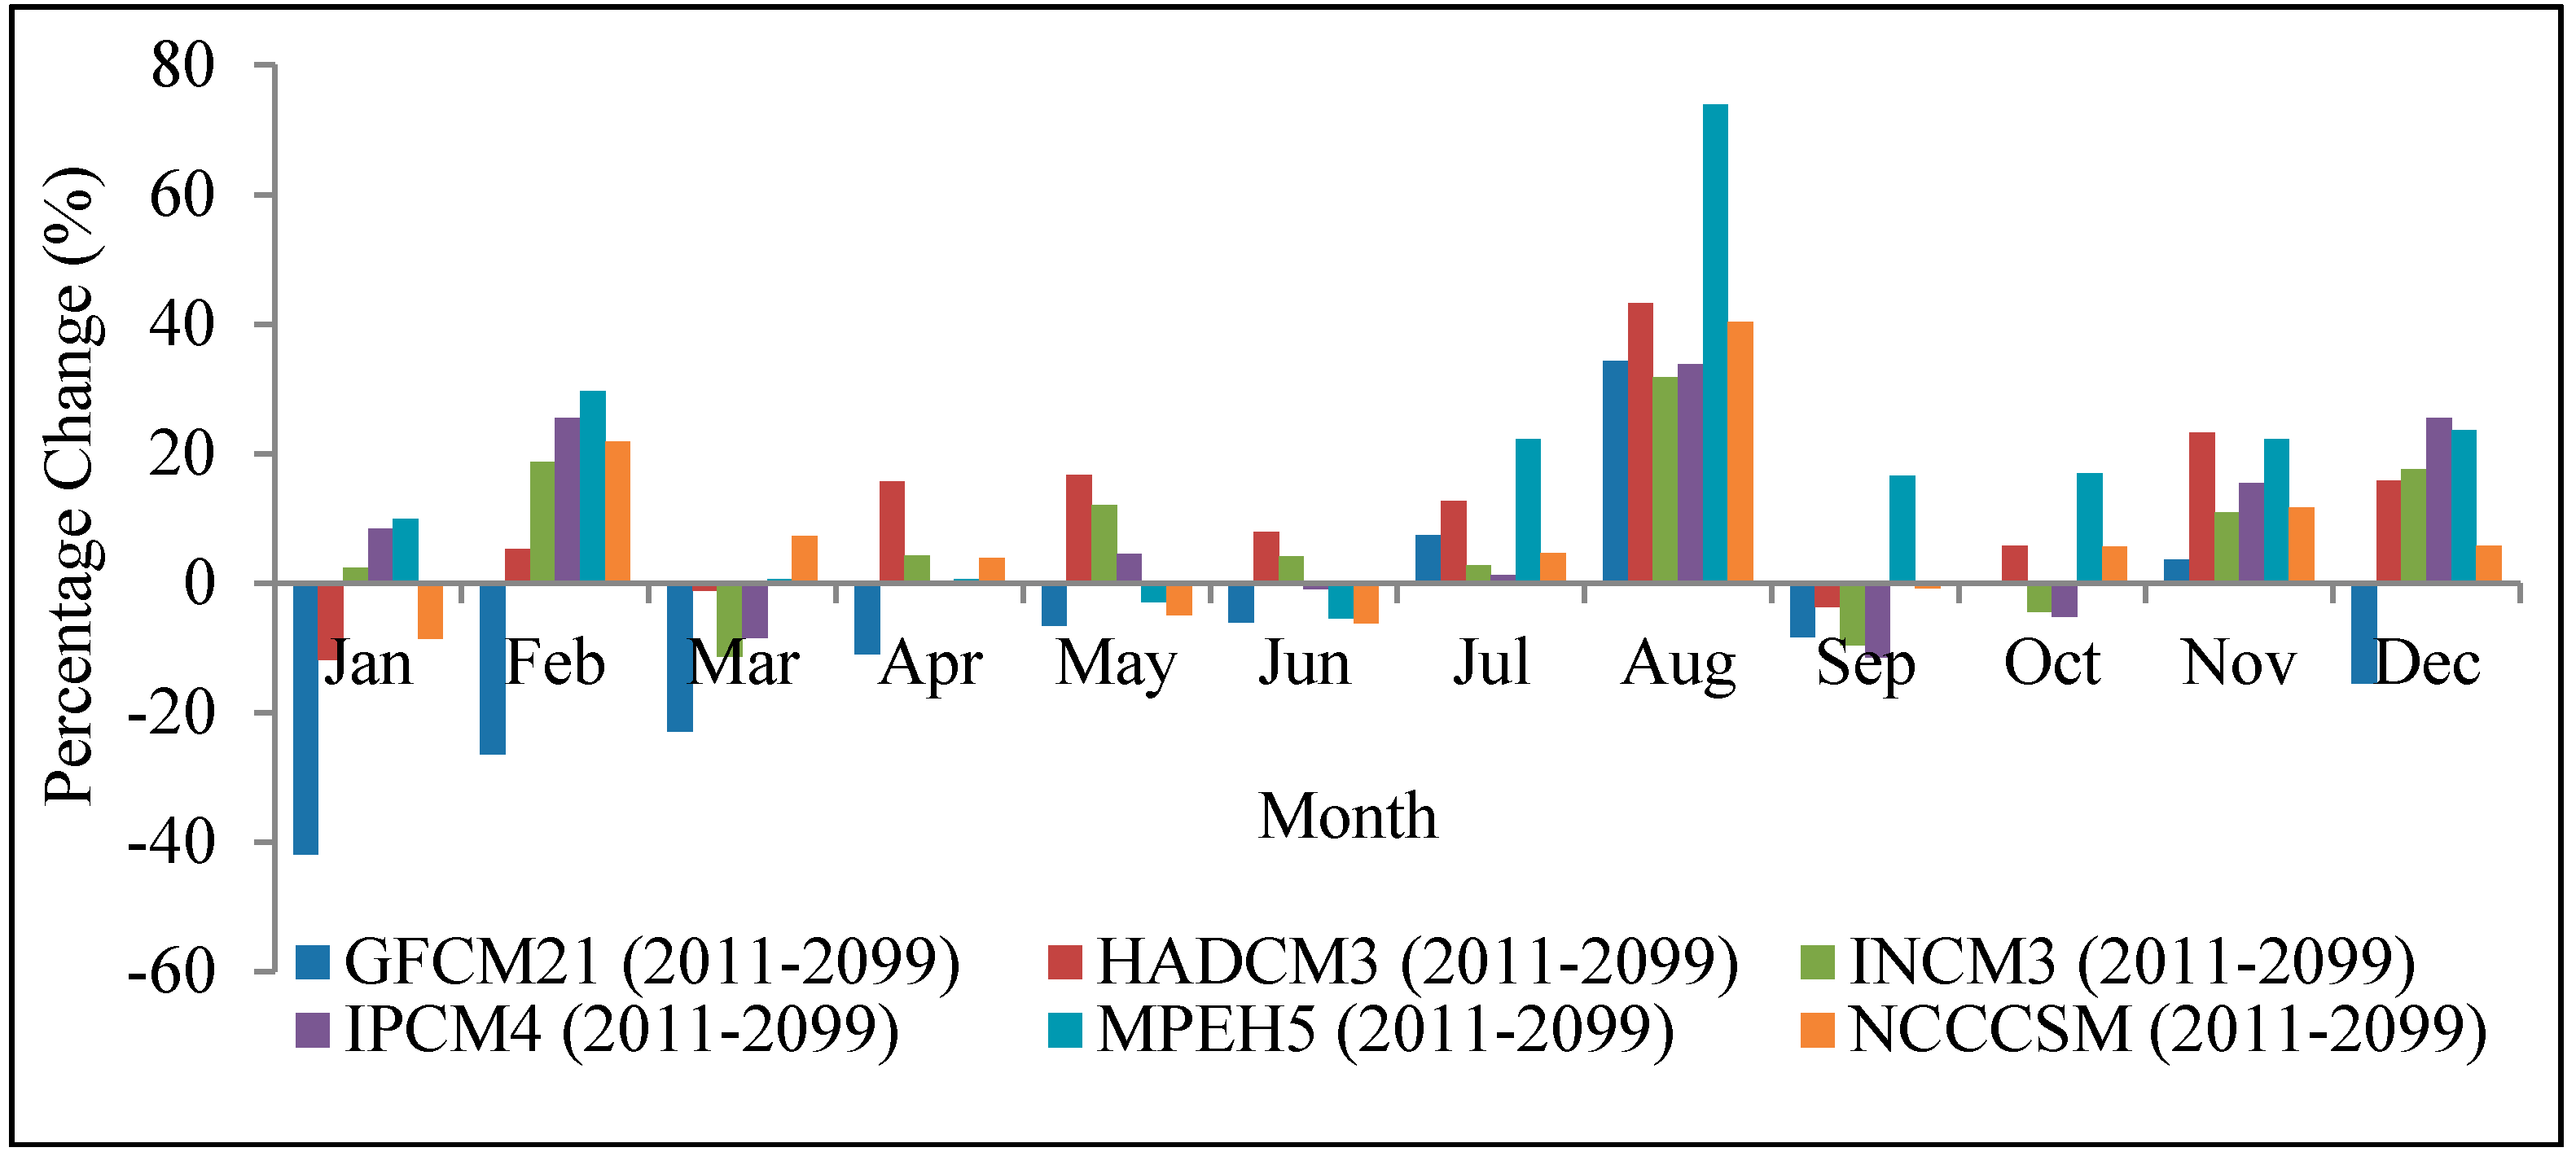
Figure 7 shows the percentage change of mean daily rainfall. According to Figure 7, the majority of the model projections for Colombo has increased rainfall projections throughout the year. However, in July, August and November, all six models show a positive rainfall change. Overall, August results have much higher maximum rainfall change than the other months.
Figure 7. Percentage variation of the mean daily rainfall records of the Colombo study area with reference to the historical mean values and model projections.
Environments 02 00105 g007
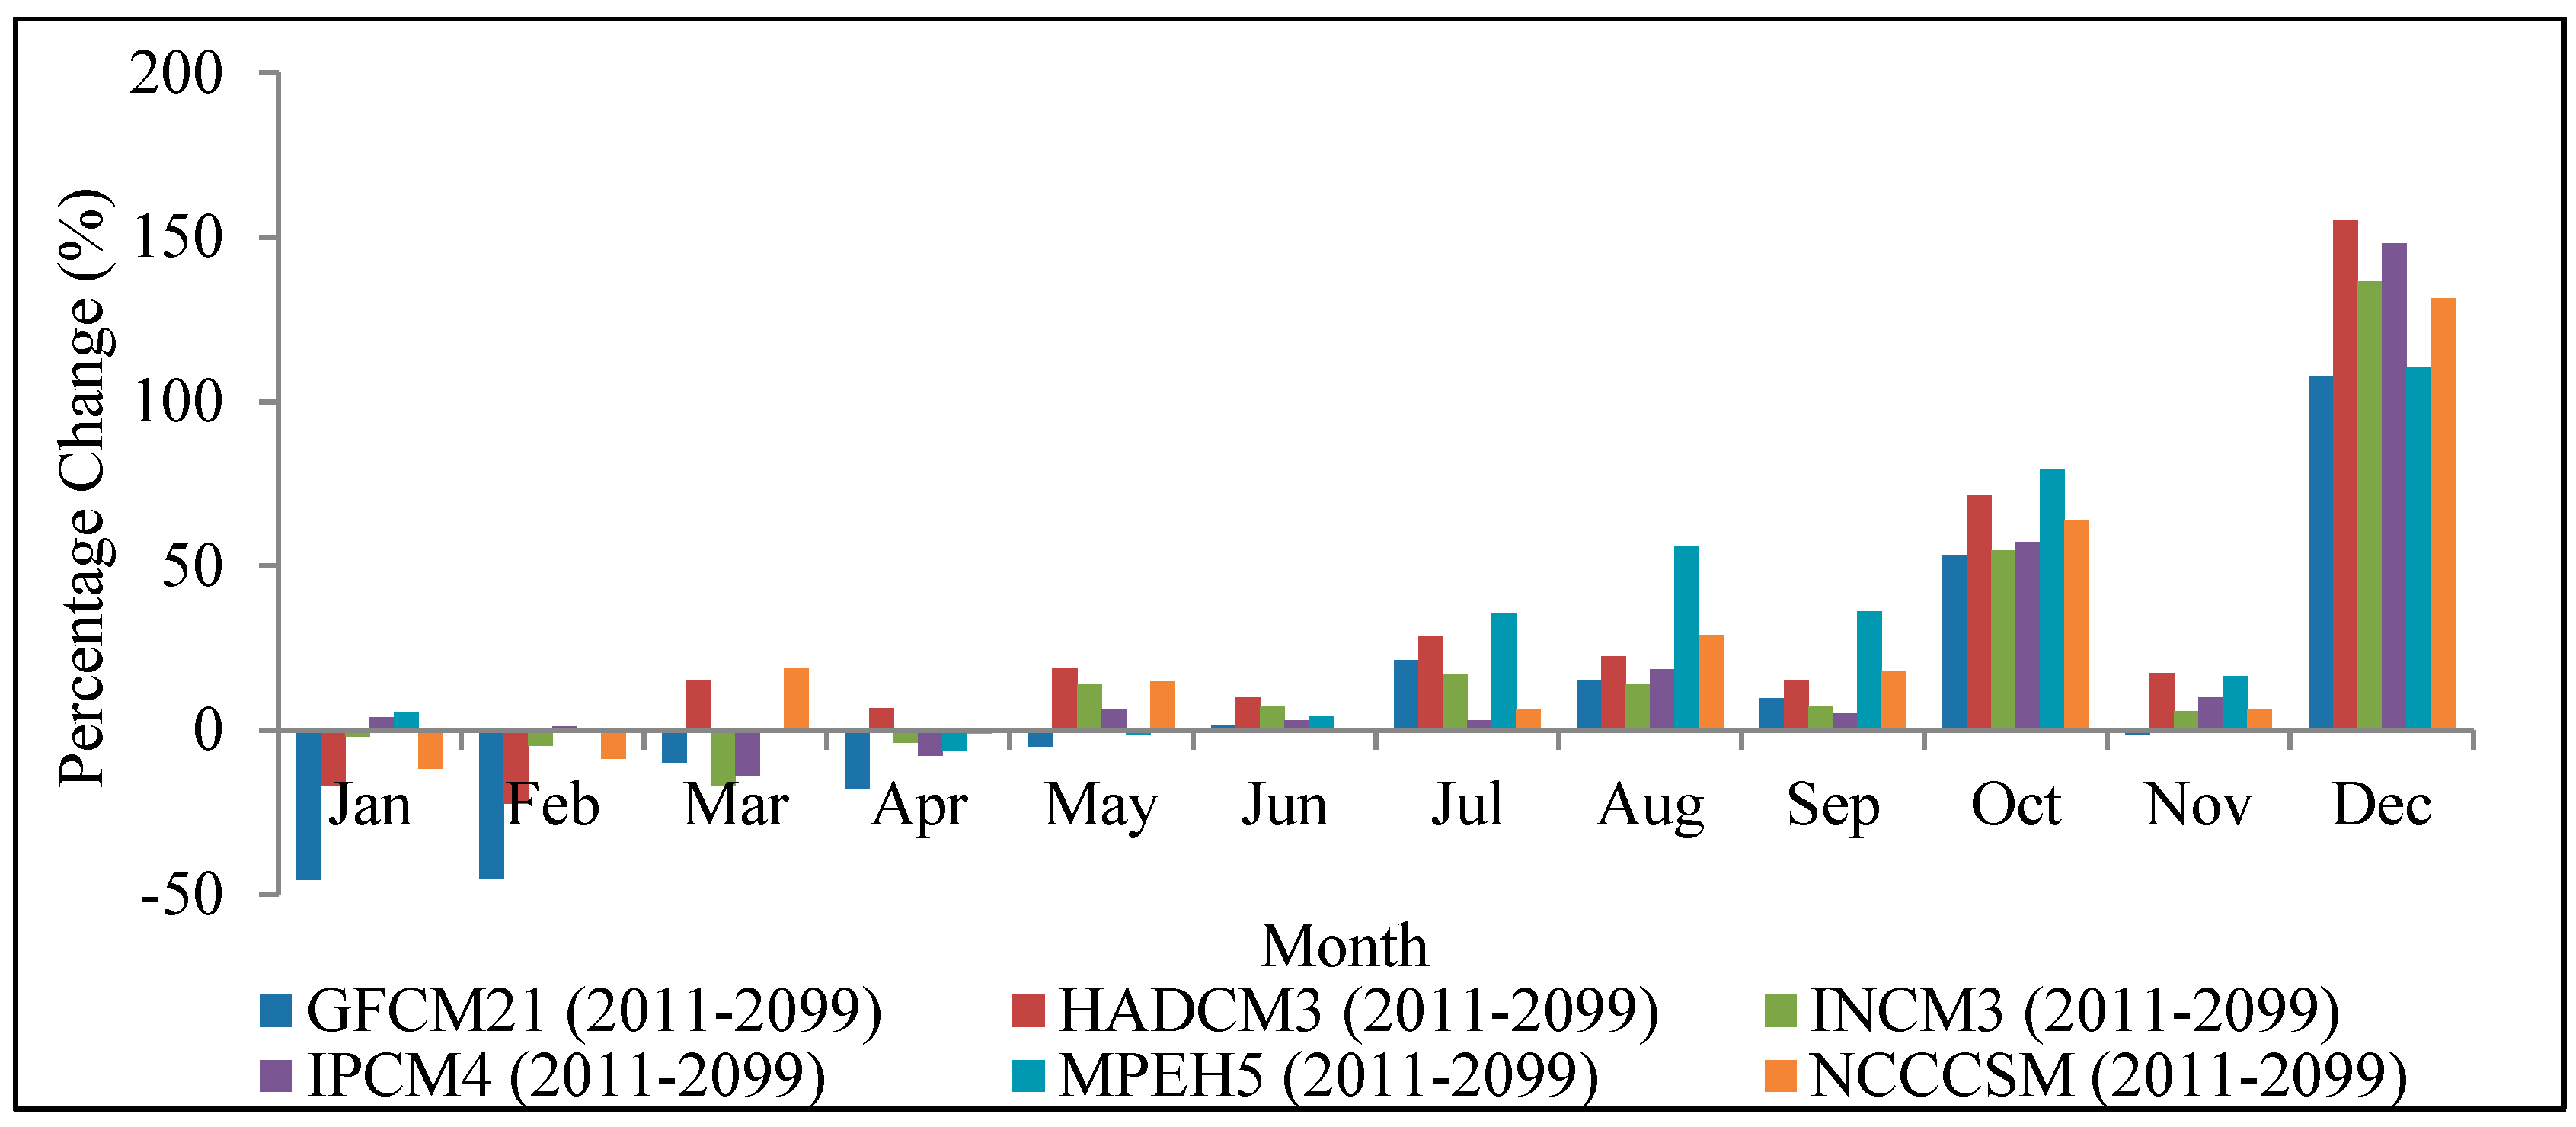
Figure 8 shows the percentage change of maximum daily rainfall. The majority of the positive changes are reported in the last six months, while the majority of the negative maximum rainfall changes are reported in the first few months. This trend signals that the use of RWH can be useful, especially during the first few months of the year. However, to effectively utilize the harvested rainwater, the system should be capable of capturing enough rainfall from the rainy days of the later months of the year.
Figure 8. Percentage variation of the maximum daily rainfall records of the Colombo study area with reference to the historical mean values and model projections.
Environments 02 00105 g008
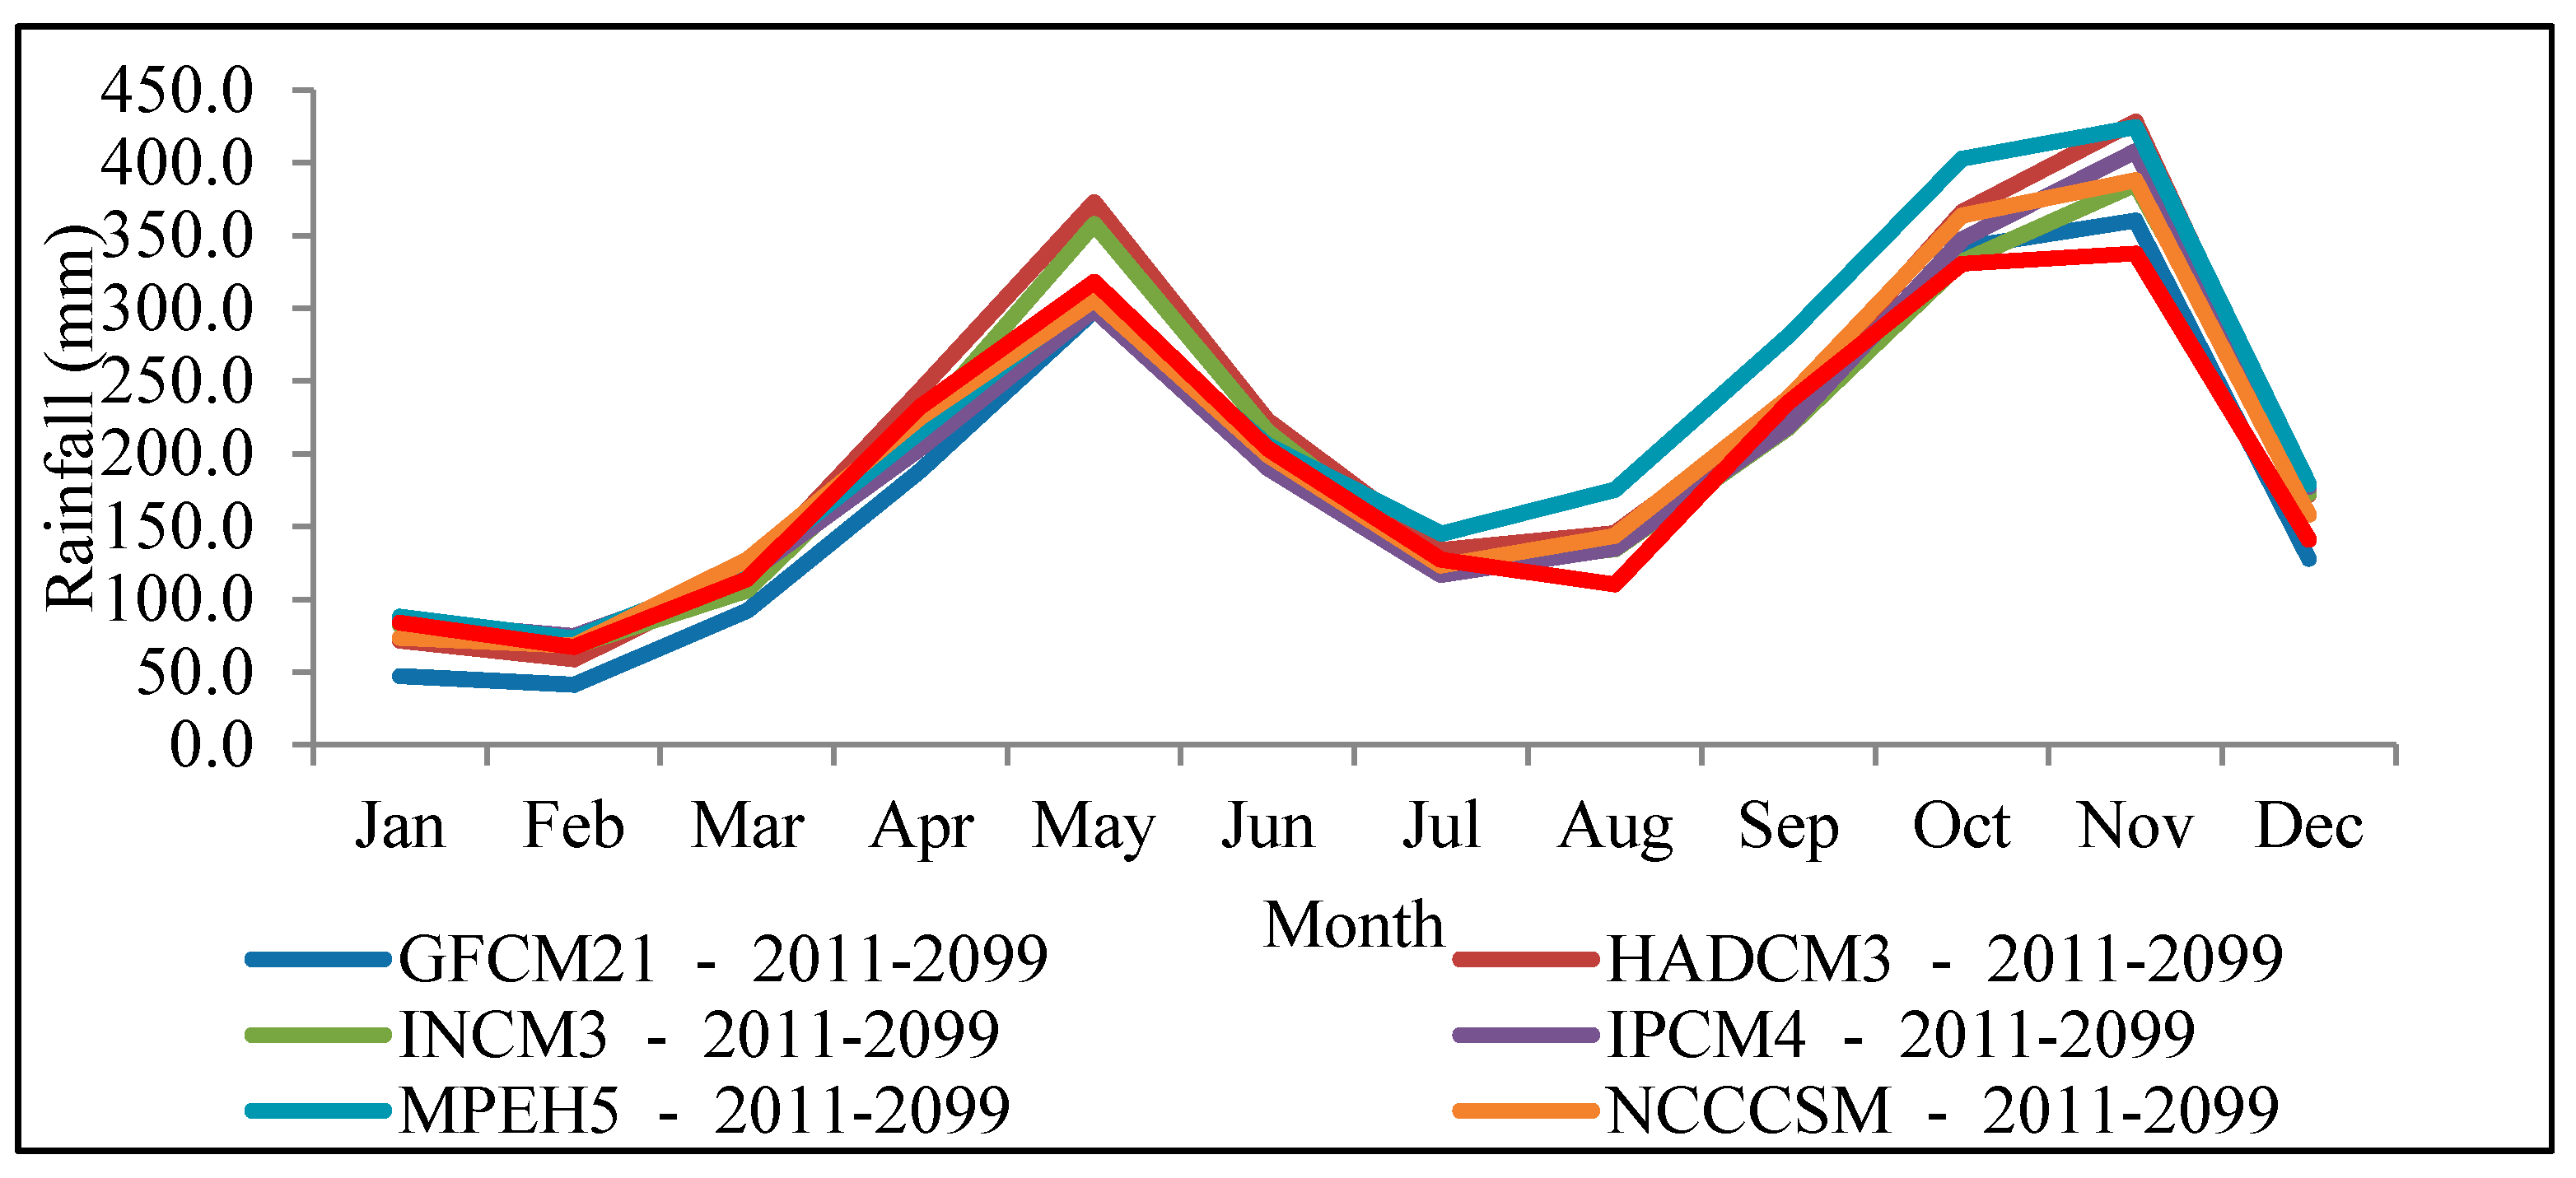
In general, under the A1B emission scenario, the projected monthly rainfall shows smaller variations than that of the historical mean value for all six selected climate change models (Figure 9). However, each model projection has acted differently in different months. Especially during the months of October and November, almost all of the models have projected higher monthly rainfall values. For example, the HADCM3 model has projected average monthly rainfall of 428.3 mm for November, where the average historical rainfall for November is 337.8 mm, almost a 100-mm difference. Rainfall changes of this magnitude can have a significant impact on RWH systems.
Figure 9. Monthly rainfall variation of the Colombo weather station with the selected climate change model outputs (2011–2099) for the A1B emission scenario.
Environments 02 00105 g009
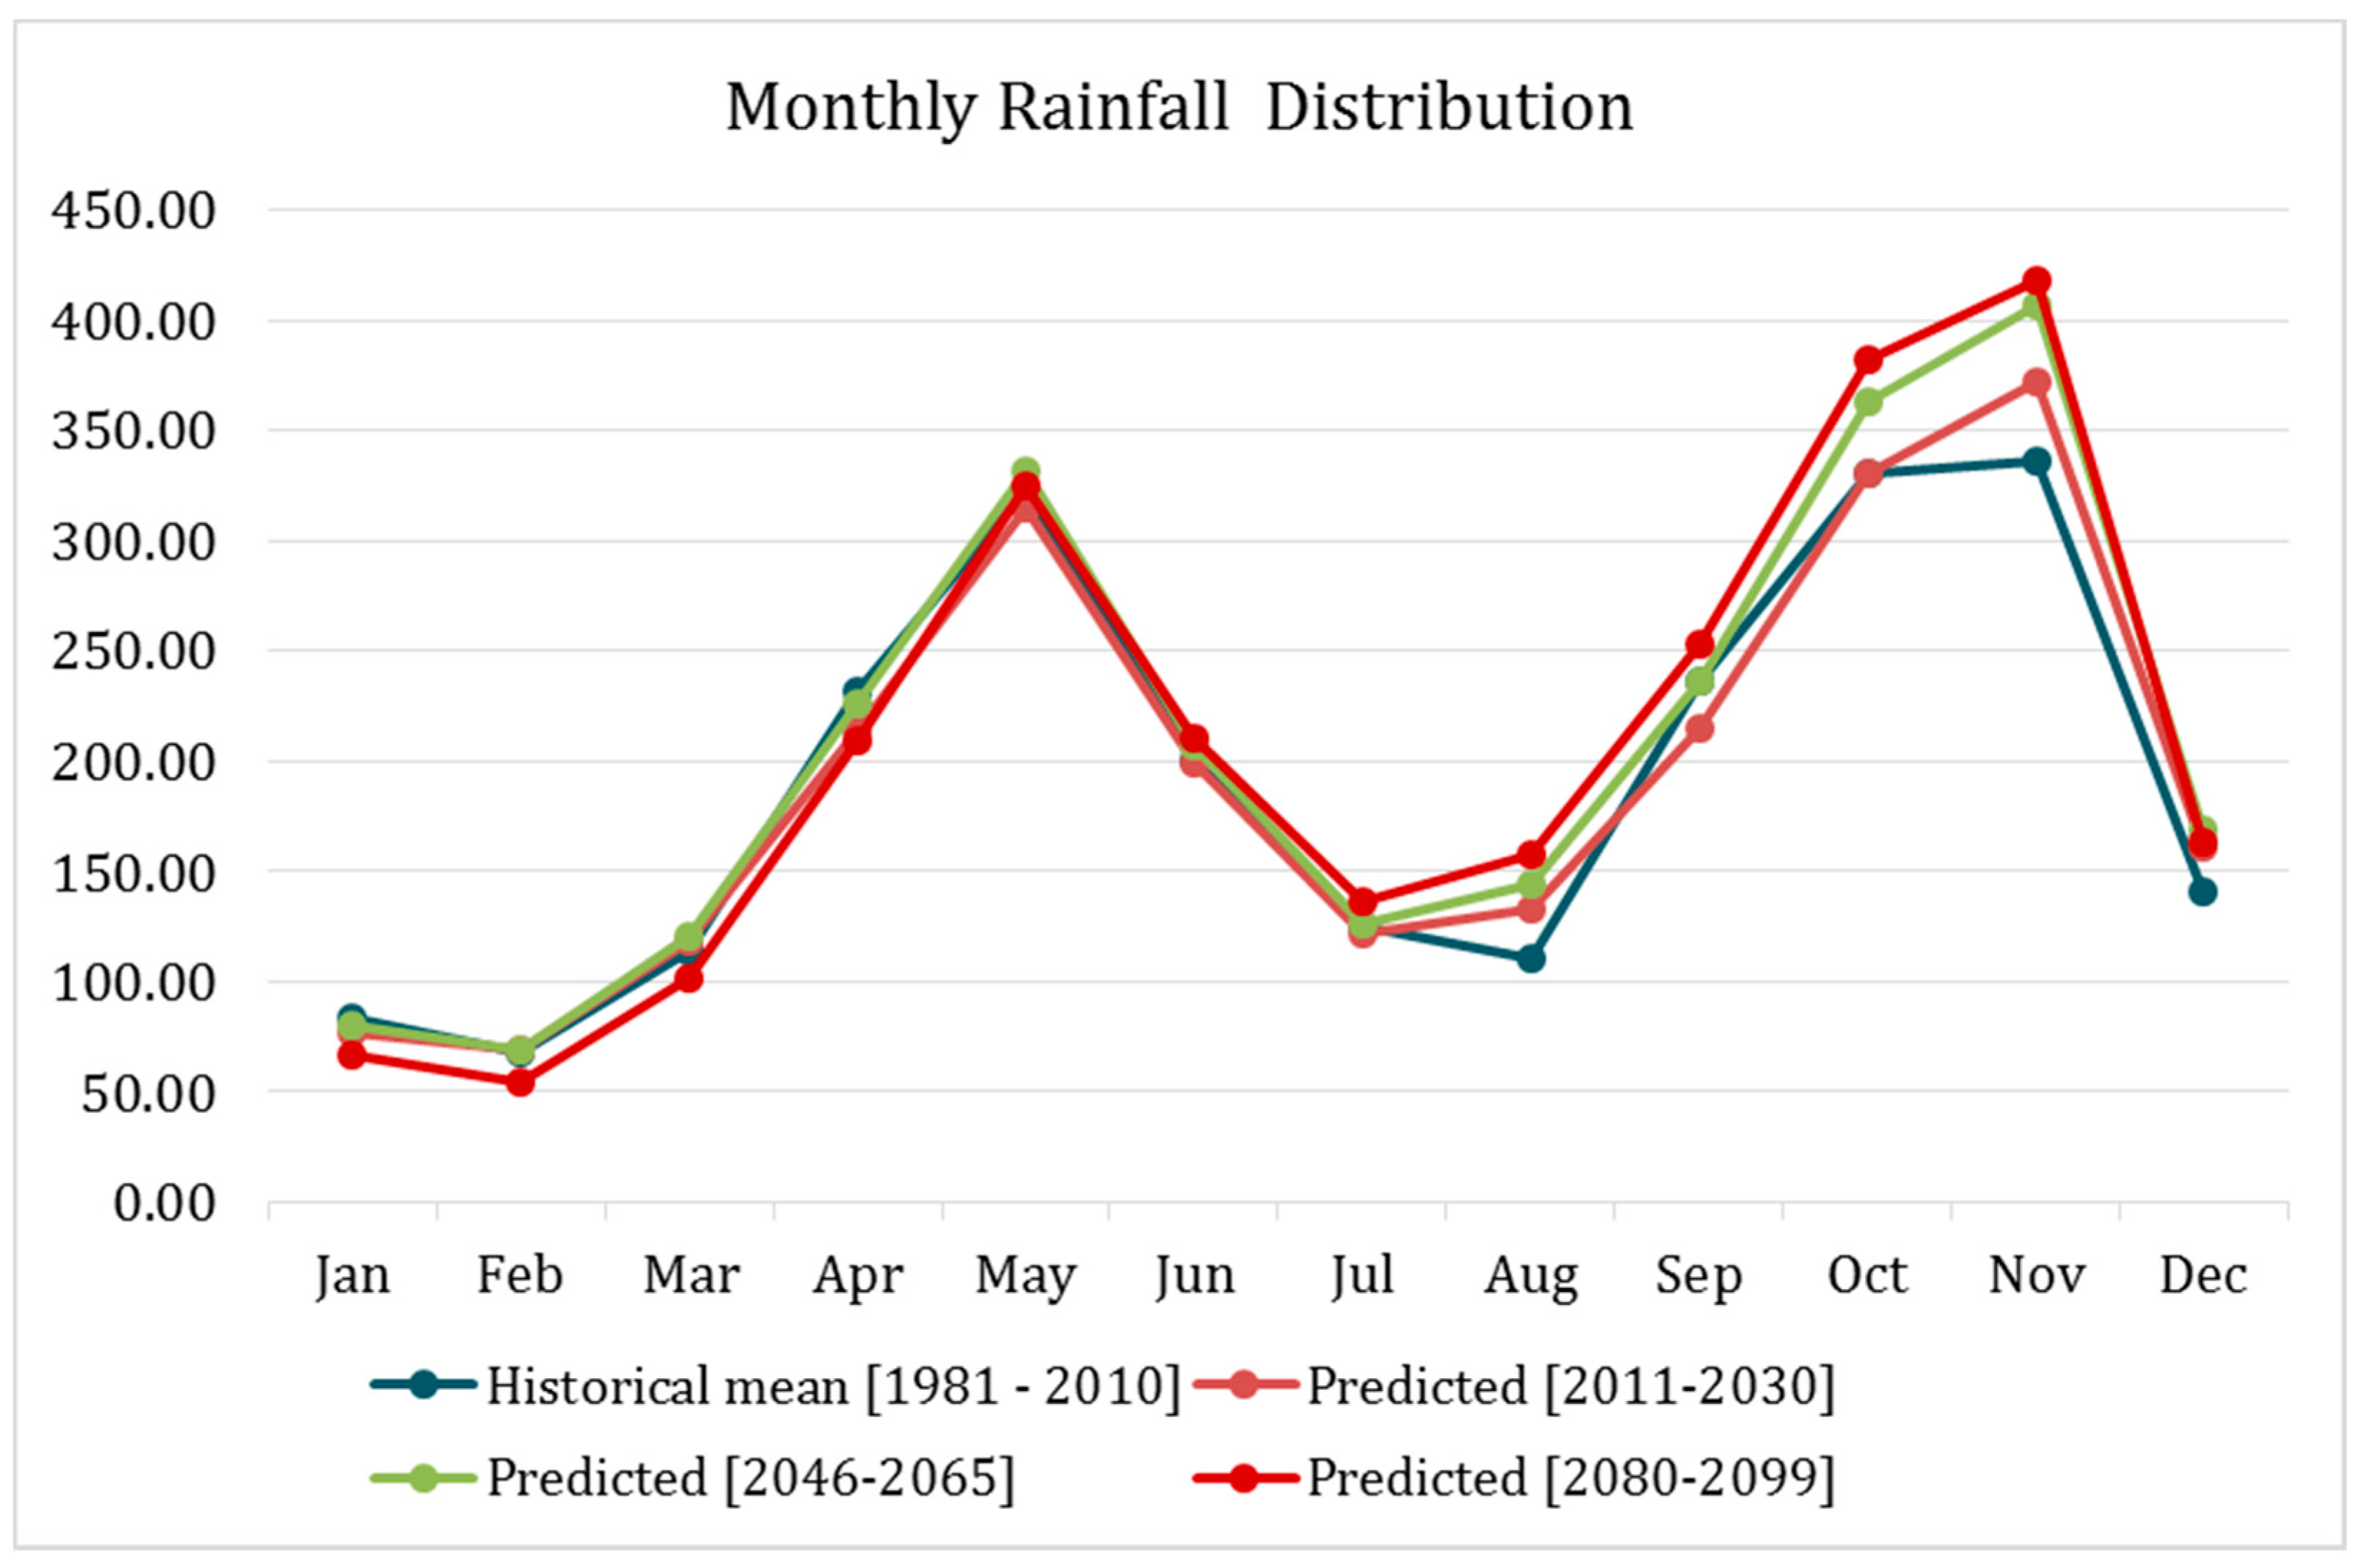
The future rainfall prediction is divided into three segments of equal duration (20 years each) as 2011–2030, 2046–2065 and 2080–2099. The monthly rainfall variation of these three segments is compared with the historical rainfall (1981–2010) (Figure 10). All three segments show that there will be rainfall increases in the later months towards the end of the century, which are due in part to the southwest monsoon (May–August) and the second inter-monsoon season (September to early November). There is also a slight decrease in the northeast monsoon (January–February). The southwest monsoon and the second inter-monsoon season are the two most contributing weather systems for rainfall in the Colombo area. These results, therefore, suggest that towards the end of the coming century, Colombo will be faced with heavy rainfall and potential floods.
Figure 10. Multi-model mean annual rainfall projections (A1B) at Colombo for three time segments: 2011–2030, 2046–2065 and 2080–2099.
Environments 02 00105 g010
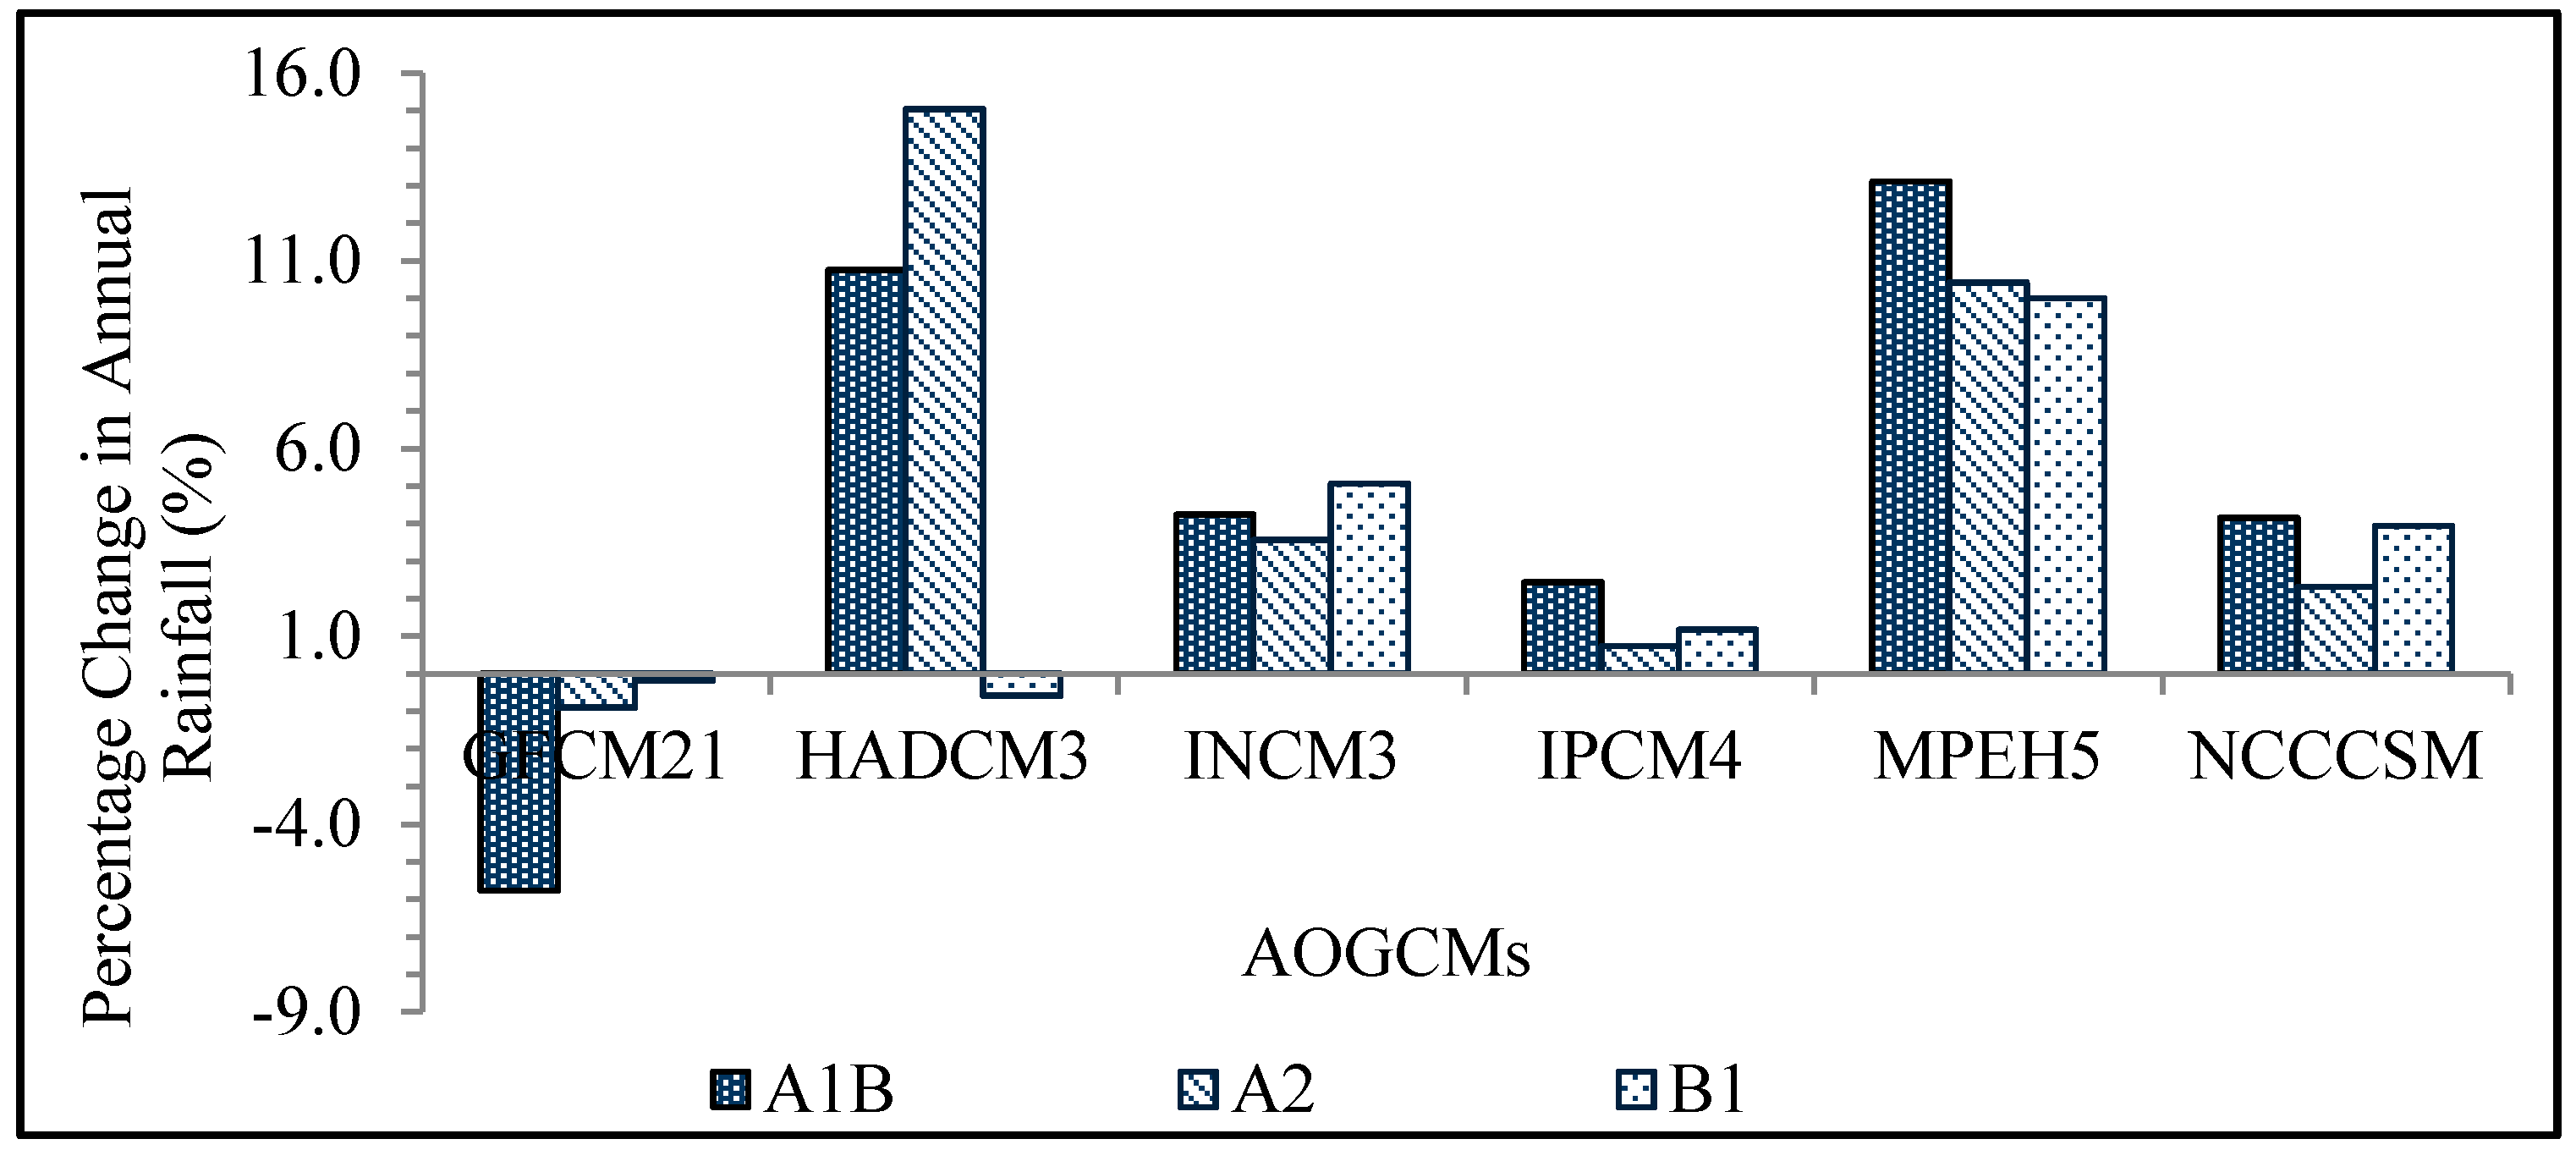
The INCM3, IPCM4, MPEH5 and NCCCSM models have all positive percentage changes for all three-emission scenarios (A1B, A2, B1), while HADCM3 model results show a negative percentage change in the B1 scenario, and GFCM21 projects all negative percentage changes under the three emission scenarios (Figure 11). Climate simulations for the next 100 years indicate that the rainfall regime in Colombo is likely to change. Figure 11 shows that there are five climate models (out of the six selected) that predict Colombo’s annual rainfall increase with reference to the historical baseline value, which is consistent with recently observed meteorological trends.
Figure 11. Percentage change in the annual rainfall at the Colombo weather station under different climate change projection model outputs (2011– 2099) with respect to the historical annual mean rainfall (1981–2010).
Environments 02 00105 g011

3.3. Modelling the Rainwater Harvesting System

Rainwater harvesting systems should be modelled in accordance with the water balance equation. This study considers urban households in a residential context, as well as a non-residential context with different storage tanks and different catchment areas as expressed in Table 2. Taking a wider range of RWH systems into consideration can capture the wide range of impacts to different RWH systems.
This study also has incorporated a portion of the rainwater usage in the urban landscaping and gardening. Evapotranspiration is the process responsible to remove water from fields, including evaporation from the soil and transpiration from plants. Since all urban households in this study have a portion for urban landscaping, the computation process of the outdoor water demand involves the landscape evapotranspiration value. A single series of monthly evaporation values at the study sites is used to calculate landscape evapotranspiration. The potential changes in the evaporation values in the future are not reflected upon the landscape evapotranspiration values.
Six RWH system types are used to represent the entire urban community. These types should represent or cover most of the urban sector. Two scenarios to represent the low water consumption rate, as well as the high water consumption rate are applied to residential and non-residential types. The RWH system model has several critical aspects in regards to its performance. The most important factor is the storage tank. Once the size of the storage tank changes, the respective water securities for a given system also change dramatically. However, the storage capacities are based on the average size of the actual RWH systems in use in Colombo City. As this study focuses on the urban context, the space of a RWH system is also very critical. However, with the introduction of recent new laws and regulations, the RWH system is mandatory in new constructions in Sri Lanka. Architects and civil engineers have to try novel ways to squeeze the available space to make room for RWH systems. Nevertheless, RWH systems are still not that popular among private sectors, especially at the small household level.
Rainwater catchment area is also another critical element. In most cases, the rooftop is proposed as the runoff catchment space. In large-scale systems, areas with paved surfaces can be a good candidate for runoff collection for RWH systems. Water demand can be another critical factor, especially when calculating water securities. In this study, the indoor water requirement is the largest water demand among all other water requirements. Actually, the outdoor water demand is very small compared to the indoor water requirement.
Rainfall or water supply is also a critical element, as the entire system build upon this. This study checks the system performance against the potential change in the rainfall levels due to climate change. However, due to the selection of the rainfall level at the monthly scale, the projected climate change is not adequately reflected in the water security analysis.

3.4. Water Security Analysis

Water security is used to evaluate the performance of a hydrological system. High water security means that the system is performing well, and if the water security value is low, the system has failed to serve its intended need. Considering the monthly variation of water security, RWH systems under residential Type A, B, non-residential Type C and D have low water security values for all six scenarios. The rest of the scenario has 100% water security most of the time under any model projection for the given conditions. Residential Type B shows lesser water security levels in the first few months of the year (Figure 12).
Figure 12. Monthly water security of the RWH systems with the residential Type B scenario, under different climate change projections.
Environments 02 00105 g012
The effects of climate change on the RWH systems can be observed in terms of the percentage change in the water security for each system with respect to different AOGCM model downscaled results (Table 4). It is evident from the results that out of the six scenarios, the model output of GFCM21 accounts for the highest negative percentage change in water securities. This shows that the projected rainfall patterns under these model results will further deteriorate the water securities of the RWH systems. Except for the residential Type B scenario (Table 4), most of the other model outputs have resulted in either negative or neutral percentage water securities change. These negative changes are relatively small, except with the GFCM21 model results. For the residential Type B scenario, the projected model results show better water security level improvements (except for the GFCM21 model).
Table 4. Overall water security change with respect to the each rainwater harvesting scenario type, as well as climate change projections (unit: %).
Rainwater Harvesting System ScenarioGFCM21HADCM3INCM3IPCM4MPEH5NCCCSM
Residential Type A−2.85−0.200.000.000.000.00
Residential Type B−3.962.412.824.465.022.90
Non-residential Type A0.000.000.000.000.000.00
Non-residential Type B0.000.000.000.000.000.00
Non-residential Type C, large scale (indoor)−0.54−0.040.000.010.01−0.01
Non-residential Type D, large scale (outdoor)−4.770.000.000.000.000.00
Obviously, residential Type B works well under most climate change projections, whereas the other types perform less favorably or have neutral effects. In other words, the performance of RWH systems differs a great deal according to their configurations. Furthermore, it is essential to plan and design the RWH system along with possible climate and rainfall pattern changes.
Overall results point to the fact that this study is able to detect possible future rainfall changes based on the six AOGCM model outputs. The impacts of these possible future rainfall changes on the RWH systems are also inevitable.

4. Conclusions

This study aims at assessing the impacts of climate change on rainwater harvesting systems (RWH) in the tropical urban city of Colombo, Sri Lanka. The future climate change projections are downscaled from global circulation models to the urban catchment scale using the LARS-WG, described in the IPCC AR4 Report, coupled with the CMIP3 model results. Historical rainfall data from 1981–2010 is used to simulate long-term future rainfall data from 2011–2099. The percentage change of the rainfall is calculated. The rainfall patterns are analyzed based on the daily, monthly, seasonal and annual time scales. The RWH system responses on the urban scale in Colombo City have been explored and evaluated according to possible future climate change scenarios. Results using statistical downscaling of large-scale atmospheric variables simulated by six AOGCM climate change models under the A1B, A2 and B1 emission scenarios with local scale rainfall are obtained.
When considering the percentage changes of the rainfall for the next century, five out of six model results show a positive percentage change in annual rainfall. Results further reveal that several extreme weather events with very heavy rainfall may occur in the future. However, the frequency of these big events may not occur too often. This study also discovers that all types of RWH systems are affected by the projected future rainfall, when there is large water demand and/or the storage capacity of the system is limited.
When considering the overall RWH system, the residential sector RWH is more affected than non-residential sector systems. Climate change impacts on the RWH systems are inevitable. Mitigation steps should be incorporated into the initial phase of the system design to reduce these impacts. Considerable variation on rainfall pattern changes and the degree of severity is found at the Colombo study site. Climate change can affect the hydrological performance of RWH systems in Colombo. The current rate of urbanization in Sri Lanka will result in higher demands for resources, including access to water. RWH is a viable option if it is incorporated with possible future climate change impact design.

Author Contributions

Kwong Fai A. Lo had the original idea for the study, supervised the research work and was responsible for revising the manuscript. Suranjith Bandara Koralegedara was responsible for data collection, carried out the analyses and drafted the first version of the manuscript. Both authors read and approved the final manuscript.

Conflicts of Interest

The authors declare no conflict of interest.

References

  1. Kerr, R.A. The greenhouse consensus. Science 1990, 249, 481–482. [Google Scholar]
  2. IPCC. Climate Change 2013: The Physical Science Basis. Contribution of Working Group I to the Fifth Assessment Report of the Intergovernmental Panel on Climate Change; Stocker, T.F., Qin, D., Plattner, G.-K., Tignor, M., Allen, S.K., Boschung, J., Nauels, A., Xia, Y., Bex, V., Midgley, P.M., Eds.; Cambridge University Press: Cambridge, UK; New York, NY, USA, 2013; p. 1535. [Google Scholar]
  3. Rosenzweig, C.; Casassa, G.; Karoly, D.J.; Imeson, A.; Liu, C.; Menzel, A.; Rawlins, S.; Root, T.L.; Seguin, B.; Tryjanowski, P. Assessment of observed changes and responses in natural and managed systems. In Climate Change 2007: Impacts, Adaptation and Vulnerability; Parry, M.L., Canziani, O.F., Palutikof, J.P., van der Linden, P.J., Hanson, C.E., Eds.; Cambridge University Press: Cambridge, UK, 2007; pp. 79–131. [Google Scholar]
  4. Ghisi, E.; Montibeller, A.; Schmidt, R.W. Potential for potable water savings by using rainwater: An analysis over 62 cities in Southern Brazil. Build. Environ. 2006, 41, 204–210. [Google Scholar]
  5. Helmreich, B.; Horn, H. Opportunities in rainwater harvesting. Desalination 2009, 248, 118–124. [Google Scholar]
  6. Herrmann, T.; Hasse, K. Ways to get water: Rainwater utilization or long-distance water supply? A holistic assessment. Water Sci. Technol. 1997, 36, 313–318. [Google Scholar]
  7. Zhang, Y.; Chen, D.H.; Chen, L.; Ashbolt, S. Potential for rainwater use in high-rise buildings in Australian cities. J. Environ. Manage. 2009, 91, 222–226. [Google Scholar]
  8. Bastiaanssen, W.G.M.; Chandrapala, L. Water balance variability across Sri Lanka for assessing agricultural and environmental water use. Agric. Water Manage. 2003, 58, 171–192. [Google Scholar]
  9. Sri Lanka Gazette 1597/8 of 2009; The Gazette of the Democratic Socialist Republic of Sri Lanka: Colombo, Sri Lanka, 2009.
  10. Arnbjerg-Nielsen, K.; Willems, P.; Olsson, J.; Beecham, S.; Pathirana, A.; Gregersen, I.B.; Madsen, H.; Nguyen, V.T.V. Impacts of climate change on rainfall extremes and urban drainage systems: A review. Water Sci. Technol. 2013, 68, 16–28. [Google Scholar]
  11. Ariyananda, T. Rainwater harvesting for the urban buildings in Sri Lanka. In Subtropical Green Building International Conference; Architecture and Building Research Institute: Taipei, Taiwan, 2007. [Google Scholar]
  12. Salathé, E.P. Comparison of various precipitation downscaling methods for the simulation of streamflow in a rainshadow river basin. Int. J. Climatol. 2003, 23, 887–901. [Google Scholar]
  13. Racsko, P.; Szeidl, L.; Semenov, M. A serial approach tolocal stochastic weather models. Ecol. Model. 1991, 57, 27–41. [Google Scholar]
  14. Semenov, M.A. Development of high-resolution UKCIP02-based climate change scenarios in the UK. Agric. For. Meteorol. 2007, 144, 127–138. [Google Scholar]
  15. Semenov, M.A.; Stratonovitch, P. Use of multi-model ensembles from global climate models for assessment of climate change impacts. Clim. Res. 2010, 41, 1–14. [Google Scholar]
  16. Hashmi, M.Z.; Shamseldin, A.Y.; Melville, B.W. Statistical downscaling of precipitation: State-of-the-art and application of bayesian multi-model approach for uncertainty assessment. Hydrol. Earth Syst. Sci. Discuss. 2009, 6, 6535–6579. [Google Scholar]
  17. Herrmann, T.; Hasse, K. Ways to get water: Rainwater utilization or long-distance water supply? A holistic assessment. Water Sci. Technol. 1997, 36, 313–318. [Google Scholar]
  18. Semenov, M.A.; Barrow, E.M. LARS-WG—A Stochastic Weather Generator for Use in Climate Impact Studies, User Manual; Harpenden: Hertfordshire, UK, 2002. [Google Scholar]
  19. De Silva, C.S. Impacts of climate change on water resources in Sri Lanka. In 32nd WEDC International Conference on Sustainable Development of Water Resources, Water Supply and Environmental Sanitation; The Water, Engineering and Development Center (WEDC), Loughborough University: Loughborough, UK, 2006; pp. 289–295. [Google Scholar]
  20. Ranatunge, E.; Malmgren, B.; Hayashi, Y.; Mikami, T.; Morishima, W.; Yokozawa, M.; Nishimori, M. Changes in the Southwest Monsoon mean daily rainfall intensity in Sri Lanka: Relationship to the El Niño-southern oscillation. Palaeogeogr. Palaeoclimatol. Palaeoecol. 2003, 197, 1–14. [Google Scholar]
  21. NWS & DB. “Water Coverage.” Regional Support Center Western Central, National Water Supply and Drainage Board. Available online: http://www.waterboard.lk/web/index.php?option=com_content&view=article&id=99:water-coverage&catid=34:western-central&Itemid=202&lang=en (accessed on 4 March 2015).
  22. Lutz, A.F.; Immerzeel, W.W.; Gobiet, A.; Pellicciotti, F.; Bierkens, M.F.P. Comparison of climate change signals in CMIP3 and CMIP5 multi-model ensembles and implications for Central Asian glaciers. Hydrol. Earth Syst. Sci. 2013, 17, 3661–3677. [Google Scholar]
  23. Jenkins, G.; Lowe, J. Handling Uncertainties in the UKCIP02 Scenarios of Climate Change, Technical Report 44; Hadley Center: Devon, UK, 2003. [Google Scholar]
  24. Costello, L.R.; Matheny, N.P.; Clark, J.R. Estimating water needs for landscape plantings. In A Guide to Estimating Irrigation Water Needs of Landscape Plantings in California; University of California Cooperative Extension, California Department of Water Resources: Sacramento, CA, USA, 2000; Part I, Chapter 2. [Google Scholar]
  25. Punyawardena, B.V.R. Rainfall and Agro-Ecological Regions of Sri Lanka; Natural Resource Management Center, Department of Agriculture: Peradeniya, Sri Lanka, 2008. [Google Scholar]
  26. World Resources Institute. Watersheds of the World [CD]; World Resources Institute: Washington, DC, USA, 2003. [Google Scholar]
  27. Punyawardena, B.V.R.; De Silva, R.P.; Nijananthy, S. Influence of El Nino/La Nina Episodes on the rainfall regime of the Dl, region of the north central province of Sri Lanka. J. Natn. Sci. Found. Sri Lanka 2004, 32, 149–156. [Google Scholar]