Article

Systematic Study of CDOM in the Volga River Basin Using EEM-PARAFAC

by
Anastasia N. Drozdova
1,2,*,
Aleksandr A. Molkov
2,3,4,
Ivan A. Kapustin
2,3,4,
Alexey V. Ermoshkin
2,3,
George V. Leshchev
2,3,
Ivan N. Krylov
5 and
Timur A. Labutin
5
1
Shirshov Institute of Oceanology, Russian Academy of Sciences, Moscow 117997, Russia
2
Radiophysical Department, Lobachevsky State University of Nizhny Novgorod, 23 Gagarin Avenue, Nizhny Novgorod 603022, Russia
3
Department of Radiophysical Methods in Hydrophysics, A.V. Gaponov-Grkhov Institute of Applied Physics of the Russian Academy of Sciences, 46 Ulyanov St., Nizhny Novgorod 603950, Russia
4
Department of Hydrodynamics, Ship Theory and Environmental Safety of Ships, Volga State University of Water Transport, 5 Nesterov St., Nizhny Novgorod 603950, Russia
5
Department of Chemistry, Lomonosov Moscow State University, Leninskie Gory 1 bldg. 3, Moscow 119234, Russia
*
Author to whom correspondence should be addressed.
Environments 2025, 12(9), 309; https://doi.org/10.3390/environments12090309
Submission received: 22 July 2025 / Revised: 20 August 2025 / Accepted: 30 August 2025 / Published: 2 September 2025

Abstract

This manuscript continues a series of papers devoted to the study of bio-optical characteristics of the Volga River waters in the context of development of regional bio-optical models. A particularly weak point in this effort is the limited knowledge of dissolved organic matter (DOM): its component composition, spectral absorption characteristics, and the lack of satellite-based assessment algorithms. Using excitation–emission matrix fluorescence spectroscopy, we examined the fluorescent fraction of DOM of surface water layer of the Volga River and its tributaries in the area from the Gorky Reservoir to the Volgograd Reservoir, a stretch spanning over 1500 km, in the period from May to September 2022–2024. Four fluorescent components were validated in parallel factor analysis. The ratio of fluorescent components was mostly stable, while their fluorescence intensities varied a lot. For example, the fluorescence intensity of the DOM of the Gorky Reservoir and the Kama River differed by more than 2.5-fold. The highest FDOM fluorescence was found in the Gorky Reservoir. Downstream, it decreased due to the inflow of the Oka and Kama rivers. The influence of small rivers such as Kerzhenets, Sundovik, Sura, and Vetluga was insignificant. It is demonstrated that neither conventional remote sensing techniques (LiDAR) plus in situ measurements of DOM with a probe nor DOM absorption at 440 nm allows probing all the fluorescent components, so their efficiency is determined by the correlation of fluorophore group content.

1. Introduction

Rivers are integral components of natural ecosystems and play a pivotal role in maintaining biodiversity and ecological processes [1,2]. They provide critical habitats for numerous aquatic and terrestrial species, facilitating biological diversity and ecosystem stability [3]. Rivers function as conduits for freshwater fluxes, influencing hydrological cycles and contributing to the global distribution of nutrients and sediments [4]. These fluvial systems also modulate regional climate patterns through moisture transport and evaporation.
From an anthropogenic perspective, rivers serve as vital freshwater sources for domestic consumption, agricultural irrigation, and industrial operations. They are essential vectors for transportation and commerce, underpinning socio-economic development. Furthermore, rivers offer ecosystem services such as recreation, aesthetic value, and cultural significance [5]. The preservation and sustainable management of riverine systems are crucial to ensuring the resilience of both natural ecosystems and human societies.
Under the increasing influence of climate change and anthropogenic load, great changes have recently occurred in the circulation and development of rivers; they are influenced by changing discharge regimes and very often by different kinds of pollution impacts [1,6]. For example, recent studies have highlighted that uncontrolled diffuse pollution was the primary driver behind the degradation of aquatic ecosystems in the Volga River Basin [7,8,9].
Real-time monitoring along with precise knowledge of the sources and transport pathway of various impacts in a catchment area is of particular importance for any management activities [6] since it provides the ability to track both rapid and long-term changes in ecosystems.
The growing deployment of satellites equipped with hyperspectral cameras of high and medium spatial resolution has made it feasible to monitor water bodies of almost any size [10,11] with high temporal resolution. This capability is especially relevant in Russia, given its vast territory and the inaccessibility of many water bodies for fieldwork. Besides the difficulties in the collection of satellite images due to cloudiness, a significant challenge in satellite-based monitoring lies in the necessity of calibrating hyperspectral data, which reflect the characteristics of a thin surface layer, against data obtained from field-sampled waters. The study of the interaction mechanism among land use changes and the regional hydrological ecosystem also involves the acquisition of new field data. Therefore, additional data on the optical properties of the river freshwater, which can only be obtained in the field, is needed [12]. Taking into account the recent attempts in the development of quantitative determination of colored dissolved organic matter (CDOM) with the use of satellite remote sensing [13], new field studies involving natural waters might be useful for validation of remote sensing models, as well as regional algorithms for estimation of the absorption coefficient of colored organic matter [14]. Thus, analyzing the optical characteristics of natural waters is critical for developing mathematical models to interpret satellite hyperspectral data. In addition to standard methods for characterizing water samples, it is essential to systematize hydro-optical data—such as absorption and fluorescence—for the calibration of satellite-based monitoring of inland water bodies.
This manuscript presents a systematic study of optical characteristics of CDOM in the surface waters of the Volga River—the longest river in Europe and a critical water artery of the Russian Federation. To our knowledge, no prior studies have comprehensively examined CDOM or conducted multi-parameter bio-optical surveys for the Volga River. Consequently, this study has two primary objectives: (1) to investigate the spatial variability of key bio-optical parameters along the entire length of the Volga River, and (2) to develop regional bio-optical algorithms for retrieving these parameters from satellite data. Both objectives necessitate comprehensive coverage of the river, as its optical properties vary significantly across reservoirs due to differences in hydrology, tributary inputs, productivity gradients, and anthropogenic pressures. A ~1500 km transect enables spatial replication in place of temporal replication, capturing a diverse range of water types—from clear, fast-flowing reaches to stagnant, bloom-dominated zones. This variability is essential for developing robust and transferable bio-optical algorithms. Major fluorophore groups were identified using parallel factor analysis (PARAFAC) applied to excitation-emission matrices (EEMs) [15] of samples collected along the river section from the Gorky Reservoir to the Volgograd Reservoir between spring 2022 and autumn 2024. Additionally, we considered excitation/detection wavelength pairs used in real-time monitoring instruments [16,17,18,19] to evaluate their efficacy in tracking fluorophore groups of different origins. The findings enhance our understanding of the study area and establish a foundation for validating high-resolution satellite data across the full spectrum of optical conditions observed along the Volga.

2. Materials and Methods

2.1. Study Area

The Volga River is the longest river in Europe; its length is 3690 km. It receives inputs from hundreds of tributaries; the largest ones are Oka River and Kama River. The 1.4 million km2 catchment area of the Volga drains about 33% of European Russia, covering various biomes from taiga to semidesert. The northern part of the catchment is in a forest belt that includes southern taiga and mixed coniferous-deciduous forests. The south and southeast of this forest belt represent the forest-steppe biome, and farther south are found steppe, semidesert, and desert biomes. The desert biome is found only near Caspian lowlands adjacent to the southern Akhtuba floodplain [20].
The Volga River is commonly divided into three sections: the Upper Volga, from the source to the Gorky Dam; the Middle Volga, from the Gorky Reservoir to the Kuybyshev Dam, receiving major tributaries like the Oka and Kama; and the Lower Volga, from the Kuybyshev Reservoir to the Caspian Sea, including the Saratov and Volgograd reservoirs and ending in a wide delta [20,21], see Figure 1.
The present study of the Volga River focuses on the region from Gorky Reservoir to Volgograd Reservoir covering the Middle Volga, Gorky Reservoir upstream, as well as Kuybyshev and Volgograd reservoirs downstream. The confluence areas of the Oka, Kama, Sundovik, Sura, Vetluga, Kazanka, Sviyaga, and Yeruslan rivers have been explored.
The Volga River is fed mainly by snow (~60% of the annual flow), groundwater (~30%), and rainwater (~10%). The natural regime is characterized by spring floods in April–June, low water levels during summer and winter periods, and autumn rain floods in October. Presently, the hydrology of the Volga is controlled by the regulation of a cascade of eight large shallow reservoirs, slowing considerably the flow velocity of the river. The Lower Volga region, including the Volga-Akhtuba Floodplain and Volga Delta, appears to be less affected by the backwater of anthropogenic Hydroelectric Power Plants dams [21,22].

2.2. Sampling

Sample collection was performed several times in spring–autumn 2022–2024. In 2022, the sampling was carried out in the Gorky Reservoir three times: in spring (on 25–26 May), and twice during summer, namely on 24 June and 1–2 August. The location of the sampling sites is shown in Figure 1b–d. Middle Volga was examined twice on 17 July–8 August and 6–9 September 2023. Finally, Volgograd Reservoir was studied at the beginning (29 May–7 June) and the end (15–23 August) of summer 2024 in course of two expeditions.
Water samples were collected from the surface water layer of 0.5 m depth with a bucket from the bow of a ship during its drift at the hydrological stations. They were filtered immediately through pre-combusted at 450 °C GF/F filters (0.7 μm nominal pore size) and stored in the acid-cleaned 30 mL glass vials under dark conditions at 4 °C until further analysis. A total of 227 samples were prepared for the study of CDOM optical properties.

2.3. Absorbance and Fluorescence Measurements

Absorbance and fluorescence of CDOM were measured with an Aqualog spectrofluorometer (Horiba Jobin Yvon, Inc., Edison, NJ, USA) in a 1-cm path-length quartz cuvette at room temperature, relative to a standard pure water sample. Excitation-emission matrix spectra and absorbance, A(λ), were recorded by scanning excitation wavelengths between 240 and 650 nm at 5 nm increments, while emission spectra were captured in the range of 245 nm to 800 nm at 1.17 nm increments. Fluorescence spectra at each excitation wavelength were recorded within an integration time of 5 s. To correct for the inner-filter effect, fluorescence intensity was multiplied by the effective absorption coefficient [23] using the functions provided within the Aqualog software V4.2. EEMs were normalized to the area under the water Raman peak at excitation wavelength of 350 nm of the ultra-pure water sample to produce fluorescence intensities in Raman Units (R.U.).
To account for the path length of the sample cell, Napierian absorption coefficient aCDOM(λ) values were calculated by multiplying blank-corrected absorbance A(λ) by 2.303 and dividing by 0.01—cuvette path length taken in meters.
Absorption coefficients at 250 nm and 365 nm were used to calculate the ratio E2:E3 expressed as follows: E 2 : E 3 = a C D O M ( 250 ) / a C D O M ( 365 ) . Ultrafiltration of humic waters combined with the studies of CDOM optical characteristics revealed the correlation between E2:E3 and molecular weight of CDOM [24,25].

2.4. PARAFAC Decomposition of Fluorescence EEM

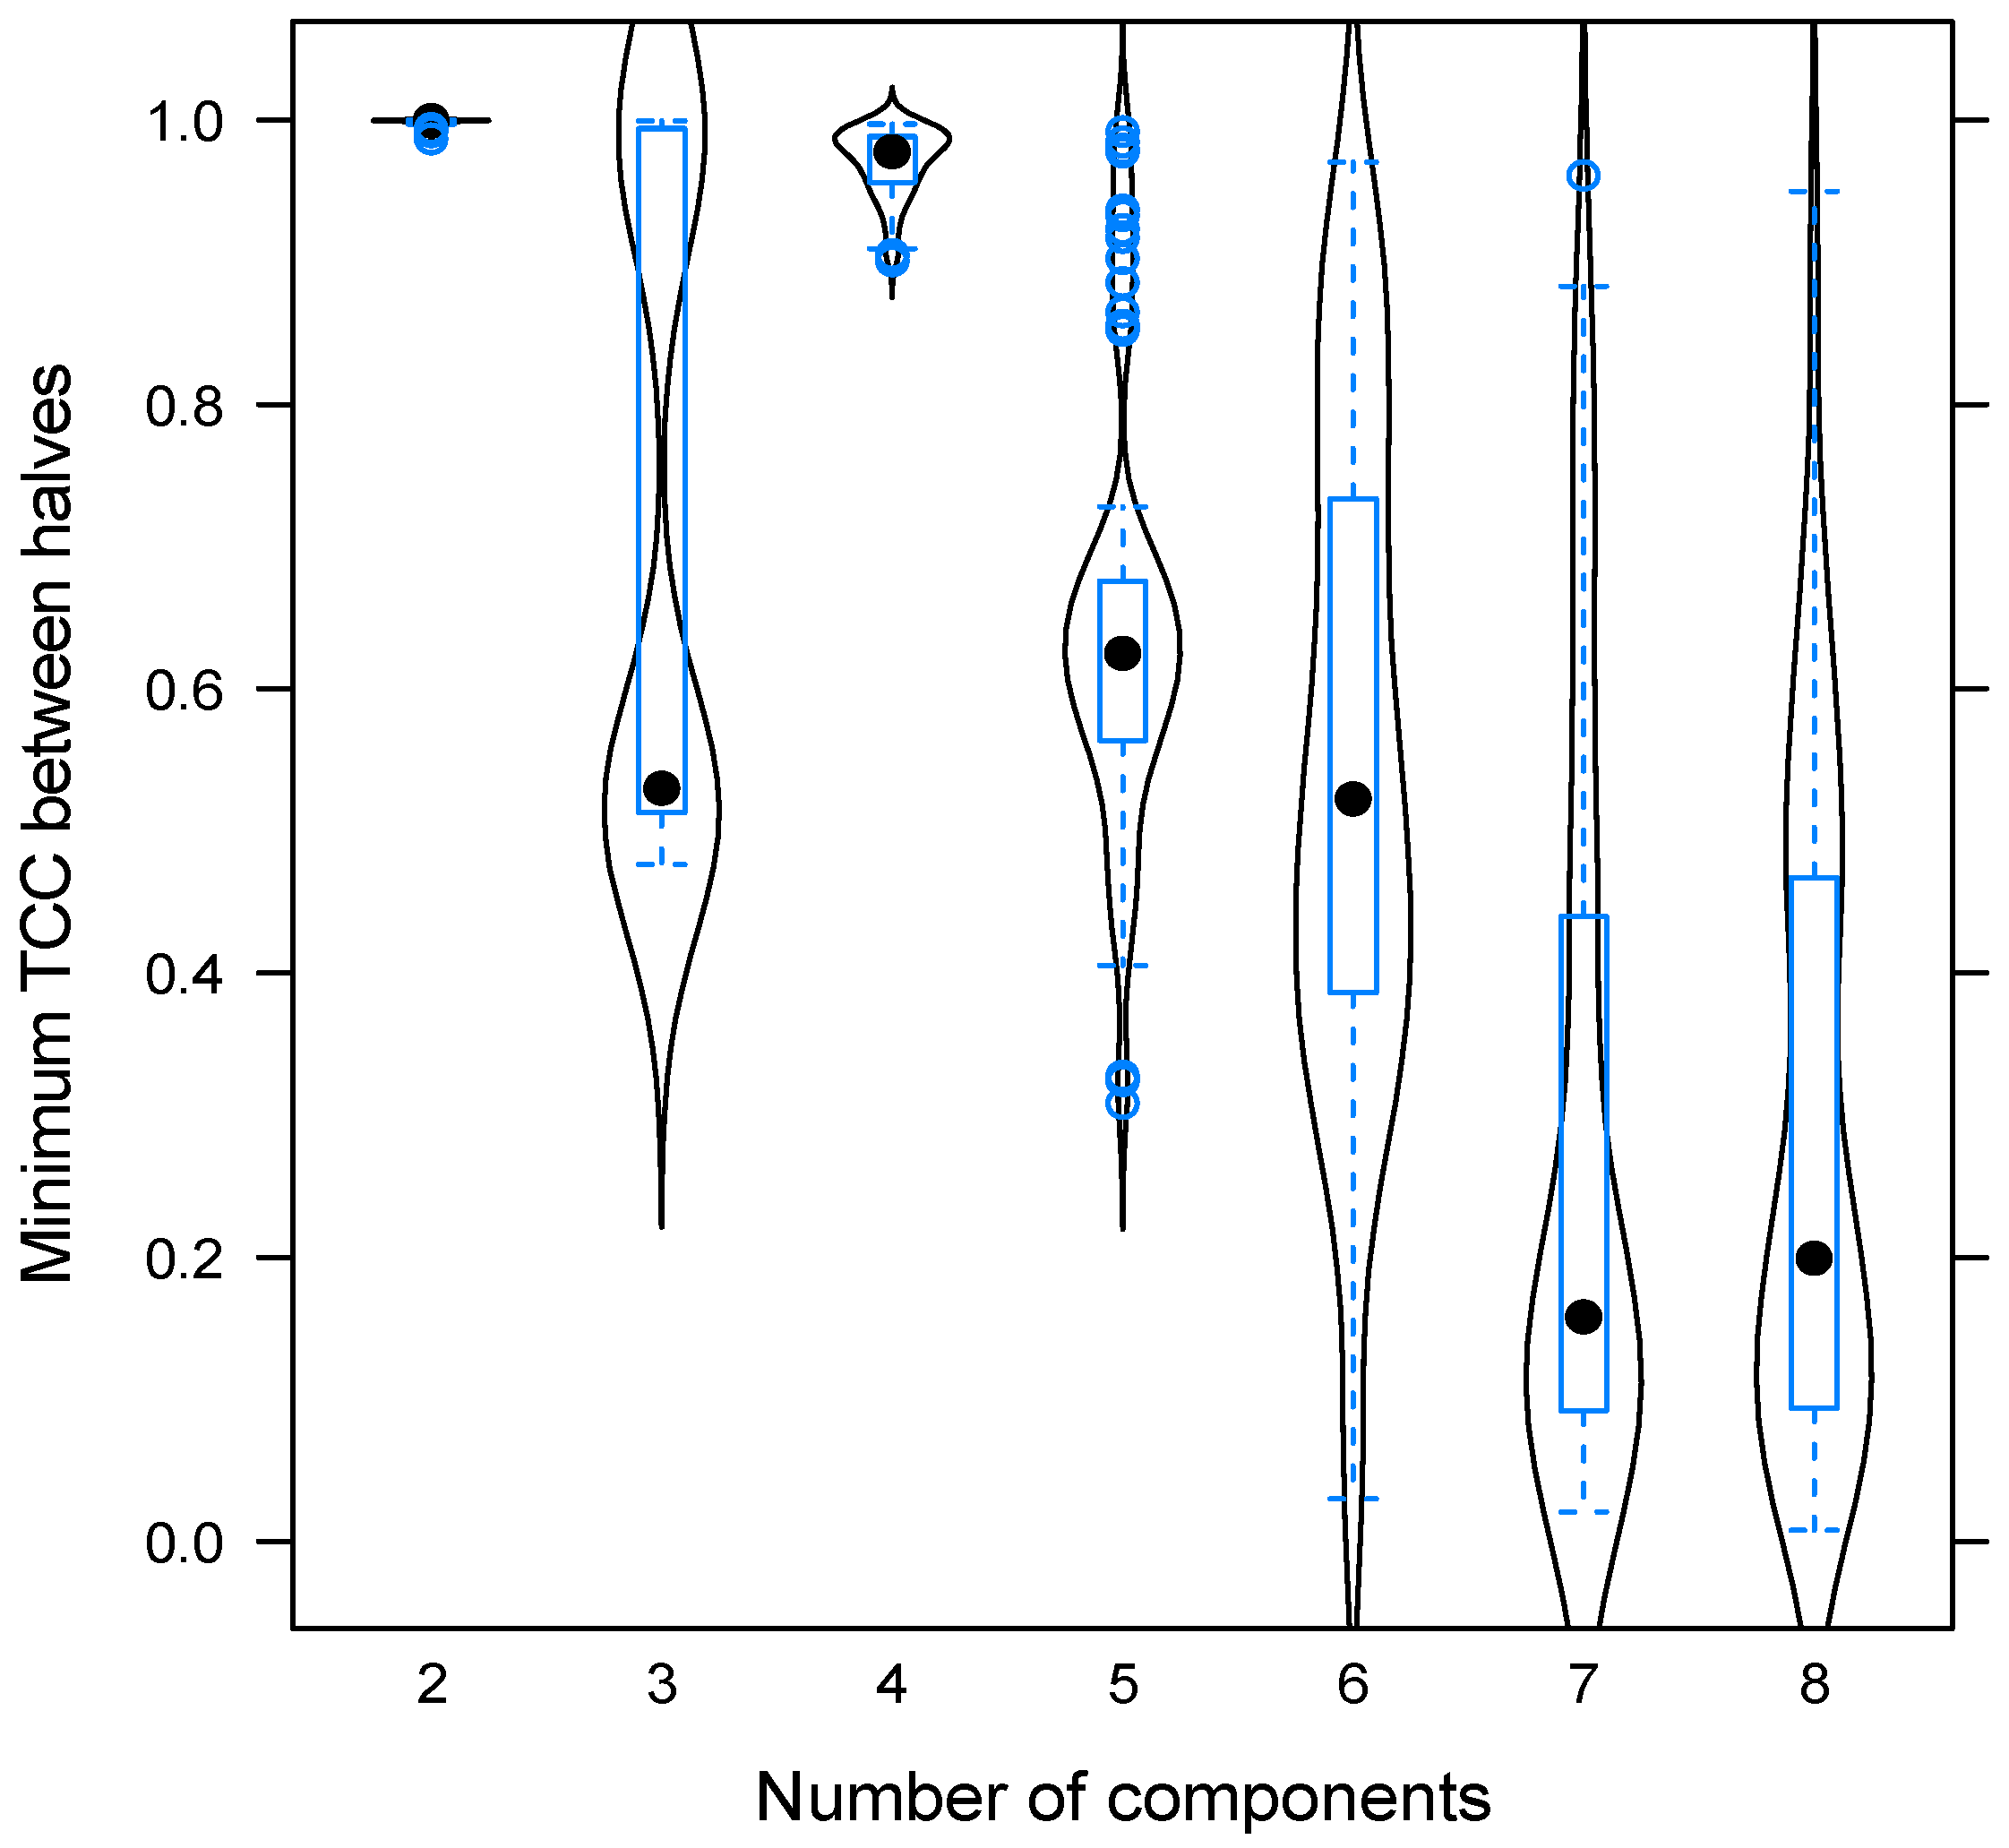
The fluorescence spectra have been pre-processed by handling the scattering signal zone at ± 15   nm using Whittaker interpolation [26], then scaling every spectrum to a standard deviation of 1. The PARAFAC model has been validated using the randomised split-half approach [27] using 100 splits (see Figure 2). While for a few of the 4-component models, the worst pairwise Tucker’s congruence coefficient was below 0.95, it never dropped below 0.90, and it did exceed 0.95 in 85 out of the 100 random splits. This was deemed acceptable due to the scores of the resulting model being highly correlated and the shape of the resulting loadings being chemically meaningful. While the two-component model passes the validation tests according to the strictest criteria, with the worst Tucker’s congruence value being 0.987, it leaves a significant amount of unexplained signal in the residuals. All the procedures were performed using the R programming language and the “albatross” package [27].
It should be noted that the PARAFAC model is scale-indeterminate, that is, assuming a non-negative model F i , j , k = r A i , r B j , r C k , r + ε i , j , k , the scores and loadings are only known subject to arbitrary positive coefficients α r , β r , γ r as α r A i , r , β r B j , r , γ r C k , r with α r β r γ r = 1   r . This complicates the comparison of scores a r , as the scores from different components could take arbitrary values depending on how the model is scaled. Since the contribution of an individual component to the fluorescence intensity at the particular excitation and emission wavelength is equal to F i , j , k , r = A i , r B j , r C k , r and scale-invariant (it is measured in the same units as the signal being modelled), the integral intensity of the r th PARAFAC component in the i th sample, F i , r i n t , can be computed for the registered emission ( λ j e m ) and excitation ( λ k e x ) spectral range:
F i , r i n t = λ m i n λ m a x F i , r λ e m , λ e x   d λ e m   d λ e x j , k A i , r   B j , r λ j e m   C k , r λ k e x = A i , r j , k B j , r λ j e m   C k , r λ k e x .
Similar to the F m a x value computed by the drEEM toolbox [28], F i , r i n t is measured in physically meaningful units and can be compared between the components. The integral intensity was chosen in this work instead of the peak intensity due to the fluorescence components having different widths, in order to avoid penalizing wide components.

3. Results and Discussion

3.1. PARAFAC Components

The full set of fluorescence spectra of riverine CDOM (227 samples), collected from 25 May 2022 to 23 August 2024, is described by the 4-component PARAFAC model. The absorption and emission maxima of individual fluorophore groups are presented in Table 1. The search for quantitative matches with previously validated PARAFAC models was performed with the OpenFluor database with excitation and emission similarity scores of 0.95 and higher (TCC ≥ 95%) [29].
The fractions of fluorescent components are calculated as a ratio of F r i n t to the total FDOM fluorescence intensity, r = 1 4 F r i n t , varied from sample to sample. Components C1 and C2 comprised 71–77% of DOM fluorescence, with mean fractions of C1 and C2 estimated as 42% and 34%, respectively. Fractions of C3 and C4 components varied in the ranges 16–23% (18% on average) and 4–12% (7% on average), respectively.
C1 component, characterized by humic-like fluorescence with a maximum at 453 nm, corresponds to the peaks A and C according to the classification of Coble [30]. It is one of the most widespread fluorophore groups in freshwater bodies. C1 is associated with FDOM of terrigenous origin, formed in soils by the decay of dead vascular plants. However, a large amount of algogenic FDOM exhibiting humic-like fluorescence may lead to overestimation of vascular plant input [31]. The study of DOM in the Ter River—Sau Reservoir system, Spain, showed low variability along the system, so C1 was associated with non-labile compounds [32]. Investigation of the surface waters from streams distributed throughout watersheds of mixed land use in southern Ontario, Canada, confirmed the terrestrial origin of C1. It was also found to be one of the most abundant fluorophore groups: along with the C2 component, it comprised 41–65% of stream DOM fluorescence [33]. A good match was found between C1 (the present study) and the C455 component (TCC = 99%), derived from PARAFAC analysis of water samples from different aquatic environments, including (1) the Milwaukee River, a terrigenous DOM-dominated river in Wisconsin, (2) open Green Bay, a mesotrophic sub-basin of Lake Michigan, and (3) Veterans Lagoon in the City of Milwaukee, a eutrophic lagoon with seasonal algal blooms. The contribution of C455 to the total fluorescence varied between 28.4% and 44.1%. Unlike C1, the presence of C3 (C515 in the original study) was established in Milwaukee River only with contribution accounted for 23.9% of total fluorescence [34].
A protein-like component C4 is similar to peak T [30]. It is widespread in freshwater bodies and, usually, indicates the presence of low-molecular-weight and labile DOM of autochthonous origin [32,35,36,37]. Near urbanized territories, however, C4 may be associated with the presence of pollutants with similar spectral characteristics, as well as with an increase in the concentration of the autochthonous component caused by an increase in the rate of DOM decay [38].
Component C2 is comparable with peak M associated with autochthonous humic substances [30]. In the study of Williams et al. [33] of Ontario streams, C2 was classified as a group of terrestrial, humic-like DOM fluorophores. Similar conclusions were made in the study CDOM of Galveston Bay, USA. C2 PARAFAC component showed a negative relationship with salinity in the Galveston Bay, indicating conservative mixing, with the main input from the Trinity River. A significant increase in C2 after Hurricane Harvey (September 2017) allowed us to assume that terrestrial-derived DOM is the main source of C2 [39]. At the same time, investigation of the DOM temporal dynamics in the Arno River, Italy, the same PARAFAC component (C1mh) was reported to be produced in situ [40]. It is consistent with the results of Romera-Castillo et al. [41], who demonstrated that different species of marine phytoplankton produced CDOM with similar spectral characteristics. For example, for CDOM produced by Chaetoceros sp. and P. minimum cultures, absorption/fluorescence maxima were found at 310/399 nm and 316/397 nm, respectively.
The C3 component is related to soil fulvic acids [42]. In rivers and lakes, FDOM with such spectral characteristics is often classified as terrigenous humic material [43,44,45]. In the study of Ontario streams, DOM, C3 was suggested to include fluorophore group characteristics of both soil-derived fulvic acid and terrestrial components [33]. A comparative analysis of FDOM of waters draining agricultural and near-pristine catchments (forested and wetland) in the North German plains showed that high relative fluorescence of the C3 characterized both agricultural and wetland catchments [46]. In the Neuse River Estuary, North Carolina, the contribution of C3 (C1 in the study of Osburn et al. [47]) was estimated as 11.8–14.3%.

3.2. Distribution of PARAFAC Component in the Volga River Surface Waters

For the subsets of surface water samples collected in the Gorky Reservoir during field campaigns in May, June, and August, 2022, low spatial variability of fluorescence intensity and the ratio of PARAFAC components was demonstrated: the contribution of each PARAFAC component to the total fluorescence intensity varied by up to 3% (Table 2). Fluorescence of terrestrial-derived humic-like components C1 and C3 decreased gradually, and presumably autochthonous ones—C2 and C4—increased by August compared to May (Table 2). Consequently, the fractions of C1–C4 have changed by 2–7%. This may be related to the influx of smaller amounts of terrigenous matter into the reservoir, photodegradation of DOM, as well as accumulation of larger amounts of autochthonous DOM in the summer months.
A year later, in July 2023, water samples were taken downstream of the Gorky Reservoir. The fluorescence intensity of the Volga River DOM in the section from the Gorky Reservoir to the confluence with the Oka River turned out to be comparable with the results obtained for the waters of the Gorky Reservoir in June-August 2022 (Table 2).
Fluorescence intensity of most of DOM fluorophore groups (components C1–C3) in the Oka River surface waters was 1.5–2.0-fold lower compared to the Volga River waters upstream (Table 2). The distribution of DOM downstream of the confluence of the Volga and Oka rivers is determined by the dynamics of their mixing. For example, at the cross-sections in the area of the confluence of the Volga and Oka waters, higher FDOM fluorescence intensity clearly marks a stream of Volga River waters pressed to the left bank. FDOM fluorescence gradually decreases towards the right bank of the Volga River where the contribution of the Oka River waters is getting more significant. With the exception of the rather heterogeneous zone of mixing of Volga and Oka waters, a Volga River section between the confluence with the Oka River and Cheboksary Reservoir, including the areas of the Kerzhenets, Sundovik, Sura, and Vetluga tributaries, was characterized by low variability of CDOM optical properties, as reflected by a lower standard deviation value, see Table 2. A local increase in the content of DOM fluorophores was observed between Cheboksary Reservoir and Kazan.
Further changes in the optical characteristics of the Volga River are associated with the admixture of the Kama River waters which resulted in a decrease in FDOM fluorescence. Kama River surface waters were sampled twice on 28 July and 12–13 September, 2023. Compared to July, in September, Kama River FDOM exhibited a similar PARAFAC component ratio, but total fluorescence intensity was ~25% higher. Kama River waters exhibited the lowest protein-like fluorophore group intensity among all the studied samples. Fluorescence of terrigenous components C1 and C3 was two-fold lower than in the Volga River waters upstream, and about 3-fold lower compared to Gorky Reservoir (Table 2).
Spectral characteristics similar to the Kama River FDOM were observed later, in 2024, in the area of confluence of the Volga and Yeruslan rivers. In the rest of the Volgograd Reservoir, C1–C3 fluorescence was higher and varied within 15%, while in Volga—Oka and Volga—Kama confluence areas, fluctuations in FDOM fluorescence reached 60%. Humic-like fluorescence intensity in the Volgograd Reservoir turned out to be approximately two-fold lower compared to the Upper Volga waters. Similar to the Kama River in 2023, an increase in C1–C3 fluorescence intensity was revealed in September compared to June, 2024.

3.3. Standard Excitation/Detection Wavelengths of Fluorescence Sensors

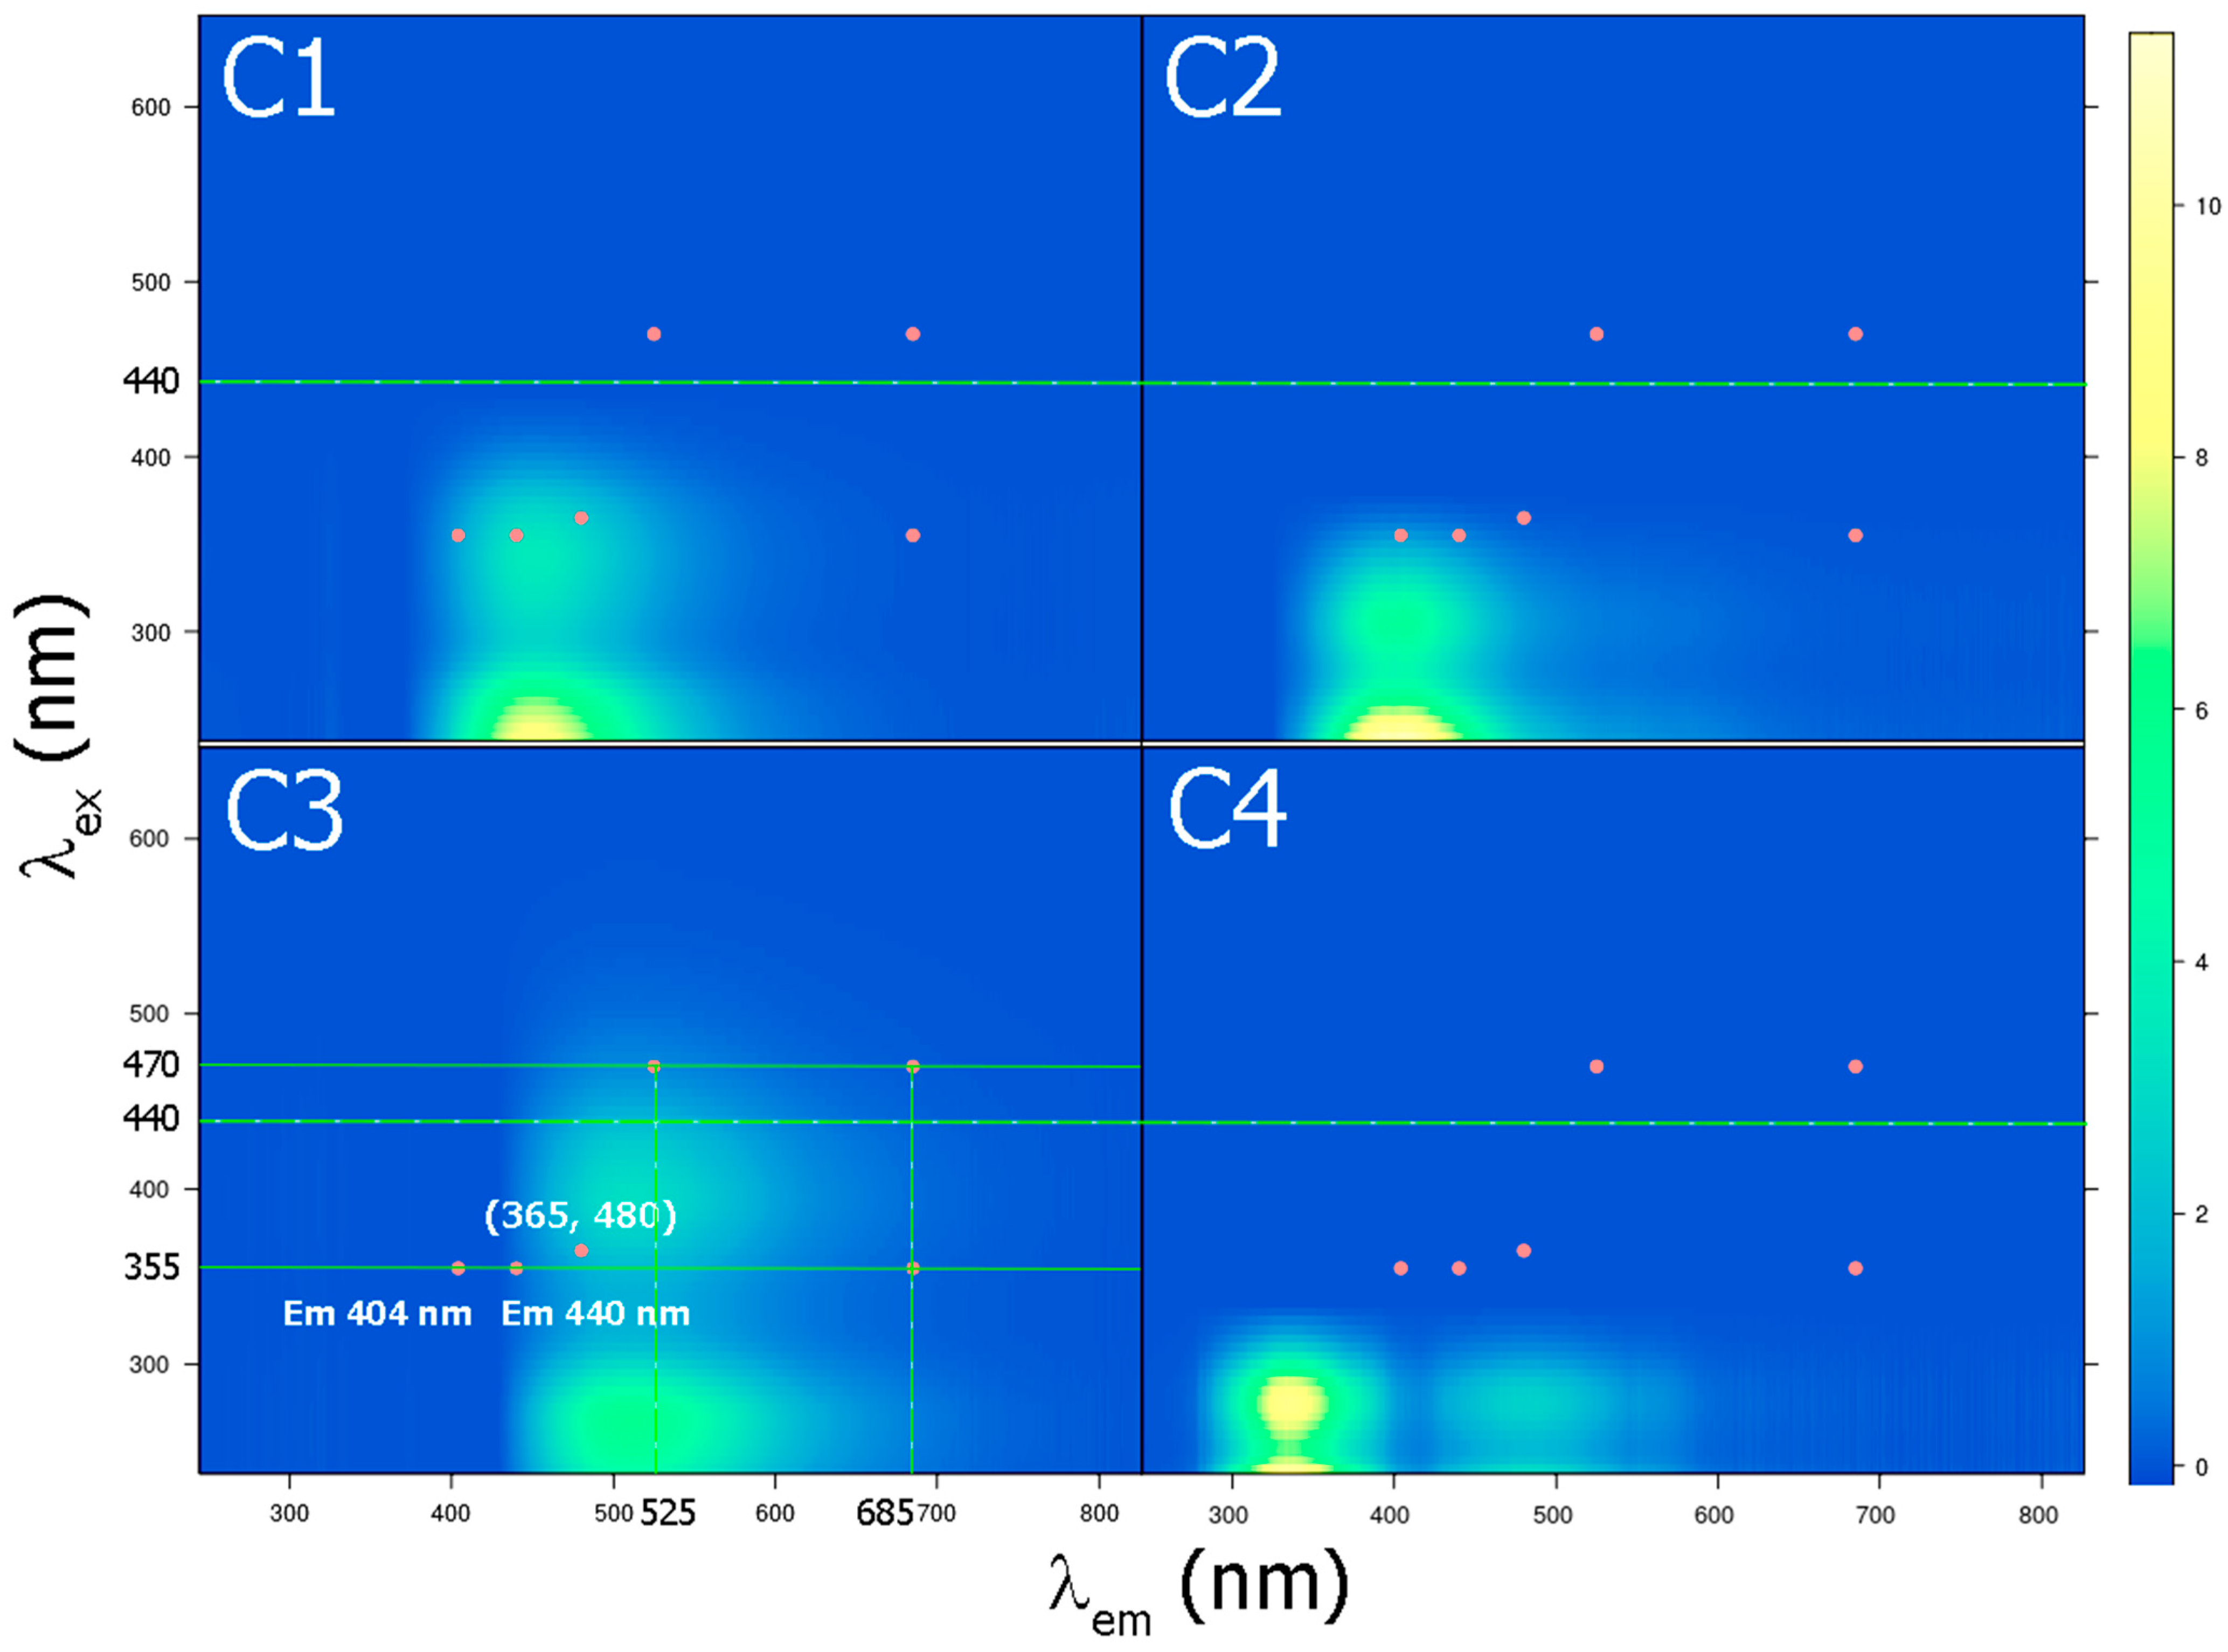
Assessment of scores and loadings of the PARAFAC model for the Volga River EEM dataset allowed considering the efficiency of using conventional techniques of remote and in situ sensing of the water column to study the spatial distribution of the identified fluorophore groups in the region. The wavelengths of operation of fluorescent shipborne LiDARs (excitation 355 nm, emission 404 nm, 440 nm, and 685 nm) [17,48] and YSI EXO2 sonde (excitation 365 nm and emission 480 nm, excitation 470 nm and emission 525 nm, and 685 nm) [49,50] were examined. These pairs of excitation/detection wavelengths are shown on EEMs of individual PARAFAC components C1–C4 in Figure 3. Also, the excitation wavelength of 440 nm is shown since absorption coefficient a C D O M 440 is a conventional hydro-optical parameter that can be retrieved from satellite images and widely used as an indicator of CDOM [51].
We retrieved the fluorescence intensities of riverine water samples at the above excitation/detection wavelengths from the EEMs to analyze the correlation of the potential signal of LiDAR «UFL-9» and YSI EXO2 sonde with the content of individual fluorophore groups. For the studied pairs of excitation/detection wavelengths, the highest fluorescence intensity was observed in the case of humic-like components C1–C3 at excitation below 365 nm. The excitation maximum of the C4 component is far below 355 nm, so autochthonous FDOM exhibiting protein-like fluorescence cannot be probed by the above sensors.
Since the PARAFAC model for fluorescence intensity F i , j , k of sample i at wavelengths λ j em , λ k ex is F i , j , k = r A i , r B j , r C k , r , the individual intensities of each component contributing to the overall signal are equal to the product F i , j , k , r = A i , r B j , r C k , r . This makes it possible to compute their relative contributions to the signal by dividing the individual intensities by their sum: A i , r B j , r C k , r r A i , r B j , r C k , r . Such an approach does not rely on the assumption of equal quantum yields of DOM fluorophores [52,53], so it will provide physically meaningful results as long as the model is valid. Table 3 presents the ranges of these values encountered in all samples.
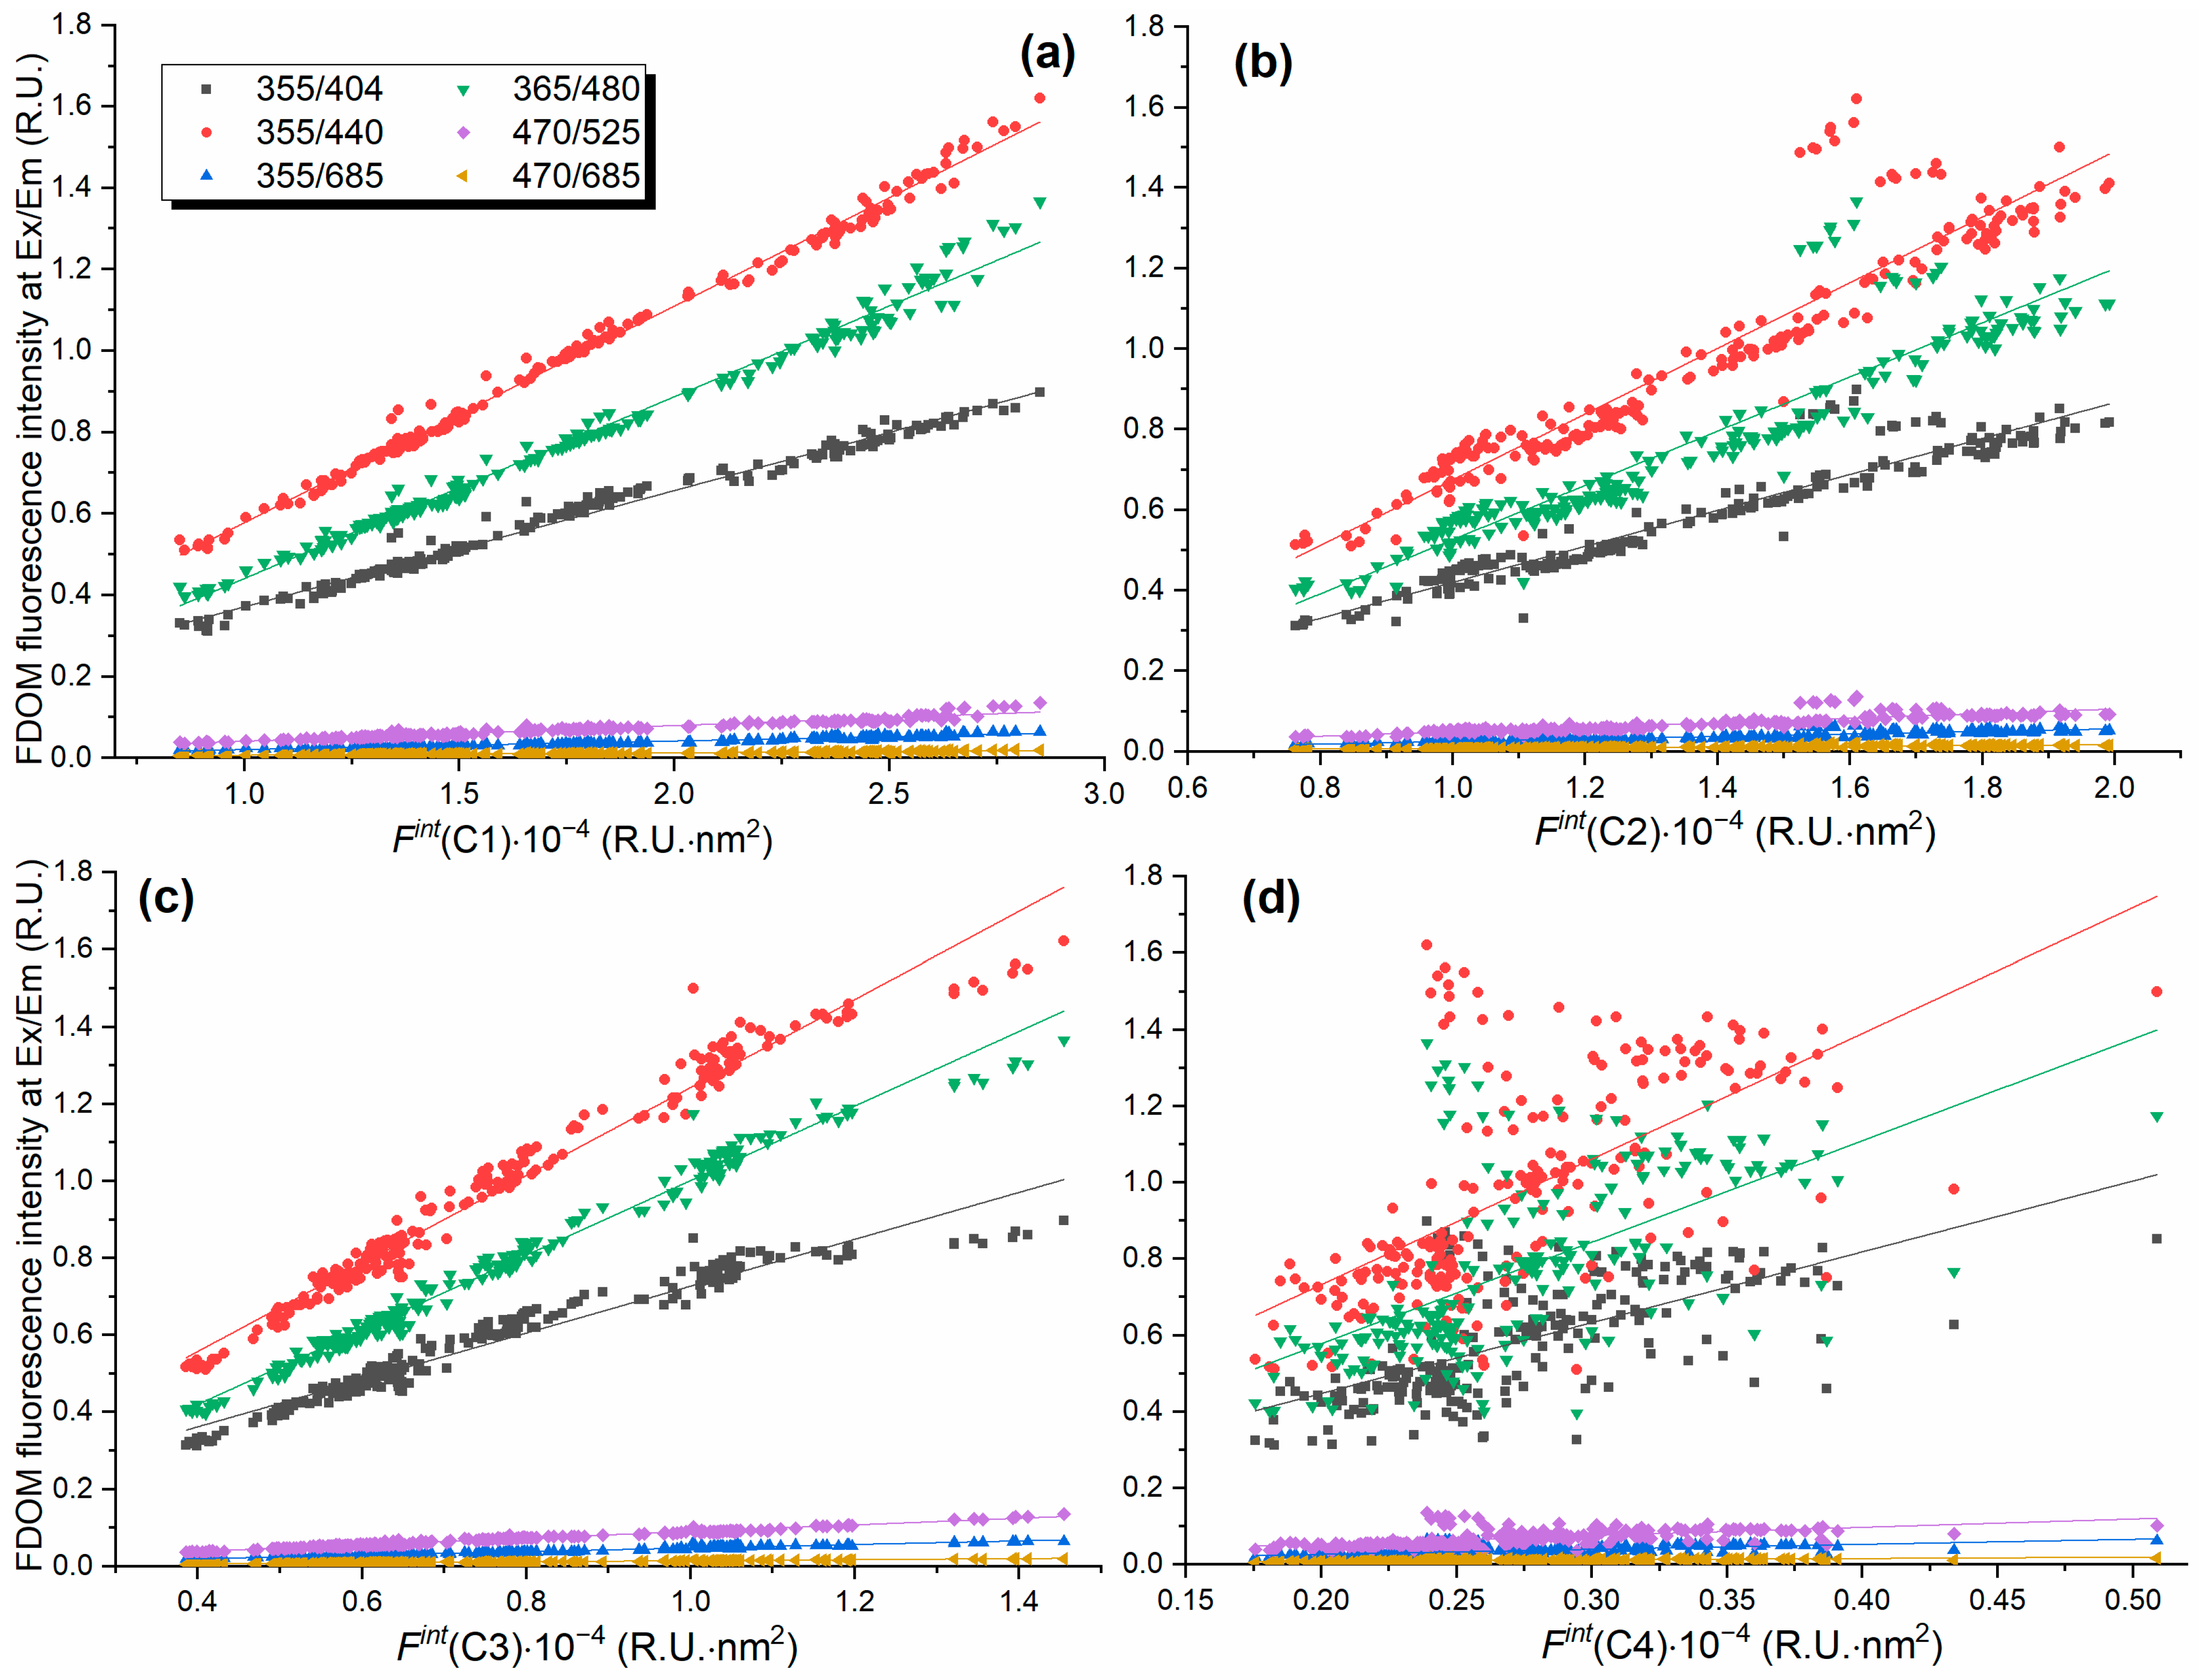
C4 did not affect the DOM fluorescence signal at commercially used wavelengths under investigation, λ j em , λ k ex , while the fractions of C1–C3 took on values from 0% to 84% at excitation below 365 nm. Despite such a heterogeneous contribution, the content of the C1–C3 components demonstrated good correlation with total FDOM fluorescence, F i , j , k , see Figure 4. Coefficient of determination, R2, for the linear regression models varied in the range 0.74–0.99, with the maximal values of R2 > 0.93, typical for the F i , j , k ( C 1 ) and F i , j , k ( C 3 ) relationships, Table 4.
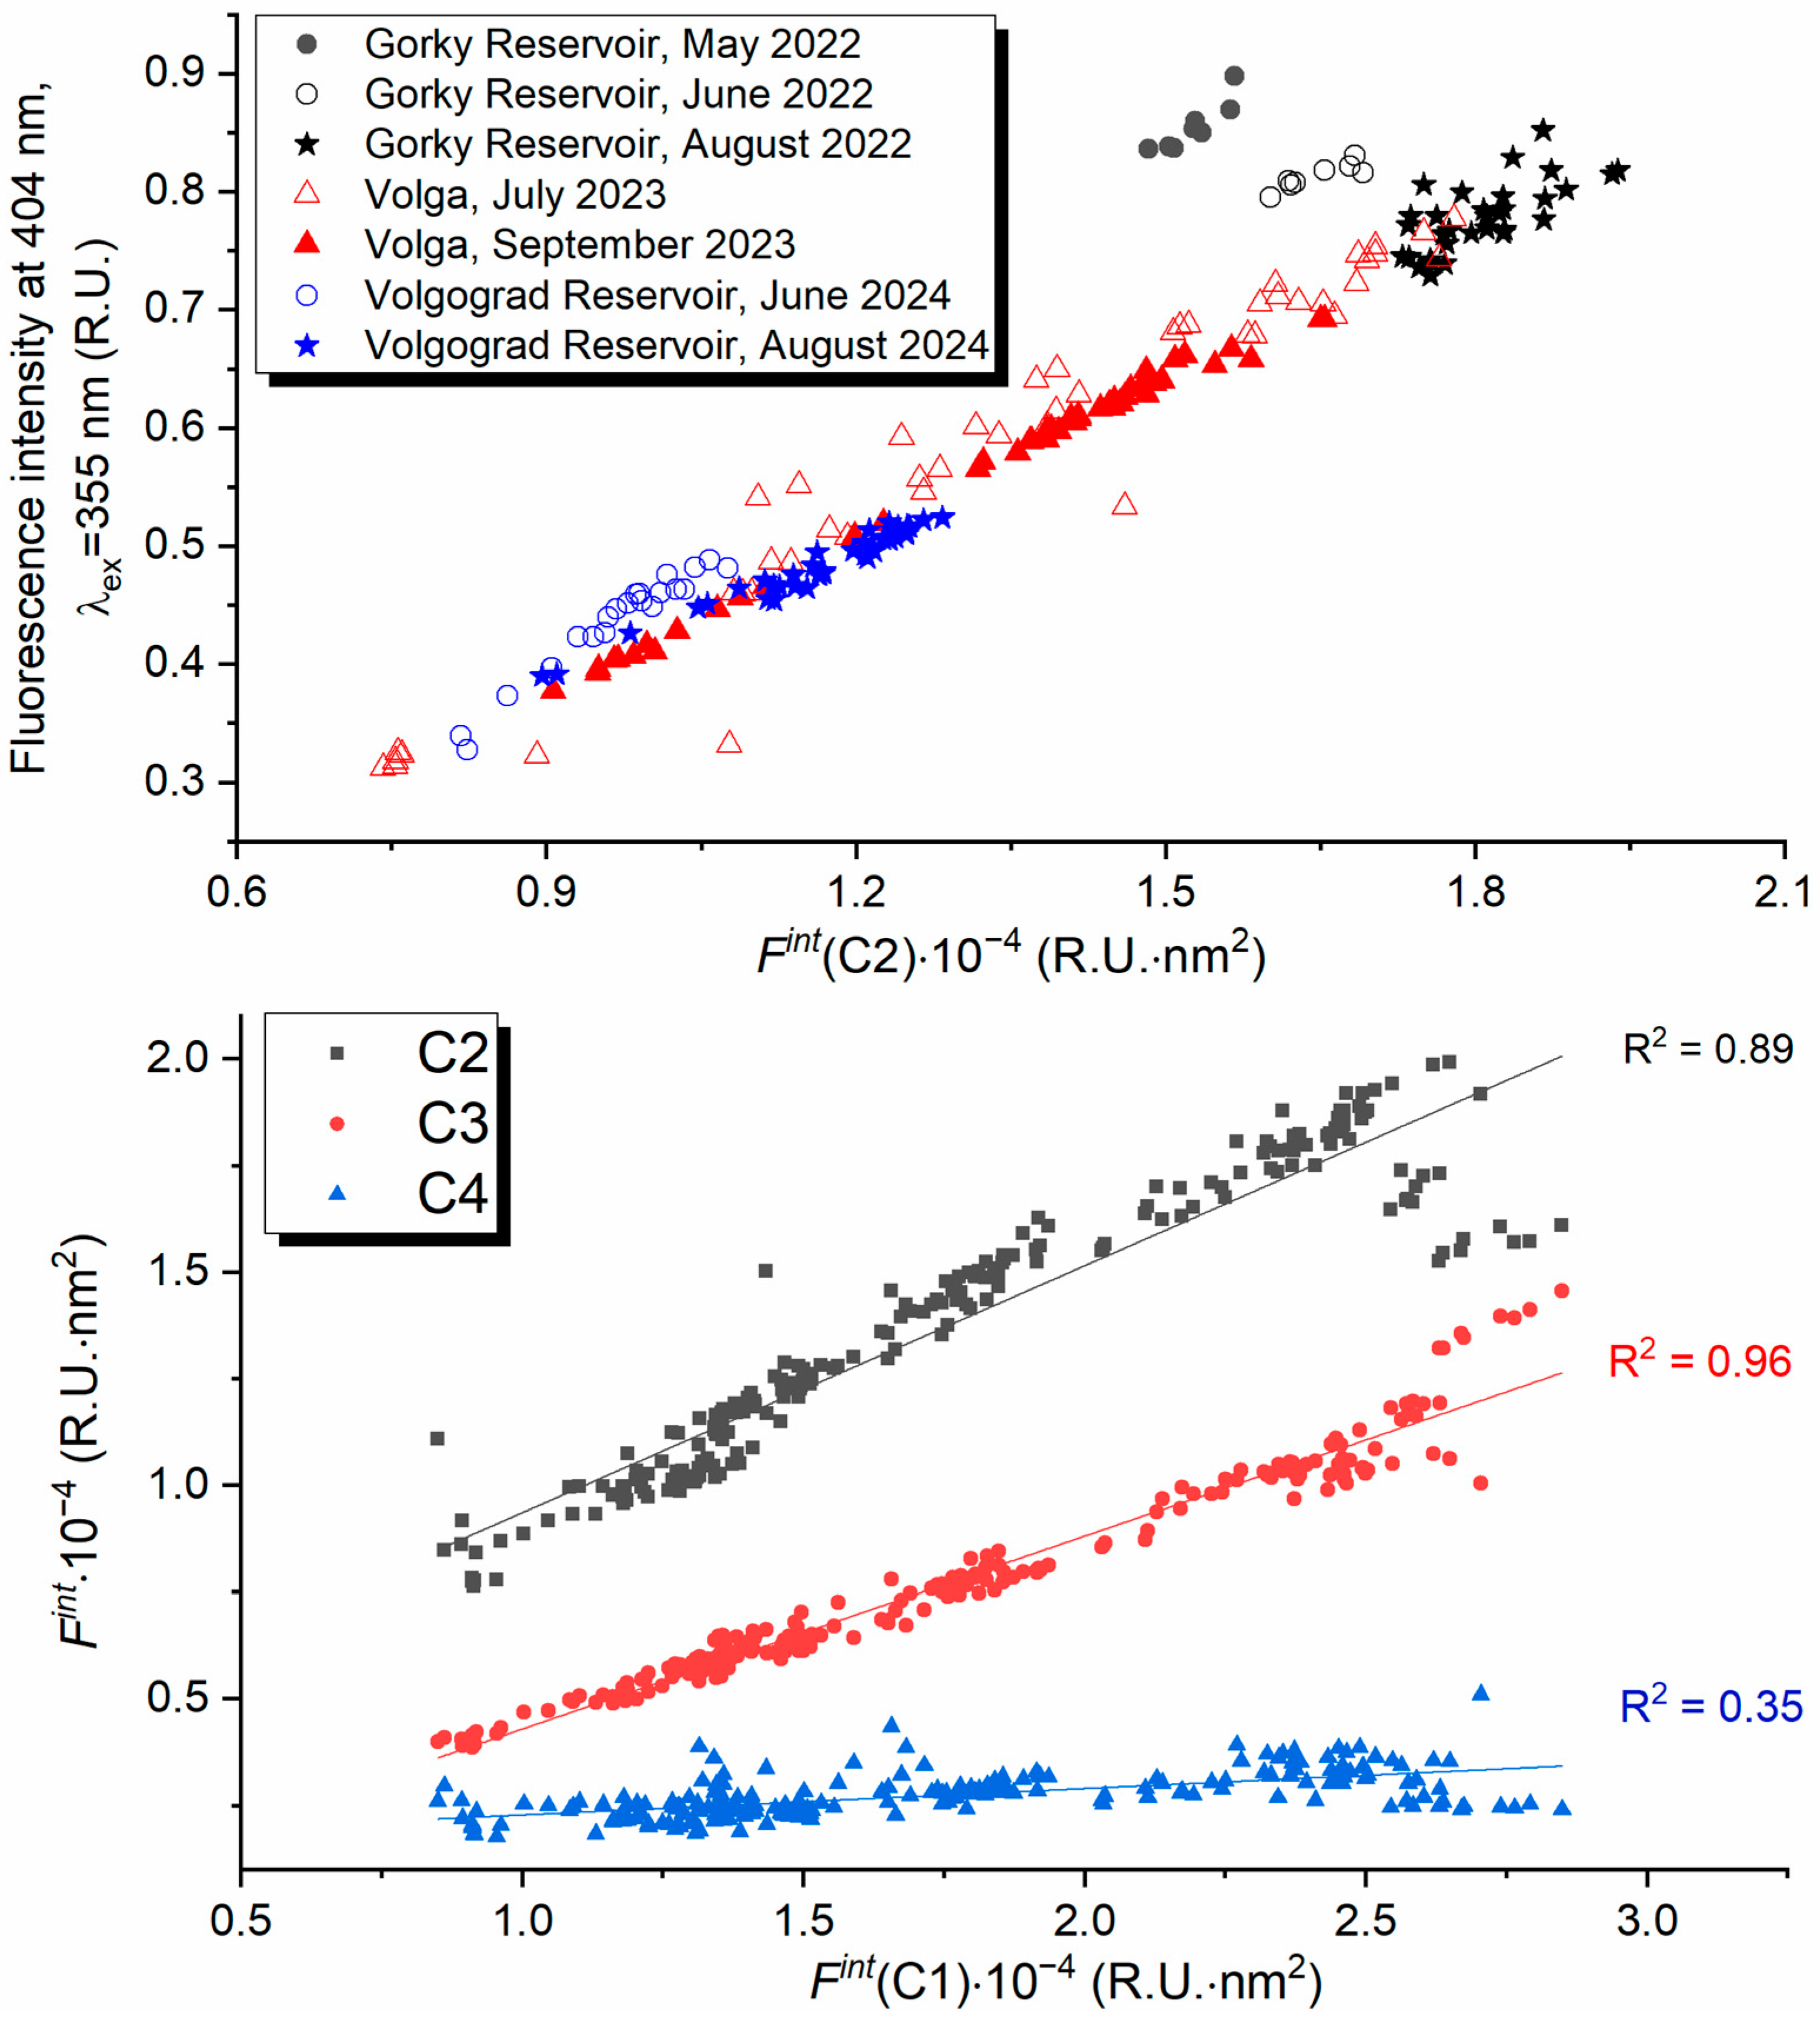
A good correlation between the concentration of PARAFAC components and the fluorescence intensity at excitation/emission wavelengths, λ j em and λ k ex , in the cases of low relative contribution of the fluorophore group to F i , j , k is due to the interrelation between C1–C3 content typical for most of the water samples. Significant deviations were observed for the Gorky Reservoir surface waters collected in May and June, 2022. The share of components C1 and C3 was found to be greater, and C2, on the contrary, lower, compared to the other studied samples, see Table 2. Subsets of points, corresponding to the samples from the May and June field campaigns to the Gorky Reservoir, are separated from general linear trends both on the dependence of the fluorescence intensity on C2, F i , j , k (C2), and on the C2(C1) plot, see Figure 4 and Figure 5.
The obtained results on CDOM spatial distribution and seasonal variability are in good agreement with the long-term water color observations performed using a standard Cr-Co scale. It was established that the water color associated mostly with the content of humic organic matter decreases from north to south of the Volga River. In the summer period of 2015–2020, in particular, water color was reported to decrease from 53 deg. to 38 deg. on average from Gorky Reservoir to Kuibyshev Reservoir. It was associated with the features of the catchment area and decreased lateral inflow. Seasonally, water color was found to be the highest during spring runoff with peaks in color after heavy rains [20,54]. The study of dissolved organic carbon (DOC) concentration in the Volga River surface waters conducted in June–July 2009 showed a decrease of DOC from Kazan to Lower Volga from 9.82 mg/L to 7.32 mg/L. In the Kama River mouth, DOC was estimated as 7.01 mg/L [55].

3.4. CDOM Absorbance

Absorption coefficient a C D O M 440 varied in the range from 0.95 m−1 to 6.92 m−1. It decreased from north to south, exhibiting maximal values in Gorky Reservoir and minimal—in Volgograd Reservoir (Table 2). Volga River tributaries were characterized by lower a C D O M 440 values, Oka River—1.86 m−1, Kama River—1.22 m−1, Yeruslan River—0.95 m−1, so they reduced a C D O M 440 downstream of the confluence areas.
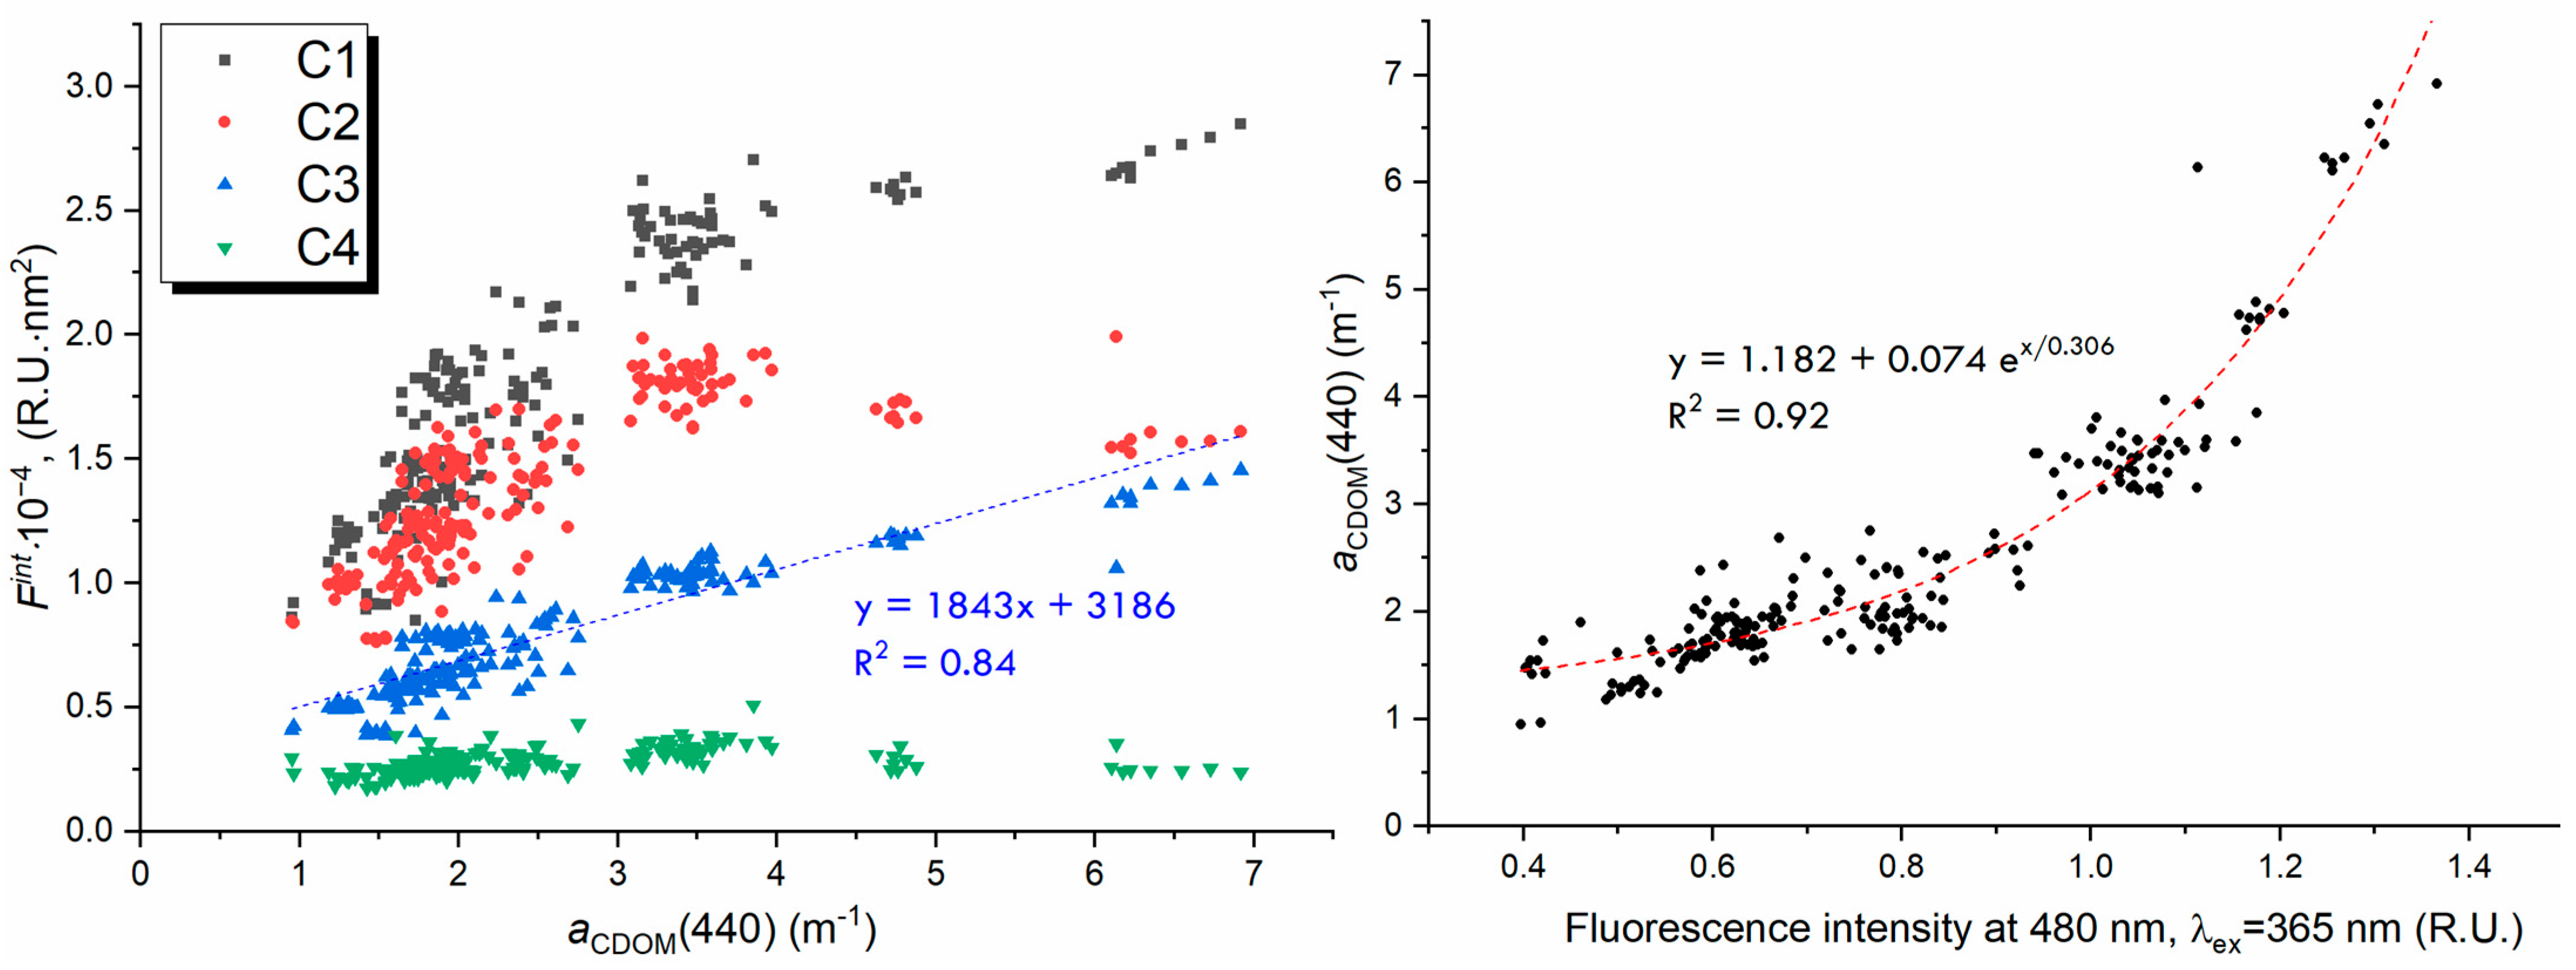
Conversely, the E2:E3 ratio tends to increase downstream from 5.24 in the Gorky Reservoir to 6.72 in the Volgograd Reservoir, with a minimal value of 8.85 measured in the Yeruslan River. It indicates the decrease in the DOM molecular size from north to south. In the context of collation of high-resolution ground-truth data as an essential procedure for developing regional algorithms for assessing the bio-optical characteristics of natural waters by satellite remote sensing [56], a comparison of CDOM absorption with fluorescence data, especially the ones that can be potentially obtained with sondes, is of great interest. Figure 2 (see also Table 1) demonstrates that the absorption maxima of the identified CDOM fluorophore groups lie below 440 nm. Component C3 absorbs most effectively at 440 nm compared to the others. This apparently explains the good correlation between the fluorescence intensity of C3 and a C D O M 440 , the R2 was estimated as 0.84, Table 4. The dependences of the fluorescence intensity of the PARAFAC components on the absorption coefficient at 440 nm are shown in Figure 6.
A correlation between absorption coefficient a C D O M 440 and FDOM fluorescence intensity at 480 nm, excited at 365 nm (such a combination is implemented in the YSI EXO2 sonde), is described by the exponential function
a C D O M 440 = 1.182 + 0.047 e F / 0.306 , R 2 = 0.92 ,
defined by the relation of C1 and C3 fluorophore groups.

4. Conclusions

Based on 227 EEMs of FDOM, the 4-component PARAFAC model describing the fluorescence of surface waters of the Volga River and some of its tributaries was validated. Three components exhibited humic-like fluorescence, and one (C4)—a protein-like one. According to previous studies, all the fluorescent components are widely distributed in natural waters; C1 and C3 were reported to be of allochthonous origin, while C2 and C4 are most likely autochthonous. A fraction of fluorescent components of the total FDOM fluorescence varied moderately—within 10% for each component. Humic-like component prevailed and comprised ~93% of the total FDOM fluorescence intensity.
While fractions of fluorophore groups were fairly stable, their integral fluorescence intensities varied widely. For example, FDOM fluorescence in the Gorky Reservoir and Kama River differ by more than 2.5-fold. The section of the Volga River from the Gorky Reservoir to the Volgograd Reservoir can be divided into several areas. In each area, surface waters were characterized by steady optical characteristics, as evidenced by the low standard deviations for data sets shown in Table 2. The highest fluorescence and absorption at 440 nm were established in the Gorky Reservoir and in the section from the Gorky Reservoir to the confluence with the Oka River. Downstream, the FDOM fluorescence decreased to a significant degree due to the influx of the Oka and Kama rivers. In the areas of confluence of the Volga River with the Oka and Kama, the distribution of CDOM is determined by the dynamics of their mixing. No significant influence of smaller tributaries such as Kerzhenets, Sundovik, Sura, and Vetluga was found.
Seasonal variability of FDOM distribution has not been studied comprehensively. However, it was established that the FDOM optical properties of the Gorky Reservoir changed significantly from May to August 2022, indicating a tendency for the fluorescence of autochthonous components to increase, and, conversely, for allochthonous components to decrease by the end of summer. Integral FDOM fluorescence intensity and a C D O M 440 were maximal in May, that could be associated with higher DOM supply during spring runoff. Furthermore, in the middle of summer 2022 and 2023, FDOM characteristics of Gorky Reservoir surface waters and downstream up to the confluence with the Oka River were in good agreement. This made it possible to compare, with some reservations, the data obtained in different years, assuming that the DOM composition was determined by the characteristics of the catchment area.
Five pairs of excitation/detection wavelengths used in fluorescent shipborne LiDAR «UFL-9» and YSI EXO2 sonde for studying DOM, algae, chlorophyll, and phycoerythrin were found to be unable to trace the autochthonous protein-like component with absorption and emission maxima at 277 nm and 334 nm, respectively. At the same time, a good linear correlation between fluorescence intensity of humic-like components and FDOM fluorescence intensity for all the chosen pairs of excitation/detection wavelengths was observed. In some cases, this is conditioned by an appropriate selection of excitation/detection wavelengths, allowing efficient excitation and recording of fluorescence of components (for example, C1 and 355 nm/440 nm). In others, the linear relationship is ensured by a high correlation between the fluorophore groups C1–C3. Violation of the ratio of fluorophore groups, therefore, can lead to an inadequate assessment of the content of humic substances. For example, an increase in the proportion of C1, accompanied by a decrease of C2 in the Gorky Reservoir in May and June, would lead to an overestimation of the FDOM content.
When developing regional algorithms for assessing the condition of natural waters by satellite remote sensing with the use of fluorescence sondes measurements as ground-truth data, it should be taken into account that the absorption coefficient at 440 nm and FDOM fluorescence intensity can be interconnected by a complex relationship, determined by the composition and ratio of fluorophore groups typical of a given region.

Author Contributions

Conceptualization, A.A.M. and A.N.D.; methodology, A.A.M. and A.N.D.; software, I.N.K. and T.A.L.; validation, A.A.M. and T.A.L.; formal analysis, A.N.D. and I.N.K.; investigation, I.A.K., A.V.E., G.V.L., and A.A.M.; resources, I.A.K., A.V.E., and G.V.L.; writing—original draft preparation, A.N.D.; writing—review and editing, A.A.M., I.N.K., and T.A.L.; visualization, A.N.D., I.N.K.; supervision, A.A.M.; project administration, A.A.M.; funding acquisition, A.A.M. All authors have read and agreed to the published version of the manuscript.

Funding

The study of the transformation of the bio-optical characteristics of the Volga River waters was funded by the Russian Science Foundation, project 23-17-00071 https://rscf.ru/project/23-17-00071/ (accessed on 15 August 2023). Hydrophysical studies were carried out within the framework of State Assignment FFUF-2024-0033. Statistical data processing was supported by the State Assignment FMWE-2024-0015.

Data Availability Statement

The PARAFAC model is available online within the Openfluor database https://openfluor.lablicate.com/ (accessed on 1 September 2025). The original data presented in the study are openly available in the Zenodo repository at https://doi.org/10.5281/zenodo.16358783 (accessed on 23 July 2025).

Conflicts of Interest

The authors declare no conflicts of interest. The funders had no role in the design of the study; in the collection, analyses, or interpretation of data; in the writing of the manuscript; or in the decision to publish the results.

Abbreviations

The following abbreviations are used in this manuscript:
DOMDissolved organic matter
DOCDissolved organic carbon
CDOMColored or chromophoric dissolved organic matter
FDOMFluorescent dissolved organic matter
EEMExcitation-emission matrix
PARAFACParallel factor analysis
R.U.Raman units

References

  1. Wang, H.; He, G. Rivers: Linking nature, life, and civilization. River 2022, 1, 25–36. [Google Scholar] [CrossRef]
  2. Postel, S.; Richter, B. Rivers for Life: Managing Water for People and Nature; Island Press: Washington, DC, USA; Covelo, CA, USA; London, UK, 2012. [Google Scholar]
  3. Dudgeon, D.; Arthington, A.H.; Gessner, M.O.; Kawabata, Z.-I.; Knowler, D.J.; Lévêque, C.; Naiman, R.J.; Prieur-Richard, A.-H.; Soto, D.; Stiassny, M.L. Freshwater biodiversity: Importance, threats, status and conservation challenges. Biol. Rev. 2006, 81, 163–182. [Google Scholar] [CrossRef] [PubMed]
  4. Leopold, L.B. Rivers. Am. Sci. 1962, 50, 511–537. [Google Scholar]
  5. Gleick, P.H. Water use. Annu. Rev. Environ. Resour. 2003, 28, 275–314. [Google Scholar] [CrossRef]
  6. Meyer, A.M.; Klein, C.; Fünfrocken, E.; Kautenburger, R.; Beck, H.P. Real-time monitoring of water quality to identify pollution pathways in small and middle scale rivers. Sci. Total Environ. 2019, 651, 2323–2333. [Google Scholar] [CrossRef]
  7. Mezhevova, A.; Berestneva, Y.; Belyaev, A. The current chemical composition of inland water bodies of the Volga-Akhtuba floodplain (Russia). J. Geogr. Inst. "Jovan Cvijic" SASA 2024, 74, 147–164. [Google Scholar] [CrossRef]
  8. Savenko, A.; Brekhovskikh, V.; Pokrovskii, O. Migration of dissolved trace elements in the mixing zone between Volga River water and Caspian seawater: Results of observations over many years. Geochem. Int. 2014, 52, 533–547. [Google Scholar] [CrossRef]
  9. Moiseenko, T.; Gashkina, N.; Sharova, Y.N.; Pokoeva, A. Ecotoxicological assessment of after-effects of the Volga River water contamination. Water Resour. 2005, 32, 369–383. [Google Scholar] [CrossRef]
  10. Soomets, T.; Uudeberg, K.; Jakovels, D.; Zagars, M.; Reinart, A.; Brauns, A.; Kutser, T. Comparison of lake optical water types derived from Sentinel-2 and Sentinel-3. Remote Sens. 2019, 11, 2883. [Google Scholar] [CrossRef]
  11. Pahlevan, N.; Smith, B.; Schalles, J.; Binding, C.; Cao, Z.; Ma, R.; Alikas, K.; Kangro, K.; Gurlin, D.; Hà, N. Seamless retrievals of chlorophyll-a from Sentinel-2 (MSI) and Sentinel-3 (OLCI) in inland and coastal waters: A machine-learning approach. Remote Sens. Environ. 2020, 240, 111604. [Google Scholar] [CrossRef]
  12. Harrison, J.A.; Caraco, N.; Seitzinger, S.P. Global patterns and sources of dissolved organic matter export to the coastal zone: Results from a spatially explicit, global model. Glob. Biogeochem. Cycles 2005, 19, GB4S04. [Google Scholar] [CrossRef]
  13. Derrien, M.; Brogi, S.R.; Goncalves-Araujo, R. Characterization of aquatic organic matter: Assessment, perspectives and research priorities. Water Res. 2019, 163, 114908. [Google Scholar] [CrossRef]
  14. Glukhovets, D.; Kopelevich, O.; Yushmanova, A.; Vazyulya, S.; Sheberstov, S.; Karalli, P.; Sahling, I. Evaluation of the CDOM absorption coefficient in the Arctic seas based on Sentinel-3 OLCI data. Remote Sens. 2020, 12, 3210. [Google Scholar] [CrossRef]
  15. Bro, R. PARAFAC. Tutorial and applications. Chemom. Intell. Lab. Syst. 1997, 38, 149–171. [Google Scholar] [CrossRef]
  16. Grishin, M.Y.; Lednev, V.; Pershin, S.; Bunkin, A.; Kobylyanskiy, V.; Ermakov, S.; Kapustin, I.; Molkov, A. Laser remote sensing of an algal bloom in a freshwater reservoir. Laser Phys. 2016, 26, 125601. [Google Scholar] [CrossRef]
  17. Palmer, S.C.; Pelevin, V.V.; Goncharenko, I.; Kovács, A.W.; Zlinszky, A.; Présing, M.; Horváth, H.; Nicolás-Perea, V.; Balzter, H.; Tóth, V.R. Ultraviolet fluorescence LiDAR (UFL) as a measurement tool for water quality parameters in turbid lake conditions. Remote Sens. 2013, 5, 4405–4422. [Google Scholar] [CrossRef]
  18. Kokhanenko, G.; Balin, Y.S.; Penner, I.; Shamanaev, V. Lidar and in situ sensing of the upper layers of Baikal Lake water. Opt. Atmos. Okeana 2011, 24, 377–385. [Google Scholar]
  19. Chen, P.; Mao, Z.; Zhang, Z.; Liu, H.; Pan, D. Detecting subsurface phytoplankton layer in Qiandao Lake using shipborne lidar. Opt. Express 2020, 28, 558–569. [Google Scholar] [CrossRef]
  20. Mineeva, N.; Lazareva, V.; Litvinov, A.; Stepanova, I.; Chuiko, G.; Papchenkov, V.; Korneva, L.; Shcherbina, G.; Pryanichnikova, E.; Perova, S. The Volga River. In Rivers of Europe; Elsevier: Amsterdam, The Netherlands, 2022; pp. 27–79. [Google Scholar]
  21. Litvinov, A.S.; Mineeva, N.M.; Papchenkov, V.G.; Korneva, L.G.; Lazareva, V.I.; Shcherbina, G.K.; Gerasimov, Y.V.; Dvinskikh, S.A.; Noskov, V.M.; Kitaev, A.B.; et al. Volga River Basin. In Rivers of Europe; Academic Press: London, UK, 2009; pp. 23–57. [Google Scholar]
  22. Terskii, P.N.; Ermakova, G.S.; Gorelits, O.V. Hydropower in Russia: Case Study on Hydrological Management of the Volga-Kama Cascade. In Technological Innovations and Advances in Hydropower Engineering; IntechOpen: Rijeka, Croatia, 2022; pp. 20–29. [Google Scholar]
  23. Lakowicz, J.R. Principles of Fluorescence Spectroscopy; Springer Science & Business Media: Berlin/Heidelberg, Germany, 2013. [Google Scholar]
  24. De Haan, H.; De Boer, T. Applicability of light absorbance and fluorescence as measures of concentration and molecular size of dissolved organic carbon in humic Lake Tjeukemeer. Water Res. 1987, 21, 731–734. [Google Scholar] [CrossRef]
  25. Peuravuori, J.; Pihlaja, K. Molecular size distribution and spectroscopic properties of aquatic humic substances. Anal. Chim. Acta 1997, 337, 133–149. [Google Scholar] [CrossRef]
  26. Krylov, I.N.; Labutin, T.A. Recovering fluorescence spectra hidden by scattering signal: In search of the best smoother. Spectrochim. Acta Part A: Mol. Biomol. Spectrosc. 2023, 293, 122441. [Google Scholar] [CrossRef] [PubMed]
  27. Krylov, I.N.; Drozdova, A.N.; Labutin, T.A. Albatross R package to study PARAFAC components of DOM fluorescence from mixing zones of arctic shelf seas. Chemom. Intell. Lab. Syst. 2020, 207, 104176. [Google Scholar] [CrossRef]
  28. Murphy, K.R.; Stedmon, C.A.; Graeber, D.; Bro, R. Fluorescence spectroscopy and multi-way techniques. PARAFAC. Anal. Methods 2013, 5, 6557–6566. [Google Scholar] [CrossRef]
  29. Murphy, K.R.; Stedmon, C.A.; Wenig, P.; Bro, R. OpenFluor–an online spectral library of auto-fluorescence by organic compounds in the environment. Anal. Methods 2014, 6, 658–661. [Google Scholar] [CrossRef]
  30. Coble, P.G. Characterization of marine and terrestrial DOM in seawater using excitation-emission matrix spectroscopy. Mar. Chem. 1996, 51, 325–346. [Google Scholar] [CrossRef]
  31. Lobus, N.V.; Glushchenko, A.M.; Osadchiev, A.A.; Maltsev, Y.I.; Kapustin, D.A.; Konovalova, O.P.; Kulikovskiy, M.S.; Krylov, I.N.; Drozdova, A.N. Production of Fluorescent Dissolved Organic Matter by Microalgae Strains from the Ob and Yenisei Gulfs (Siberia). Plants 2022, 11, 3361. [Google Scholar] [CrossRef]
  32. Marcé, R.; Verdura, L.; Leung, N. Dissolved organic matter spectroscopy reveals a hot spot of organic matter changes at the river–reservoir boundary. Aquat. Sci. 2021, 83, 67. [Google Scholar] [CrossRef]
  33. Williams, C.J.; Yamashita, Y.; Wilson, H.F.; Jaffé, R.; Xenopoulos, M.A. Unraveling the role of land use and microbial activity in shaping dissolved organic matter characteristics in stream ecosystems. Limnol. Oceanogr. 2010, 55, 1159–1171. [Google Scholar] [CrossRef]
  34. Lin, H.; Guo, L. Variations in colloidal DOM composition with molecular weight within individual water samples as characterized by flow field-flow fractionation and EEM-PARAFAC analysis. Environ. Sci. Technol. 2020, 54, 1657–1667. [Google Scholar] [CrossRef] [PubMed]
  35. Yamashita, Y.; Maie, N.; Briceño, H.; Jaffé, R. Optical characterization of dissolved organic matter in tropical rivers of the Guayana Shield, Venezuela. J. Geophys. Res. Biogeosci. 2010, 115, G00F10. [Google Scholar] [CrossRef]
  36. Yan, C.; Sheng, Y.; Ju, M.; Ding, C.; Li, Q.; Luo, Z.; Ding, M.; Nie, M. Relationship between the characterization of natural colloids and metal elements in surface waters. Environ. Sci. Pollut. Res. 2020, 27, 31872–31883. [Google Scholar] [CrossRef]
  37. Thuile Bistarelli, L.; Poyntner, C.; Santín, C.; Doerr, S.H.; Talluto, L.; Singer, G.; Sigmund, G. Wildfire-derived pyrogenic carbon modulates riverine organic matter and biofilm enzyme activities in an in situ flume experiment. ACS EsT Water 2021, 1, 1648–1656. [Google Scholar] [CrossRef] [PubMed]
  38. Parr, T.B.; Cronan, C.S.; Ohno, T.; Findlay, S.E.; Smith, S.M.; Simon, K.S. Urbanization changes the composition and bioavailability of dissolved organic matter in headwater streams. Limnol. Oceanogr. 2015, 60, 885–900. [Google Scholar] [CrossRef]
  39. Gold-Bouchot, G.; Polis, S.; Castañon, L.E.; Flores, M.P.; Alsante, A.N.; Thornton, D.C.O. Chromophoric dissolved organic matter (CDOM) in a subtropical estuary (Galveston Bay, USA) and the impact of Hurricane Harvey. Environ. Sci. Pollut. Res. 2021, 28, 53045–53057. [Google Scholar] [CrossRef]
  40. Brogi, S.R.; Balestra, C.; Casotti, R.; Cossarini, G.; Galletti, Y.; Gonnelli, M.; Vestri, S.; Santinelli, C. Time resolved data unveils the complex DOM dynamics in a Mediterranean river. Sci. Total Environ. 2020, 733, 139212. [Google Scholar] [CrossRef] [PubMed]
  41. Castillo, C.R.; Sarmento, H.; Alvarez-Salgado, X.A.; Gasol, J.M.; Marraséa, C. Production of chromophoric dissolved organic matter by marine phytoplankton. Limnol. Oceanogr. 2010, 55, 446–454. [Google Scholar] [CrossRef]
  42. Osburn, C.L.; Oviedo-Vargas, D.; Barnett, E.; Dierick, D.; Oberbauer, S.F.; Genereux, D.P. Regional groundwater and storms are hydrologic controls on the quality and export of dissolved organic matter in two tropical rainforest streams, Costa Rica. J. Geophys. Res. Biogeosci. 2018, 123, 850–866. [Google Scholar] [CrossRef]
  43. Kowalczuk, P.; Durako, M.J.; Young, H.; Kahn, A.E.; Cooper, W.J.; Gonsior, M. Characterization of dissolved organic matter fluorescence in the South Atlantic Bight with use of PARAFAC model: Interannual variability. Mar. Chem. 2009, 113, 182–196. [Google Scholar] [CrossRef]
  44. Cawley, K.M.; Butler, K.D.; Aiken, G.R.; Larsen, L.G.; Huntington, T.G.; McKnight, D.M. Identifying fluorescent pulp mill effluent in the Gulf of Maine and its watershed. Mar. Pollut. Bull. 2012, 64, 1678–1687. [Google Scholar] [CrossRef]
  45. Berggren, M.; Gudasz, C.; Guillemette, F.; Hensgens, G.; Ye, L.; Karlsson, J. Systematic microbial production of optically active dissolved organic matter in subarctic lake water. Limnol. Oceanogr. 2020, 65, 951–961. [Google Scholar] [CrossRef]
  46. Graeber, D.; Gelbrecht, J.; Pusch, M.T.; Anlanger, C.; von Schiller, D. Agriculture has changed the amount and composition of dissolved organic matter in Central European headwater streams. Sci. Total Environ. 2012, 438, 435–446. [Google Scholar] [CrossRef]
  47. Osburn, C.L.; Handsel, L.T.; Mikan, M.P.; Paerl, H.W.; Montgomery, M.T. Fluorescence tracking of dissolved and particulate organic matter quality in a river-dominated estuary. Environ. Sci. Technol. 2012, 46, 8628–8636. [Google Scholar] [CrossRef]
  48. Yang, J.; Gong, W.; Shi, S.; Du, L.; Zhu, B.; Sun, J.; Song, S. Excitation wavelength analysis of laser-induced fluorescence LiDAR for identifying plant species. IEEE Geosci. Remote Sens. Lett. 2016, 13, 977–981. [Google Scholar] [CrossRef]
  49. Weiser, M.W.; Swanson, J.; Ghosh, N.; Hong, J.; Harringmeyer, J.P.; Kaiser, K.; Fichot, C.G. Improving estimates of dissolved organic carbon (DOC) concentration from in situ fluorescence measurements across estuaries and coastal wetlands. Environ. Sci. Technol. 2024, 58, 9213–9226. [Google Scholar] [CrossRef]
  50. Hoffmeister, S.; Murphy, K.; Cascone, C.; Ledesma, J.L.; Köhler, S. Evaluating the accuracy of two in situ optical sensors to estimate DOC concentrations for drinking water production. Environ. Sci. Water Res. Technol. 2020, 6, 2891–2901. [Google Scholar] [CrossRef]
  51. Houskeeper, H.F.; Hooker, S.B.; Kudela, R.M. Spectral range within global aCDOM (440) algorithms for oceanic, coastal, and inland waters with application to airborne measurements. Remote Sens. Environ. 2021, 253, 112155. [Google Scholar] [CrossRef]
  52. Kowalczuk, P.; Cooper, W.J.; Durako, M.J.; Kahn, A.E.; Gonsior, M.; Young, H. Characterization of dissolved organic matter fluorescence in the South Atlantic Bight with use of PARAFAC model: Relationships between fluorescence and its components, absorption coefficients and organic carbon concentrations. Mar. Chem. 2010, 118, 22–36. [Google Scholar] [CrossRef]
  53. Wünsch, U.J.; Murphy, K.R.; Stedmon, C.A. Fluorescence quantum yields of natural organic matter and organic compounds: Implications for the fluorescence-based interpretation of organic matter composition. Front. Mar. Sci. 2015, 2, 98. [Google Scholar] [CrossRef]
  54. Mineeva, N.; Poddubny, S.; Stepanova, I.; Tsvetkov, A. Abiotic factors and their role in phytoplankton development in reservoirs of the Middle Volga River, Russia. Inland Water Biol. 2022, 15, 729–739. [Google Scholar] [CrossRef]
  55. Nemirovskaya, I.; Lisitzin, A. Spatial variability of different compounds in water, suspension, and sediments of the Volga River. Dokl. Earth Sci. 2011, 437, 537–543. [Google Scholar] [CrossRef]
  56. Nagai, S.; Nasahara, K.N.; Akitsu, T.K.; Saitoh, T.M.; Muraoka, H. Importance of the collection of abundant ground-truth data for accurate detection of spatial and temporal variability of vegetation by satellite remote sensing. In Biogeochemical Cycles: Ecological Drivers and Environmental Impact; Wiley Online Library: Hoboken, NJ, USA, 2020; pp. 223–244. [Google Scholar]
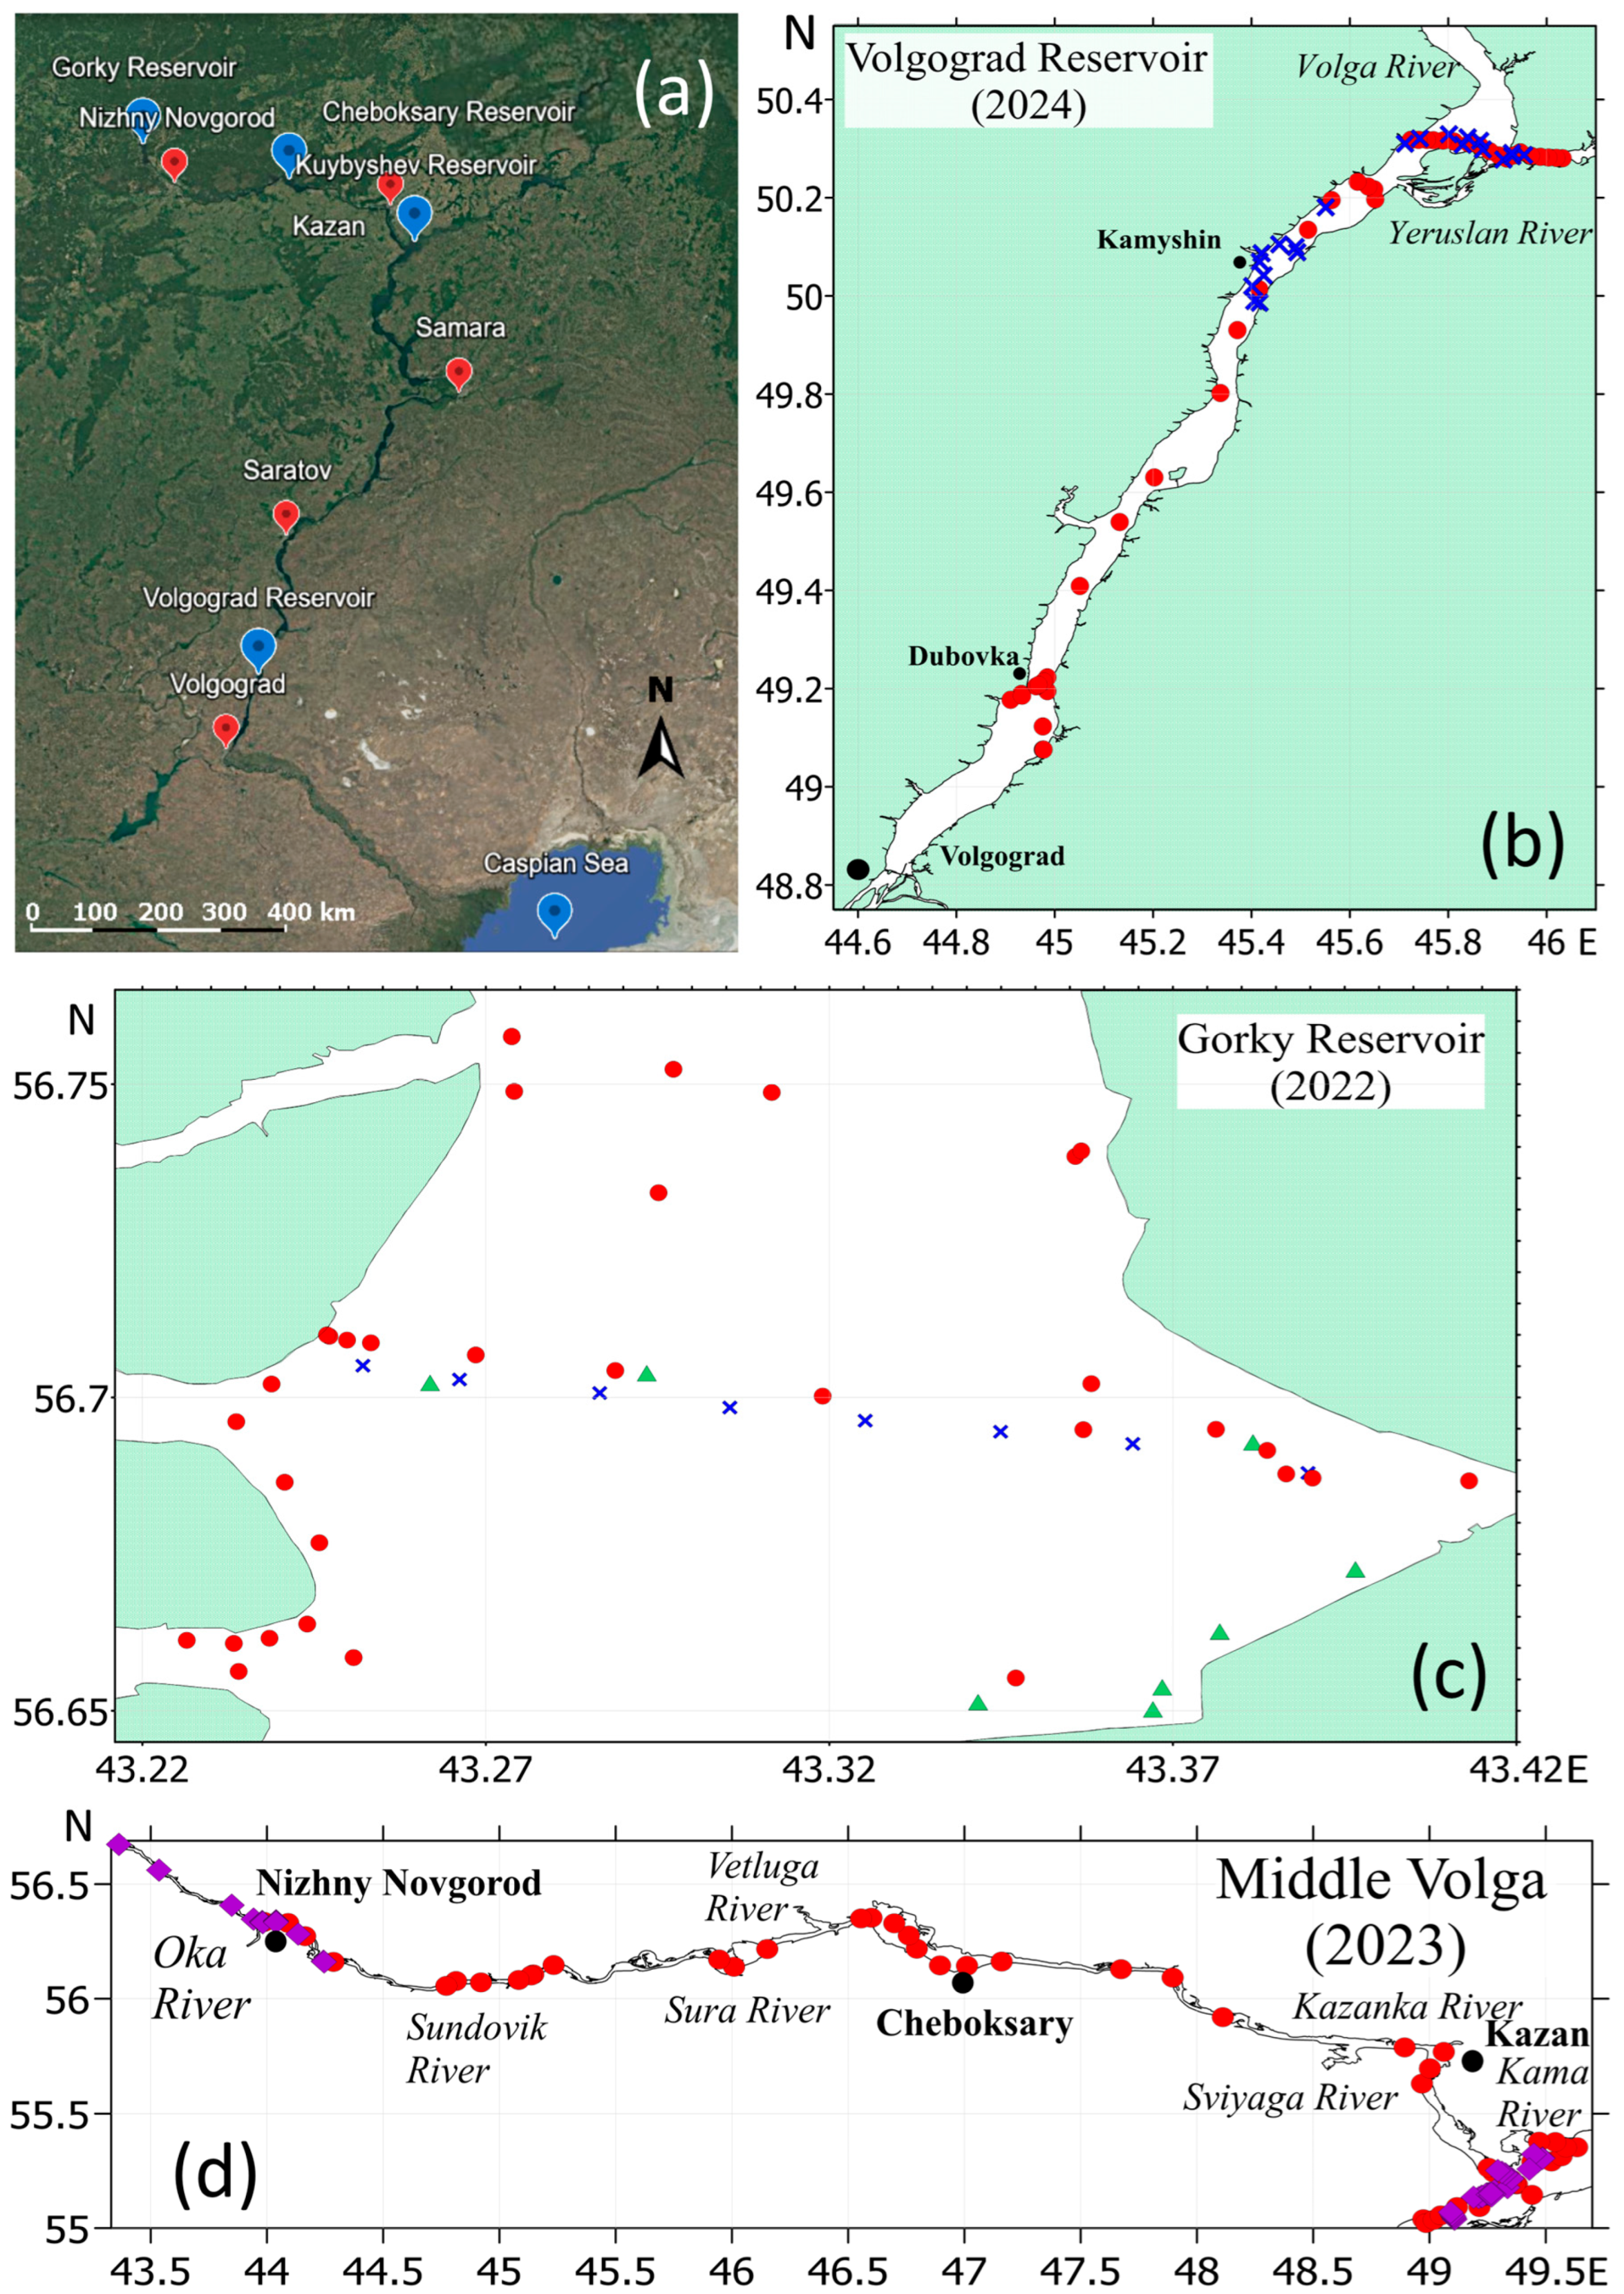
Figure 1. (a) A section of the Volga River from the Gorky Reservoir, located on the border of the Upper and Middle Volga basins, to the delta area at the confluence of the Volga River and the Caspian Sea; blue and red inverted-drop-shaped icons mark locations of reservoirs and cities, respectively. (bd) Sample site locations during the field studies of the Volga River surface waters conducted in May (green triangles), June (blue crosses), July—beginning of August (violet squares), and August–September (red dots) 2022–2024.
Environments 12 00309 g001
Figure 2. Distributions of the worst pairwise Tucker’s congruence coefficients among the 100 random splits of the Volga River dataset.
Environments 12 00309 g002
Figure 3. EEMs of individual PARAFAC components C1–C4. The colour bar shows fluorescence intensity in relative units. Red dots correspond to some of the pairs of excitation n/detection wavelengths frequently used in commercial sensors.
Environments 12 00309 g003
Figure 4. FDOM fluorescence intensity at the studied excitation/detection wavelengths, F i , j , k , against concentration of PARAFAC fluorescent components C1 (a), C2 (b), C3 (c), and C4 (d), expressed in Raman units.
Environments 12 00309 g004
Figure 5. Upper panel: fluorescence intensity at 404 nm excited by the 355 nm against integral fluorescence intensity of C2 component expressed in Raman units. It repeats partly one of the diagrams in Figure 4b, providing more information on temporal and spatial variability of FDOM. Lower panel: fluorescence intensity of PARAFAC components C2–C4 against that one of C1.
Environments 12 00309 g005
Figure 6. Left panel: integral fluorescence intensity of PARAFAC components C1–C4 against absorption coefficient a C D O M 440 . Right panel: all the samples collected during field studies (2022–2024) showing a C D O M 440 plotted against FDOM fluorescence intensity at 480 nm, excited at 365 nm.
Environments 12 00309 g006
Table 1. Excitation/emission maxima of C1–C4 PARAFAC components obtained with a 4-component model and the number of matches in the OpenFluor database. Multiple excitation maxima are separated by comma.
ComponentExcitation, nmEmission, nmNumber of Matches in OpenFluorDescription
C1<280, 343453107Humic-like, terrestrial
C2<260, 304403131Humic-like, terrestrial, or microbial
C3269, 39751176Humic-like, terrestrial, sediment/soil fulvic-like
C4<245, 27733433Protein-like, autochthonous
Table 2. Average F r i n t of individual PARAFAC components, their fraction to the total FDOM fluorescence (in %), as well as absorption coefficient at 440 nm ( a C D O M 440 ) and E2:E3 ratio for the studied areas of the Volga River; n is the number of samples.
DatenFraction, %Average F r i n t ,
103 R.U.⋅nm2
aCDOM(440), m−1E2:E3
C1C2C3C4C1C2C3C4
Gorky Reservoir
2022/058462722–234–527.2 ± 0.815.7 ± 0.313.7 ± 0.52.5 ± 0.16.4 ± 0.35.29 ± 0.04
2022/068453019–204–625.8 ± 0.316.9 ± 0.411.8 ± 0.22.8 ± 0.34.8 ± 0.15.78 ± 0.04
2022/083241–4333–3416–186–724.5 ± 0.918.5 ± 0.610.4 ± 0.33.5 ± 0.43.5 ± 0.56.52 ± 0.20
Between Gorky Reservoir and confluence with the Oka River
2023/071242–4432–3318–195–723.1 ± 1.017.3 ± 0.710.2 ± 0.33.1 ± 0.33.4 ± 0.26.74 ± 0.12
Oka River
2023/082393418913.5 ± 0.111.6 ± 0.36.4 ± 0.13.0 ± 0.31.9 ± 0.16.39 ± 0.06
Confluence with the Oka River—Cheboksary Reservoir
2023/08541–433318–195–818.5 ± 2.314.5 ± 1.38.4 ± 0.92.9 ± 0.12.6 ± 0.36.56 ± 0.09
2023/091441–4234–3517–186–817.9 ± 1.114.7 ± 0.77.8 ± 0.52.8 ± 0.12.0 ± 0.17.32 ± 0.7
Cheboksary Reservoir
2023/097413517718.5 ± 0.615.5 ± 0.67.9 ± 0.13.0 ± 0.21.9 ± 0.17.42 ± 0.11
Cheboksary Reservoir—Kazan
2023/09841–4234–35176–718.8 ± 0.315.3 ± 0.27.9 ± 0.23.0 ± 0.22.0 ± 0.27.33 ± 0.11
Kama River
2023/07737–4134–3816–178–99.2 ± 0.28.0 ± 0.64.0 ± 0.11.9 ± 0.21.5 ± 0.17.16 ± 0.07
2023/09114135177–811.9 ± 0.410.0 ± 0.45.0 ± 0.12.1 ± 0.21.3 ± 0.17.62 ± 0.20
Confluence of the Volga and Kama rivers
2023/071040–4234–3516–186–914.7 ± 1.311.9 ± 0.86.2 ± 0.62.4 ± 0.32.0 ± 0.27.06 ± 0.13
2023/09124135177–815.2 ± 1.812.7 ± 1.66.4 ± 0.82.6 ± 0.31.7 ± 0.27.39 ± 0.10
Volgograd Reservoir
2024/061938–4232–3417–187–1212.8 ± 0.910.2 ± 0.55.6 ± 0.42.7 ± 0.51.8 ± 0.36.72 ± 0.30
2024/093740–4234–3616–196–814.3 ± 0.812.1 ± 0.56.3 ± 0.32.4 ± 0.11.8 ± 0.27.40 ± 0.20
Confluence with Yeruslan River
2024/06236–3835–3616–1710–128.9 ± 0.48.4 ± 0.044.2 ± 0.12.6 ± 0.40.96 ± 0.018.53 ± 0.50
2024/08338–3935–36178–911.5 ± 1.010.4 ± 0.75.2 ± 0.32.5 ± 0.11.3 ± 0.18.16 ± 0.30
Table 3. Ranges of relative contributions of the PARAFAC components to fluorescence intensities at selected wavelength pairs.
λ ex , nm λ em , nm C1C2C3C4
3554040.43–0.640.36–0.5700
3554400.73–0.840.13–0.250.02–0.030
3556850.29–0.360.11–0.220.48–0.580
3654800.75–0.800.02–0.060.16–0.210
4705250010
4706850010
Table 4. Parameters for the linear regression models describing the correlation between DOM fluorescence intensities and concentration of PARAFAC fluorescent components expressed in Raman units. Analysis is performed on the basis of full dataset of 227 EEMs.
ComponentParameter355/404,
R.U.
355/440,
R.U.
355/685,
R.U.
365/480,
R.U.
470/525,
R.U.
470/685,
R.U.
  a C D O M 440 , m−1
C1Slope∙1052.865.320.2114.460.3870.06120
Intercept 0.0850.046−0.001−0.0060.0020.000−1.06
R20.990.990.950.990.940.930.75
C2Slope∙1054.538.280.3206.830.5740.093n/a
Intercept−0.037−0.161−0.008−0.165−0.010−0.002n/a
R20.900.870.780.830.740.750.47
C3Slope∙1056.0211.330.469.630.8600.13745.7
Intercept0.1260.1100.0010.0380.0040.000−1.06
R2p870.940.970.970.980.980.970.84
C4R20.380.350.330.320.270.290.14
Disclaimer/Publisher’s Note: The statements, opinions and data contained in all publications are solely those of the individual author(s) and contributor(s) and not of MDPI and/or the editor(s). MDPI and/or the editor(s) disclaim responsibility for any injury to people or property resulting from any ideas, methods, instructions or products referred to in the content.