Article

Remote Sensing-Based Mapping of Soil Health Descriptors Across Cyprus

by
Ioannis Varvaris
1,*,
Zampela Pittaki
2,
George Themistokleous
1,
Dimitrios Koumoulidis
1,
Dhouha Ouerfelli
1,
Marinos Eliades
1,
Kyriacos Themistocleous
1 and
Diofantos Hadjimitsis
1,3
1
Eratosthenes Centre of Excellence, 3012 Limassol, Cyprus
2
World Agroforestry Centre, Nairobi 00100, Kenya
3
Department of Civil Engineering and Geomatics, Faculty of Engineering and Technology, Cyprus University of Technology, 3036 Limassol, Cyprus
*
Author to whom correspondence should be addressed.
Environments 2025, 12(8), 283; https://doi.org/10.3390/environments12080283
Submission received: 3 July 2025 / Revised: 6 August 2025 / Accepted: 13 August 2025 / Published: 17 August 2025
(This article belongs to the Special Issue Remote Sensing Technologies for Soil Health Monitoring)

Abstract

Accurate and spatially detailed soil information is essential for supporting sustainable land use planning, particularly in data-scarce regions such as Cyprus, where soil degradation risks are intensified by land fragmentation, water scarcity, and climate change pressure. This study aimed to generate national-scale predictive maps of key soil health descriptors by integrating satellite-based indicators with a recently released geo-referenced soil dataset. A machine learning model was applied to estimate a suite of soil properties, including organic carbon, pH, texture fractions, macronutrients, and electrical conductivity. The resulting maps reflect spatial patterns consistent with previous studies focused on Cyprus and provide high resolution insights into degradation processes, such as organic carbon loss, and salinization risk. These outputs provide added value for identifying priority zones for soil conservation and evidence-based land management planning. While predictive uncertainty is greater in areas lacking ground reference data, particularly in the northeastern part of the island, the modeling framework demonstrates strong potential for a national-scale soil health assessment. The outcomes are directly relevant to ongoing soil policy developments, including the forthcoming Soil Monitoring Law, and provide spatial prediction models and indicator maps that support the assessment and mitigation of soil degradation.

1. Introduction

Healthy soils are fundamental to ecosystem functioning and essential for sustaining food security, regulating the climate, conserving biodiversity, and cycling water and nutrients [1,2]. The European Commission (EC) Joint Research Centre has estimated that 60 to 70 percent of soils within the European Union (EU) are currently affected by unsustainable management practices, posing serious risks to both soil and human health [3,4]. Despite their vital importance, soil protection within the EU has traditionally lacked coherence, as relevant policies addressing soil concerns stemmed from either an agricultural or an environmental perspective, such as the Common Agricultural Policy, the Nitrates Directive, the Natura 2000 network, and the Water Framework Directive, without integrating them into a unified framework [5]. As a result, the EU has lacked a dedicated legal framework specifically focused on protecting soils across all land uses [6]. This institutional gap has also been highlighted by both the European Court of Auditors (European Court of Auditors. https://www.eca.europa.eu/en/publications?did=48393, accessed on 16 August 2025) and the EC (EuropeanCommission. https://eur-lex.europa.eu/legal-content/EN/TXT/?uri=COM%3A2019%3A640%3AFIN, accessed on 16 August 2025). Urgent and strategic measures are therefore needed to promote sustainable soil management and safeguard the ecological integrity of EU soils. In response, the proposed Soil Monitoring and Resilience Directive, commonly referred to as the Soil Monitoring Law, was introduced and is currently undergoing trialogue negotiations between the European Parliament and the Council. Introduced by the EC in July 2023 as part of the EU Soil Strategy for 2030, the Directive aims to ensure that all soil ecosystems in the EU are set on a course for recovery and maintained in a healthy state by 2050 [7,8,9]. Under the Directive, Member States (MS) will be legally required to regularly monitor soil health and land take, using standardized descriptors and scientifically defined criteria [7,10].
The Directive obliges MS to establish soil districts (“Soil districts: Part of the territory of a Member State, as delimited by that Member State for the purposes of soil health assessment and management.” Definition from Commission Staff Working Document—Impact Assessment Report https://eur-lex.europa.eu/legal-content/EN/TXT/?uri=SWD:2023:417:FIN, accessed on 16 August 2025), conduct measurements at least every five years, and assess soil health based on a series of descriptors defined at both EU and national levels [7]. According to the EU Mission: A Soil Deal for Europe Implementation Plan (EU Mission: A Soil Deal for Europe Implementation Plan. https://commission.europa.eu/system/files/2021-09/soil_mission_implementation_plan_final_for_publication.pdf, accessed on 16 August 2025) and the Commission Staff Working Document—Impact Assessment Report for the proposed Directive on Soil Monitoring and Resilience (Commission Staff Working Document—Impact Assessment Report https://eur-lex.europa.eu/legal-content/EN/TXT/?uri=SWD:2023:417:FIN, accessed on 16 August 2025), a set of 18 soil health descriptors has been identified to support the monitoring and assessment of soil health across Europe, which are linked with 19 soil degradation indicators as provided by the EU-wide soil health observatory dashboard (Figure 1) (EU-wide soil health observatory dashboard. https://esdac.jrc.ec.europa.eu/esdacviewer/euso-dashboard/, accessed on 16 August 2025). Soil health descriptors encompass physical, chemical, and biological characteristics, while soil degradation indicators follow a ‘one-out-all-out’ approach (European Parliament briefing on the Soil Monitoring and Resilience Directive: https://www.europarl.europa.eu/RegData/etudes/BRIE/2024/757627/EPRS_BRI(2024)757627_EN.pdf, accessed on 16 August 2025) (United Nations Statistics Division. https://unstats.un.org/sdgs/metadata/files/Metadata-15-03-01.pdf, accessed on 16 August 2025), meaning that soil is considered healthy only if all relevant descriptors meet the established thresholds at both EU and MS levels, with failure to meet even a single criterion resulting in an ‘unhealthy’ classification [11,12,13,14]. This regulatory development marks a historic turning point: soil health is no longer a purely scientific or agricultural concern, but a policy mandate, supported by structured monitoring, reporting obligations, and a pan-European solid data infrastructure, as accommodated by the EU Soil Observatory [15].
Undoubtedly, the successful enforcement of the Soil Monitoring Law hinges not solely on regulatory compliance but also on the availability, interoperability, and systematic integration of diverse data types capable of capturing the complexity and variability of soil systems. As recent scientific evidence highlights, soil health cannot be assessed or monitored solely through a single indicator, such as soil organic carbon (SOC) alone [16,17,18,19,20,21]. A pan-European study by Prăvălie et al. [11] highlights that soil degradation, and consequently, soil health, arises from the convergence of multiple stressors, including soil compaction, erosion (caused by water and wind), salinization, acidification, nutrient imbalance, vegetation degradation, and contamination by pesticides and heavy metals. Their research, spanning more than 40 countries, underscores the necessity of a multi-indicator approach to soil health monitoring that captures the complex and multi-dimensional nature of soil degradation, which frequently results from the interplay of multiple degradation processes co-occurring. Indeed, more than 10% of agricultural lands in Europe are simultaneously exposed to four or more degradation drivers, demanding advanced tools and frameworks for integrated assessment.
In Cyprus, the urgency to establish a robust and spatially explicit framework for assessing soil conditions is particularly acute. Although the island exhibits significant agroecological diversity and faces well documented land degradation pressures, the availability of harmonized and accessible soil data remains highly constrained [22,23,24,25,26,27]. For example, the widely used LUCAS (Land Use/Cover Area frame Statistical Survey) Database (Joint Research Centre—European Soil Data Centre (ESDAC). https://esdac.jrc.ec.europa.eu/projects/lucas, accessed on 16 August 2025) includes fewer than 70 geo-referenced samples for Cyprus, a sample density insufficient to support reliable national-scale inference. Furthermore, there is no centralized national soil database. Existing datasets remain disconnected, non-harmonized, and largely inaccessible for broader research and policy use, as they are typically confined to localized studies that are isolated in nature, scattered across various research institutions and government agencies, and often inconsistently formatted. As a result, they cannot be integrated into a functional national soil information system capable of supporting large-scale monitoring or policy development. Consequently, most studies remain limited in both spatial scale and the range of soil health descriptors they address, primarily due to the unavailability of a harmonized national soil database [28,29]. Compounding these limitations is the absence of spatiotemporal monitoring mechanisms to detect changes in soil condition and to characterize degradation dynamics across the landscape. Previous modeling efforts for Cyprus have primarily drawn upon pan-European or global-scale frameworks [11,30,31], which have provided valuable and innovative insights. However, due to the limited availability of Cyprus-specific soil data until recently, these approaches may not fully capture the island’s distinctive pedoclimatic conditions, land management practices, and ecological variability at the spatial resolution needed to support the implementation of the Soil Monitoring Law effectively.
A significant advancement toward addressing this gap has recently emerged with the release of an open-access, geo-referenced soil dataset comprising 951 samples, published by Dalias et al. [27]. This dataset represents the most comprehensive soil sampling effort undertaken in Cyprus to date, encompassing a range of soil health descriptors, including texture, SOC, pH, EC, and macronutrient content, all collected under standardized protocols. This new empirical foundation enables the development of predictive spatial models for individual soil health descriptors by integrating Earth Observation (EO) data and spatial covariates [32,33,34,35]. Such modeling approaches can facilitate a deeper understanding of the current state and spatial variability of key soil attributes, offering valuable insights into potential degradation patterns and informing national-scale land management strategies and Monitoring, Reporting, and Verification frameworks relevant to carbon credit schemes and emerging carbon markets [36,37,38]. In particular, accurate and high-resolution SOC maps enable robust spatial estimates of carbon stocks and their temporal dynamics, thereby improving the reliability of soil carbon accounting and supporting transparency in soil-based climate mitigation efforts [39,40].
This study addresses two critical research gaps for Cyprus: (i) the absence of spatially explicit soil modeling approaches that account for variability in soil characteristics across different land use contexts, and (ii) the lack of national-scale, multi-indicator assessments of soil health that integrate EO and ground-based data in alignment with emerging EU policy objectives, such as the proposed Soil Monitoring Law. To address these gaps, a set of prediction models was developed to assess multiple soil health characteristics across Cyprus by integrating satellite data with the recently released geo-referenced soil dataset by Dalias et al. [27]. The study employs geospatial modeling techniques and machine learning (ML) algorithms to estimate key soil attributes, including SOC, pH, texture, and nutrient content, across the national territory. By adopting a multi-indicator perspective grounded in both empirical observations and remote sensing data, the study responds to current scientific recommendations and policy requirements for holistic soil monitoring, particularly in MS, where national-scale datasets are limited. This integration of up-to-date Sentinel-2 spectral information with the most extensive national soil dataset available for Cyprus represents a significant advancement in digital soil mapping for Mediterranean landscapes, enabling the development of robust, data-driven tools for national-scale soil monitoring and policy support.

2. Materials and Methods

2.1. Study Area and Soil Reference Data

The case study for this research is the Republic of Cyprus, an island Member State of the European Union characterized by pronounced agroecological variability, semi-arid climatic conditions, and increasing pressures from land degradation and climate change [41]. To support the development of predictive models for soil health descriptors across Cyprus, the study utilizes the national-scale soil dataset recently compiled by Dalias et al. [27]. This geo-referenced dataset comprises standardized laboratory analyses of 10 key physical and chemical soil properties, including SOC, pH, EC, calcium carbonate (CaCO3), total nitrogen (N), available phosphorus (P), exchangeable potassium (K), and soil texture (Sand, Silt, and Clay fractions), based on composite topsoil samples (0–20 cm) collected from 951 agricultural sites across Cyprus.
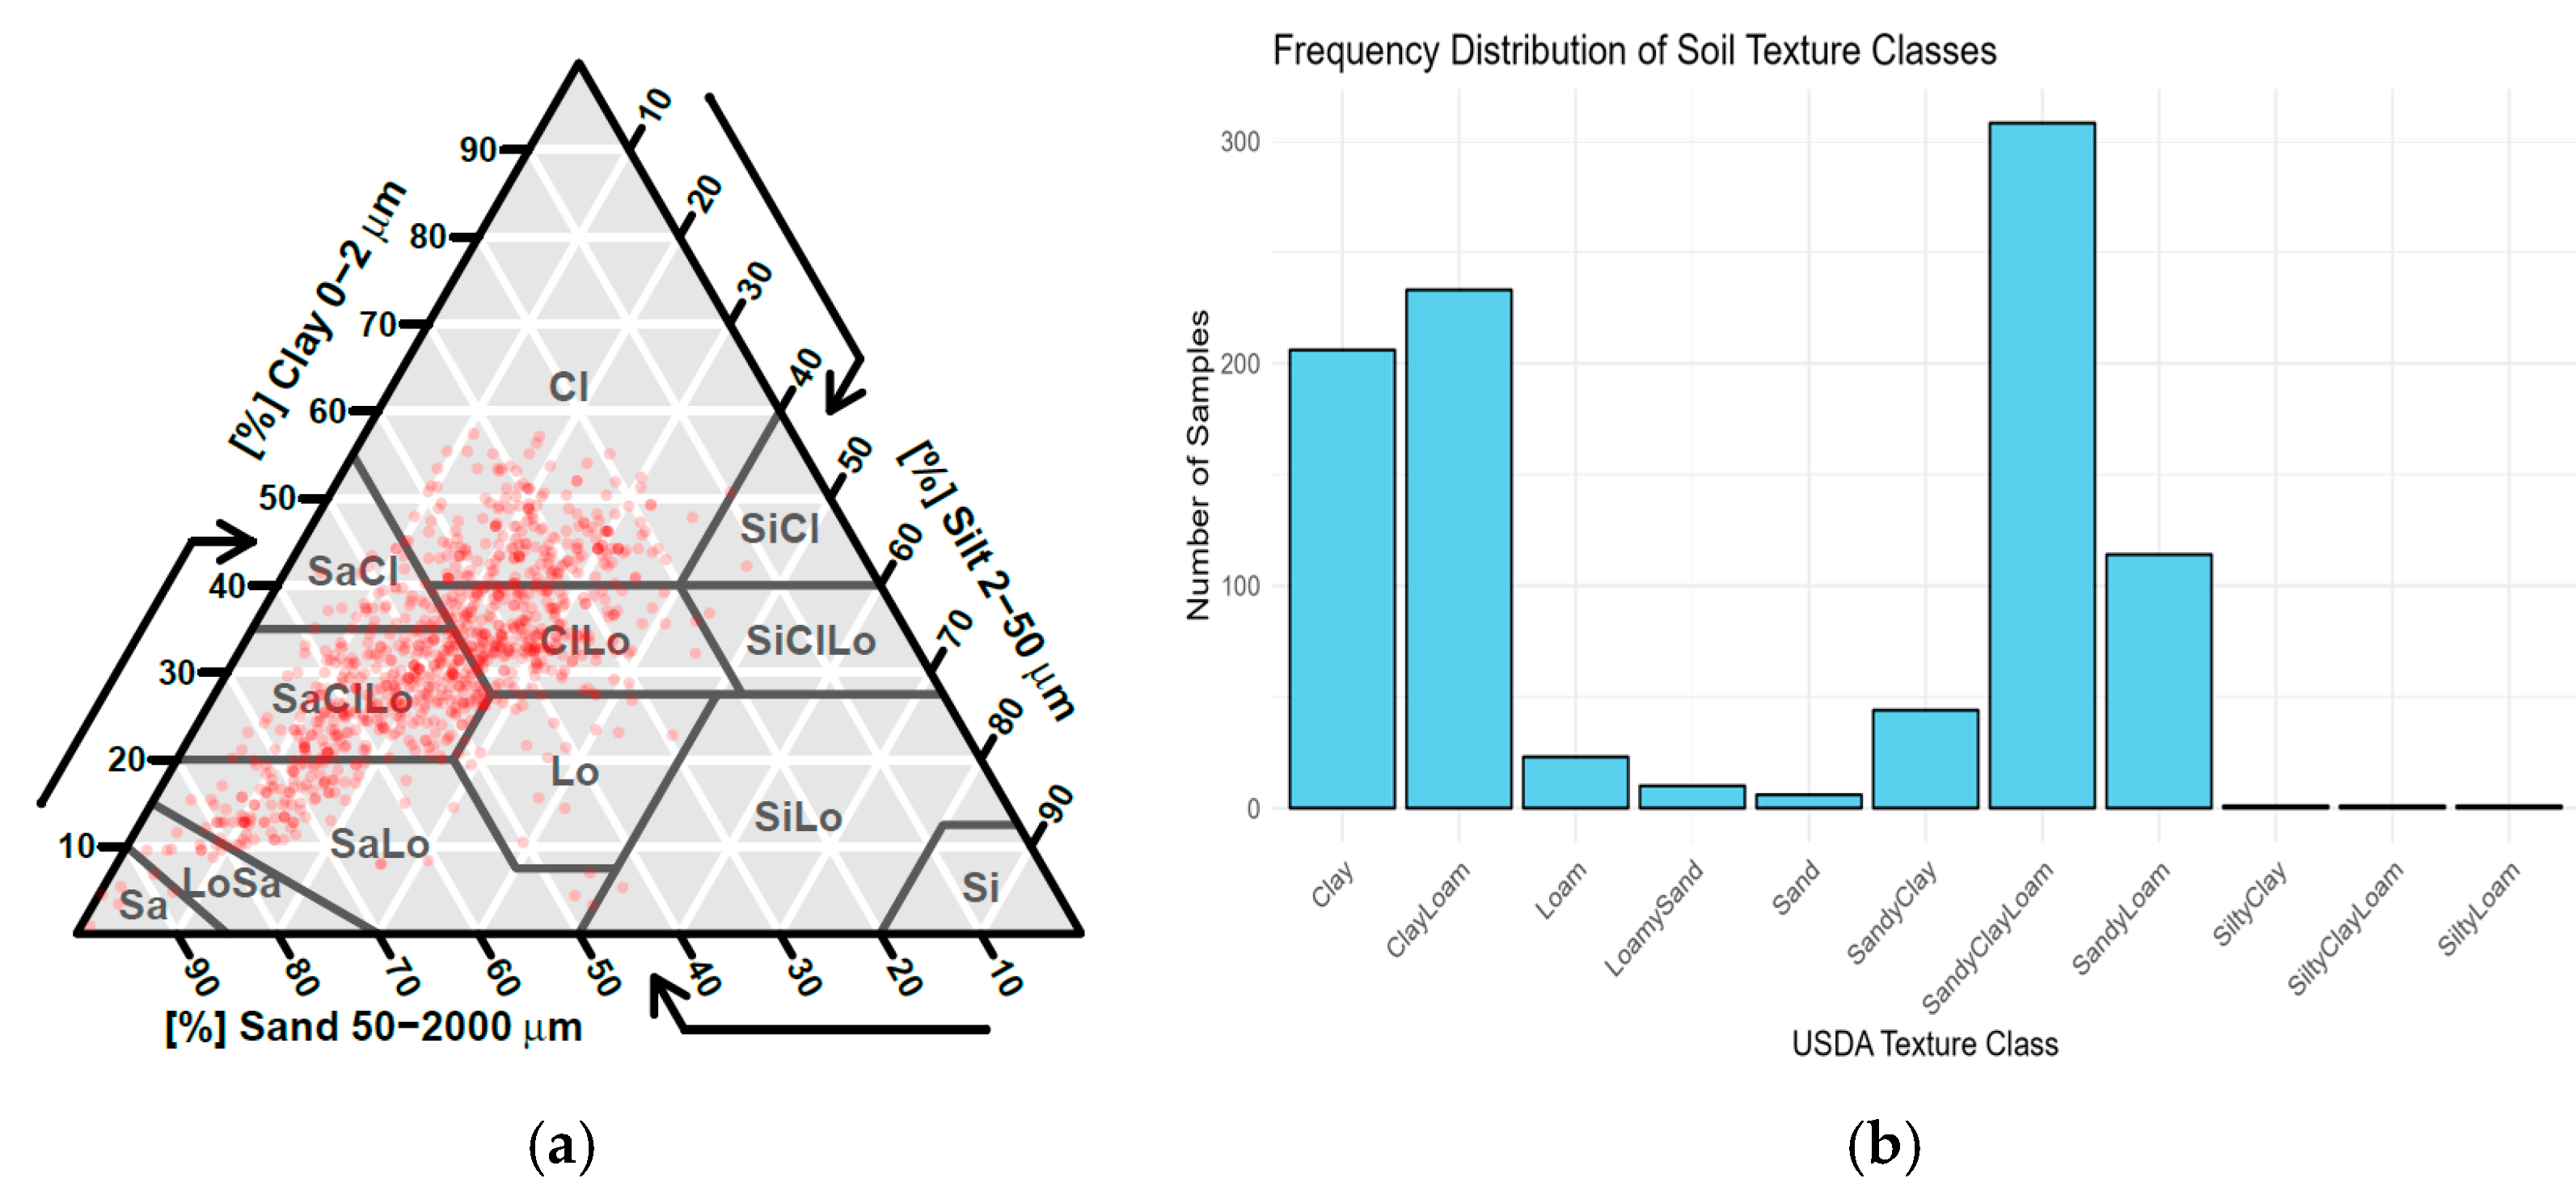
Sampling campaigns were designed to represent the spatial heterogeneity of major soil types, with laboratory procedures conducted using established methodologies such as the Walkley–Black method for SOC and the Kjeldahl method for Total N [42,43]. All samples were geotagged, and subsamples were archived under a barcode-linked system to enable long-term reference and reuse. The resulting dataset provides an unprecedented empirical foundation for spatial soil modeling in Cyprus, offering high-resolution, thematically rich input data essential for national soil health assessments and digital mapping. Figure 2 illustrates the particle size distribution of the 951 geo-referenced soil samples across Cyprus, plotted within the USDA soil texture triangle [44]. The samples span a wide range of textural classes, with a notable concentration in the loam, sandy loam, and clay loam categories. This spread reflects the diverse pedological and agroecological conditions of the island, supporting the development of robust prediction models for soil texture components.

2.2. Sentinel-2 Data Acquisition and Processing

To develop spatial predictors for soil property modeling, Sentinel-2 multispectral imagery was acquired and processed using the Google Earth Engine (GEE) cloud-computing platform through the rgee interface in R. Two distinct approaches were used: (i) extraction of spectral information at the exact locations and dates of field sampling for model training, and (ii) generation of a continuous spatial predictor layer covering the entire territory of Cyprus.

2.2.1. Extraction of Sentinel-2 Predictors at Soil Sample Locations

To ensure temporal alignment between soil sampling and satellite data, a targeted spectral extraction workflow was implemented. For each geo-referenced soil sample, Sentinel-2 surface reflectance imagery (COPERNICUS/S2_SR) was queried within a ±1-month window around the recorded sampling date. Temporal alignment ensures that the spectral reflectance values correspond to the actual soil surface conditions at the time of sampling. This reduces the impact of vegetation growth, soil moisture variation, and management practices that could otherwise introduce noise into the modeling process. Only scenes with less than 5% cloud cover were retained based on the CLOUDY_PIXEL_PERCENTAGE metadata field. Cloud and shadow masking were performed using the Scene Classification Layer (SCL) associated with each image [45]. Pixels labeled as cloud (class 8), cirrus (9), cloud shadow (3), and snow (11) were removed. After masking, a median composite image was created per point location using the selected images within the time window. From each median composite, six Sentinel-2 spectral bands were extracted: B2 (blue, 490 nm), B3 (green, 560 nm), B4 (red, 665 nm), B8 (near-infrared, 842 nm), B11 (SWIR-1, 1610 nm), and B12 (SWIR-2, 2190 nm). These bands were selected based on their well-established relevance for soil-related applications. They span key regions of the visible, near-infrared, and shortwave-infrared spectrum, which are known to be sensitive to soil texture, organic matter, and moisture content. Moreover, these bands have 10–20 m spatial resolution, offering a balance between spectral detail and spatial accuracy when linked with sample point data. Additionally, three commonly used vegetation and soil indices were computed [46]:
N o r m a l i z e d   D i f f e r e n c e   V e g e t a t i o n   I n d e x   ( N D V I ) :   ( B 8     B 4 ) / ( B 8 + B 4 )
N o r m a l i z e d   D i f f e r e n c e   W a t e r   I n d e x   ( N D W I ) :   ( B 8     B 12 ) / ( B 8 + B 12 )
B a r e   S o i l   I n d e x   ( B S I ) :   [ ( B 11 + B 4 ) ( B 8 + B 2 ) ] / [ ( B 11 + B 4 ) + ( B 8 + B 2 ) ]
These nine predictors were extracted per point using the reduceRegion () function in Earth Engine and linked to each sample ID. All spectral bands and indices were resampled to 10 m spatial resolution to ensure consistency with the geo-referenced sample locations. The spatial coordinates for each soil sample were obtained from Dalias et al. [27], who recorded the locations during field sampling. To comply with Earth Engine’s processing limits, the dataset was split into batches of 100 samples, and each batch was processed sequentially using rgee in R. The final output was a harmonized table linking each soil sample with its corresponding Sentinel-2 spectral and index values, temporally matched to the sampling date.

2.2.2. Generation of Wall-to-Wall Predictor Raster for Mapping

For spatial prediction, a seamless national-scale raster stack of the same nine predictors was created. Sentinel-2 Level-2A imagery for Cyprus was filtered to the period from 1 May to 30 June 2025, coinciding with the dry season when bare soil conditions are optimal for reflectance-based soil analysis. All scenes with less than 5% cloud cover were retained. The same SCL-based cloud and shadow masking as described in 2.2.1 was applied. A per-pixel median composite was generated from all valid, cloud-free pixels during this period. The selected six bands (B2, B3, B4, B8, B11, B12) were scaled by dividing by 10,000 to convert them to reflectance values, and the NDVI, NDWI, and BSI indices were computed using the same formulas described above.
The composite was clipped to the Cyprus national boundary, as defined by the FAO GAUL Level 0 administrative dataset. Due to Earth Engine’s export constraints, the final predictor image was exported as multiple tiled GeoTIFFs at 10 m spatial resolution and later merged in R using the terra package to create a single seamless raster. This predictor stack served as input for model-based spatial predictions and included consistent band naming across all layers: B2, B3, B4, B8, B11, B12, NDVI, NDWI, and BSI.

2.2.3. Generation of Ancillary Environmental Layers

Besides the Sentinel-2 spectral predictors, several environmental covariates relevant to soil formation and landscape processes were generated to support future analyses and visual interpretations. These included a digital elevation model (DEM) and its terrain derivatives: slope, aspect, and topographic position index (TPI), as well as a national-scale land use/land cover (LULC) map.
For land use, the ESA WorldCover 2021 product (Version 200) (ESA WorldCover 2021. https://worldcover2021.esa.int/, accessed on 16 August 2025) was acquired from Google Earth Engine. This 10 m resolution dataset offers a globally consistent classification of land cover types, derived from Sentinel-1 and Sentinel-2 imagery.
The DEM was obtained from the Copernicus EU-DEM version 1.1 dataset, providing 25 m resolution elevation data for Europe. Terrain attributes were derived using the terrain() function from the terra package in R. Specifically, slope (in degrees), aspect (in azimuth degrees), and TPI were computed from the DEM using default window sizes. All resulting rasters were resampled to match the 10 m resolution of the Sentinel-2 predictor stack using bilinear interpolation.
Figure 3 highlights the spatial distribution of major land cover classes across Cyprus, revealing extensive areas of cropland concentrated in central and eastern regions, while tree cover dominates the mountainous zones in the west and north of the island. Built-up areas are primarily clustered along the southern coastline and around urban centers. These spatial patterns provided an important context for interpreting soil conditions and variability across contrasting land use types.
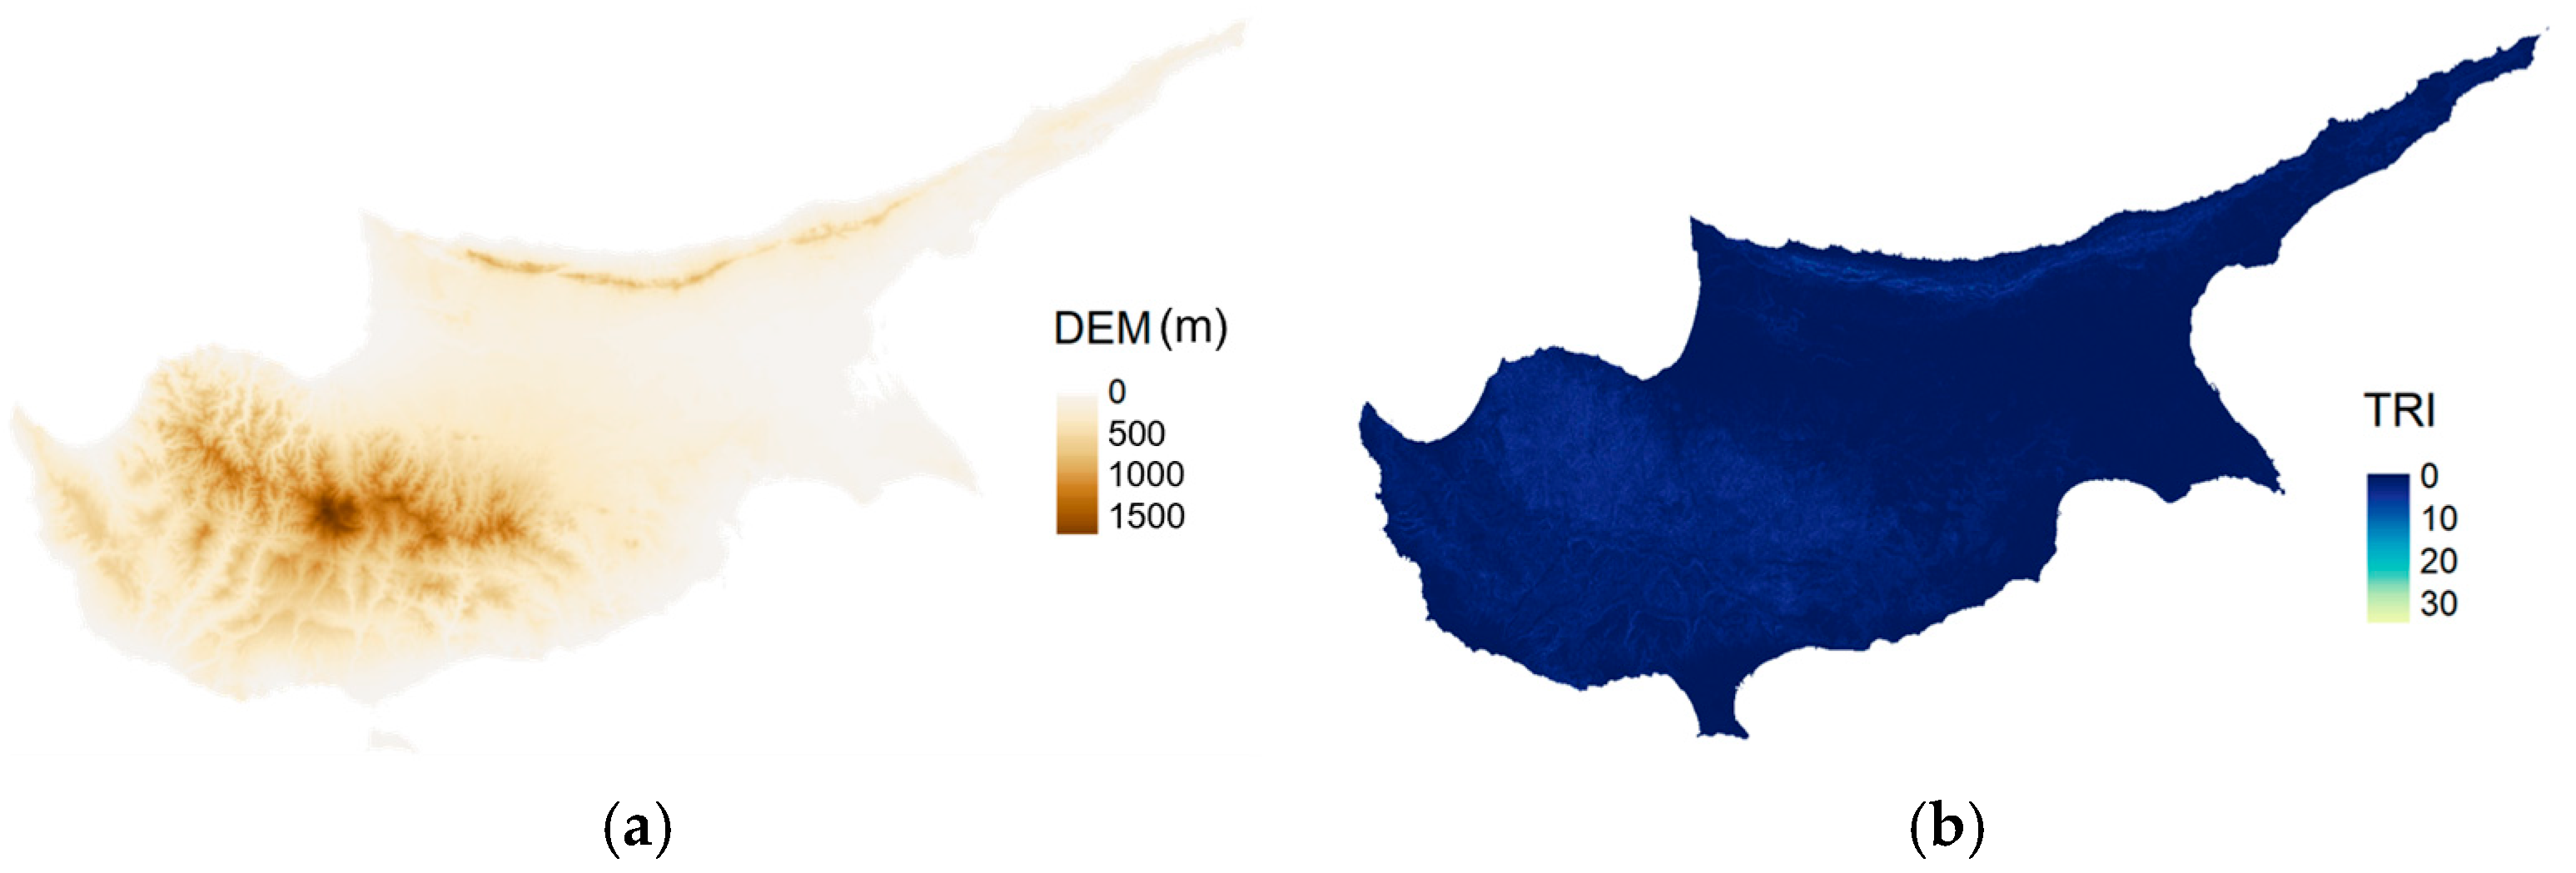
Topographic variables derived from the DEM (Figure 4 and Figure 5) offer critical insights into the geomorphological complexity of Cyprus and its impact on soil formation and degradation processes [29,47]. Elevation delineates the major physiographic zones of the island, with the Troodos and Kyrenia mountain ranges representing the highest altitudes and forming core areas of topographic contrast. Terrain roughness, as expressed through the TRI, reveals elevated surface heterogeneity in these mountainous zones, which is typically associated with greater geomorphic instability and erosion susceptibility. Slope gradients vary widely across the island, with steeper inclines concentrated in orographically complex regions, where enhanced runoff and reduced infiltration may exacerbate soil degradation. Aspect, representing the directional exposure of slopes, introduces additional spatial heterogeneity by modulating local solar radiation regimes, soil moisture retention, and vegetation dynamics [48]. Together, these terrain attributes frame the environmental context within which soil processes operate, offering important explanatory power for understanding spatial variability in soil health descriptors.

2.3. Soil Property Modeling

To model the relationship between satellite-derived spectral predictors and measured soil properties, Random Forest (RF) regression models were implemented [49]. RF was selected for its robustness against overfitting, its ability to handle nonlinear relationships and multicollinearity, and its demonstrated effectiveness in predicting soil properties from remote sensing data.
Model development was carried out in R (version 4.2.2) using the RF, caret, dplyr, ithir, and ggplot2 packages. A separate RF model was trained for each of the following eleven soil properties: N, available P, exchangeable K, pH, EC, CaCO3, sand, silt, clay, and SOC. All models used the same set of nine predictor variables derived from Sentinel-2 imagery: six reflectance bands (B2, B3, B4, B8, B11, B12) and three spectral indices (NDVI, NDWI, and BSI), as described in Section 2.2. All nine spectral and index-based predictors were retained across all RF models, without the application of additional feature selection techniques. This decision was made to preserve the full informational content of the predictors and to avoid the exclusion of potentially important variables, including those that may act synergistically with others. Given the RF algorithm’s inherent ability to handle multicollinearity and to disregard variables that contribute little or nothing to model performance (e.g., due to low variance or low importance), this approach was considered to support model robustness while ensuring consistency across all modeled soil properties.

2.3.1. Data Preparation and Outlier Handling

To reduce the impact of outliers and data noise, all spectral predictors were trimmed to the 1st–99th percentile range. Any sample with missing predictor values after trimming was excluded from modeling. Each target variable was similarly trimmed to its central distribution (1st–99th percentile), and modeling was only performed for variables with at least 10 valid observations and more than five unique values. This trimming approach helps stabilize model training by reducing the influence of statistical extremes, while preserving the main data structure and variability of each variable. The number of excluded samples after trimming was minimal across all target variables.

2.3.2. Model Training and Cross-Validation

Each RF model was trained using the train () function from the caret package with the underlying method set to “rf”. The model parameters included 500 trees (ntree = 500) and mtry = 3 (square root of the number of predictors). No further hyperparameter tuning was conducted. To evaluate model performance, 10-fold cross-validation was employed. Using the trainControl () function, the dataset for each target variable was randomly partitioned into ten equal-sized subsets (folds). In each iteration, the model was trained on nine folds and validated on the remaining one. This process was repeated ten times, such that each fold served as the validation set once. The combination of 10-fold cross-validation, conservative model tuning, and percentile-based outlier trimming reduces the risk of overfitting and supports robust model generalization.

2.3.3. Accuracy Assessment Metrics

The performance of the RF models was assessed using both calibration and 10-fold cross-validation results. Several evaluation metrics were employed to quantify the accuracy and reliability of the predictions, including the coefficient of determination (R2), concordance correlation coefficient (CCC), mean square error (MSE), root mean square error (RMSE), prediction bias, the ratio of performance to deviation (RPD), and the ratio of performance to interquartile distance (RPIQ). The mathematical formulas of the evaluation metrics are defined as follows [50]:
R 2 = 1 i = 1 N y i y p , i ^ 2 i = 1 N y i y ¯ 2
C C C = ( 2 ρ σ p σ o ) ( σ ο 2 + σ p 2 + ( y p ^     y ¯ ) 2 )  
M S E = 1 N i = 1 N y i y p ^ 2
R M S E = 1 N i = 1 N y i y p ^ 2
P r e d i c t i o n   b i a s = y p ^ ¯ y ¯
R P D = σ o S E P
R P I Q = I Q S E P = Q 3 Q 1 S E P
where y i is the measured value; y p ^ is the predicted value; y ¯ is the mean of the measured value; ρ is the Pearson correlation coefficient; σ p and σ o are the standard deviation of the predicted values and observed, respectively; IQ is the interquartile range, and S E P is the standard error ( S E ) of prediction.

3. Results

The predictive models generated for each soil property revealed substantial spatial variation across Cyprus, reflecting underlying differences in land use, topography, and agroecological conditions. The following section presents the model performance metrics and resulting maps for key soil health descriptors, offering spatially explicit insights into the distribution of critical soil attributes at a national scale.
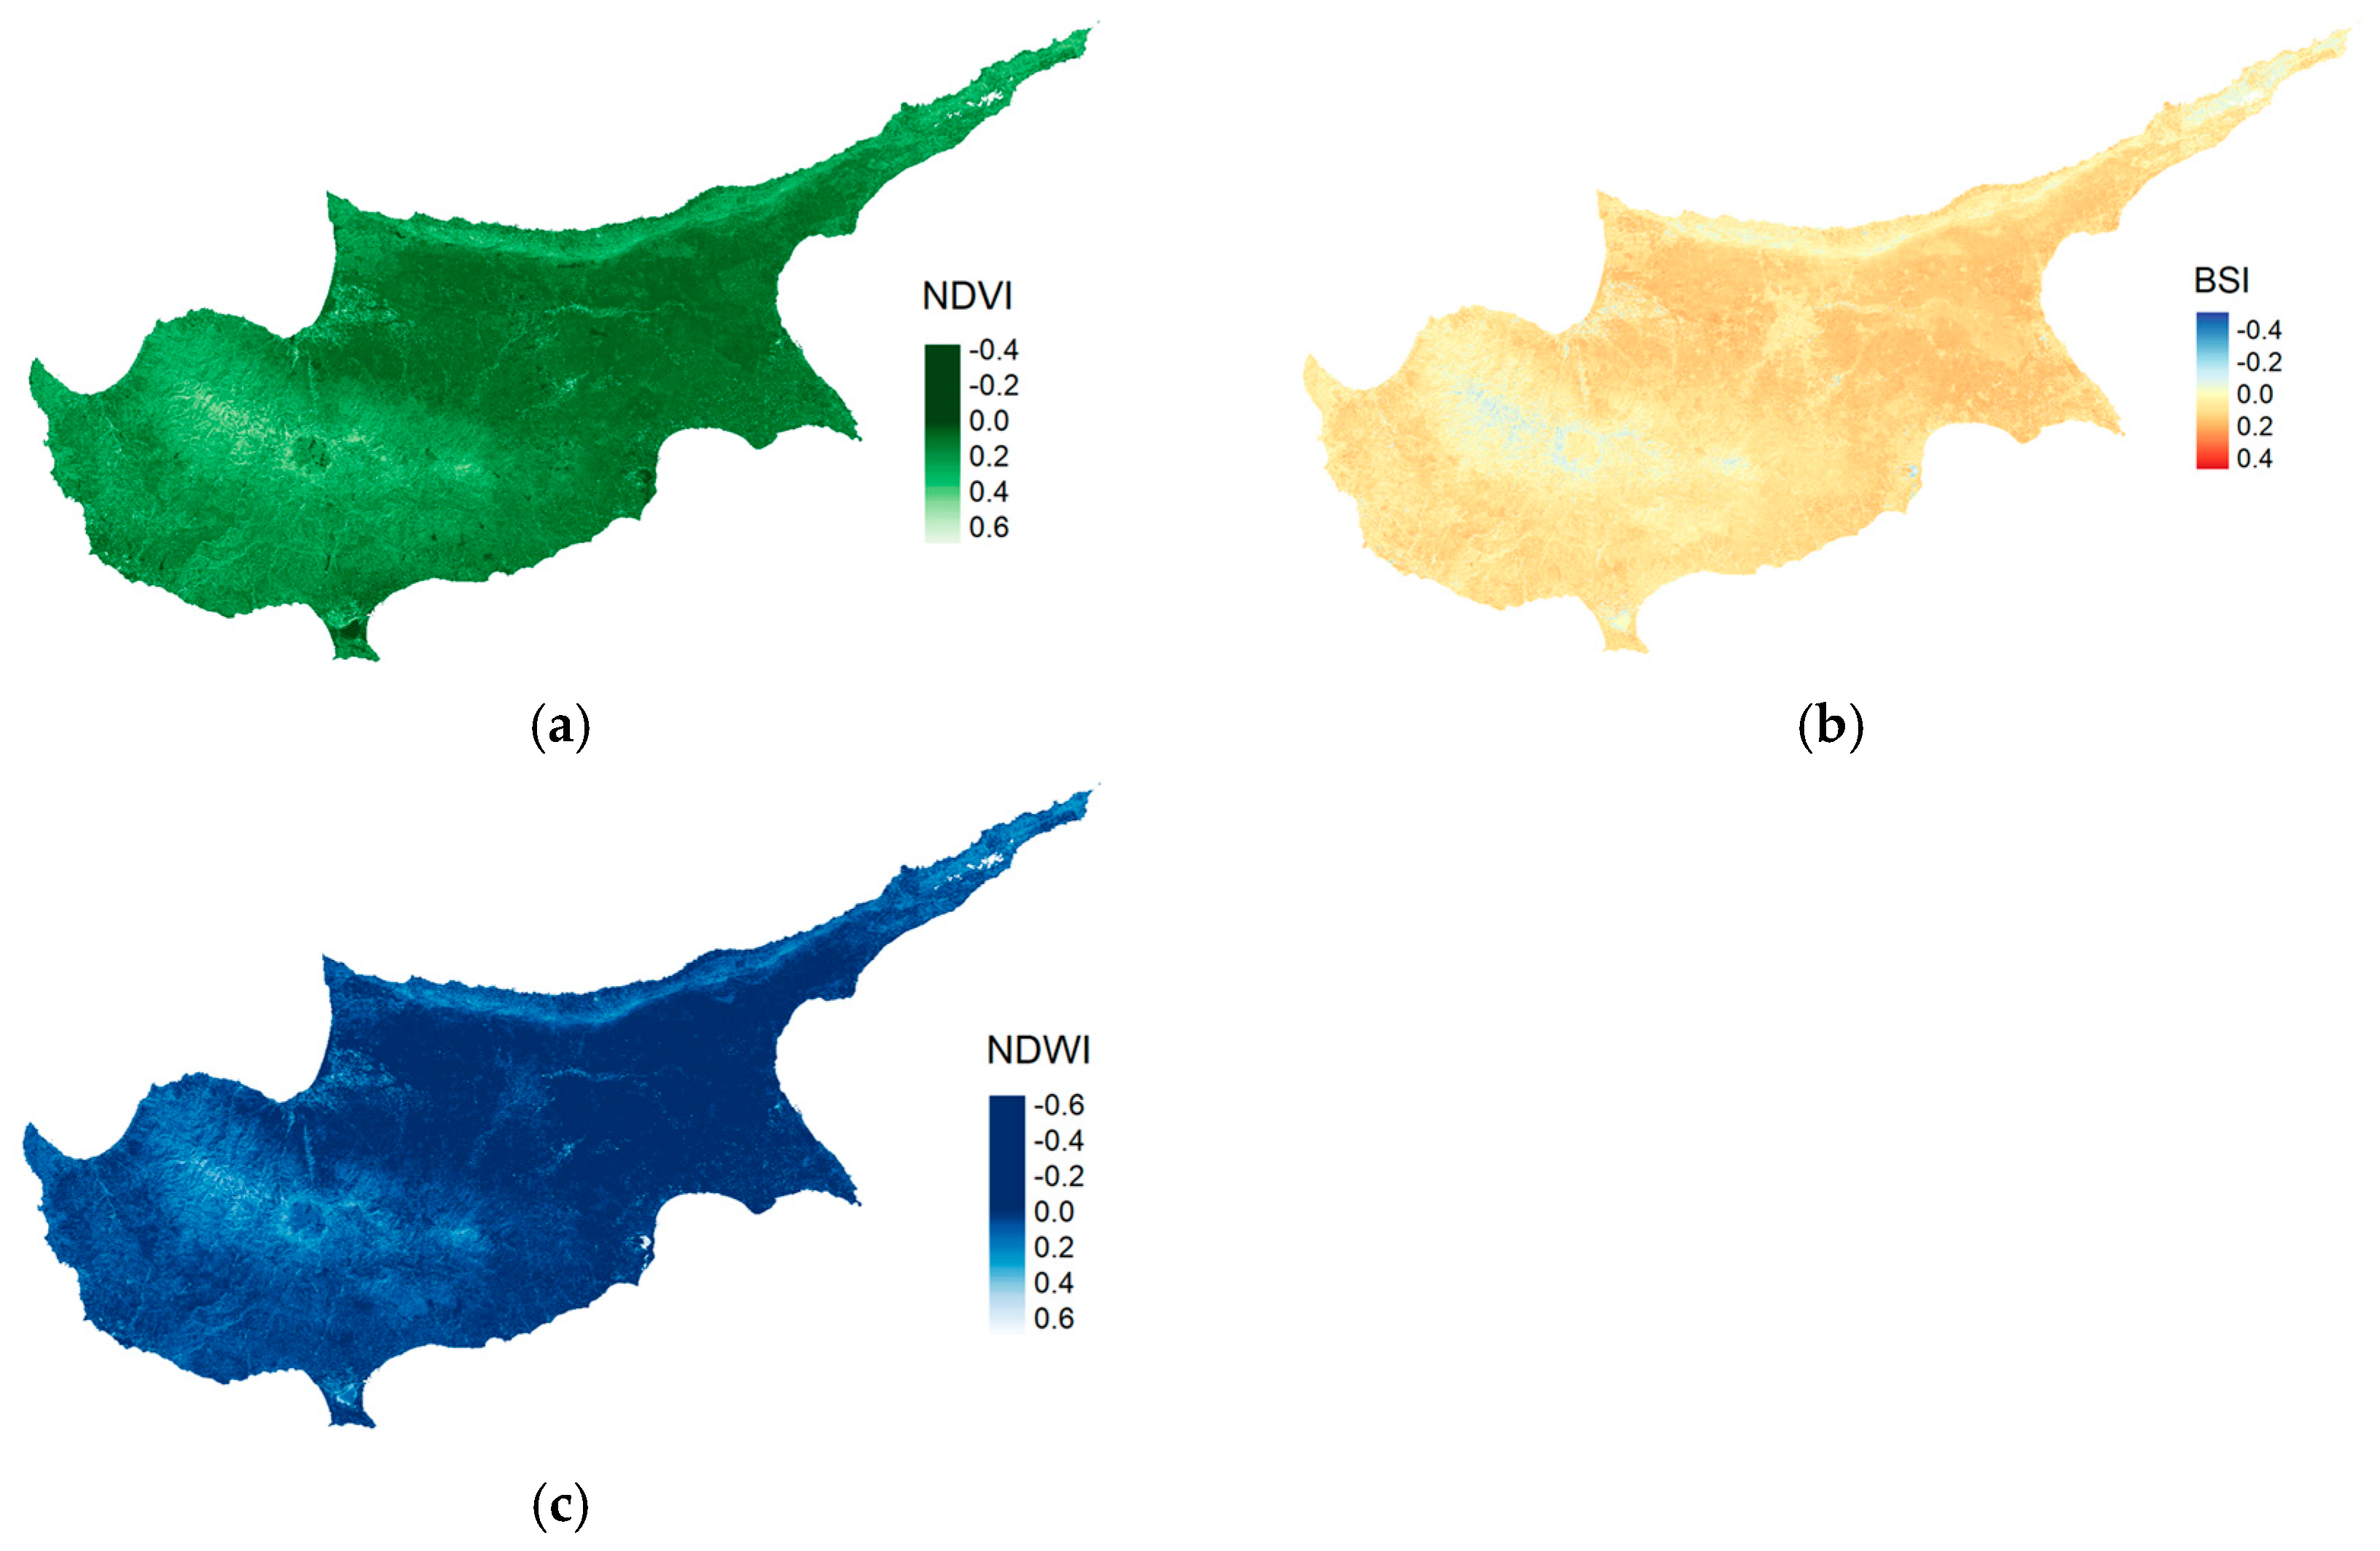
In order to investigate the spatial patterns of soil-related environmental conditions across Cyprus, a series of remote sensing-based and terrain-derived variables were analyzed (Figure 6). These results offer key insights into vegetation productivity, soil exposure, moisture availability, and topographic variability, each of which plays a critical role in soil health dynamics. The NDVI illustrates vigorous vegetative activity across the forested northern and mountainous regions, with progressively lower values toward the south and coastal zones. These areas of low vegetation cover often coincide with more intensive land use and urban development, indicating regions potentially vulnerable to soil degradation. Complementing these observations, the BSI reveals higher values in cultivated lowlands and peri-urban landscapes, where vegetation is sparse and soil surfaces are more exposed. These zones are particularly relevant for erosion risk assessment and targeted conservation measures, given their susceptibility to soil loss and declining organic matter content. In parallel, the NDWI highlights the spatial variability of surface moisture conditions. Elevated NDWI values are concentrated in forested catchments, while arid interior and southern areas exhibit negative values, suggesting greater water stress and potentially limited soil moisture retention capacity.
Table 1 summarizes the validation performance of the spatial prediction models developed for ten key soil health descriptors, including macro- and micronutrients (N, P, and K), physicochemical properties (pH, EC, and CaCO3), and soil texture components (sand, silt, and clay), as well as SOC. The models demonstrated high predictive accuracy and consistency, with R2 values exceeding 0.90 for all variables, reaching a maximum of 0.946 for the SOC. Concordance values also remained robust (0.826–0.892), supporting the reliability of the predictions. The low RMSE and minimal bias observed across all models highlight the absence of systematic over- or underestimation. Notably, most soil descriptors exhibited RPD values above the commonly accepted threshold of 2.0, indicating models of good to excellent predictive quality. Particularly strong performances were noted for CaCO3, sand, and SOC, all of which exceeded RPIQ values of 2.8, suggesting their suitability for downstream applications in spatial soil monitoring, land evaluation, and soil degradation assessments.
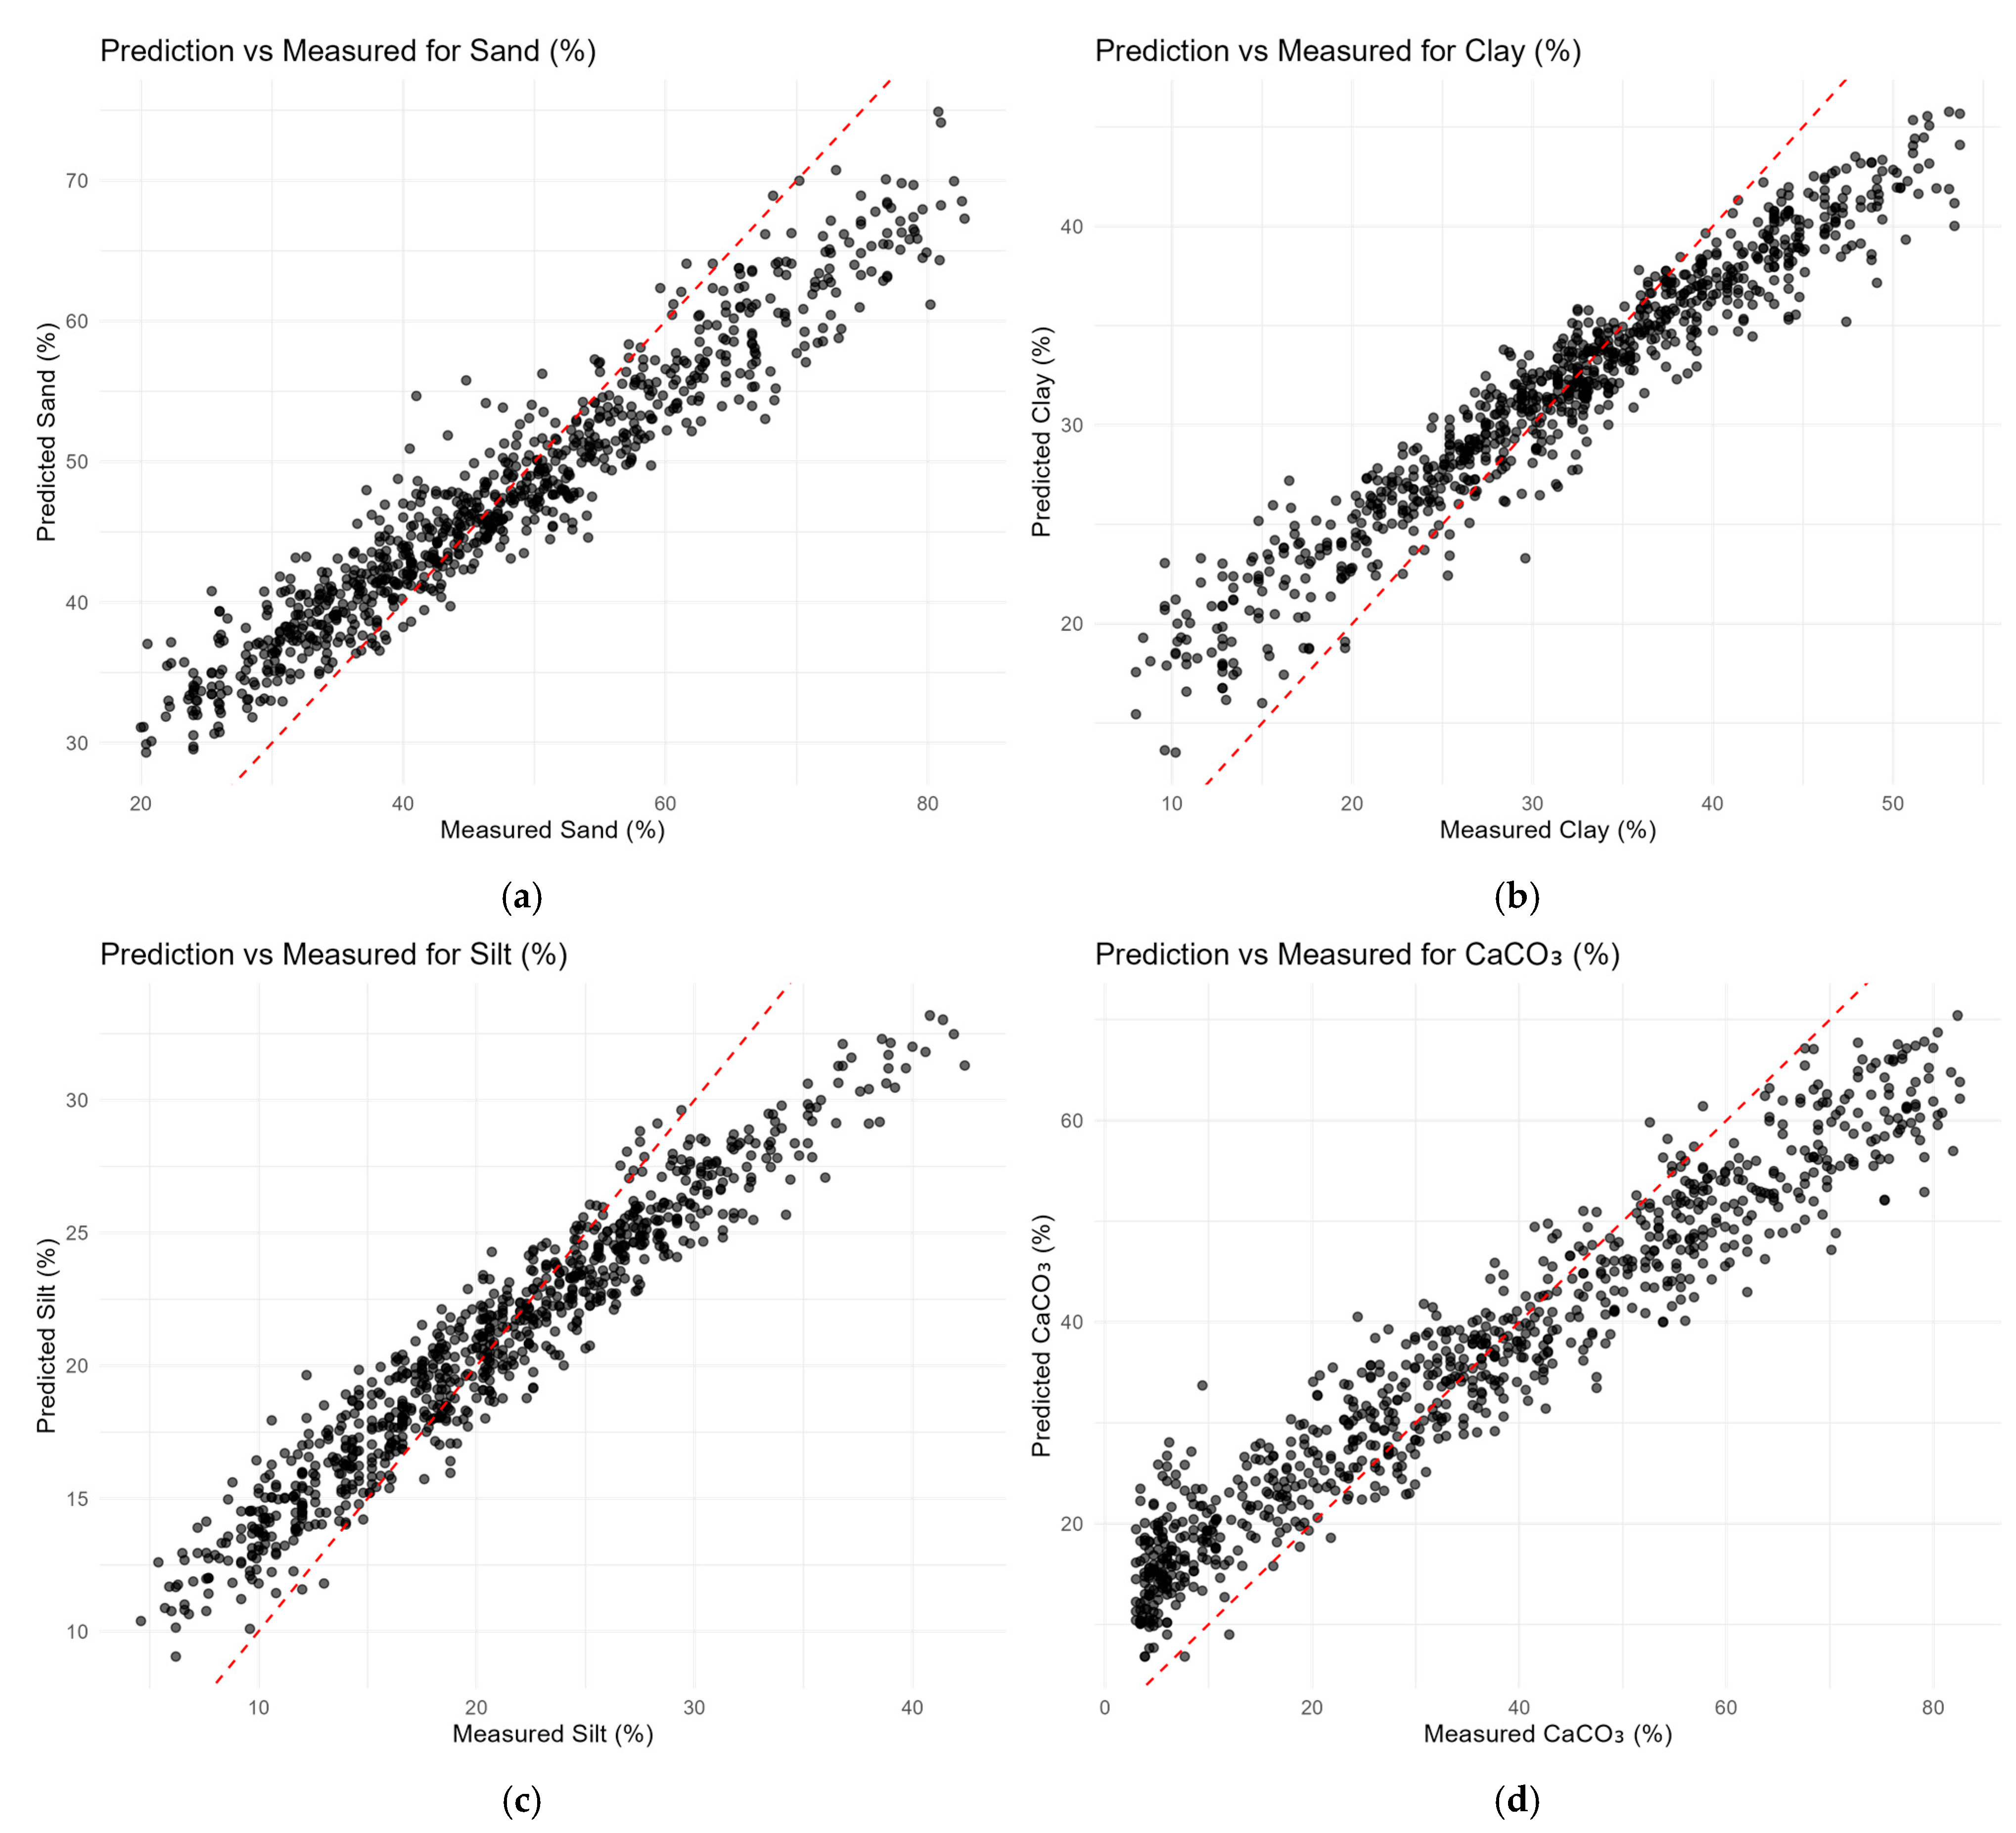
The graphical evaluation of model performance, as illustrated in Figure 7a–j, provides a robust visual confirmation of the predictive fidelity achieved across the suite of selected soil physicochemical properties. The predicted versus observed scatterplots, each including a 1:1 reference line, illustrate how closely the model estimates align with actual measurements, serving as a valuable tool for assessing regression accuracy and identifying error patterns. For the three particle size fractions, including sand (Figure 7a), clay (Figure 7b), and silt (Figure 7c), the models exhibit a coherent clustering along the 1:1 line, reflecting satisfactory predictive power in texture classification, a foundational determinant of soil hydraulic and fertility behavior. Although some dispersion is observed at the extremes of the sand, silt, and clay content distributions, the general patterns indicate minimal bias and a consistent capture of intra-range variability. CaCO3 (Figure 7d) and SOC (Figure 7e) present a strong linear relationship between predicted and observed values, suggesting that the models effectively capture mineral and organic soil components using reflectance data and terrain-derived variables. This is particularly relevant in Mediterranean semi-arid systems, where carbon fractions and carbonates play a critical role in pH buffering and aggregation.
The prediction of soil pH in Figure 7f demonstrates high reliability, with most points aligning closely with the 1:1 line, reflecting both the inherent stability of pH and the model’s sensitivity to subtle variations. However, predictions slightly underestimated values above 8.0 and overestimated values below 7.2, indicating minor discrepancies at the extremes of the observed range. Similarly, K (Figure 7g) and P (Figure 7h), both essential macronutrients which often display complex spatial distributions, are well predicted; nevertheless, minor scattering indicates the intrinsic heterogeneity and potential limitations in capturing their mobility and retention across depth gradients. Total nitrogen (N) predictions (Figure 7i) demonstrate a strong and consistent alignment with observed values, with the majority of points clustered closely around the 1:1 reference line. This pattern suggests the model’s robustness in capturing nitrogen distribution across the landscape, despite the inherent spatial variability and management sensitivity of this parameter. The distribution of residuals remains relatively constrained, indicating limited systemic over- or underestimation across the predicted range. However, some deviations are observed at the higher end of the nitrogen concentration spectrum (above approximately 0.3 percent), where the model tends to underestimate measured values slightly. Overall, EC predictions (Figure 7j) present good agreement with observed values, demonstrating the model’s sensitivity to spatial patterns of soil salinity, which is a key stressor in Mediterranean agroecosystems. However, the model slightly underestimates EC values exceeding 1.2 dS/m, suggesting reduced accuracy in capturing extreme salinization levels. This limitation may be due to a scarcity of high-EC samples or the influence of localized management practices.
Together, these visual diagnostics complement the quantitative metrics presented in Table 1 (R2, RMSE, MAE), demonstrating that the models yield statistically strong outcomes and also maintain reliable performance across the range of field conditions and soil properties evaluated. Notably, the lack of systematic under- or overestimation across most variables indicates well-calibrated generalization, confirming the suitability of the selected predictors and ML algorithms for high-resolution digital soil mapping in Cyprus.
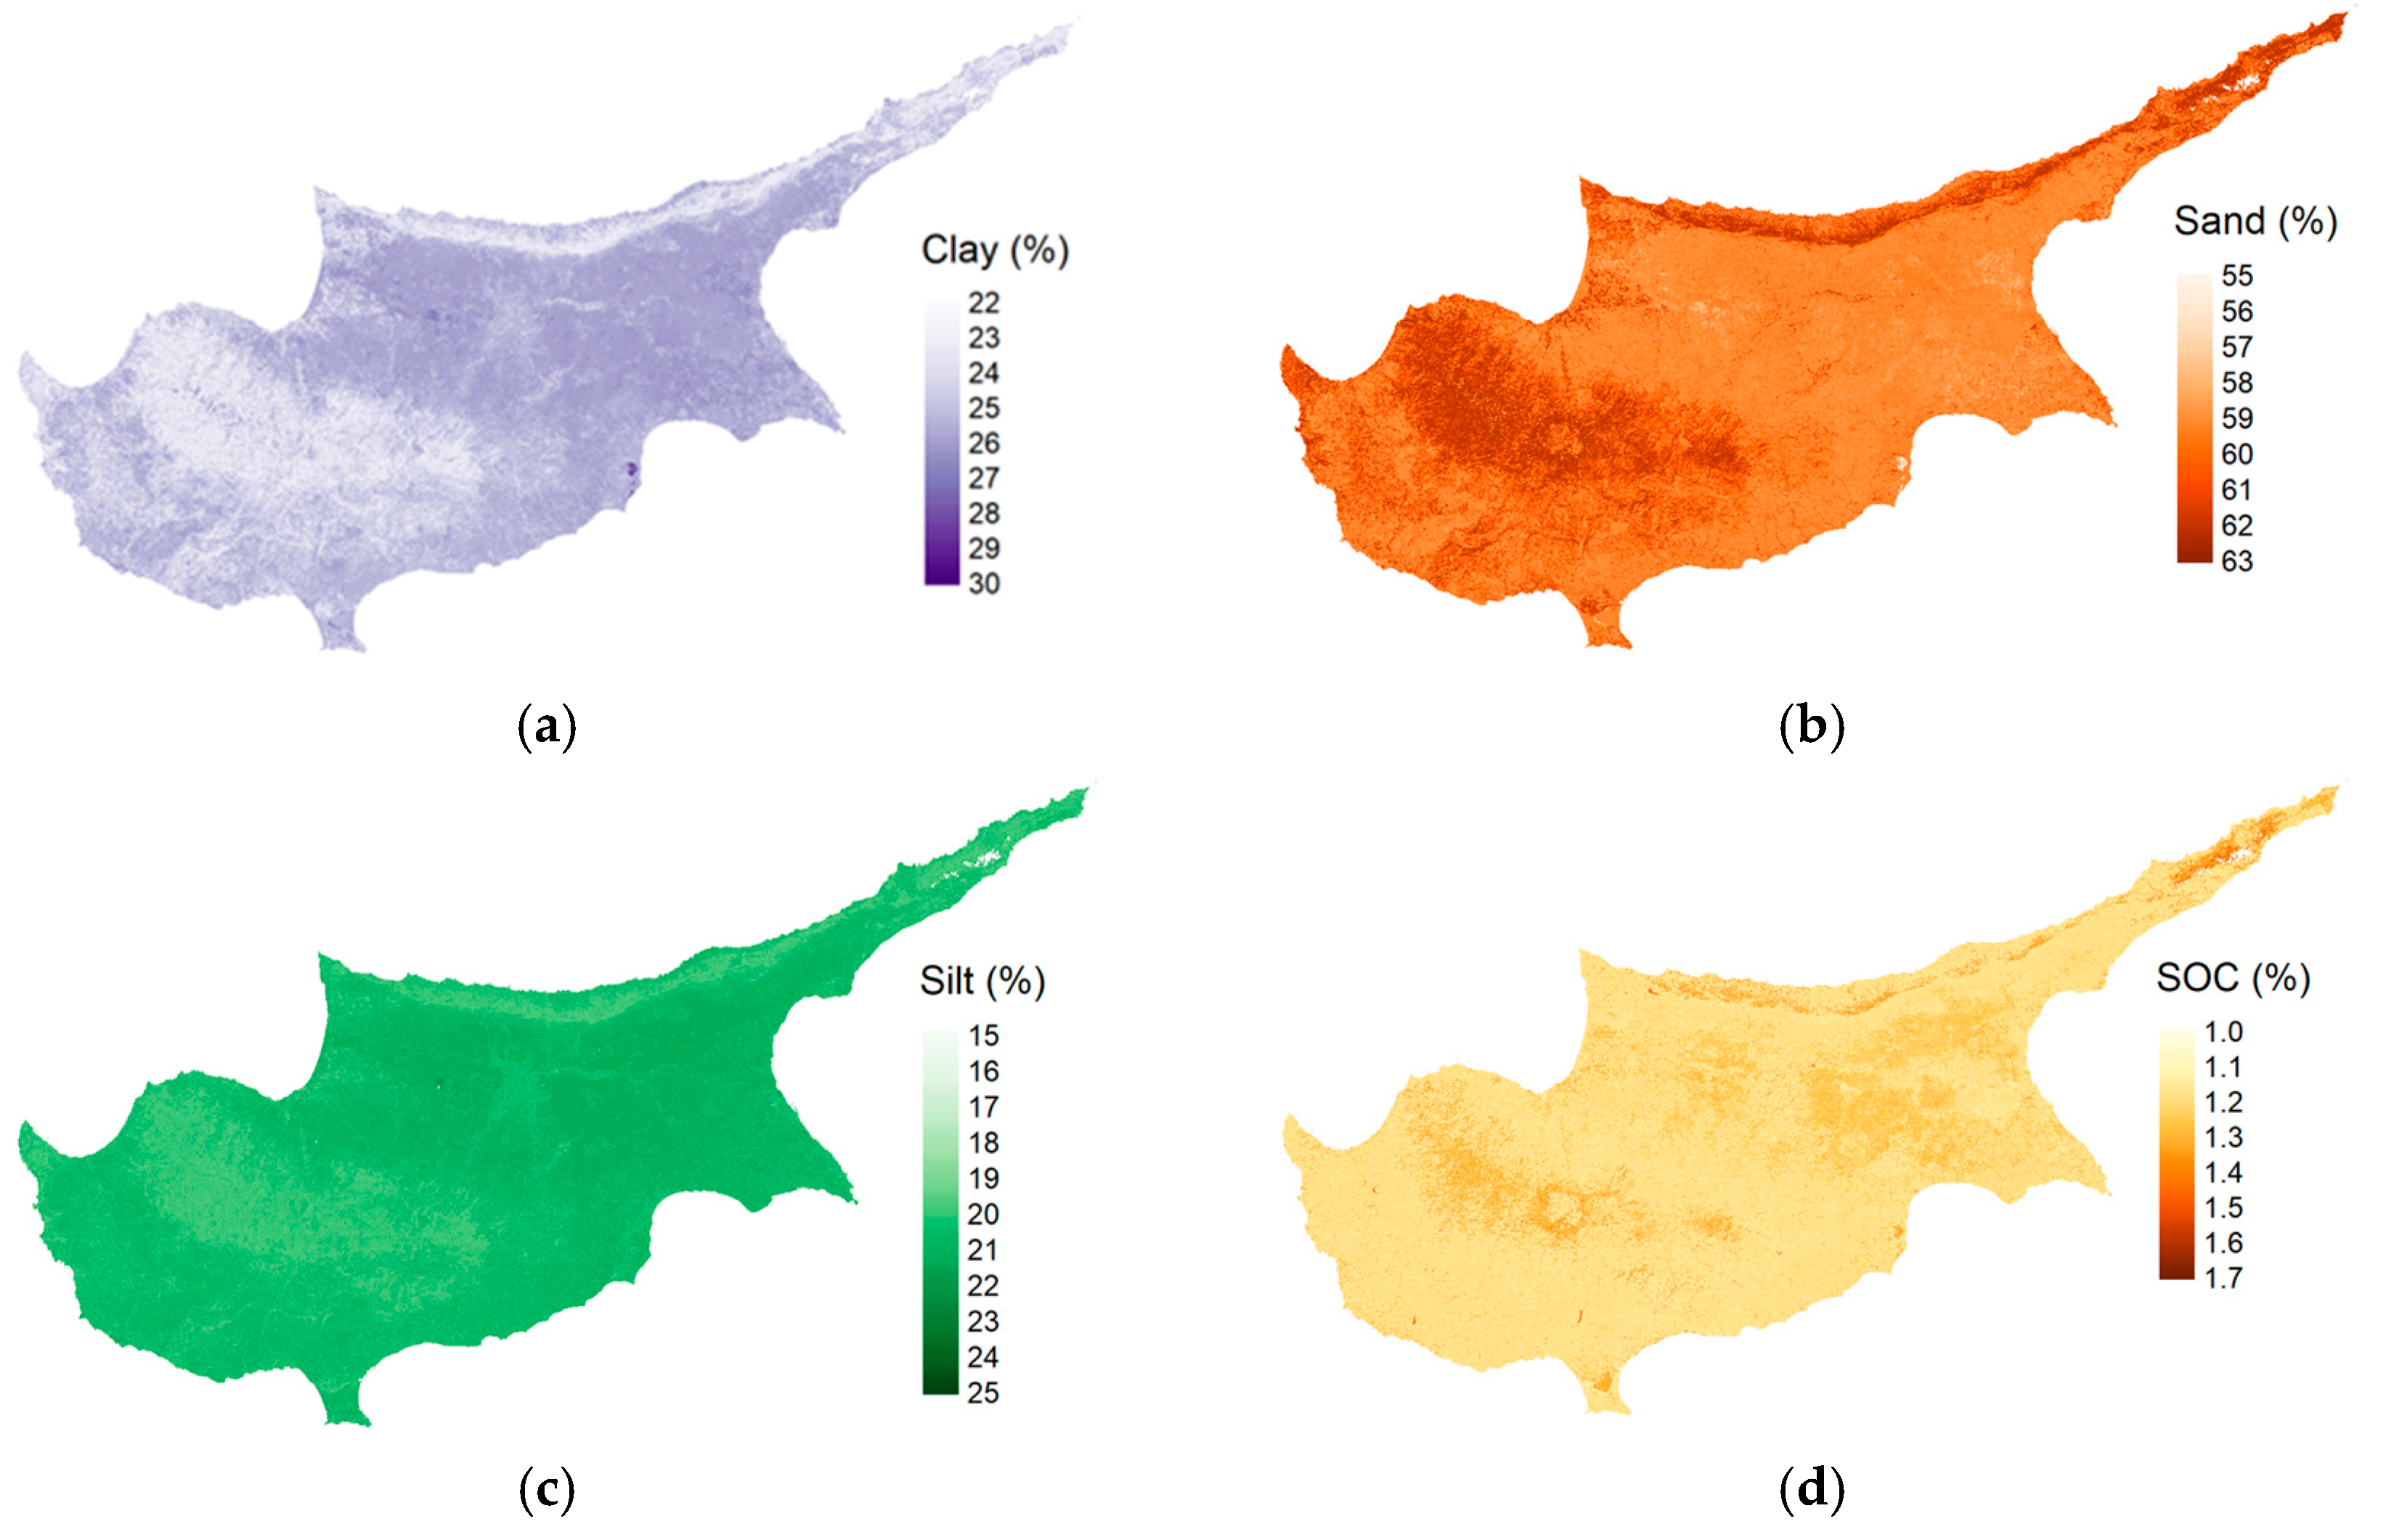
Building upon validated soil property prediction models and incorporating satellite-derived environmental variables, the resulting soil health indicator maps offer a spatially continuous representation of key soil attributes across the entire island of Cyprus. These maps enable the visualization of complex spatial patterns that would otherwise remain undetected through point-based sampling alone. The clay content distribution (Figure 8a) exhibits moderate levels predominantly across central and southern inland areas, whereas the sand content (Figure 8b) is consistently higher in the eastern and southeastern coastal regions, indicating lighter-textured soils. In contrast, the silt content (Figure 8c) exhibits a more homogeneous distribution, with slightly elevated values in the northern and coastal zones, potentially linked to sedimentary deposition processes. The spatial variability of SOC (Figure 8d) corresponds well with vegetative cover and land use intensity, with higher concentrations observed in the mountainous, forested, and semi-natural landscapes, reflecting reduced anthropogenic disturbance and enhanced organic matter accumulation.
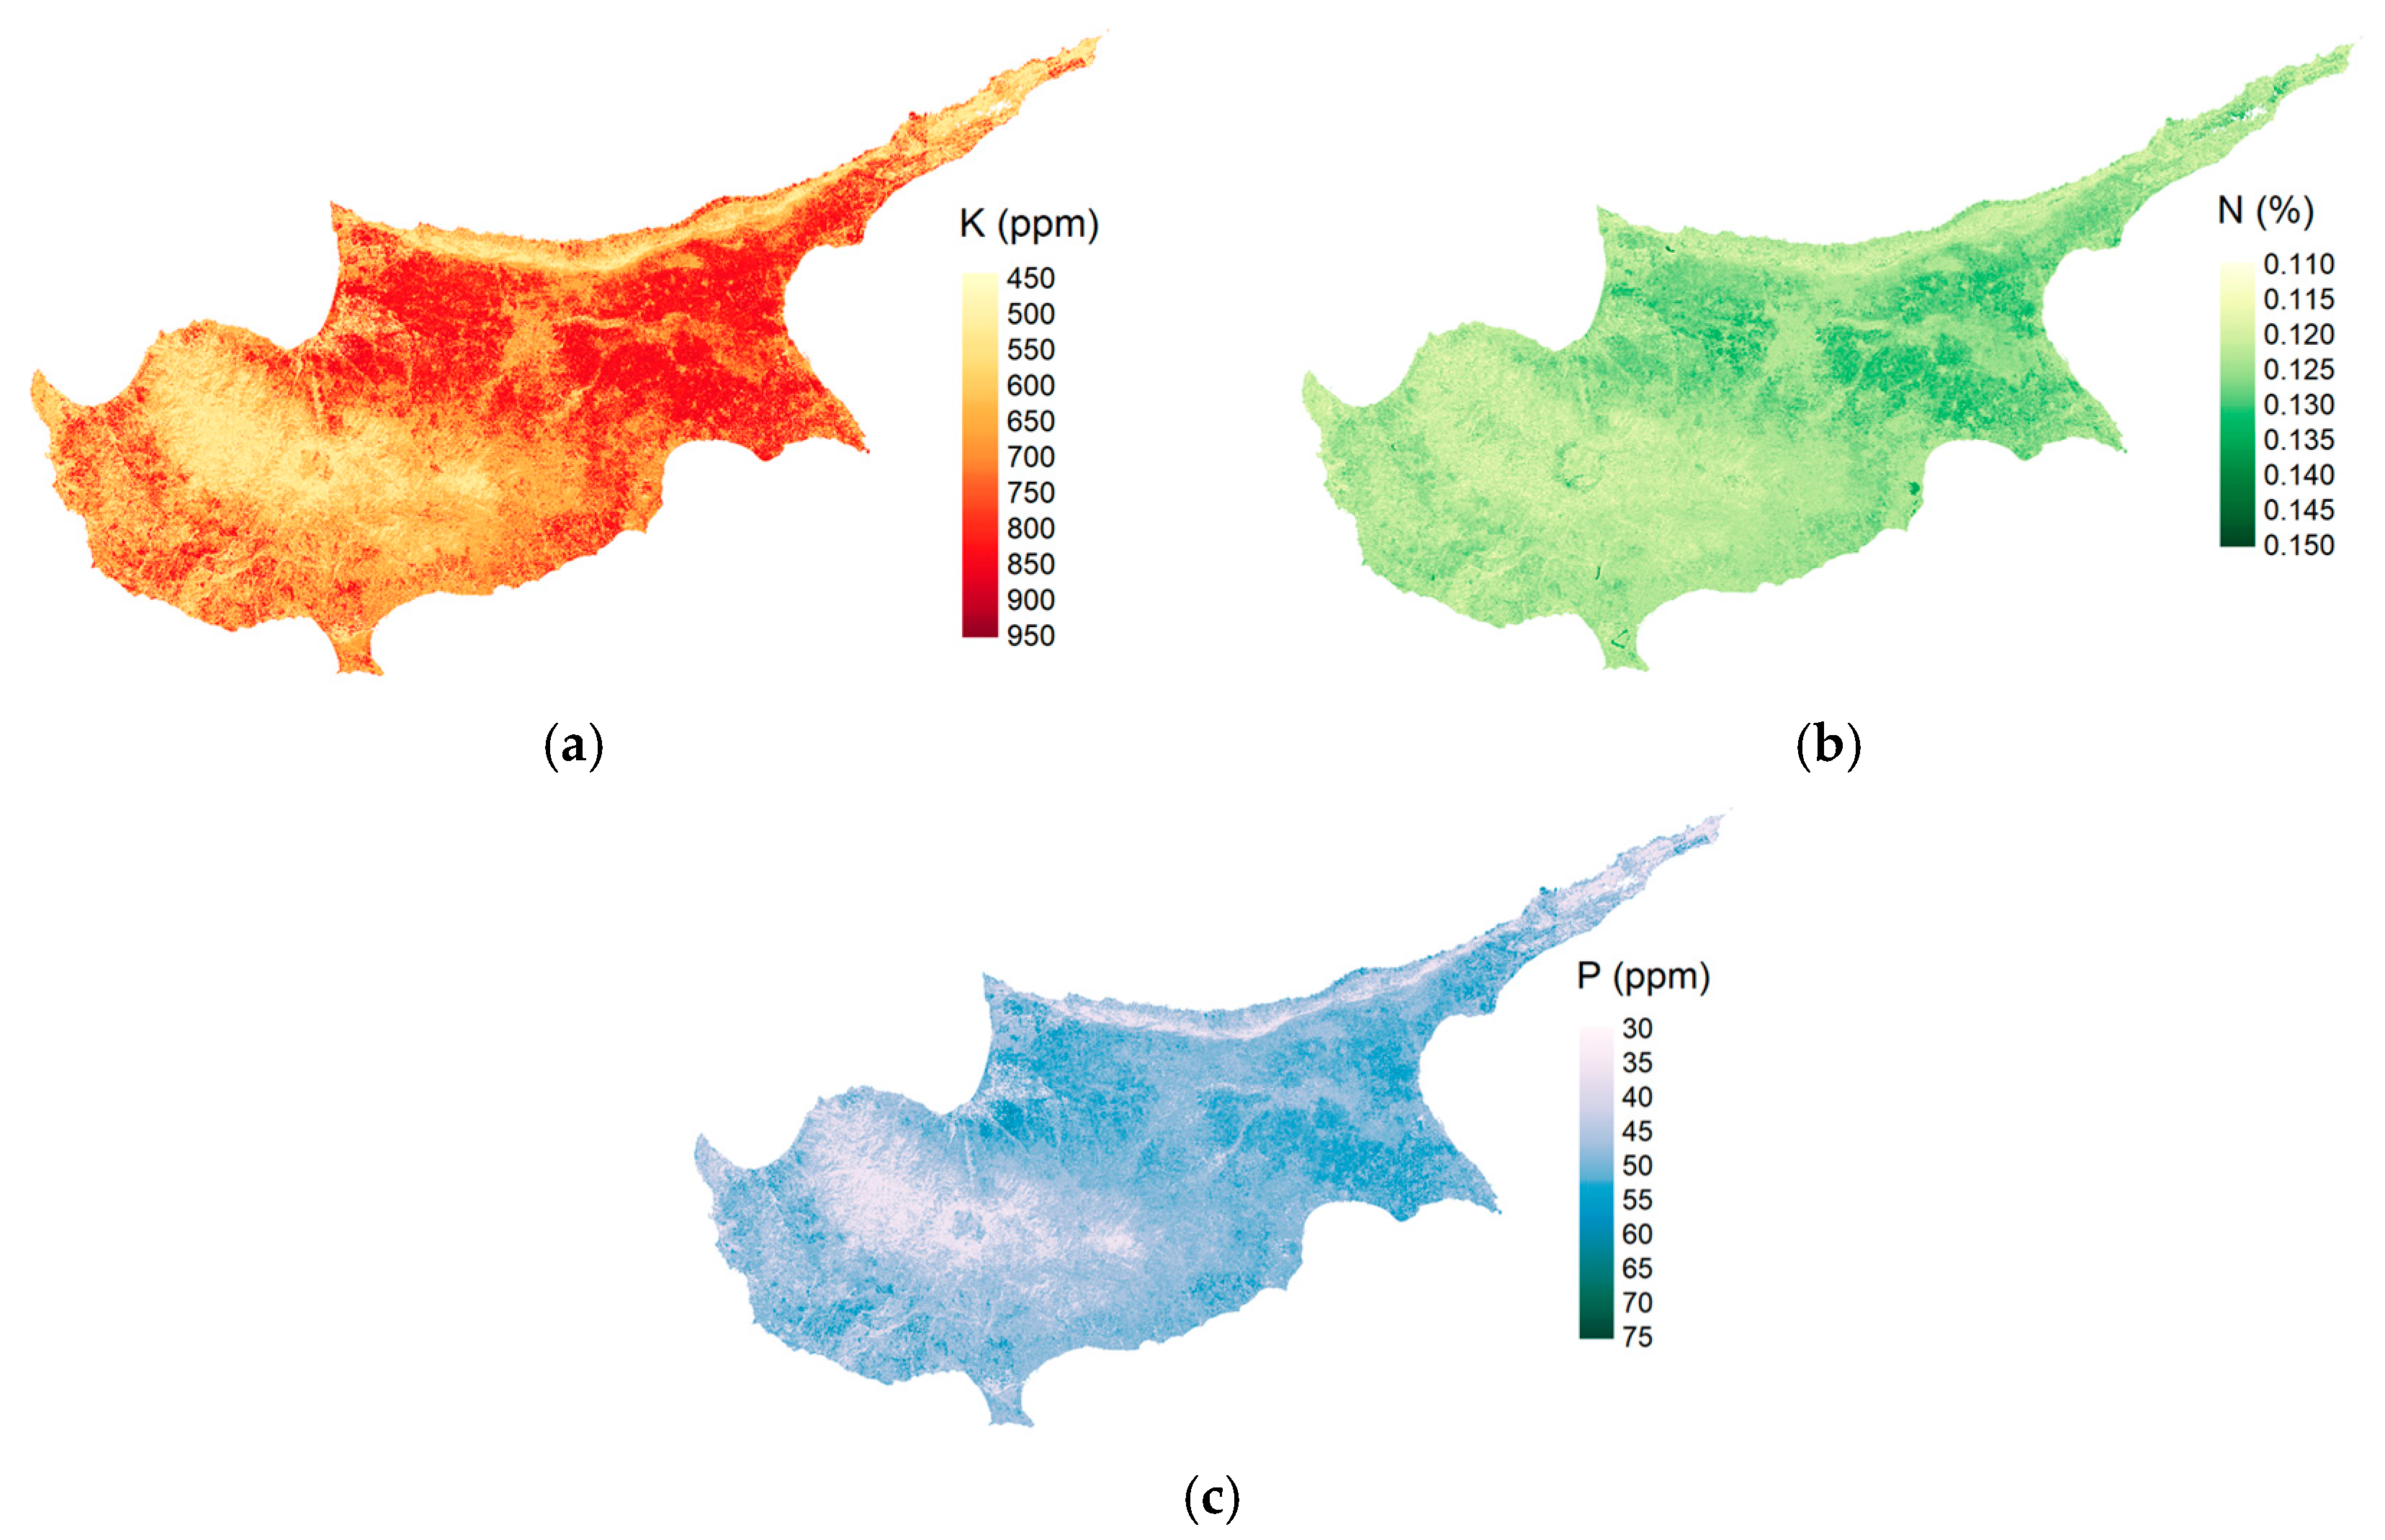
Nutrient-related spatial predictions provide an additional layer of understanding of soil health dynamics across Cyprus. The spatial distribution of K (Figure 9a) reveals high concentrations in the eastern and southeastern regions, likely due to lithological variability and intensive agricultural activity. N levels (Figure 9b) appear relatively uniform across Cyprus, with modest increases in regions with denser vegetation or organic inputs. P availability (Figure 9c) displays greater spatial heterogeneity, with higher values concentrated in agricultural areas, likely due to repeated fertilizer application over time. These nutrient distribution patterns are critical for assessing site-specific fertility status and can inform precision nutrient management strategies that promote sustainable agricultural intensification while reducing the risk of nutrient loss or environmental degradation.
To broaden the assessment of soil health, the final set of modeled indicators offers a detailed view of important physicochemical properties that influence land productivity and ecosystem function. Localized areas of elevated salinity are evident in the EC map (Figure 10a), particularly in the southern and eastern lowlands, likely due to intensive irrigation and insufficient leaching. The soil pH distribution (Figure 10b) is relatively uniform across the landscape, with slight variations influenced by calcareous parent materials and historical land use. The CaCO3 map (Figure 10c) closely reflects the underlying lithology, with higher concentrations found in sedimentary areas, especially in the northern and eastern parts of the island. Such geospatial information is essential for identifying vulnerable areas and developing targeted approaches to soil conservation and land management.
Collectively, the high-resolution spatial predictions generated for key soil properties underscore the robustness and applicability of the modeling framework in capturing the variability across Cyprus. The consistency observed among multiple characteristics and soil health descriptors reflects strong predictive performance and spatial coherence, offering a solid basis for data-driven decision-making. These findings lay the groundwork for a more comprehensive interpretation of their broader implications, as examined in the upcoming discussion.

4. Discussion

High-resolution spatial predictions reveal diverse and interrelated soil characteristics across Cyprus, offering critical insights into landscape functionality and land use pressures. The observed textural composition, characterized by moderate clay concentrations in central valleys and southern foothills, a dominant sand content in eastern and coastal zones, and relatively uniform silt coverage, suggests that geomorphological structuring is a key driver of physical soil heterogeneity [47,51,52]. These variations closely align with known lithological formations and historical sediment deposition processes [53]. SOC distribution shows elevated values in forested and mountainous regions, particularly the Troodos range, where limited disturbance and denser vegetation contribute to higher soil organic matter accumulation. This spatial pattern is consistent with expected ecological trends and supports the role of land cover and management in shaping organic carbon retention. Conversely, intensively cultivated areas tend to exhibit lower SOC concentrations, reflecting biomass export and soil disturbance from conventional practices, with only localized instances of improved SOC levels likely resulting from conservation-oriented or mixed-use systems.
The chemical fertility parameters further deepen this understanding. Phosphorus exhibits higher concentrations in irrigated and fertilized croplands, particularly in eastern and southeastern districts, indicating a strong anthropogenic influence. Potassium distribution is more spatially diffused, driven by variations in parent material and long-term fertilization history. Nitrogen predictions reflect moderate spatial variability, with slightly elevated levels in actively managed agricultural zones. It is evident from the EC map that higher conductivity values are found in areas known to face salinization pressures due to irrigation, evaporation, and poor drainage. This aligns with degradation trends observed in many Mediterranean agricultural systems [54,55]. The slightly alkaline pH across much of the island is characteristic of carbonate-rich parent material and arid to semi-arid climatic conditions, although micro variations relate to fertilization and land management history. CaCO3 concentrations reflect geological influences, with high levels primarily found in calcareous soils, predominantly in northern and central Cyprus.
From a broader perspective, the spatial alignment of these predictions reveals individual soil patterns and also enables the synthesis of soil health dynamics. Areas with reduced SOC are frequently associated with intensively cultivated croplands, where continuous tillage, limited crop rotation, and insufficient organic matter inputs contribute to accelerated carbon depletion [56,57]. This spatial pattern reflects the persistent pressures exerted by conventional agricultural practices, which compromise soil structure and biological activity, reducing long-term soil productivity and resilience. Similarly, the co-existence of high EC and P concentrations in certain districts suggests combined salinization and nutrient accumulation, resulting from over-irrigation and excessive fertilization [58]. These intersecting patterns highlight critical land zones where soil degradation processes are actively co-occurring, necessitating the development of integrated management strategies to address this issue. Moreover, the results reveal both expected outcomes, such as higher SOC in forested zones, and less expected signals, such as moderate nutrient retention in some cultivated lands that may be undergoing a shift toward more sustainable practices. This mosaic of conditions underscores the importance of site-specific monitoring and the limitations of treating agroecosystems across Cyprus as homogeneous units. The complex interplay of chemical and structural degradation signals underscores the need for integrated soil health assessments that transcend isolated indicators and capture the multifaceted nature of agroecosystem decline and recovery.
Only a limited number of studies have produced spatially explicit assessments of soil conditions at a national scale for Cyprus. A focused comparison with the work of Ballabio et al. [29], which presented a national-scale map of topsoil SOC for Cyprus, confirms the reliability of the spatial patterns predicted in this study. Elevated SOC concentrations were consistently identified in the Troodos mountain range and other forested or minimally disturbed areas, whereas lower levels were evident in intensively cultivated zones. This agreement reinforces the credibility of the modeling framework and reflects the influence of vegetation cover and land management on soil organic matter dynamics. However, in contrast to the single-variable scope of Ballabio et al. [29], the present study extends predictive capability to a broader set of physicochemical soil descriptors, including texture fractions, pH, macronutrients, and EC. These additional variables enable a more integrated interpretation of soil functionality and degradation risk across Cyprus. It must also be noted that, similarly to Ballabio et al. [29], the input data used in this study are limited to the territory of the Republic of Cyprus. As a result, predictions for the northeastern part of the island carry a higher degree of uncertainty due to the absence of ground reference data in that region. A conceptual alignment can also be observed between this study and the findings of Sommer et al. [11], who introduced a Land Multi-degradation Index (LMI) to quantify the co-occurrence of multiple degradation processes across Europe. The spatial distribution of LMI values in Cyprus, particularly in arable regions, corresponds closely to areas identified in this study as having low SOC, nutrient imbalances, and salinity risks. This overlap reinforces the notion that these parameters serve as key indicators of soil degradation, highlighting their diagnostic value for multi-risk soil health assessments [11].
Crucially, the predicted variables and observed spatial patterns can be directly linked to soil health descriptors and degradation indicators. Several predicted maps, for example, SOC, EC, and pH, provide direct insight into degradation processes such as organic carbon loss, soil salinization risk, and nutrient imbalance. Areas with low SOC coincide with zones vulnerable to carbon depletion due to intensive cultivation and insufficient organic inputs [59,60], while elevated EC values in irrigated lands highlight potential secondary salinization hotspots resulting from prolonged fertilization, poor drainage, and high evapotranspiration rates [61,62]. In this way, the presented maps not only address the EU soil health monitoring priorities but also serve as spatially explicit proxies for degradation risk assessment, in alignment with the policy targets of the EU Soil Strategy for 2030.
The above-mentioned findings establish a scientifically sound and policy-relevant foundation for spatially targeted soil management. The granularity of the predictions enables stakeholders to transition from generalized regional plans to precise site-level interventions, whether for reducing nutrient runoff, restoring organic carbon, and/or addressing salinization risk in vulnerable irrigated zones. This is especially crucial in Mediterranean landscapes, such as Cyprus, where water scarcity, land fragmentation, and climate change pressure exacerbate soil vulnerability [63,64]. By operationalizing key soil health descriptors at high resolution, the study bridges scientific modeling with practical land use planning, contributing to ongoing efforts that support the forthcoming Soil Monitoring Law. Nevertheless, these advances highlight the pressing need for additional systematic soil sampling and the establishment of a harmonization framework to ensure long-term consistency, comparability, and integration of soil data across scales.

5. Implications, Caveats, and Future Work

The outputs of this study provide actionable knowledge for policy makers, land managers, and researchers seeking to implement sustainable soil and land use practices in Cyprus. Its predictive outputs, anchored in observed relationships between land use and soil health descriptors, can guide site-specific strategies to improve soil functionality and prevent degradation.
However, certain limitations must be acknowledged. The underlying training data were geographically constrained to the territory of the Republic of Cyprus, limiting predictive certainty in the northeastern part of the island where no reference samples were available. Moreover, some soil properties, such as nitrogen and phosphorus content, which exhibit high spatial variability, may require more systematic sampling and regionally calibrated models to enhance predictive accuracy. The reliance on surface reflectance data may also limit the depth specificity of certain predictions, particularly where subsurface processes are more dominant.
Additionally, although this study leveraged Sentinel-2 imagery for high-resolution soil predictions, the analysis was based on a single median composite per sample point, extracted within a ± 1-month window around the date of sampling. This approach ensured temporal consistency between satellite data and ground observations but represents a static snapshot of surface conditions. As a result, the models may not fully capture temporal variability in soil properties related to seasonal dynamics, land use change, or climate-driven processes. Future work should explore the integration of multi-temporal (time-series) Sentinel-2 data, such as seasonal or annual composites or phenological metrics, to account for changes in vegetation, moisture, and management practices over time. This could enhance model robustness and enable the prediction of temporal trends in soil degradation and recovery, especially under shifting land use and climate conditions.
Future work should prioritize the expansion of systematic soil sampling campaigns, especially in ecologically sensitive or data-poor areas. Emphasis should be placed on developing harmonized protocols for data integration and quality control, ensuring alignment with both national strategies and European soil information platforms. Building on these protocols, existing datasets from past and ongoing initiatives could then be effectively leveraged to strengthen model validation and enrich spatial coverage. In parallel, the integration of a broader range of soil health descriptors would enhance the comprehensiveness and diagnostic strength of spatial evaluations. Additionally, the use of temporal dynamics from multi-year satellite observations and scenario-based modeling can support assessments of soil responses to land use or climate-driven changes. In this context, machine learning offers a robust analytical framework for capturing complex soil–landscape interactions, and its continued methodological advancement and application are anticipated to significantly enhance the precision, scalability, and policy relevance of soil monitoring and management systems in Cyprus and beyond. These advancements are critical for enabling Cyprus to fully participate in EU and global soil research and innovation frameworks, moving beyond its current status as a gray area with limited baseline data and contributing meaningfully to Pan-European soil knowledge and governance. Based on the study’s findings, the following actionable recommendations are proposed:
Expand soil monitoring in areas identified as vulnerable to degradation, particularly in intensively cultivated zones.
Promote site-specific sustainable land management practices such as conservation tillage, organic amendments, and reduced input use.
Establish a centralized, harmonized national soil database to support long-term monitoring and integration with EU platforms.
Incorporate predictive soil maps into spatial planning, agri-environmental policy design, and restoration prioritization.
Integrate time-series Sentinel-2 data into future models to better account for temporal dynamics and climate-related shifts.

6. Conclusions

This study presents a comprehensive set of high-resolution prediction models for key soil health descriptors across Cyprus, integrating satellite-derived indicators with ground observations and applying machine learning methods. By predicting multiple soil attributes, including SOC, texture, pH, macronutrients, and EC, across the national territory, the analysis provides spatially explicit insights that support both scientific understanding and practical land management. The predicted patterns show firm agreement with previous Cyprus-focused studies and reflect known environmental drivers such as land use intensity, vegetation cover, and irrigation practices. Forested and semi-natural areas were associated with higher SOC and balanced nutrient levels, whereas intensively cultivated and irrigated lands exhibited increased EC and signs of nutrient imbalance. These spatial relationships underscore the influence of land use on soil health, particularly the role of vegetation cover and land management intensity in modulating key chemical indicators. The observed patterns emphasize the need for targeted, land use-specific management strategies to sustain soil functionality and mitigate degradation risks.
The capacity to identify areas at risk of salinization, organic matter loss, or nutrient imbalance enables stakeholders to implement more targeted and informed land management strategies. In addition, the modeling approach developed here offers a replicable methodology for other Mediterranean or data-limited regions facing similar environmental pressures, particularly where climate stress, land fragmentation, and water scarcity exacerbate soil degradation risks. Furthermore, the spatially explicit predictions of SOC provide valuable input to emerging frameworks for monitoring, reporting, and verification, supporting transparent tracking of carbon dynamics in soils in line with climate mitigation goals and sustainable land use commitments.
Further improvements will require more systematic sampling in underrepresented areas and better data harmonization to enhance model accuracy and long-term monitoring consistency.

Author Contributions

Conceptualization, I.V. and Z.P.; methodology, I.V. and Z.P.; software, I.V. and Z.P.; validation, I.V., Z.P., G.T., M.E., D.K., K.T. and D.O.; formal analysis, I.V. and Z.P.; investigation, I.V. and Z.P.; resources, I.V. and Z.P.; data curation, I.V., Z.P. and G.T.; writing—original draft preparation, I.V. and Z.P.; writing—review and editing, I.V., Z.P., G.T., M.E., D.K., D.O. and K.T.; visualization, I.V. and Z.P.; supervision, I.V.; project administration, K.T. and D.H.; funding acquisition, K.T. and D.H. All authors have read and agreed to the published version of the manuscript.

Funding

This work was funded through the EXCELSIOR Teaming project (Grant Agreement No. 857510, www.excelsior2020.eu, accessed on 16 August 2025), which has received funding from the European Union’s Horizon 2020 research and innovation programme, and from the Government of the Republic of Cyprus through the Directorate General for the European Programmes, Coordination and Development, as well as the Cyprus University of Technology.

Data Availability Statement

The original contributions presented in this study are included in the article. Further inquiries can be directed to the corresponding author.

Acknowledgments

1. The authors acknowledge the ‘EXCELSIOR’: ERATOSTHENES: Excellence Research Centre for Earth Surveillance and Space-Based Monitoring of the Environment H2020 Widespread Teaming project (www.excelsior2020.eu). The ‘EXCELSIOR’ project has received funding from the European Union’s Horizon 2020 research and innovation program under Grant Agreement No 857510, from the Government of the Republic of Cyprus through the Directorate General for the European Programmes, Coordination and Development and the Cyprus University of Technology. 2. The authors acknowledge the ‘GreenCarbonCY’: Transitioning to Green agriculture by assessing and mitigating Carbon emissions from agricultural soils in Cyprus. The GreenCarbonCy project has received funding from the European Union—Next Generation, the Recovery and Resilience Plan “Cyprus_tomorrow”, and the Research & Innovation Foundation of Cyprus under the Restart 2016-2020 Program with contract number CODEVELOP-GT/0322/0023.

Conflicts of Interest

The authors declare no conflicts of interest.

References

  1. Oishy, M.N.; Shemonty, N.A.; Fatema, S.I.; Mahbub, S.; Mim, E.L.; Hasan Raisa, M.B.; Anik, A.H. Unravelling the effects of climate change on the soil-plant-atmosphere interactions: A critical review. Soil Environ. Health 2025, 3, 100130. [Google Scholar] [CrossRef]
  2. Bilyera, N.; Turner, B.L.; Zhang, X.; Zang, H.; Dorodnikov, M.; Kuzyakov, Y. Soil Health Under Global Change and Human Impact. Land Degrad. Dev. 2025, 36, 683–688. [Google Scholar] [CrossRef]
  3. European Commission: Directorate-General for Research and Innovation; Veerman, C.; Pinto Correia, T.; Bastioli, C.; Biro, B.; Bouma, J.; Cienciala, E.; Emmett, B.; Frison, E.A.; Grand, A.; et al. Caring for Soil is Caring for Life—Ensure 75% of Soils are Healthy by 2030 for Food, People, Nature and Climate—Report of the Mission Board for Soil Health and Food; Publications Office: Luxembourg, 2020. [Google Scholar]
  4. Panagos, P.; Montanarella, L.; Barbero, M.; Schneegans, A.; Aguglia, L.; Jones, A. Soil priorities in the European Union. Geoderma Reg. 2022, 29, e00510. [Google Scholar] [CrossRef]
  5. Ronchi, S.; Salata, S.; Arcidiacono, A.; Piroli, E.; Montanarella, L. Policy instruments for soil protection among the EU member states: A comparative analysis. Land Use Policy 2019, 82, 763–780. [Google Scholar] [CrossRef]
  6. Broothaerts, N.; Breure, T.; Belitrandi, D.; Havenga, C.; Peeters, B.; Probst, C.; Barbero, M.; Panagos, P.; Jones, A. EU Soil Strategy Actions Tracker—A Tool to Track the Actions Listed in the EU Soil Strategy for 2030; Publications Office of the European Union: Luxembourg, 2025. [Google Scholar]
  7. Panagos, P.; Jones, A.; Lugato, E.; Ballabio, C. A Soil Monitoring Law for Europe. Glob. Chall. 2025, 9, 2400336. [Google Scholar] [CrossRef]
  8. Savarese, G.; Falconi, M. EU Soil Strategy for 2030: A Focus on Contaminated Sites and the Case of Italy. In Biodiversity Laws, Policies and Science in Europe, the United States and China; Antonelli, G., Qin, T., Ferroni, M.V., Erwin, A., Eds.; Springer Nature: Cham, Switzerland, 2024; pp. 151–170. [Google Scholar]
  9. European Environment Agency; Arias-Navarro, C.; Baritz, R.; Jones, A. The State of Soils in Europe—Fully Evidenced, Spatially Organised Assessment of the Pressures Driving Soil Degradation; Publications Office of the European Union: Luxembourg, 2024. [Google Scholar]
  10. Koumoulidis, D.; Varvaris, I.; Hadjimitsis, D.; Gabriele, M.; Brumana, R.; Gitas, I.; Georgopoulos, N.; Abdollahnejad, A.; Gkounti, E.; Stavrakoudis, D.; et al. Profiling Land Use Planning: Legislative Structures in Five European Nations. Land 2025, 14, 1261. [Google Scholar] [CrossRef]
  11. Prăvălie, R.; Borrelli, P.; Panagos, P.; Ballabio, C.; Lugato, E.; Chappell, A.; Miguez-Macho, G.; Maggi, F.; Peng, J.; Niculiță, M.; et al. A unifying modelling of multiple land degradation pathways in Europe. Nat. Commun. 2024, 15, 3862. [Google Scholar] [CrossRef]
  12. Bünemann, E.K.; Bongiorno, G.; Bai, Z.; Creamer, R.E.; De Deyn, G.; de Goede, R.; Fleskens, L.; Geissen, V.; Kuyper, T.W.; Mäder, P.; et al. Soil quality—A critical review. Soil Biol. Biochem. 2018, 120, 105–125. [Google Scholar] [CrossRef]
  13. Orgiazzi, A.; Ballabio, C.; Panagos, P.; Jones, A.; Fernández-Ugalde, O. LUCAS Soil, the largest expandable soil dataset for Europe: A review. Eur. J. Soil Sci. 2018, 69, 140–153. [Google Scholar] [CrossRef]
  14. Wangeci, A.; Adén, D.; Nikolajsen, T.; Greve, M.H.; Knadel, M. Comparing laser-induced breakdown spectroscopy and visible near-infrared spectroscopy for predicting soil properties: A pan-European study. Geoderma 2024, 444, 116865. [Google Scholar] [CrossRef]
  15. Panagos, P.; Broothaerts, N.; Ballabio, C.; Orgiazzi, A.; De Rosa, D.; Borrelli, P.; Liakos, L.; Vieira, D.; Van Eynde, E.; Arias Navarro, C.; et al. How the EU Soil Observatory is providing solid science for healthy soils. Eur. J. Soil Sci. 2024, 75, e13507. [Google Scholar] [CrossRef]
  16. Mäkipää, R.; Menichetti, L.; Martínez-García, E.; Törmänen, T.; Lehtonen, A. Is the organic carbon-to-clay ratio a reliable indicator of soil health? Geoderma 2024, 444, 116862. [Google Scholar] [CrossRef]
  17. Guo, M. Soil Health Assessment and Management: Recent Development in Science and Practices. Soil Syst. 2021, 5, 61. [Google Scholar] [CrossRef]
  18. Wood, S.A.; Bowman, M. Large-scale farmer-led experiment demonstrates positive impact of cover crops on multiple soil health indicators. Nat. Food 2021, 2, 97–103. [Google Scholar] [CrossRef]
  19. Zhang, J.; Dyck, M.; Quideau, S.A.; Norris, C.E. Assessment of soil health and identification of key soil health indicators for five long-term crop rotations with varying fertility management. Geoderma 2024, 443, 116836. [Google Scholar] [CrossRef]
  20. Cárceles Rodríguez, B.; Durán-Zuazo, V.H.; Soriano Rodríguez, M.; García-Tejero, I.F.; Gálvez Ruiz, B.; Cuadros Tavira, S. Conservation Agriculture as a Sustainable System for Soil Health: A Review. Soil Syst. 2022, 6, 87. [Google Scholar] [CrossRef]
  21. Lu, H.; Chen, X.; Ma, K.; Zhou, S.; Yi, J.; Qi, Y.; Hao, J.; Chen, F.; Wen, X. Soil health assessment under different soil and irrigation types in the agro-pastoral ecotone of northern China. CATENA 2024, 235, 107655. [Google Scholar] [CrossRef]
  22. Efthimiou, N.; Giotis, T.; Ragkos, A. Applications for Non-Conventional Water Resources in the Mediterranean Basin: A Literature Review. Sustainability 2025, 17, 4964. [Google Scholar] [CrossRef]
  23. Chrysargyris, A.; Xylia, P.; Litskas, V.; Mandoulaki, A.; Antoniou, D.; Boyias, T.; Stavrinides, M.; Tzortzakis, N. Drought stress and soil management practices in grapevines in Cyprus under the threat of climate change. J. Water Clim. Change 2018, 9, 703–714. [Google Scholar] [CrossRef]
  24. Sharma, D.K.; Singh, A. Current Trends and Emerging Challenges in Sustainable Management of Salt-Affected Soils: A Critical Appraisal. In Bioremediation of Salt Affected Soils: An Indian Perspective; Arora, S., Singh, A.K., Singh, Y.P., Eds.; Springer International Publishing: Cham, Switzerland, 2017; pp. 1–40. [Google Scholar]
  25. Phinikettou, V.; Papamichael, I.; Voukkali, I.; Economou, F.; Golia, E.E.; Navarro-Pedreño, J.; Barceló, D.; Naddeo, V.; Inglezakis, V.; Zorpas, A.A. Micro plastics mapping in the agricultural sector of Cyprus. J. Environ. Manag. 2024, 370, 122414. [Google Scholar] [CrossRef]
  26. Koumoulidis, D.; Varvaris, I.; Pittaki, Z.; Hadjimitsis, D. Sewage Sludge in Agricultural Lands: The Legislative Framework in EU-28. Sustainability 2024, 16, 10946. [Google Scholar] [CrossRef]
  27. Dalias, P.; Omirou, M.; Neocleous, D. Dataset on topsoil fertility characteristics in Cyprus. Data Brief 2025, 60, 111584. [Google Scholar] [CrossRef]
  28. Camera, C.; Zomeni, Z.; Noller, J.S.; Zissimos, A.M.; Christoforou, I.C.; Bruggeman, A. A high resolution map of soil types and physical properties for Cyprus: A digital soil mapping optimization. Geoderma 2017, 285, 35–49. [Google Scholar] [CrossRef]
  29. Cristiano, B.; Panos, P.; Luca, M. Predicting soil organic carbon content in Cyprus using remote sensing and Earth observation data. In Proceedings of the SPIE–International Society for Optical Engineering, San Francisco, CA, USA, 22–26 June 2014; p. 92290F. [Google Scholar]
  30. Feeney, C.J.; Bentley, L.; De Rosa, D.; Panagos, P.; Emmett, B.A.; Thomas, A.; Robinson, D.A. Benchmarking soil organic carbon (SOC) concentration provides more robust soil health assessment than the SOC/clay ratio at European scale. Sci. Total Environ. 2024, 951, 175642. [Google Scholar] [CrossRef] [PubMed]
  31. Panagos, P.; De Rosa, D.; Liakos, L.; Labouyrie, M.; Borrelli, P.; Ballabio, C. Soil bulk density assessment in Europe. Agric. Ecosyst. Environ. 2024, 364, 108907. [Google Scholar] [CrossRef]
  32. Yuzugullu, O.; Fajraoui, N.; Don, A.; Liebisch, F. Satellite-based soil organic carbon mapping on European soils using available datasets and support sampling. Sci. Remote Sens. 2024, 9, 100118. [Google Scholar] [CrossRef]
  33. Tziolas, N.; Tsakiridis, N.; Chabrillat, S.; Demattê, J.A.M.; Ben-Dor, E.; Gholizadeh, A.; Zalidis, G.; van Wesemael, B. Earth Observation Data-Driven Cropland Soil Monitoring: A Review. Remote Sens. 2021, 13, 4439. [Google Scholar] [CrossRef]
  34. Diaz-Gonzalez, F.A.; Vuelvas, J.; Correa, C.A.; Vallejo, V.E.; Patino, D. Machine learning and remote sensing techniques applied to estimate soil indicators—Review. Ecol. Indic. 2022, 135, 108517. [Google Scholar] [CrossRef]
  35. Wang, J.; Zhen, J.; Hu, W.; Chen, S.; Lizaga, I.; Zeraatpisheh, M.; Yang, X. Remote sensing of soil degradation: Progress and perspective. Int. Soil Water Conserv. Res. 2023, 11, 429–454. [Google Scholar] [CrossRef]
  36. Andries, A.; Morse, S.; Murphy, R.J.; Lynch, J.; Mota, B.; Woolliams, E.R. Can Current Earth Observation Technologies Provide Useful Information on Soil Organic Carbon Stocks for Environmental Land Management Policy? Sustainability 2021, 13, 12074. [Google Scholar] [CrossRef]
  37. Andries, A.; Murphy, R.J.; Morse, S.; Lynch, J. Earth Observation for Monitoring, Reporting, and Verification within Environmental Land Management Policy. Sustainability 2021, 13, 9105. [Google Scholar] [CrossRef]
  38. Mitchell, E.; Naoya, T.; Liam, G.; Peter, G.; Ken, D.; Sahar, A.; Warwick, B.; Annette, C.; Aaron, S.; Richard, E.; et al. Making soil carbon credits work for climate change mitigation. Carbon Manag. 2024, 15, 2430780. [Google Scholar] [CrossRef]
  39. Ingram, J.; Maye, D.; Reed, M. Contestations in the emerging soil-based carbon economy: Towards a research agenda. Sustain. Sci. 2025, 20, 597–611. [Google Scholar] [CrossRef]
  40. Abdalqadir, M.; Hughes, D.; Rezaei Gomari, S.; Rafiq, U. A state of the art of review on factors affecting the enhanced weathering in agricultural soil: Strategies for carbon sequestration and climate mitigation. Environ. Sci. Pollut. Res. 2024, 31, 19047–19070. [Google Scholar] [CrossRef]
  41. Neophytides, S.P.; Eliades, M.; Mavrovouniotis, M.; Papoutsa, C.; Papadavid, G.; Hadjimitsis, D.G. Improved water resources management for smart farming: A case study for Cyprus. Sci. Rep. 2024, 14, 31751. [Google Scholar] [CrossRef]
  42. Mustapha, A.A.; Abdu, N.; Oyinlola, E.Y.; Nuhu, A.A. Evaluating Different Methods of Organic Carbon Estimation on Nigerian Savannah Soils. J. Soil Sci. Plant Nutr. 2023, 23, 790–800. [Google Scholar] [CrossRef]
  43. Aguirre, J. The Kjeldahl Method. In The Kjeldahl Method: 140 Years; Aguirre, J., Ed.; Springer Nature: Cham, Switzerland, 2023; pp. 53–78. [Google Scholar]
  44. United States; Department of Agriculture; Agricultural Research Administration. Soil Survey Manual. No. 18; Agricultural Research Administration, US Department of Agriculture: Washington, DC, USA, 1951. [Google Scholar]
  45. Sanchez, C.; Mena, F.; Charfuelan, M.; Nuske, M.; Dengel, A. Assessment of Sentinel-2 Spatial and Temporal Coverage Based on the Scene Classification Layer. In Proceedings of the IGARSS 2024–2024 IEEE International Geoscience and Remote Sensing Symposium, Athens, Greece, 7–12 July 2024; pp. 4099–4103. [Google Scholar]
  46. Cavalaris, C.; Megoudi, S.; Maxouri, M.; Anatolitis, K.; Sifakis, M.; Levizou, E.; Kyparissis, A. Modeling of Durum Wheat Yield Based on Sentinel-2 Imagery. Agronomy 2021, 11, 1486. [Google Scholar] [CrossRef]
  47. Nascimento, C.M.; de Sousa Mendes, W.; Quiñonez Silvero, N.E.; Poppiel, R.R.; Sayão, V.M.; Dotto, A.C.; Valadares dos Santos, N.; Accorsi Amorim, M.T.; Demattê, J.A.M. Soil degradation index developed by multitemporal remote sensing images, climate variables, terrain and soil atributes. J. Environ. Manag. 2021, 277, 111316. [Google Scholar] [CrossRef]
  48. Zhang, D.; Zhao, Y.; Qi, H.; Shan, L.; Chen, G.; Ning, T. Effects of Micro-Topography and Vegetation on Soil Moisture on Fixed Sand Dunes in Tengger Desert, China. Plants 2024, 13, 1571. [Google Scholar] [CrossRef]
  49. Vaudour, E.; Gholizadeh, A.; Castaldi, F.; Saberioon, M.; Borůvka, L.; Urbina-Salazar, D.; Fouad, Y.; Arrouays, D.; Richer-de-Forges, A.C.; Biney, J.; et al. Satellite Imagery to Map Topsoil Organic Carbon Content over Cultivated Areas: An Overview. Remote Sens. 2022, 14, 2917. [Google Scholar] [CrossRef]
  50. Pittaki-Chrysodonta, Z.; Hartemink, A.E.; Sanderman, J.; Ge, Y.; Huang, J. Evaluating three calibration transfer methods for predictions of soil properties using mid-infrared spectroscopy. Soil Sci. Soc. Am. J. 2021, 85, 501–519. [Google Scholar] [CrossRef]
  51. Kiani-Harchegani, M.; Talebi, A.; Asgari, E.; Rodrigo-Comino, J. Chapter 7—Topographical features and soil erosion processes. In Computers in Earth and Environmental Sciences; Pourghasemi, H.R., Ed.; Elsevier: Amsterdam, The Netherlands, 2022; pp. 117–126. [Google Scholar]
  52. Torabi Haghighi, A.; Darabi, H.; Karimidastenaei, Z.; Davudirad, A.A.; Rouzbeh, S.; Rahmati, O.; Sajedi-Hosseini, F.; Klöve, B. Land degradation risk mapping using topographic, human-induced, and geo-environmental variables and machine learning algorithms, for the Pole-Doab watershed, Iran. Environ. Earth Sci. 2020, 80, 1. [Google Scholar] [CrossRef]
  53. Bragin, N.Y. The Most Important Events of Geological Evolution of Cyprus in the Late Cretaceous. Stratigr. Geol. Correl. 2022, 30, S78–S95. [Google Scholar] [CrossRef]
  54. Ferreira, C.S.S.; Seifollahi-Aghmiuni, S.; Destouni, G.; Ghajarnia, N.; Kalantari, Z. Soil degradation in the European Mediterranean region: Processes, status and consequences. Sci. Total Environ. 2022, 805, 150106. [Google Scholar] [CrossRef]
  55. Bouharat, D.; El Youssefi, F.; Yahya, A.; El Khalifi, K.T. Challenges for Sustainable Water Resource Management: Irrigation, Salinity and Contamination. In The Olive Landscapes of the Mediterranean: Key Challenges and Opportunities for Their Sustainability in the Early XXIst Century; Muñoz-Rojas, J., García-Ruiz, R., Eds.; Springer Nature: Cham, Switzerland, 2024; pp. 457–466. [Google Scholar]
  56. Tiefenbacher, A.; Sandén, T.; Haslmayr, H.-P.; Miloczki, J.; Wenzel, W.; Spiegel, H. Optimizing Carbon Sequestration in Croplands: A Synthesis. Agronomy 2021, 11, 882. [Google Scholar] [CrossRef]
  57. Mavsar, S.; Grčman, H.; Turniški, R.; Mihelič, R. Organic carbon sequestration potential of Slovenian agricultural soil and the impact of management practices on SOC stock. Cogent Food Agric. 2025, 11, 2437574. [Google Scholar] [CrossRef]
  58. Xia, W.; Hu, C.; Shi, J.; Zhuang, S.; Lian, X.; Wang, R. Study on the Water and Fertilizer Demand Model for Facility Fruit and Vegetables in Desert and Gobi Regions. In New Technologies Applied in Gobi Desert Facility Agriculture: Sensing and Autonomous Techniques; Hu, C., Wang, L., Xing, J., Wang, X., Zhang, Z., Eds.; Springer Nature: Singapore, 2025; pp. 145–179. [Google Scholar]
  59. Klein-Raufhake, T.; Hölzel, N.; Schaper, J.J.; Hortmann, A.; Elmer, M.; Fornfeist, M.; Linnemann, B.; Meyer, M.; Rentemeister, K.; Santora, L.; et al. Severity of topsoil compaction controls the impact of skid trails on soil ecological processes. J. Appl. Ecol. 2024, 61, 1817–1828. [Google Scholar] [CrossRef]
  60. Sadiq, M.; Rahim, N.; Tahir, M.M.; Shaheen, A.; Ran, F.; Chen, G.; Bai, X. Soil Bulk Density, Aggregates, Carbon Stabilization, Nutrients and Vegetation Traits as Affected by Manure Gradients Regimes Under Alpine Meadows of Qinghai–Tibetan Plateau Ecosystem. Plants 2025, 14, 1442. [Google Scholar] [CrossRef]
  61. Kaya, F.; Schillaci, C.; Keshavarzi, A.; Başayiğit, L. Predictive Mapping of Electrical Conductivity and Assessment of Soil Salinity in a Western Türkiye Alluvial Plain. Land 2022, 11, 2148. [Google Scholar] [CrossRef]
  62. Ondrasek, G.; Rengel, Z. Environmental salinization processes: Detection, implications & solutions. Sci. Total Environ. 2021, 754, 142432. [Google Scholar] [CrossRef]
  63. Ferreira, C.S.S.; Keesstra, S.; Destouni, G.; Solomun, M.K.; Kalantari, Z. Soil Degradation in the Mediterranean Region: Drivers and Future Trends. In Environmental Sustainability in the Mediterranean Region: Challenges and Solutions; Ferreira, C.S.S., Destouni, G., Kalantari, Z., Eds.; Springer International Publishing: Cham, Switzerland, 2024; pp. 81–112. [Google Scholar]
  64. Payab, A.H.; Türker, U. Resilience of rainfed agriculture in northern part of Cyprus: A comprehensive drought severity level impact analysis and adaptive strategies. Environ. Dev. Sustain. 2025, 27, 3033–3058. [Google Scholar] [CrossRef]
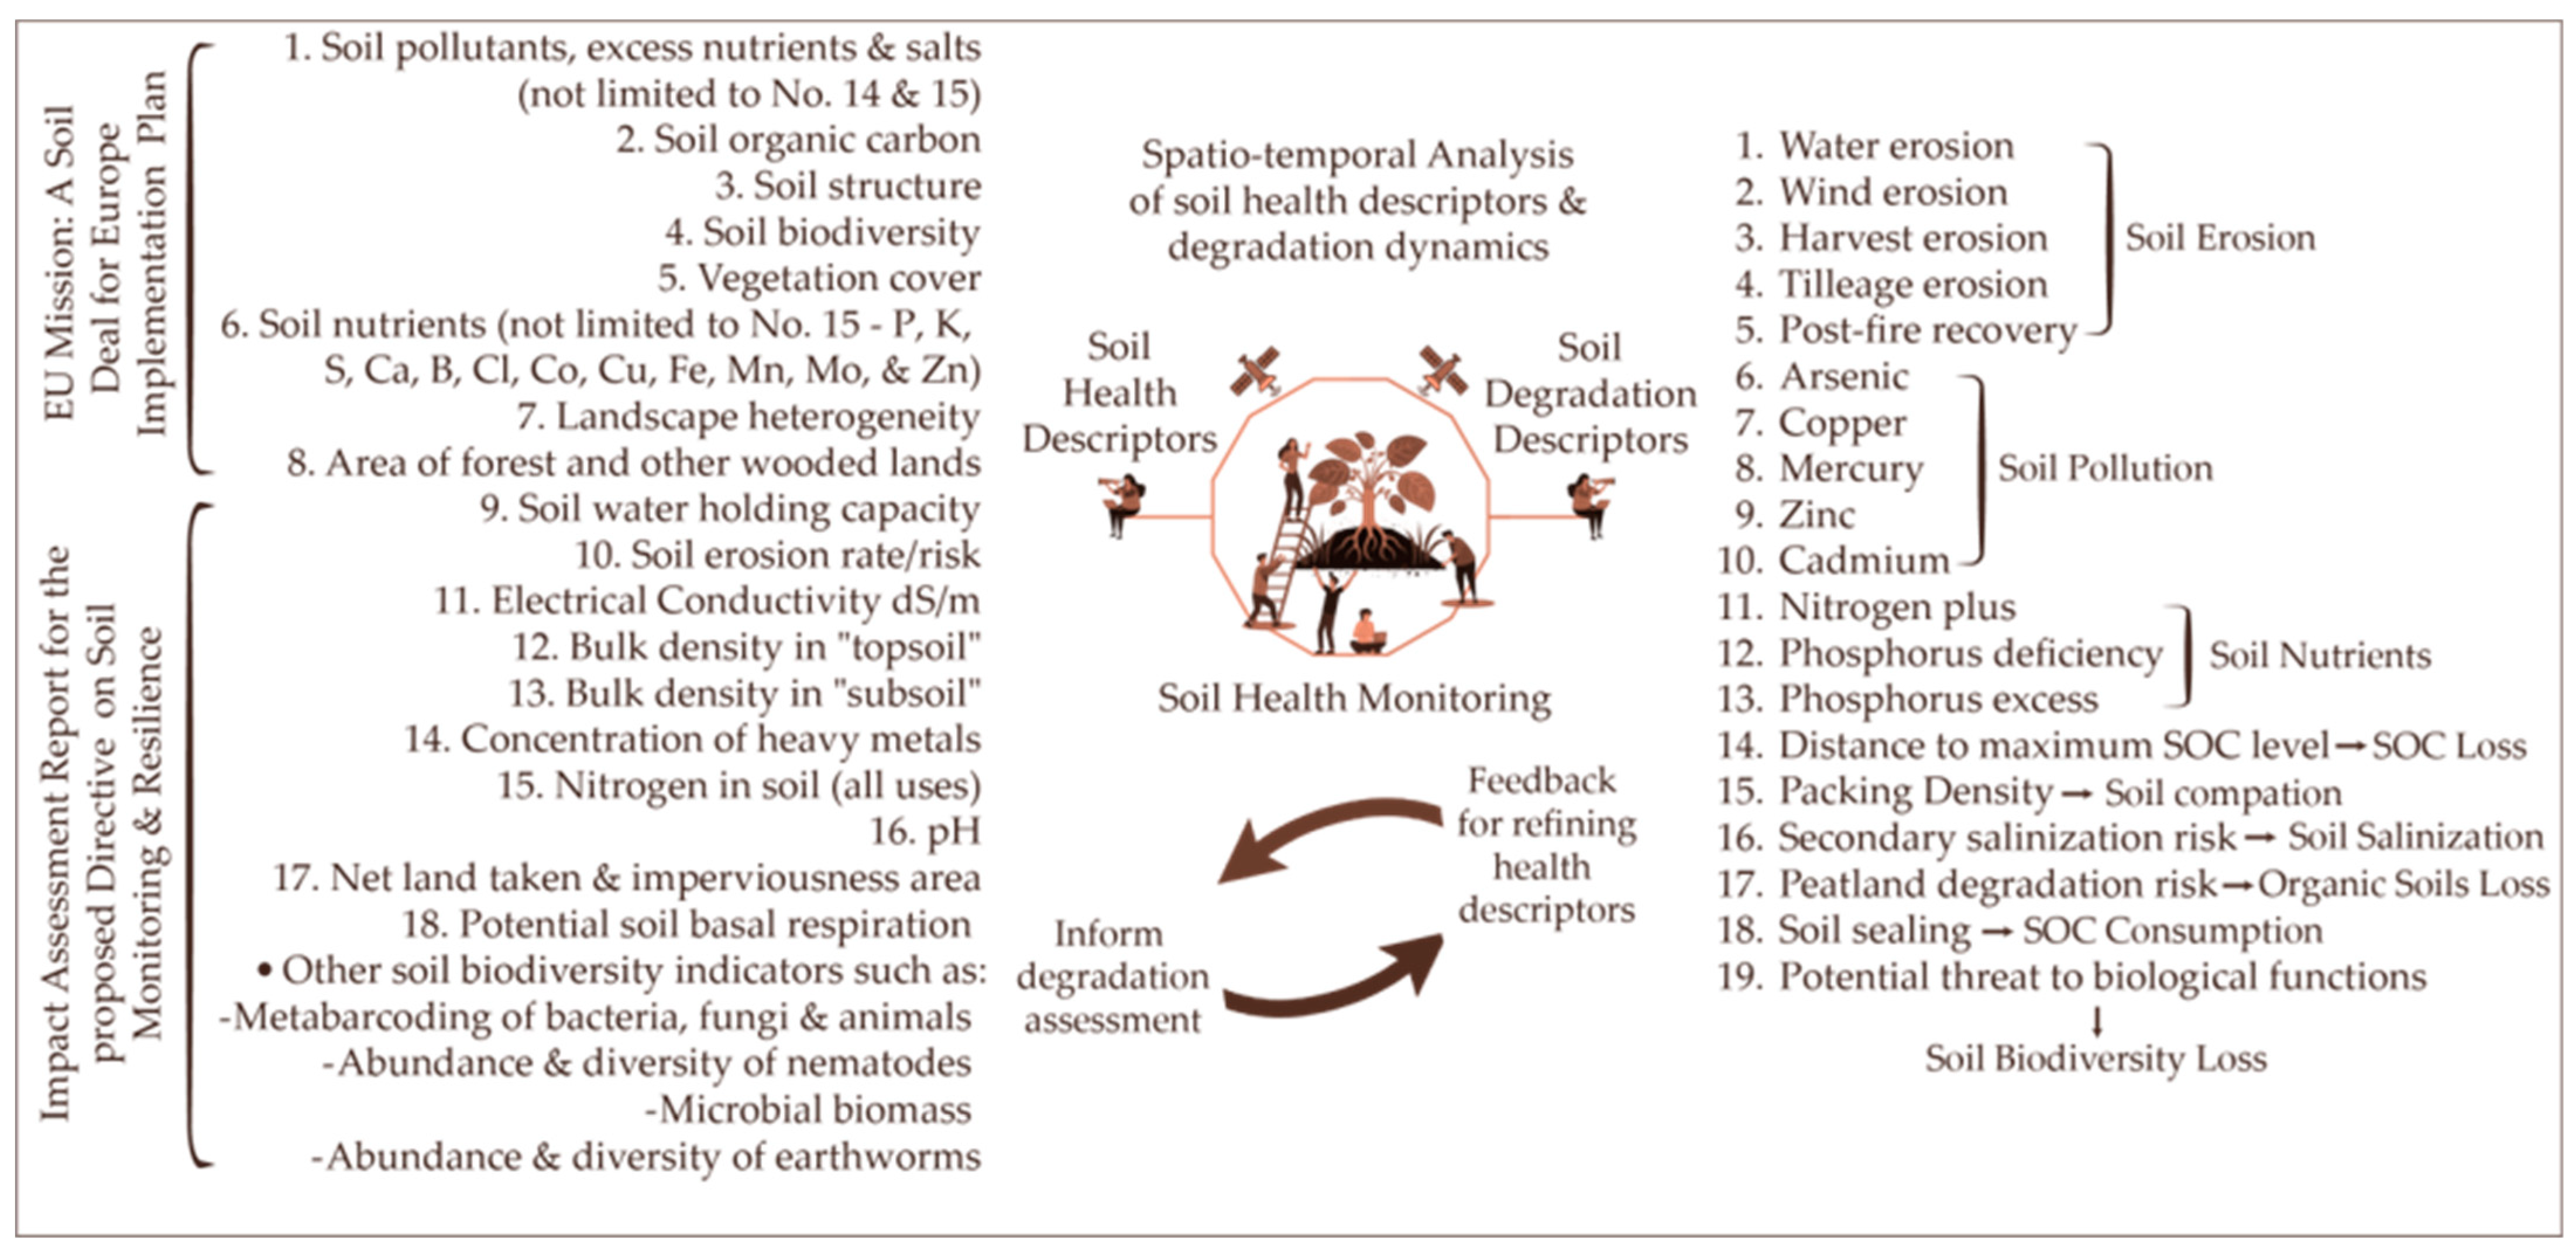
Figure 1. Bidirectional relationship between soil health descriptors (left) and soil degradation descriptors (right).
Environments 12 00283 g001
Figure 2. Soil texture classification of the 951 samples across Cyprus based on the USDA soil texture triangle, showing the distribution of sand (50–2000 μm), silt (2–50 μm), and clay (0–2 μm) fractions (a). Frequency distribution of the classified USDA soil texture classes, highlighting their relative abundance across the sample set (b).
Environments 12 00283 g002
Figure 3. LULC map of Cyprus showing the distribution of major land cover classes.
Environments 12 00283 g003
Figure 4. (a) Digital Elevation Model (DEM, in m) of Cyprus, showing elevation in meters above sea level; and (b) Terrain Roughness Index (TRI), highlighting spatial variation in surface heterogeneity.
Environments 12 00283 g004
Figure 5. (a) Aspect map (in azimuth degrees) illustrating slope orientation. (b) Slope map (in degrees) indicating terrain steepness.
Environments 12 00283 g005
Figure 6. Spatial distribution of remote sensing indices across Cyprus: (a) Normalized Difference Vegetation Index (NDVI) reflecting vegetation greenness and productivity; (b) Bare Soil Index (BSI) indicating areas of exposed soil and low vegetation cover; and (c) Normalized Difference Water Index (NDWI) representing surface moisture conditions.
Environments 12 00283 g006
Figure 7. Scatterplots comparing predicted and observed values for eleven key soil physicochemical properties using the optimized machine learning models under Mediterranean conditions. Each subplot corresponds to one property: (a) sand (%), (b) clay (%), (c) silt (%), (d) calcium carbonate (CaCO3, %), (e) soil organic carbon (SOC, %), (f) pH, (g) potassium (K, mg/kg), (h) phosphorus (P, mg/kg), (i) nitrogen (N, %); and (j) electrical conductivity (dS/m). The red dashed line represents the 1:1 line, indicating perfect model prediction.
Environments 12 00283 g007aEnvironments 12 00283 g007b
Figure 8. Spatial distribution maps of key soil texture and soil organic carbon across Cyprus: (a) clay (%), (b) sand (%), (c) silt (%); and (d) SOC (%).
Environments 12 00283 g008
Figure 9. Spatial distribution maps of predicted soil nutrients across Cyprus: (a) K (ppm), (b) N (%); and (c) P (ppm).
Environments 12 00283 g009
Figure 10. Modeled spatial distribution of (a) EC (dS/m), (b) pH; and (c) CaCO3 (%) across Cyprus based on satellite-derived soil prediction models.
Environments 12 00283 g010
Table 1. Cross-validation results for the soil prediction models based on multiple statistical indicators, including coefficient of determination (R2), Lin’s concordance correlation coefficient, mean squared error (MSE), root mean squared error (RMSE), bias, Ratio of Performance to Deviation (RPD), and Ratio of Performance to Inter-Quartile Distance (RPIQ).
TargetR2ConcordanceMSERMSEBiasRPDRPIQ
N (%)0.920.8600.0302.262.71
P (ppm)0.920.84202.3414.230.512.181.91
K (ppm)0.920.8625,175.50158.674.272.262.89
pH0.920.880.020.1202.392.82
EC (dS/m)0.900.830.040.190.012.081.26
CaCO3 (%)0.930.8982.289.070.032.534.35
Sand (%)0.920.8736.176.010.062.383.43
Silt (%)0.930.889.903.15−0.012.403.61
Clay (%)0.930.8718.864.3402.343.22
SOC (%)0.950.850.050.2302.262.82
Disclaimer/Publisher’s Note: The statements, opinions and data contained in all publications are solely those of the individual author(s) and contributor(s) and not of MDPI and/or the editor(s). MDPI and/or the editor(s) disclaim responsibility for any injury to people or property resulting from any ideas, methods, instructions or products referred to in the content.