Article

A Citizen Science Approach for Documenting Mass Coral Bleaching in the Western Indian Ocean

by
Anderson B. Mayfield
Coral Reef Diagnostics, Miami, FL 33129, USA
Environments 2025, 12(8), 276; https://doi.org/10.3390/environments12080276
Submission received: 3 June 2025 / Revised: 28 July 2025 / Accepted: 2 August 2025 / Published: 11 August 2025

Abstract

During rapid-onset environmental catastrophes, scientists may not always have sufficient time to conduct proper environmental surveys in all representative areas. Although coral bleaching events can be predicted to a certain extent in some areas by tracking sea surface temperatures (SSTs), current models from NOAA’s Coral Reef Watch tend to underestimate severity of bleaching in the Indian Ocean, as was evident in March 2024 when corals began bleaching after only experiencing 1–2 degree-heating weeks. To characterize the impacts of this event, I conducted citizen science-style surveys at 22 sites along a 600-km stretch of the Kenyan coastline. Thereafter, I trained an artificial intelligence (AI) to extract coral abundance and bleaching data from 2300 coral reef images spanning 11–12 hectares of reef area to estimate both coral cover and bleaching prevalence. The AI’s accuracy was >80%, though it was prone to false-positive bleaching classifications. Bleaching severity varied significantly across sites, as well as over time, as seawater continued to warm over the duration of the study period; on average, over 75% of all reef-building scleractinians had bleached. Across the 22 sites, the mean healthy coral cover was only 7–8%, vs. >30% at sites in the same areas in the late 1990s. Whether these corals can recover, and then withstand such heatwaves in the future, will be known all too soon.

1. Introduction

Coral reefs are among the most biologically diverse and socio-economically valuable ecosystems, yet they are increasingly threatened by climate change-induced stressors, particularly marine heatwaves that elicit coral bleaching [1]. Bleaching occurs when elevated sea surface temperatures (SSTs) disrupt the mutualistic relationship between reef-building corals and their endosymbiotic dinoflagellates (family Symbiodiniaceae), often leading to host mortality [2]. In recent decades, the frequency and intensity of bleaching events have increased markedly [3]. In the Western Indian Ocean, including the Kenyan coastline, severe bleaching occurred during major global events in 1998 and 2016 [4,5]. These events have led to declines in coral cover, reef complexity, and fish biomass, highlighting the vulnerability of East African coral reefs to thermal anomalies [6,7]; the 1998 event alone caused >90% mortality in some shallow reefs along the Kenyan coast [8]. Despite some signs of recovery in subsequent years, the 2016 bleaching event again resulted in considerable coral loss [9]. In early March of 2024, local divemasters and scientists noted that bleaching was already occurring, despite only 1–2 degree-heating weeks (DHWs) having transpired based on NOAA Coral Reef Watch SST-derived calculations [10].
Comprehensive data collection during coral reef crises is essential for evaluating ecological impacts, informing conservation strategies, and evaluating climate resilience. However, the logistical and financial constraints of traditional monitoring programs often limit their responsiveness during acute disturbances. In this context, citizen science offers a powerful, scalable solution for real-time ecological monitoring [11]. Initiatives such as ReefCheck and CoralWatch have demonstrated that trained divers, local communities, and tourists can generate reliable data that complement scientific assessments [12]; as of 2025-08-08, the former’s database includes data from >17,000 100-m transects, and Done et al. [13] found that ReefCheck’s citizen science data were 93% accurate when compared to data collected in the relative vicinities of the survey sites by formally trained scientists. Mayfield and Dempsey [14] performed a side-by-side comparison of citizen science coral reef survey data and point-intercept benthic transect data from highly trained researchers, and mean coral cover values (35 and 39%, respectively) were within 10% of one another; bleaching prevalence data were identical (31–32% for each). Given these prior validations of the citizen science approach for coral reef monitoring, it is possible that, by integrating citizen science into reef monitoring programs—particularly during bleaching or disease outbreaks—Kenya and other reef-dependent nations can enhance the spatial and temporal coverage of data collection and strengthen participatory conservation frameworks.
Herein I adopted a citizen science + artificial intelligence (AI) approach to assist local scientists (many of whom could not sacrifice the requisite time) with data collection—namely scleractinian coral cover and the percentage of these reef-builders’ tissues that were bleaching—during the aforementioned, unexpectedly severe bleaching event, which continued to intensify over the course of March and into April of 2024. AI has been proven to have a role in marine habitat mapping [15] and benthic characterization [16], with image classification accuracies typically in the 80–95% range [17]. Although not yet superior to a well-trained coral scientist, this accuracy may be acceptable when considering the dataset size. A 1-m wide belt transect (of 10-m length) at which benthic classifications are made every 0.1 m (i.e., 10 m2 of reef area) may take a well-trained diver several minutes to characterize down to genus-level resolution for coral and other key taxa. However, an accuracy of 100% may be realized. In contrast, on a typical dive in which a tourist or scientist captures a 10 × 5 m (50 m2) reefscape image every few seconds, upwards of 0.5 ha of benthos could be imaged over a 1-hr dive; while not as representative of the reefscape as structure-from-motion approaches [18], photogrammetry currently requires relatively advanced training. As such, I sought to use a lower-resolution method that could image a larger reef area, versus the more formal, “gold standard” transect-based survey in which far less of the reef is characterized (albeit at a higher level of resolution and accuracy).

2. Materials and Methods

2.1. Image Surveys

Unstructured images of the coral reef benthos were taken with an Olympus (Tokyo, Japan) TG7 underwater digital camera that was continually white-balanced throughout the dives (n = 22 dives across 20 unique sites [one site was surveyed twice and the data from another were later combined with a nearby site due to their proximity.] spanning ~600 km of Kenya’s Swahili coastline; Table 1). All reefs were fringing reefs in the proximity (1–2 km) of the Kenyan mainland except for the Kisite National Park sites (Figure 1), which abutted islands located 10–12 km from the mainland (Shimoni). Essentially, I pretended that I was a tourist with no knowledge of coral reef ecology other than the fact that scleractinian corals are responsible for constructing the reef framework; hence, the majority of my photos were of the benthos (and not, in contrast, pelagic organisms swimming in the water column). One photography bias was evident; many SCUBA diving tourists are as likely to take “macro” photographs of relatively small (<10 cm) organisms (e.g., nudibranchs) as they are reefscape ones, the latter being more useful for benthic characterization. Although I did not exclude macro photos, they comprised <5% of all images.
Half of the sites were tourist dive sites, with the others representing long-term monitoring sites of various local coral reef-focused agencies (Table 1). White-balancing was critical because only natural light was used (no strobes), and without appropriate white-balancing, accurate representations of color are lost due to the attenuation of light through seawater. Furthermore, unwhite-balanced images cannot yield reliable bleaching data since they appear “washed-out” and overly white, especially when naturally white objects like sand are abundant in the reference frame. Coral reef photos were taken from ~0.5 m down to 26 m while hovering ~1–2 m above the reef; this ensured that the majority of the image comprised benthos (mean = 88% benthos vs. 12% water and fish). The average reef area encompassed within each image was ~50 m2, and photos were taken every ~20–30 s while continuously swimming over the course of ~30 to 180 min on each dive. Further details of the image acquisition method can be found in a prior work [19], but the need to white-balance frequently should be re-emphasized; even changes in depth of ~1–2 m could warrant re-white-balancing (depending on water clarity), meaning that I regularly white-balanced every 1–2 min while diving and oftentimes even more frequently unless the entire survey took place at the same depth (e.g., Round Reef) during a time of day in which ambient light levels did not vary appreciably.
Images used to train the AI (as well as those analyzed to yield coral cover and % bleaching) were taken shallower than 26 m since greater depths were associated with too little light to accurately resolve benthic taxa; the mean image depth (Table 1) was only 6.1 ± 3.2 m (std. dev. for these and all other error terms). Both an Oceanic OCi dive computer (San Leandro, CA, USA) and the TG7 were used to record depth and temperature associated with each image. The manufacturer and scientists [20,21] have estimated the former’s temperature readings to be ±0.5 °C versus laboratory-grade temperature loggers. Because the TG7’s temperature data have not been validated, the in situ temperature data presented represent those from the dive computer only unless noted otherwise.

2.2. CoralNet AI Training

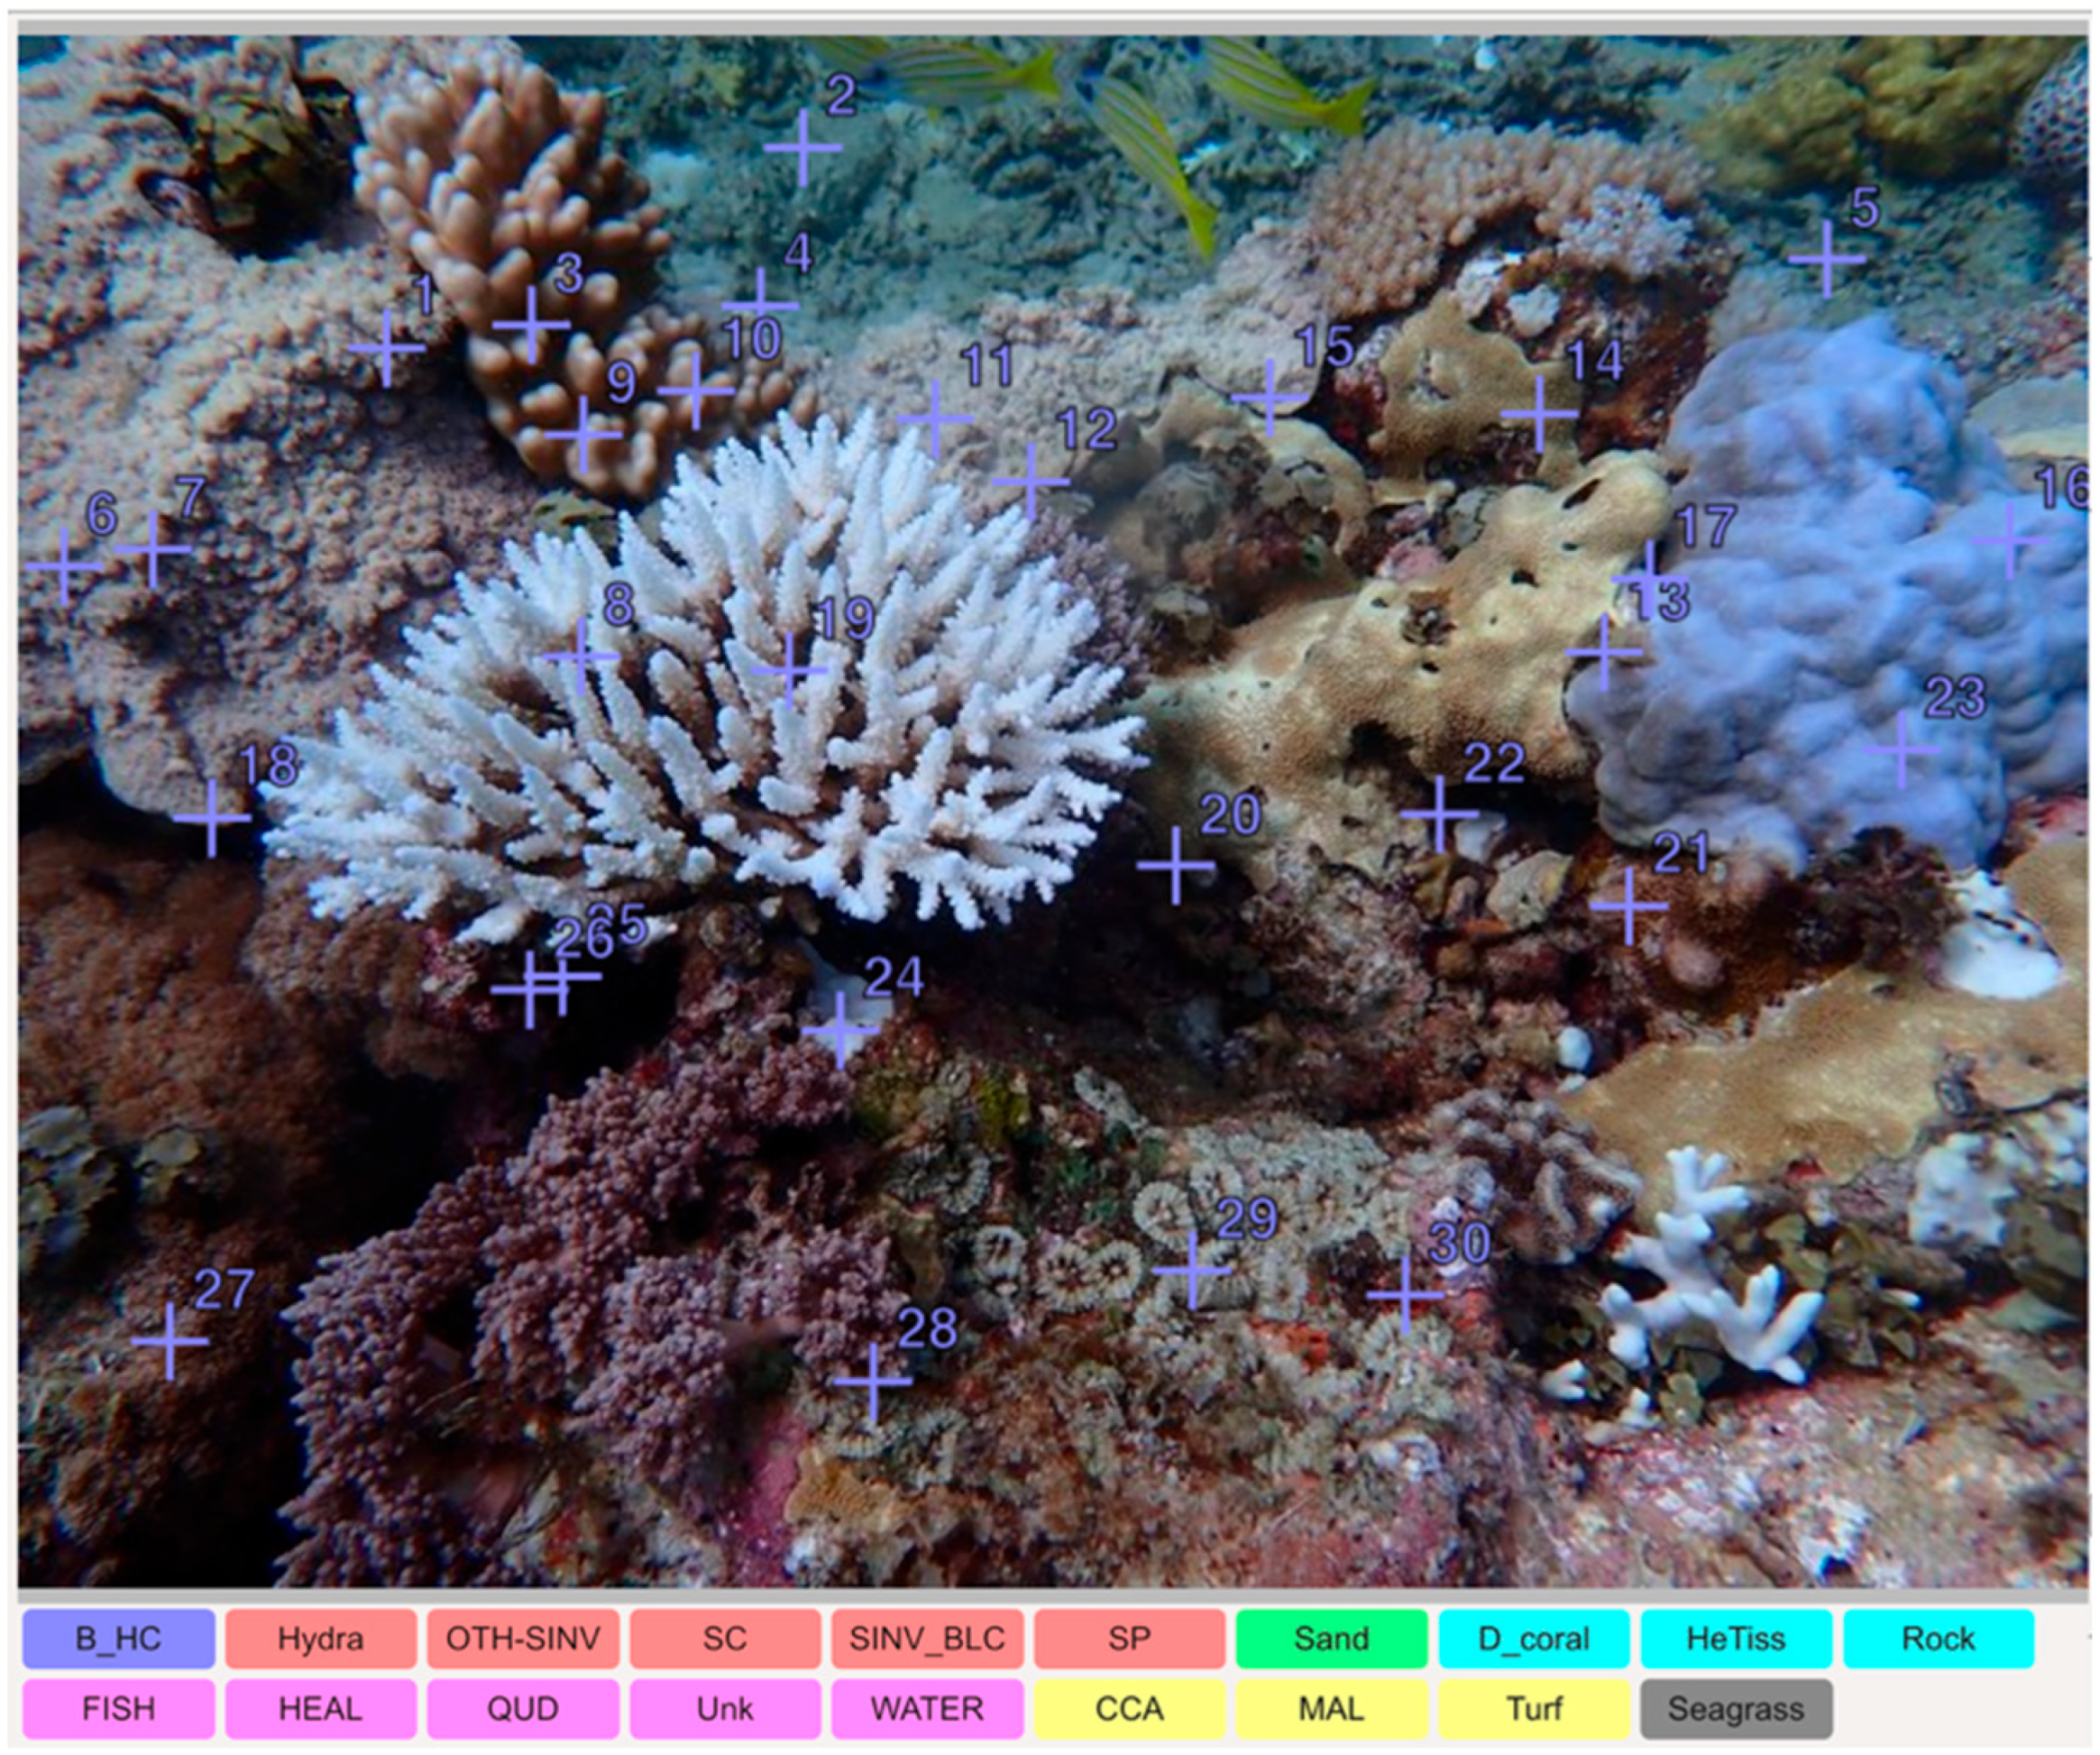
To train the CoralNet AI [22], a similar “labelset” to that of Mayfield and Dempsey [14] and Mayfield [19] was used (Figure 2 and Supplemental File S1). Briefly, I considered two non-benthic factors: water and fish. These were excluded from calculations of coral cover and bleaching. The remaining labels included hard corals (“HeTiss”), bleached corals (“B_HC”), soft corals (“SC”), sponges (“SP”), other invertebrates (OTH-SINV), other invertebrates (including soft corals) that had bleached (SINV_BLC), Hydra sp., seagrass, three types of algae (turf, macroalgae [MAL], and crustose coralline algae [CCA]), two abiotic categories (sand and recently dead hard corals [“D_coral”]), human-made (artificial) materials (called “QUD” for “quadrat” since photo-quadrats were the most common such structure), and “unknown.” Dead hard corals were those in which no living tissue was evident, yet the skeleton had not yet been overgrown by turf algae or other taxa. Rocks were also considered, but since they were invariably covered with turf algae, this label was later excluded. When omitting one redundant label for healthy coral tissues (Figure 2), 17 labels were used. The total counts and relative frequencies for each can be found in Supplemental File S1. Within each of 2300 coral reef images that passed quality control (22 of the original 2322 did not include any visible reef habit; Table 2), 30 points were overlaid randomly by CoralNet for either manual or automated (AI) annotation.
Although a minimum of 20 images must be manually annotated before CoralNet can make its own predictions, my experience is that upwards of several hundred images should actually be manually annotated to ensure that the accuracy reaches the ~80–85% benchmark set by the developers [22]. For this reason, CoralNet was trained incrementally as follows (Table 2). First, the 30 random points in each of 360 randomly selected images (10,800 “features”) were manually annotated; the random nature of the training is important because it ensures that accuracy is not lower at sites visited earlier in the field trip versus those surveyed later (since the AI improves as it is trained on additional images). This resulted in an accuracy of 81%, as calculated by CoralNet (based on comparing its guesses to those validated by myself on a feature-by-feature basis). To verify this accuracy, which can sometimes be under-estimated [14,19], an additional 400 images were manually annotated, and a true predictive accuracy of 84% was computed.
Because the goal of this work was to use a citizen science + AI image analysis approach to characterize a bleaching event, it was critical to ensure that the AI could distinguish a healthy coral from a bleaching one. The methodology for this has been described previously [14] but, briefly, is based on corals paling to a CoralWatch score of 1 [23]. Both false-positive and false-negative bleaching prediction rates were calculated. The former was when the AI scored a point as a bleaching coral when it was actually unbleached; the latter was when a bleached coral was instead scored as normally pigmented (i.e., healthy).

2.3. Data Analysis

Since only rudimentary environmental data were collected—GPS coordinates, date, time, depth (in some cases), and temperature (both in situ and NOAA SST)—nor were sites visited repeatedly (i.e., before, during, and after bleaching), a simple statistical approach was employed. From each image, the total benthic count was first calculated; this was the number of points out of the 30 total that corresponded to the benthos (excluding fish and water). Next, a total live coral count was computed (scleractinian corals only); this was divided by the benthic count and multiplied by 100 to calculate percent coral cover. Three different coral cover percentages were calculated: total live coral cover (which included bleached corals that were still alive), healthy coral cover (bleached corals excluded), and percent bleaching (bleached corals/total live coral cover × 100).
Kruskal–Wallis (non-parametric ANOVA) tests were used to test for spatial variation in both coral cover and percent bleaching (alpha = 0.01), and Wilcoxon tests were used to determine whether either of these ecological benchmarks differed between the 11 tourist dive sites and the 11 long-term monitoring sites. The latter analysis was undertaken to ensure that tourist sites were representative of typical reefs in the area since it was assumed that dive operators would normally prefer to take tourists to the least impacted sites (i.e., those with relatively high coral cover and relatively low incidence of bleaching).
Bleaching prevalence was also modeled as a function of the number of NOAA-calculated DHWs (from the 5-km regional virtual station time series database) with a simple linear regression analysis, with more severe bleaching predicted to be documented at higher DHWs. All NOAA SST data were derived from the lone virtual station (“Kenya”), and both temperature and DHW data were assessed at one-day resolution; in other words, I did not consider diel variation or diel maxima. DHWs were calculated by NOAA using the 90th percentile “hot spot” algorithm. In a separate analysis, stepwise regression was used to determine which of the following putative terms best predict bleaching severity (as percent of all coral tissue surface area bleached, not as percent of all colonies bleached) in the region: temperature, DHWs, and depth. The superior model was determined a priori to be that which minimized the Bayesian information criterion (BIC). Depth effects alone were also tested after calculating the average depth of the benthos across all images for each site, and then dividing the 20 unique sites into shallow (0–5 m), medium (5–10 m), and deep (>10 m) ones; I sought to determine whether, in the absence of temperature, DHWs, and date, depth effects on bleaching severity could be documented with non-parametric ANOVA. JMP® Pro (ver. 18; Cary, NC, USA) was used for all statistical analyses.

2.4. Meta-Analysis

To estimate how live coral cover has changed over time as a result of bleaching events in the area (beginning with the 1998 global event), I conducted a meta-analysis of select articles that met the following criteria: they (1) collected coral cover and, when relevant, coral bleaching data, (2) provided GPS coordinates of the study sites, and (3) made the data publicly available. From this larger subset, I then extracted data from those that presented data either (preferably) from the exact same survey sites or, when not possible, within 1–2 km based on GPS coordinates presented in the articles. Sites were binned into three regions (Figure 1): south (Diani Beach to the Tanzanian border), central (Mombasa to Watamu), and north (Lamu). Changes in live coral cover over time were assessed with linear regression. All data analyzed can be found in Supplemental File S1.

3. Results and Discussion

3.1. CoralNet Performance

Annotation accuracy rose from 69% after training with 42 images (accession 4963: https://coralnet.ucsd.edu/source/4963/ (accessed on 2 June 2025)) to 81% after 360. Its self-reported value was found to be an underestimate based on analysis of an additional 400 images, at which point the accuracy was determined to actually be 84% when considering all 17 potential labels (Table 2). False-positive and false-negative bleaching classification rates of 24.2 and 2.2%, respectively, were documented when instead considering only two labels: healthy or bleached hard corals. These results contrast with my prior works employing a similar approach. In Mayfield and Dempsey [14], the false-positive rate was <1%, yet the false-negative one was >30%; the overall predictive accuracy with respect to bleaching of 89% in [14] is, in contrast, statistically similar to the 88.1% documented herein (chi-squared test, p > 0.05). This means that the AI was slightly more adept at distinguishing bleached from healthy corals relative to its overall predictive accuracy of 84%.
The 24.2% false-positive bleaching classification rate was unexpected and could be linked to the subjective nature of the CoralWatch score card. If, for instance, a colony’s pigmentation was halfway between a score of 1 and a score of 2, in half the cases I would likely round down to a 1, and in the other half of cases round up to a 2 (no intermediate scores, e.g., 1.5, were given). Similarly, CoralNet would have been trained with images of colonies spanning a gradient of pigmentations, and so a portion of the lightly pigmented corals that were not (yet) fully bleaching were scored as bleaching. Although potentially a problematically high error rate, it could be argued that overestimating bleaching might be preferred to underestimating it, especially since many paling corals likely continued to bleach over the duration of April for reasons discussed in the next section.

3.2. Temperature

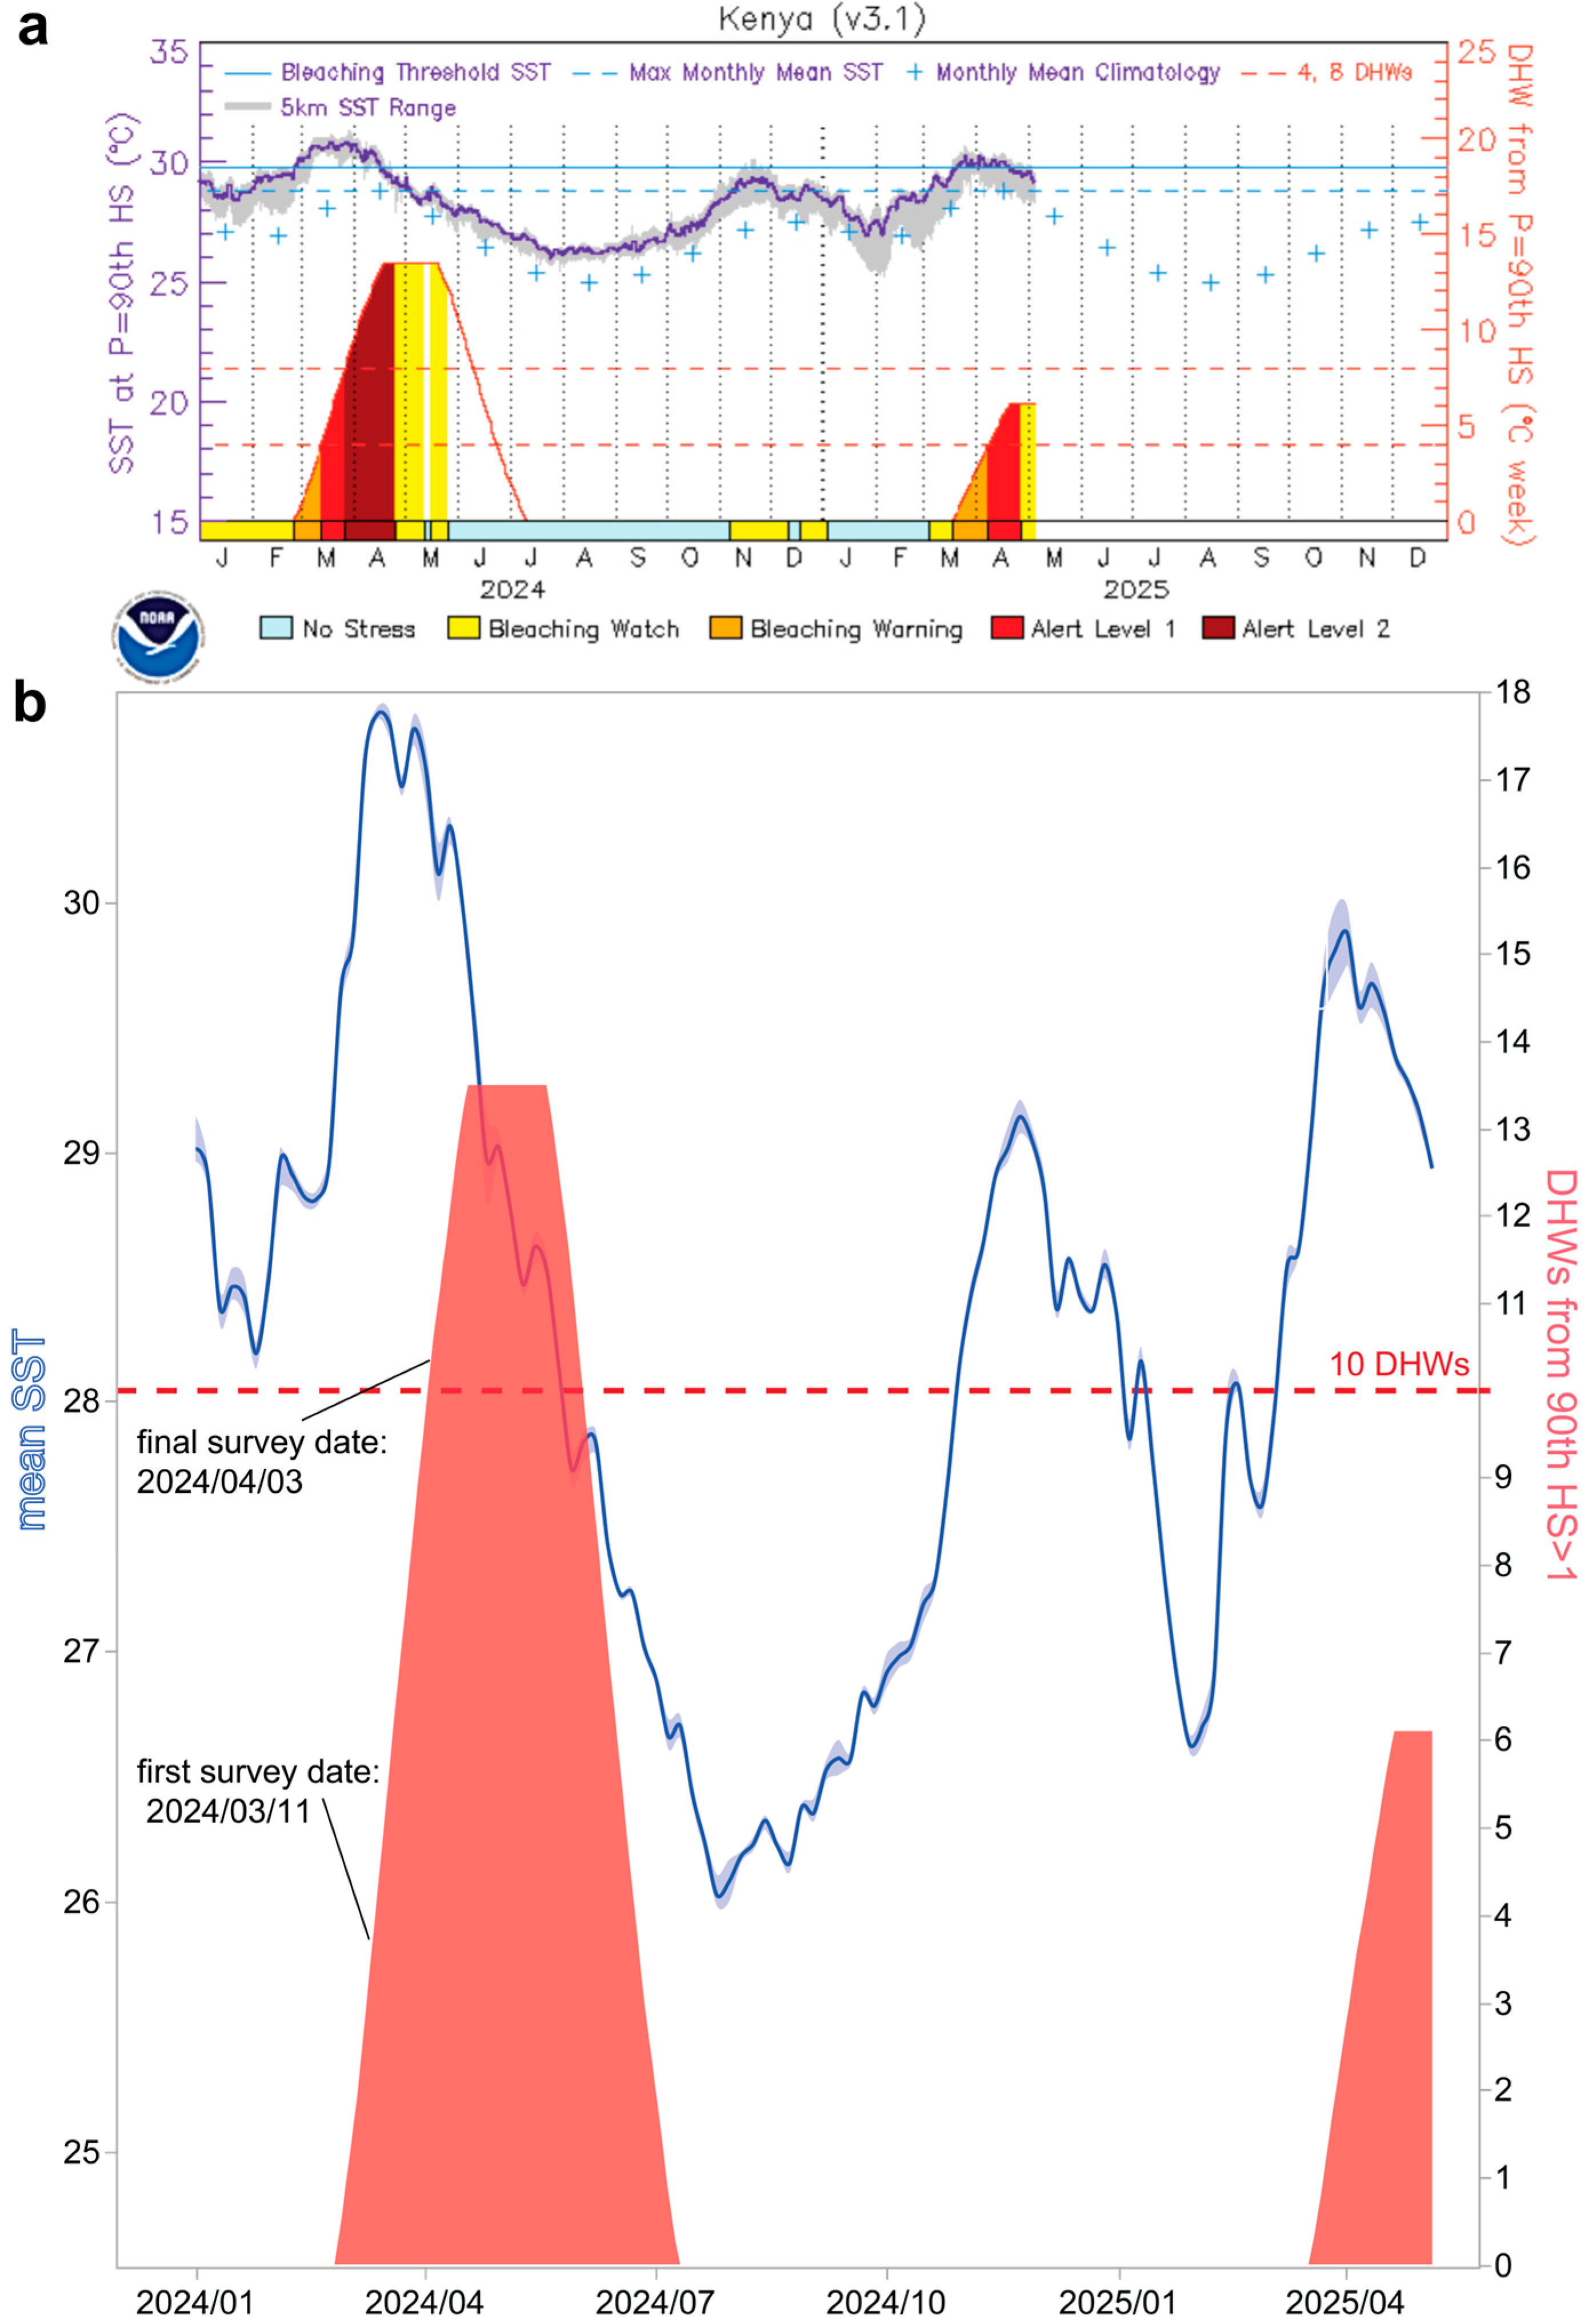
Dive computer-derived temperature data were compared to SST estimates from NOAA (Figure 3 and Figure 4). Assuming a mean monthly maximum of ~29 °C (Figure 3a), the first DHW would have been accumulated by March 1st when using the NOAA climatology, reaching 4 DHWs by my first survey date (2024-03-11; Table 1); the maximum value of 13.5 DHWs occurred on April 18th (Figure 3b). This represents the highest value recorded for Kenya since NOAA began estimating temperatures in the region (1985). However, NOAA’s temperature estimates were, on average, 1.3 ± 0.4 °C lower than in situ ones (Supplemental Figure S1; matched-pairs t-test, t = 15.0, p < 0.001), meaning that the DHW values in Table 1 and Figure 3b are underestimates. When instead using actual temperatures, heat stress would have begun to accumulate a month earlier (early-February), extending until mid-May; in total, then, nearly 22 DHWs may actually have transpired. The mean temperature across all sites and times was 32.0 ± 0.4 °C, the same as estimated by Mdodo [24] during the 1998 bleaching event.

3.3. Coral Bleaching

Regardless of whether I used the NOAA-derived DHWs at the time of surveying of ~5–10 DHWs or the DHWs calculated from in situ temperatures in March-early April (~10–15), widespread coral bleaching was observed at all sites except for those of Mombasa; despite being warm (32 °C), corals there were not bleaching to nearly the same degree given that the reefs were surveyed earliest (March 11–14; <5 DHWs). By the final survey (April 1st; Table 1 and Figure 3), ~10 NOAA SST-derived DHWs had transpired.
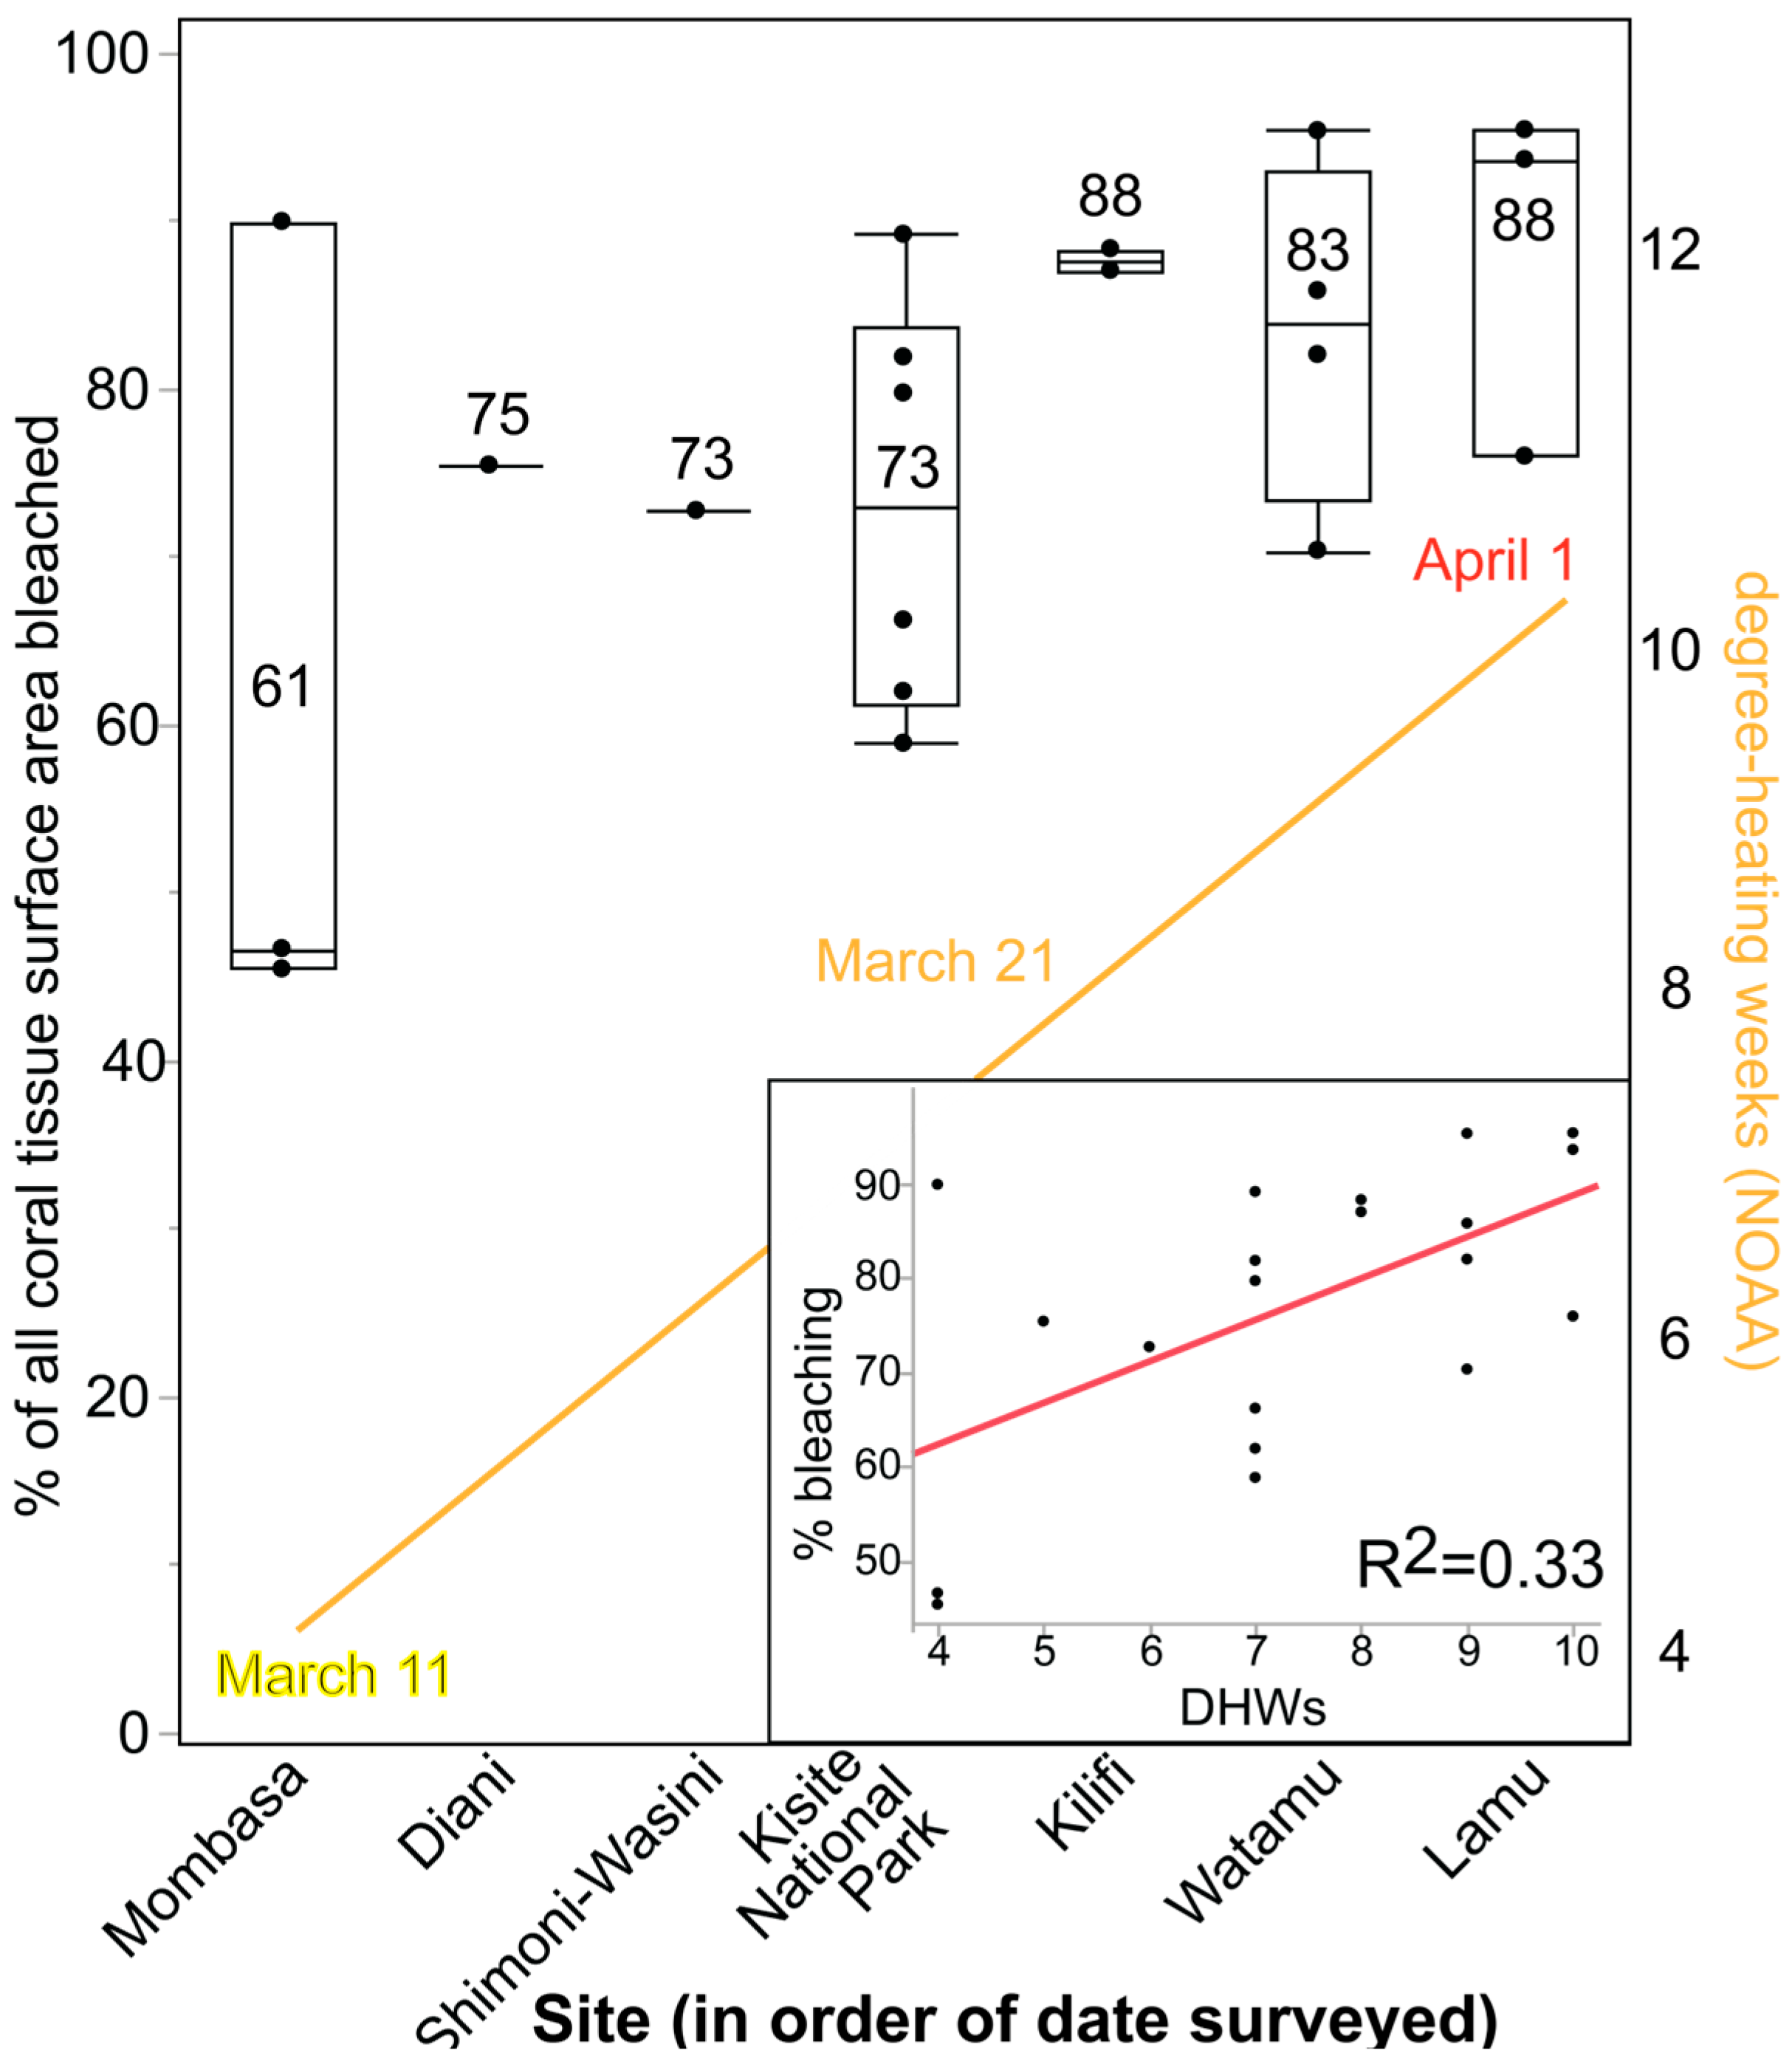
The mean percent bleaching across the 22 survey dives was 77.1 ± 15.0% and ranged from 45% at Sandy Patch (Mombasa) to >95% at the Ocean Trust (MARS) nursery near Lamu (Supplemental File S1). The latter site featured ancient Galaxea colonies abutting the nursery, all of which were stark white and being engulfed by macroalgae. It is important to emphasize that these spatial differences (Figure 4) are due to the fact that temperatures were rising from the earliest sites surveyed (Mombasa-lowest DHWs and therefore lowest percent bleaching) to the latest (Lamu-highest DHWs and hence most severe bleaching); survey date (and therefore number of DHWs) was more important in driving the bleaching response than absolute temperatures or latitude, and the correlation between DHWs and percent bleaching was statistically significant (Figure 4; linear regression t-test, t = 3.02, p < 0.01). Although bleaching was indeed significantly higher at Lamu than Mombasa (Figure 4), this is not because corals of Mombasa are necessarily more thermo-tolerant; they simply had experienced less thermal stress at the time of surveying. Therefore, it is important to consider both date and DHWs when assessing the data in Figure 4 and Figure 5.

3.4. Coral Cover

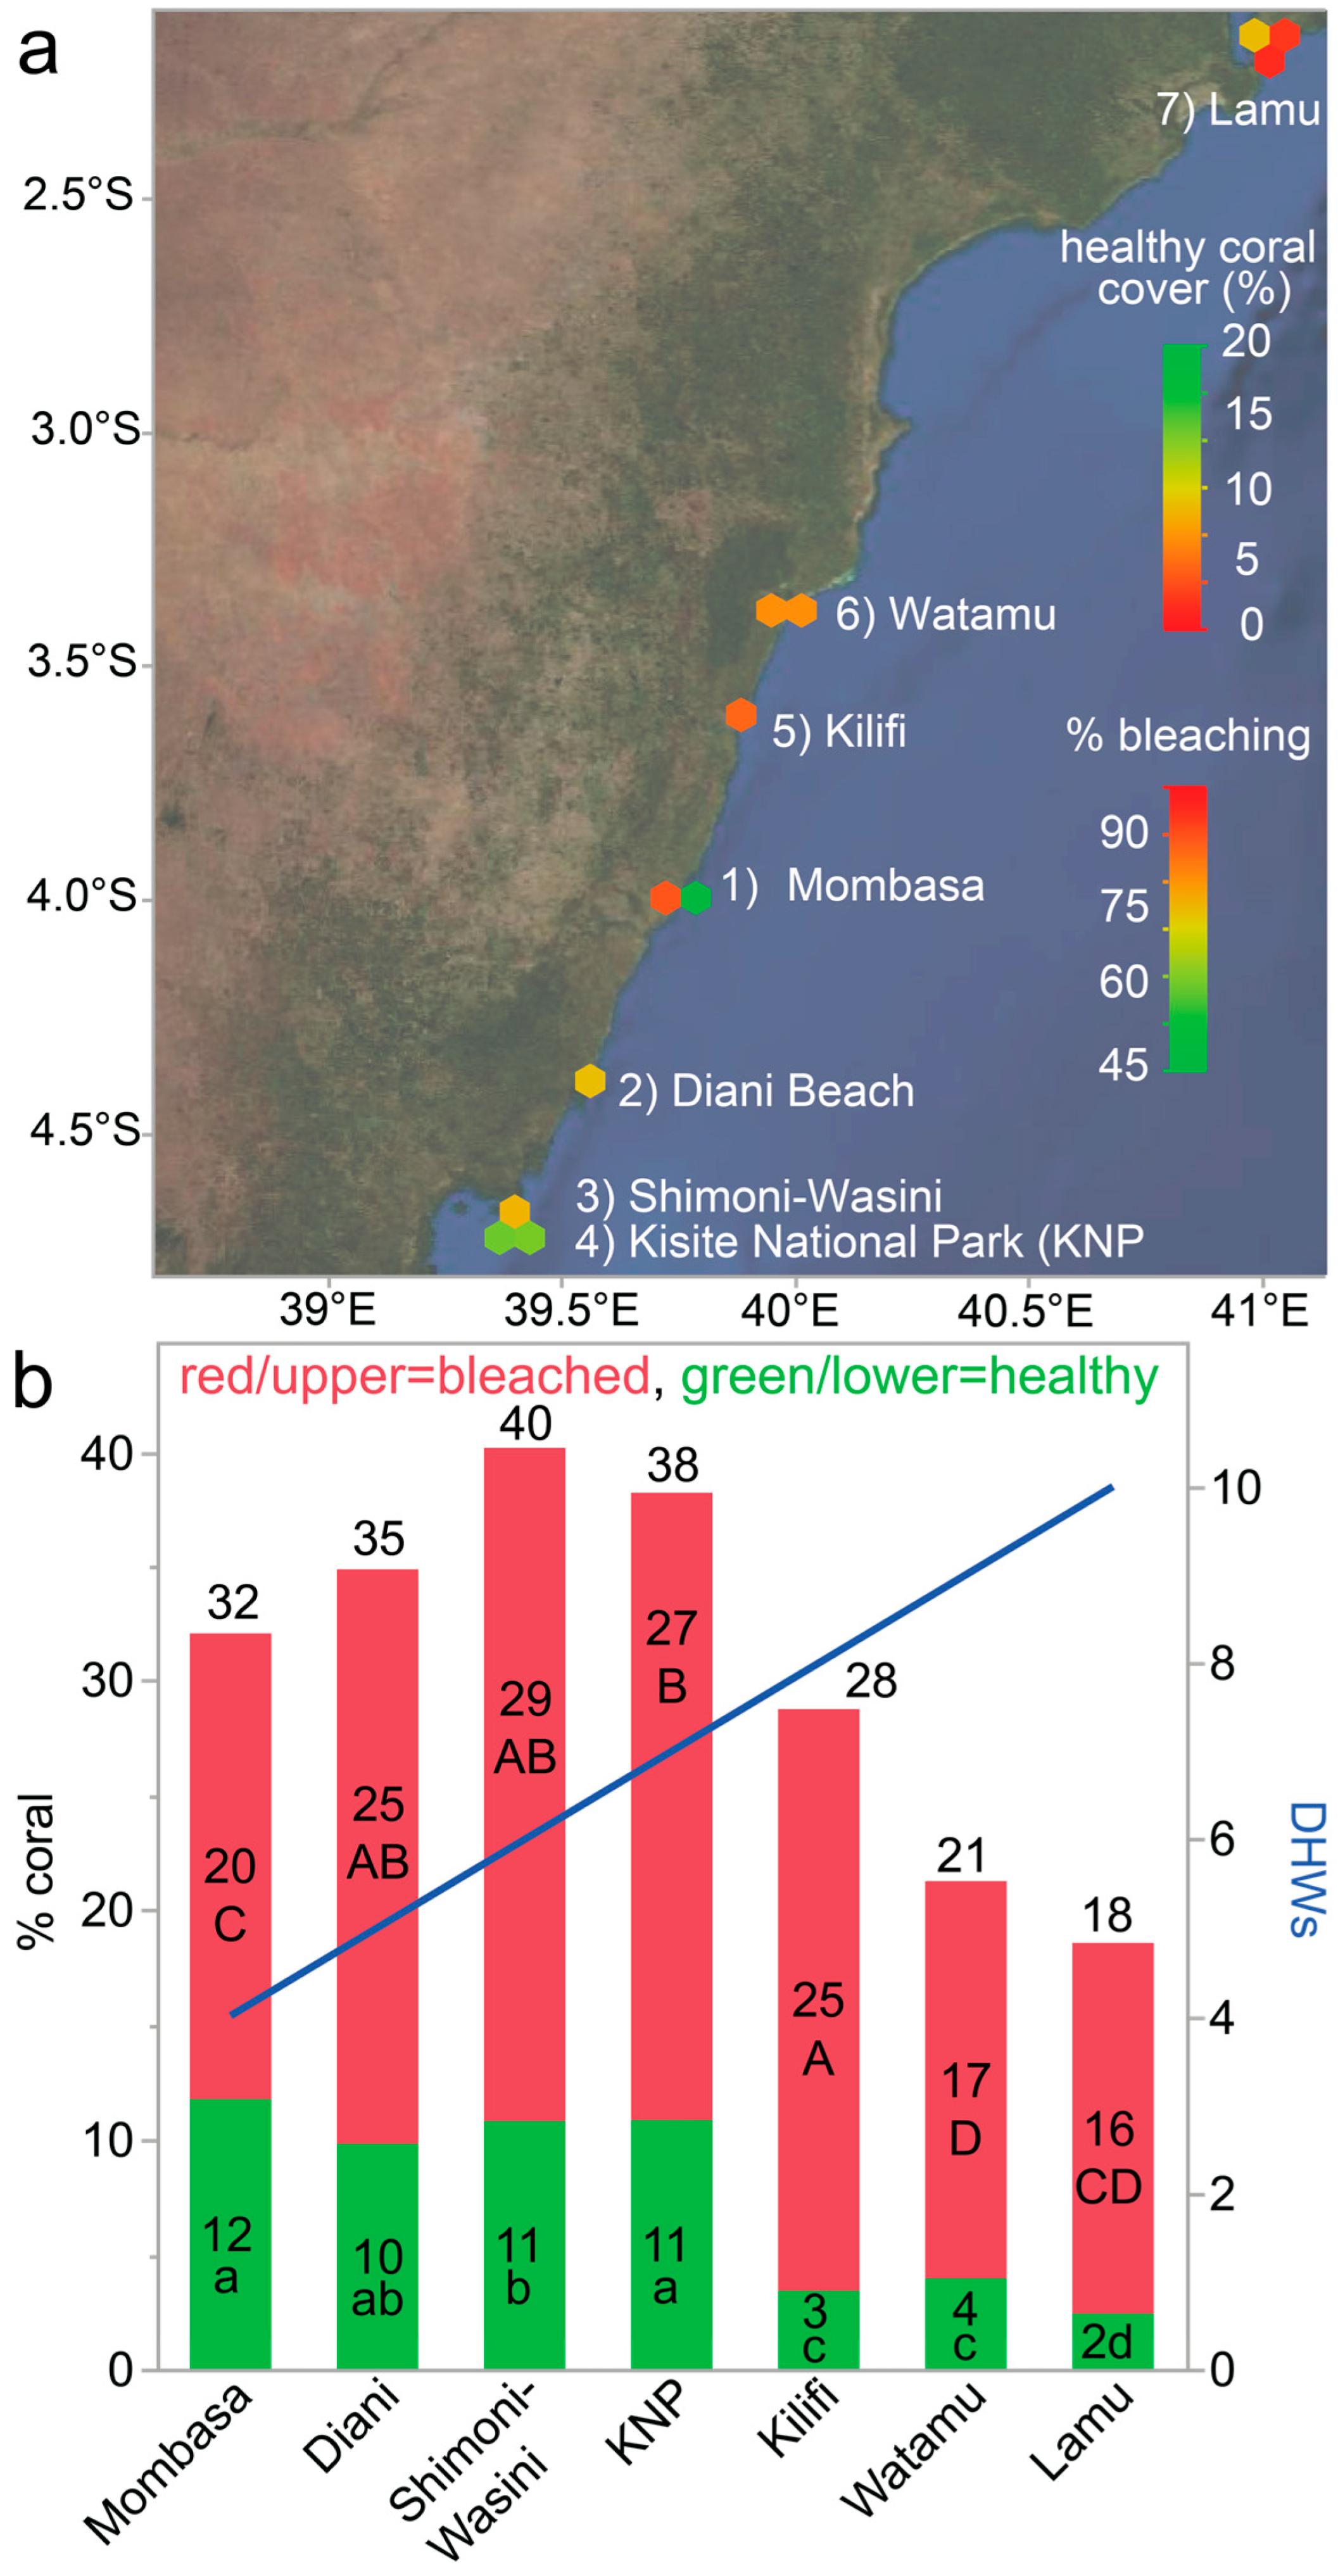
As a result of this bleaching event, percentages of unbleached coral were relatively low (Figure 5a); healthy corals comprised on average only 7.6 ± 6.1% of the benthos, though healthy coral cover varied significantly across sites (Kruskal–Wallis X2 = 609, p = ~0) and ranged from <1% at North Canyon (Watamu) to 22% at the popular tourist site “Coral Garden” (Supplemental Figure S2) in Kisite National Park. In contrast, healthy+bleached (total) coral cover comprised 29.9% of the benthos. The resulting % bleaching of 75% is slightly lower than the 77% value mentioned above because of slight differences in calculations (raw vs. summarized data). Because surveys were conducted in the middle of the bleaching event, few recently dead corals were seen (324/69,000 annotations, or about 0.5% cover of dead coral); this value would surely have risen over the course of April 2024 and beyond and will be critical to evaluate in follow-up surveys seeking to assess recovery.
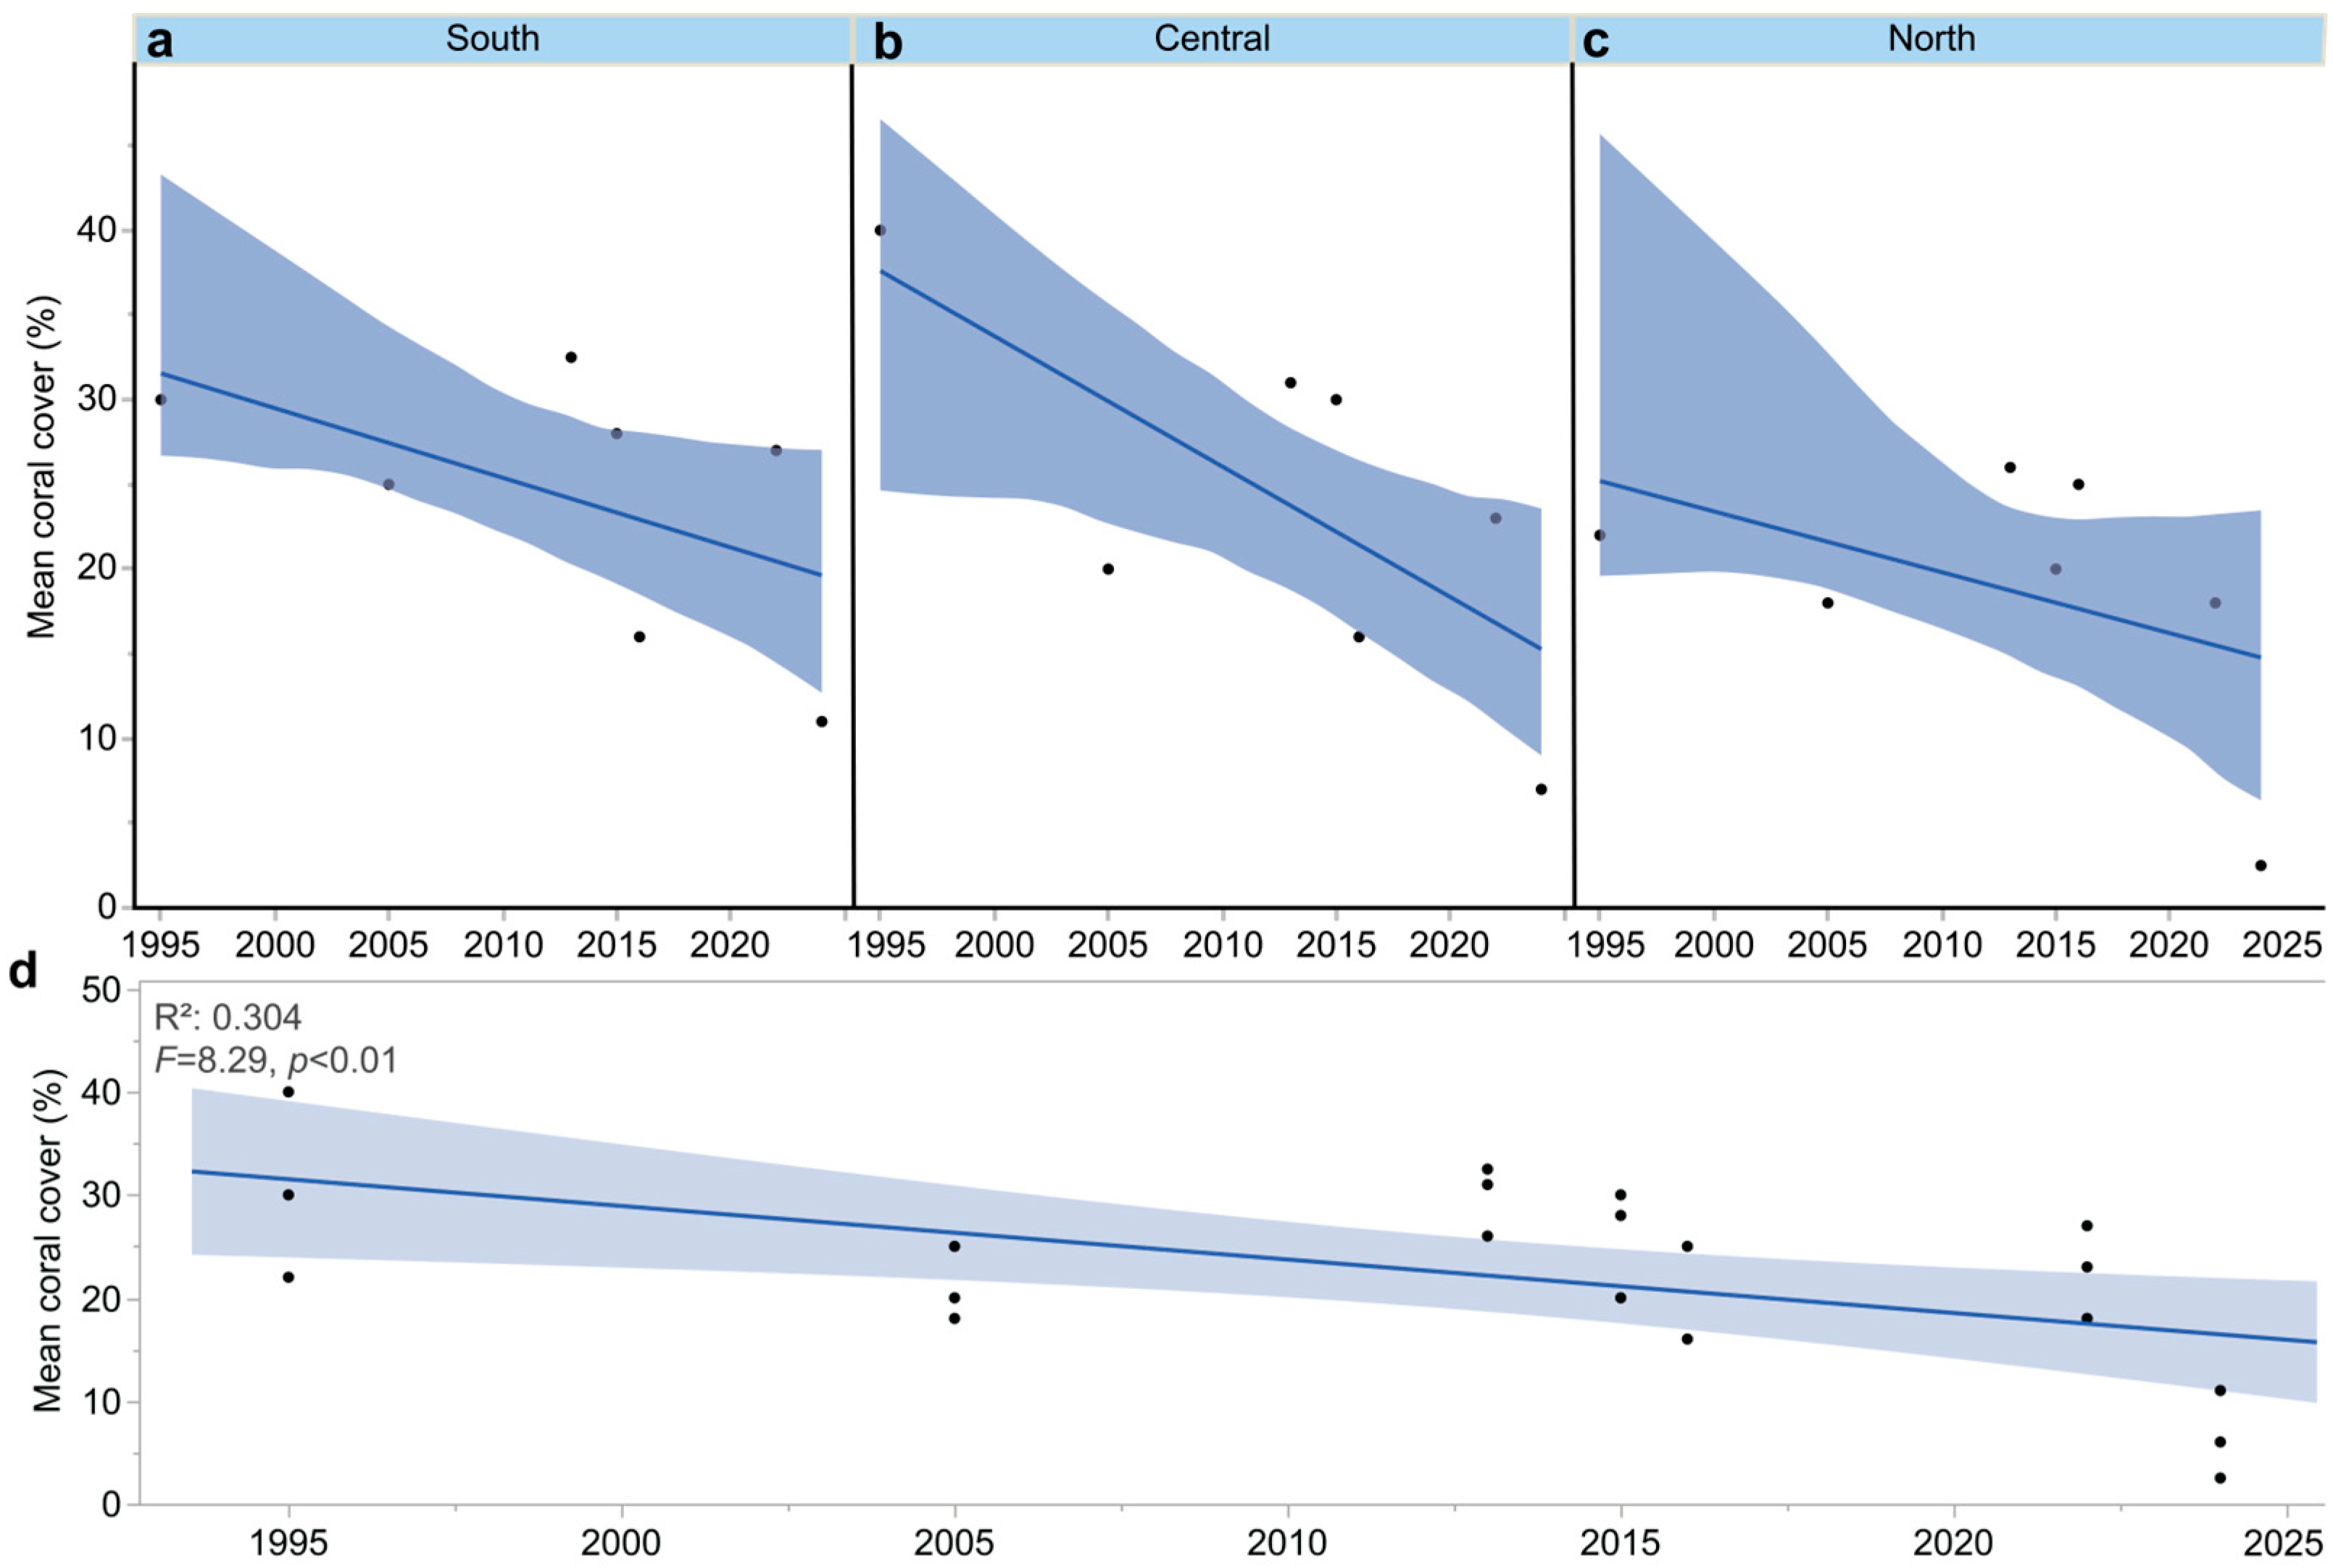
The “south” (Figure 6a), “central” (Figure 6b), and “northern” (Figure 6c) distinctions follow Karisa et al. [25]. The 1995 [26,27], 2005 [28], 2013 [29], 2015 [30], 2016 [25], 2022 [31], and 2024 (herein) data have been summarized for each region, as well as pooled over time across all three (Figure 6d). In the 1995 surveys of Obura [26] and McClanahan [27], which occurred before the first documented global mass coral bleaching event in 1998, healthy coral cover averaged 30, 40, and 22% in the southern (Figure 6a), central (Figure 6b), and northern (Figure 6c) regions, respectively (overall mean = 31 ± 9%; Figure 6d). In Kwale and Mombasa counties, cover declined from ~30 to ~10% as a result of the 1998 bleaching event [26], gradually increasing to 18–40% in the following decade [32].
Across all sites, healthy coral cover has decreased from ~30% in the late 1990s to 7.5% at present. How much this decrease can be attributed to any one bleaching event is difficult to ascertain, though the 2024 bleaching event was significantly more detrimental than the 2016 one, in which Gudka et al. [33] reported that only 10% of colonies bleached in response to 4–5 DHWs; this did not elicit a significant change in coral cover for any region except Lamu (Table 3; ~50% loss of coral vs. the preceding survey). There was a minor event in 2005, and although data were not collected, Obura [34] estimated that bleaching was not as severe as in 1998. There was another minor event in 2007 (Table 3), which elicited mild bleaching at Watamu. Although coral bleaching data were not made publicly available, reefs experienced nearly 10 DHWs in 2010, a value surpassed only by the 13–14 DHWs in the 2024 event described herein. Based on Figure 6d, there was not a pronounced decrease in live coral cover in the years following the 2010 bleaching event; knowing whether corals resisted bleaching then or instead bleached and recovered would be interesting for modeling coral resilience in the region. Maybe some of the corals that resisted bleaching in 2024 represent populations that survived previous thermal stress events in the region and are hence evidence for pronounced acclimatization or even adaptation.
In a meta-analysis of both their own data [34] and data submitted to the Global Coral Reef Monitoring Network (GCRMN) [35], Gudka et al. [36] estimated that a typical Kenyan reef has, on average, experienced at minimum a 30% loss of coral cover since the late 1990s. The last survey included was 2023, and though those data were not made publicly available, coral cover may still have been as high as 20–23% based on CORDIO’s 2022 surveys. If this is the case, then the decline from upwards of 23% in 2023 to 7.5% represents a 67% drop in coral cover in under two years. Although atypical, some sites actually experienced increases in coral cover over time (Table 3) due to active coral reef restoration by REEFoLution and other agencies.
Karisa et al. [25] reported a live coral cover of only 12% at the Coral Gardens site in Kisite National Park (Supplemental Figure S2) in 2015–2016 vs. 22% herein. Although the total coral cover there was an impressive 55% of the benthos in March 2024, nearly 59% of these were bleaching; how many of these perished, as well as how many of the 22% unbleached ones proceeded to bleach over the course of March–April of 2024, will be uncovered through an upcoming GCRMN meta-analysis (see footnote in Table 3). What can be said now is that, across all 22 Kenyan sites surveyed in March–April of 2024, healthy coral cover was only 7.5%, with bleached coral cover averaging 22% (i.e., 75% of all coral tissue surface area bleached). If 100% of these bleached corals perish, these reefs will have experienced, on average, a 75% decrease in healthy coral cover since the late 1990s. If half of them instead recover (7.5% never-having-bleached+11% bleached-then-recovered = 18.5% healthy coral cover), coral cover will have decreased by only ~35–50% since that time.
Table 3. Ecological impacts of prior Kenya bleaching events. The percent (%) changes were calculated by taking the coral cover values of the most recent survey prior to the bleaching event versus the most recent one afterwards and so do not necessarily reflect the % change from the respective bleaching event to the present day. DHWs = degree-heating weeks. NC = no change. NR = not reported.
RegionGeographic Zone% Bleaching
(% of Colonies)
% Change in Coral Cover: Pre- vs. Post-Event2024 Bleaching: % of All Coral Tissue Surface Area
1998 event [24,37]: 8–9 DHWs
MombasaCentral>90% [24](−)55% [37]61%
DianiSouthNR(−)60% [37]75%
Kisite National ParkSouthNR(−)55% [37]73%
WatamuCentralNR(−)76% [37]83%
2007 (minor) event [38,39]: <1 DHW
MombasaCentral27% [38]NC [38]See above.
WatamuCentral20% [39](−)33% [39]See above.
2016 event [33]: 4–5 DHWs
MombasaCentralNR(−)11%See above.
ShimoniSouthNR(+)14%73%
KilifiCentralNRNC88%
WatamuCentralNRNCSee above.
LamuNorthNR(−)52%88%
The comprehensive Western Indian Ocean 2024 bleaching event report [40] is currently being compiled and comprises at least 85 datasets (including my own).

3.5. Sources of Error and Bias

CoralNet was prone to false-positive bleaching classifications; a portion of the 75–77% of all corals that were bleached were actually normally pigmented. Assuming (1) no further bleaching after the final survey date (which is unlikely as the number of DHWs continued to climb) and (2) the AI did not continue to improve after the aforementioned bleaching coral classification analysis, the actual percent bleaching could be nearly 25% less, or 57%. This means that the bleached coral cover (percent of benthos occupied by bleaching corals) could also be 25% less, with the difference then added to the healthy coral cover; this results in a healthy coral cover of 13–14% using these “optimistic” conditions. While nearly 2-fold higher than the most pessimistic calculation of 7.5% healthy cover, this nevertheless represents a 50% drop in healthy coral cover from the prior year, or a 67% decline since the late 1990s. Reefs of Malindi, which were not surveyed herein due to poor weather conditions, also underwent 67–75% declines in healthy coral cover as a result of past mass bleaching events [41], and healthy coral cover there in 2004 was only ~23% (based on my own analysis of 2003–2004 unpublished ReefCheck data).
The mean percents of all coral tissues bleached were calculated for the 11 tourist and 11 non-tourist sites, and the values obtained—75 ± 19% and 79 ± 11%, respectively—did not differ significantly (Wilcoxon test, Z = −0.15, p = 0.88). Healthy coral cover of tourist and non-tourist sites were also statistically similar (Wilcoxon test, Z = −0.15, p = 0.88): 8.7 ± 7.5% and 6.6 ± 4.7%, respectively. As such, the tourist operators were not taking guests to reefs with significantly higher coral abundance (or significantly less severe bleaching).
To what degree findings from this citizen science+AI approach agree with those of more typical, point-intercept or other transect- or photo-quadrat-based surveys [42] will be unveiled in the near future as local agencies like CORDIO synthesize the large amounts of survey data submitted to them by scientists and citizen scientists alike (CORDIO has access to all data presented herein; see Table 3). At an accuracy of ~85%, the approach cannot currently compete with a competent scientist/surveyor. However, a far larger area of coral reef can be characterized. Two further drawbacks of this approach are (1) the need for persistent white-balancing to ensure that colors are representative of the in situ condition and (2) the decrease in accuracy with depth. Although the latter was not quantified herein, lower light levels are inherently associated with lower resolution, and even expensive strobes taken to, for instance, 20 m, cannot image large (>5 m2) reefscapes. Even structure-from-motion approaches, which can capture even larger reef areas than the random swimming approach used herein, suffer from light limitation issues unless very powerful, expensive strobes are attached to the frames upon which the cameras are mounted [43].

3.6. Depth Effects

The degree of correlation between DHWs and percent coral bleaching (Figure 4), while statistically significant, was lower than expected; DHWs explained only ~one-third of the variation. From Figure 5b, there does appear to be an inverse relationship between healthy coral cover (assessed against the entire benthos) and DHWs; worse bleaching was observed at the sites surveyed later in March through early April in the central and northern regions of the country. One reason why the correlation is not stronger is because of depth effects; half of the Watamu sites and all Lamu ones were <5 m (Table 1), and bleaching was catastrophic at these sites (see Supplemental Document S1 for details on Watamu). Given that bleaching is not only a factor of high temperatures, but high temperatures plus relatively (or abnormally) high light levels [44], the higher prevalences of bleaching at these sites could be just as strongly linked to their shallow depths as their higher numbers of DHWs. For this reason, stepwise regression was performed with temperature, DHWs, and mean depth of imaged colony as predictors, though only DHWs were included in the optimal model (adj. R2 = 0.30, BIC = 165). Inclusion of depth raised the BIC to 167 and reduced the adjusted R2 to 0.27. The R2 between colony depth and bleaching percentage was <0.07 (Figure 7), and despite the absence of a significant effect of depth (as three bins), the bleaching percentage was ~15% higher at 0–5 m vs. the other two depth bins. Bleaching was particularly severe in the shallows (1–2 m) of Watamu.

4. Conclusions

The 13 DHWs that transpired by mid-April of 2024 were the highest ever documented for Kenya’s reefs, and although several sites have actually undergone small increases in coral cover over time due to local restoration efforts [45], the majority of sites have experienced >50% decreases in coral cover since monitoring began in the 1990s. Over three quarters of the scleractinians within the 11–12 hectares of imaged reef (out of 63,000 ha of total reef area for Kenya [46]) were bleached at the time of surveying, and bleaching percentages were similar between tourist and long-term monitoring sites. Although it will not be possible to verify these high bleaching percentages given the absence of gold standard surveys performed using traditional methods at the same time and at the same reefs, follow-up surveys can at least determine the degree of coral mortality that resulted from this mass bleaching event. Far fewer DHWs were documented in the hottest months of 2025 (Figure 3), hopefully giving some of the surviving corals a chance to recover until yet another catastrophic marine heatwave comes to pass.
With respect to the citizen science + AI approach, if divers white balance regularly at depths shallower than ~15 m (down to 20 m in high-clarity areas), they need only submit their photos to CoralNet, which is open access, and either the AI itself or coral scientists can proceed with the annotations. This simplicity allows us to empower many millions of certified SCUBA divers with smart phones in water-proof pouches (~USD 10) or underwater cameras (~USD 300–400), alongside internet capacity, to become our collective “eyes” on the reef, thereby enabling large-scale coral reef monitoring even in areas lacking scientists with formal training in coral reef ecology; indeed, these data could even be integrated with remote sensing data acquired by satellites and other means, an area of coral reef monitoring that is also benefiting from advances in AI [47].

Supplementary Materials

The following supporting information can be downloaded at https://www.mdpi.com/article/10.3390/environments12080276/s1: Supplemental File S1, which features all quantitative data presented, Supplemental Figure S1 (a comparison of two temperature-logging methods), Supplemental Figure S2 (an image of a bleaching reef), and Supplemental Document S1 (the field notes associated with two long-term monitoring sites at Watamu: Round Reef and Uyombo). Note that the two supplemental figures are within the same Word document.

Funding

This work was funded by the Coral Research and Development Accelerator Platform and King Abdullah University of Science and Technology (both in Saudi Arabia).

Data Availability Statement

All analyzed images are publicly available on the serving hosting the AI used to analyze them: CoralNet (https://coralnet.ucsd.edu/source/4963/ (accessed on 2 June 2025)). The raw data extracted from CoralNet analysis of these images have been provided in Supplemental File S1. Enhanced, processed versions of all images can be found on both coralreefdiagnostics.com (search for “Kenya” under the hamburger menu.) and my Adobe Portfolio (https://andersonblairmay.myportfolio.com/kenya (accessed on 2 June 2025)).

Acknowledgments

I am immensely grateful to all of the local scientists (Table 1), dive operators, and genuinely friendly, inspiring, and curious locals I met along the entire Swahili coastline of Kenya. Thanks also to ReefCheck for allowing me to access their comprehensive citizen science survey dataset.

Conflicts of Interest

The author declares no conflicts of interest. The funders had no role in the design of the study; in the collection, analyses, or interpretation of data; in the writing of the manuscript; or in the decision to publish the results.

Abbreviations

The following abbreviations are used in this manuscript:
AIArtificial intelligence
BICBayesian information criterion
DHWsDegree-heating weeks
FNRFalse-negative bleaching classification rate
FPRFalse-positive bleaching classification rate
GCRMNGlobal Coral Reef Monitoring Network
HSHot spot
NCNo change (detected)
NRNot reported (in manuscript)
SSTSea surface temperatures
Temp.Temperature

References

  1. Reimer, J.D.; Peixoto, R.S.; Davies, S.W.; Traylor-Knowles, N.; Short, M.L.; Cabral-Tena, R.A.; Burt, J.A.; Pessoa, I.; Banaszak, A.T.; Winters, R.S.; et al. The Fourth Global Coral Bleaching Event: Where Do We Go from Here? Coral Reefs 2024, 43, 1121–1125. [Google Scholar] [CrossRef]
  2. Hoegh-Guldberg, O. Climate change, coral bleaching and the future of the world’s coral reefs. Mar. Freshw. Res. 1999, 50, 839–866. [Google Scholar] [CrossRef]
  3. Hughes, T.P.; Kerry, J.T.; Baird, A.H.; Connolly, S.R.; Dietzel, A.; Eakin, C.M.; Heron, S.F.; Hoey, A.S.; Hoogenboom, M.O.; Liu, G.; et al. Global warming transforms coral reef assemblages. Nature 2018, 556, 492–496. [Google Scholar] [CrossRef]
  4. McClanahan, T.; Muthiga, N.; Mangi, S. Coral and Algal Changes after the 1998 Coral Bleaching: Interaction with Reef Management and Herbivores on Kenyan Reefs. Coral Reefs 2001, 19, 380–391. [Google Scholar] [CrossRef]
  5. Obura, D.O. Resilience and climate change: Lessons from coral reefs and bleaching in the Western Indian Ocean. Estuar. Coast. Shelf Sci. 2005, 63, 353–372. [Google Scholar] [CrossRef]
  6. McClanahan, T.R.; Baird, A.H.; Marshall, P.A.; Toscano, M.A. Comparing Bleaching and Mortality Responses of Hard Corals between Southern Kenya and the Great Barrier Reef, Australia. Mar. Pollut. Bull. 2004, 48, 327–335. [Google Scholar] [CrossRef]
  7. McClanahan, T.; Maina, J.; Pet-Soede, L. Effects of the 1998 Coral Morality Event on Kenyan Coral Reefs and Fisheries. AMBIO 2002, 31, 543–550. [Google Scholar] [CrossRef]
  8. McClanahan, T.R.; Ateweberhan, M.; Omukoto, J. Long-Term Changes in Coral Colony Size Distributions on Kenyan Reefs under Different Management Regimes and across the 1998 Bleaching Event. Mar. Biol. 2008, 153, 755–768. [Google Scholar] [CrossRef]
  9. McClanahan, T.R. Changes in Coral Sensitivity to Thermal Anomalies. Mar. Ecol. Prog. Ser. 2017, 570, 71–85. [Google Scholar] [CrossRef]
  10. Liu, G.; Heron, S.F.; Eakin, C.M.; Muller-Karger, F.E.; Vega-Rodriguez, M.; Guild, L.S.; Cour, J.L.; Geiger, E.F.; Skirving, W.J.; Burgess, T.F.R.; et al. Reef-Scale Thermal Stress Monitoring of Coral Ecosystems: New 5-Km Global Products from NOAA Coral Reef Watch. Remote Sens. 2014, 6, 11579–11606. [Google Scholar] [CrossRef]
  11. Marshall, N.J.; Kleine, D.A.; Dean, A.J. CoralWatch: Education, Monitoring, and Sustainability through Citizen Science. Front. Ecol. Environ. 2012, 10, 332–334. [Google Scholar] [CrossRef]
  12. Licuanan, W.Y.; Mordeno, P.Z.B.; Go, M.V. C30—A Simple, Rapid, Scientifically Valid, and Low-Cost Method for Citizen-Scientists to Monitor Coral Reefs. Reg. Stud. Mar. Sci. 2021, 47, 101961. [Google Scholar] [CrossRef]
  13. Done, T.; Roelfsema, C.; Harvey, A.; Schuller, L.; Hill, J.; Schläppy, M.-L.; Lea, A.; Bauer-Civiello, A.; Loder, J. Reliability and Utility of Citizen Science Reef Monitoring Data Collected by Reef Check Australia, 2002–2015. Mar. Pollut. Bull. 2017, 117, 148–155. [Google Scholar] [CrossRef]
  14. Mayfield, A.B.; Dempsey, A.C. Using Tourist Diver Images to Estimate Coral Cover and Bleaching Prevalence in a Remote Indian Ocean Coral Reef System. Biodivers. Conserv. 2025. under review. [Google Scholar]
  15. Chowdhury, A.; Jahan, M.; Kaisar, S.; Khoda, M.E.; Rajin, S.M.A.K.; Naha, R. Coral Reef Surveillance with Machine Learning: A Review of Datasets, Techniques, and Challenges. Electronics 2024, 13, 5027. [Google Scholar] [CrossRef]
  16. Zhang, C. Applying Data Fusion Techniques for Benthic Habitat Mapping and Monitoring in a Coral Reef Ecosystem. ISPRS J. Photogramm. Remote Sens. 2015, 104, 213–223. [Google Scholar] [CrossRef]
  17. Lawson, C.L.; Chartrand, K.M.; Roelfsema, C.M.; Kolluru, A.; Mumby, P.J. Broadscale Reconnaissance of Coral Reefs from Citizen Science and Deep Learning. Environ. Monit. Assess. 2025, 197, 814. [Google Scholar] [CrossRef]
  18. Burns, J.H.R.; Delparte, D.; Gates, R.D.; Takabayashi, M. Integrating Structure-from-Motion Photogrammetry with Geospatial Software as a Novel Technique for Quantifying 3D Ecological Characteristics of Coral Reefs. PeerJ 2015, 3, e1077. [Google Scholar] [CrossRef] [PubMed]
  19. Mayfield, A.B. Characterizing the 2024 Red Sea Bleaching Event with Tourist Diver Photos. Environments 2025, 12, 248. [Google Scholar] [CrossRef]
  20. Wright, S.; Hull, T.; Sivyer, D.B.; Pearce, D.; Pinnegar, J.K.; Sayer, M.D.J.; Mogg, A.O.M.; Azzopardi, E.; Gontarek, S.; Hyder, K. SCUBA Divers as Oceanographic Samplers: The Potential of Dive Computers to Augment Aquatic Temperature Monitoring. Sci. Rep. 2016, 6, 30164. [Google Scholar] [CrossRef]
  21. Marlowe, C.; Hyder, K.; Sayer, M.D.J.; Kaiser, J. Citizen Scientists’ Dive Computers Resolve Seasonal and Interannual Temperature Variations in the Red Sea. Front. Mar. Sci. 2022, 9, 976771. [Google Scholar] [CrossRef]
  22. Beijbom, O.; Edmunds, P.J.; Roelfsema, C.; Smith, J.; Kline, D.I.; Neal, B.P.; Dunlap, M.J.; Moriarty, V.; Fan, T.-Y.; Tan, C.-J.; et al. Towards Automated Annotation of Benthic Survey Images: Variability of Human Experts and Operational Modes of Automation. PLoS ONE 2015, 10, e0130312. [Google Scholar] [CrossRef] [PubMed]
  23. Siebeck, U.; Marshall, N.; Klüter, A.; Hoegh-Guldberg, O. Monitoring Coral Bleaching Using a Colour Reference Card. Coral Reefs 2006, 25, 453–460. [Google Scholar] [CrossRef]
  24. Mdodo, R.M. Environmental Factors and Coral Bleaching in Kenya. Master’s Thesis, Moi University, Kesses, Kenya, 1999. [Google Scholar]
  25. Karisa, J.F.; Obura, D.O.; Chen, C.A. Spatial Heterogeneity of Coral Reef Benthic Communities in Kenya. PLoS ONE 2020, 15, e0237397. [Google Scholar] [CrossRef]
  26. Obura, D.O. Kenya. Mar. Pollut. Bull. 2001, 42, 1264–1278. [Google Scholar] [CrossRef]
  27. McClanahan, T. Coral Bleaching, Diseases and Mortality in the Western Indian Ocean. In Coral Health and Disease; Rosenberg, E., Loya, Y., Eds.; Springer: Berlin/Heidelberg, Germany, 2004; pp. 157–176. ISBN 978-3-662-06414-6. [Google Scholar]
  28. Graham, N.A.J.; McClanahan, T.R.; MacNeil, M.A.; Wilson, S.K.; Polunin, N.V.C.; Jennings, S.; Chabanet, P.; Clark, S.; Spalding, M.D.; Letourneur, Y.; et al. Climate Warming, Marine Protected Areas and the Ocean-Scale Integrity of Coral Reef Ecosystems. PLoS ONE 2008, 3, e3039. [Google Scholar] [CrossRef]
  29. Allen, K.A.; Bruno, J.F.; Chong, F.; Clancy, D.; McClanahan, T.R.; Spencer, M.; Żychaluk, K. Among-Site Variability in the Stochastic Dynamics of East African Coral Reefs. PeerJ 2017, 5, e3290. [Google Scholar] [CrossRef]
  30. UNEP; WIOMSA. The Regional State of the Coast Report: Western Indian Ocean; UNEP: Nairobi, Kenya, 2015; 546p. [Google Scholar]
  31. McClanahan, T.R.; Darling, E.S.; Maina, J.M.; Campbell, S.J.; Ateweberhan, M.; Muthiga, N.A. Long-Term Changes in Coral Reef Assemblages in Kenya. Mar. Pollut. Bull. 2023, 194, 115210. [Google Scholar] [CrossRef]
  32. Obura, D.O.; Church, J.E.; Gabrié, C. Assessing Marine World Heritage from an Ecosystem Perspective: The Western Indian Ocean; World Heritage Centre, United Nations Education, Science and Cultural Organization (UNESCO): Paris, France, 2012; 124p. [Google Scholar]
  33. Gudka, M.; Obura, D.; Mwaura, J.; Porter, S.; Yahya, S.; Mabwa, R. Impact of the 3rd Global Coral Bleaching Event on the Western Indian Ocean in 2016; Global Coral Reef Monitoring Network (GCRMN)/Indian Ocean Commission: London, UK, 2018; p. 67. [Google Scholar]
  34. Obura, D. East Africa-Summary. In Coral Reef Degradation in the Indian Ocean: Status Report 2005; Souter, D., Linden, O., Eds.; CORDIO: Stockholm, Sweden, 2005; pp. 25–31. [Google Scholar]
  35. Souter, D.; Planes, S.; Wicquart, J.; Logan, M.; Obura, D.; Staub, F. (Eds.) Status of Coral Reefs of the World: 2020 Report; Global Coral Reef Monitoring Network (GCRMN) and International Coral Reef Initiative (ICRI): London, UK, 2021. [Google Scholar] [CrossRef]
  36. Gudka, M.; Obura, D.; Treml, E.; Samoilys, M.; Aboud, S.A.; Osuka, K.E.; Mbugua, J.; Mwaura, J.; Karisa, J.; Knoester, E.G.; et al. Leveraging the Red List of Ecosystems for Action on Coral Reefs through the Kunming-Montreal Global Biodiversity Framework. Conserv. Sci. Pract. 2024, 6, e13255. [Google Scholar] [CrossRef]
  37. McClanahan, T.R.; Ateweberhan, M.; Muhando, C.A.; Maina, J.; Mohammed, M.S. Effects of Climate and Seawater Temperature Variation on Coral Bleaching and Mortality. Ecol. Monogr. 2007, 77, 503–525. [Google Scholar] [CrossRef]
  38. Grimsditch, G.; Mwaura, J.M.; Kilonzo, J.; Amiyo, N. The Effects of Habitat on Coral Bleaching Responses in Kenya. AMBIO 2010, 39, 295–304. [Google Scholar] [CrossRef]
  39. Montano, S.; Seveso, D.; Galli, P.; Obura, D.O. Assessing Coral Bleaching and Recovery with a Colour Reference Card in Watamu Marine Park, Kenya. Hydrobiologia 2010, 655, 99–108. [Google Scholar] [CrossRef]
  40. Mbugua, J.; Aboud, S.; Obura, D. Western Indian Ocean-Regional Coral Bleaching Report 2024. Zenodo: 2024. Available online: https://icriforum.org/wp-content/uploads/2024/07/WIO-bleaching-2024_summary-report.pdf (accessed on 15 May 2025).
  41. Lambo, A.L.; Ormond, R.F.G. Continued Post-Bleaching Decline and Changed Benthic Community of a Kenyan Coral Reef. Mar. Pollut. Bull. 2006, 52, 1617–1624. [Google Scholar] [CrossRef]
  42. Head, C.E.I.; Bayley, D.T.I.; Rowlands, G.; Roche, R.C.; Tickler, D.M.; Rogers, A.D.; Koldewey, H.; Turner, J.R.; Andradi-Brown, D.A. Coral Bleaching Impacts from Back-to-Back 2015–2016 Thermal Anomalies in the Remote Central Indian Ocean. Coral Reefs 2019, 38, 605–618. [Google Scholar] [CrossRef]
  43. Remmers, T.; Grech, A.; Roelfsema, C.; Gordon, S.; Lechene, M.; Ferrari, R. Close-Range Underwater Photogrammetry for Coral Reef Ecology: A Systematic Literature Review. Coral Reefs 2024, 43, 35–52. [Google Scholar] [CrossRef]
  44. Gleason, D.F.; Wellington, G.M. Ultraviolet Radiation and Coral Bleaching. Nature 1993, 365, 836–838. [Google Scholar] [CrossRef]
  45. Knoester, E.G.; Rienstra, J.J.; Schürmann, Q.J.F.; Wolma, A.E.; Murk, A.J.; Osinga, R. Community-Managed Coral Reef Restoration in Southern Kenya Initiates Reef Recovery Using Various Artificial Reef Designs. Front. Mar. Sci. 2023, 10, 1152106. [Google Scholar] [CrossRef]
  46. ASCLME. National Marine Ecosystem Diagnostic Analysis. Kenya. Contribution to the Agulhas and Somali Current Large Marine Ecosystems Project (Supported by UNDP with GEF Grant Financing); 2012. Available online: https://nairobiconvention.org/clearinghouse/sites/default/files/National%20Marine%20Ecosystem%20Diagnostic%20Analysis%20%28MEDA%29%20-%20Kenya.pdf (accessed on 2 July 2025).
  47. Hamylton, S.M.; Zhou, Z.; Wang, L. What Can Artificial Intelligence Offer Coral Reef Managers? Front. Mar. Sci. 2020, 7, 603829. [Google Scholar] [CrossRef]
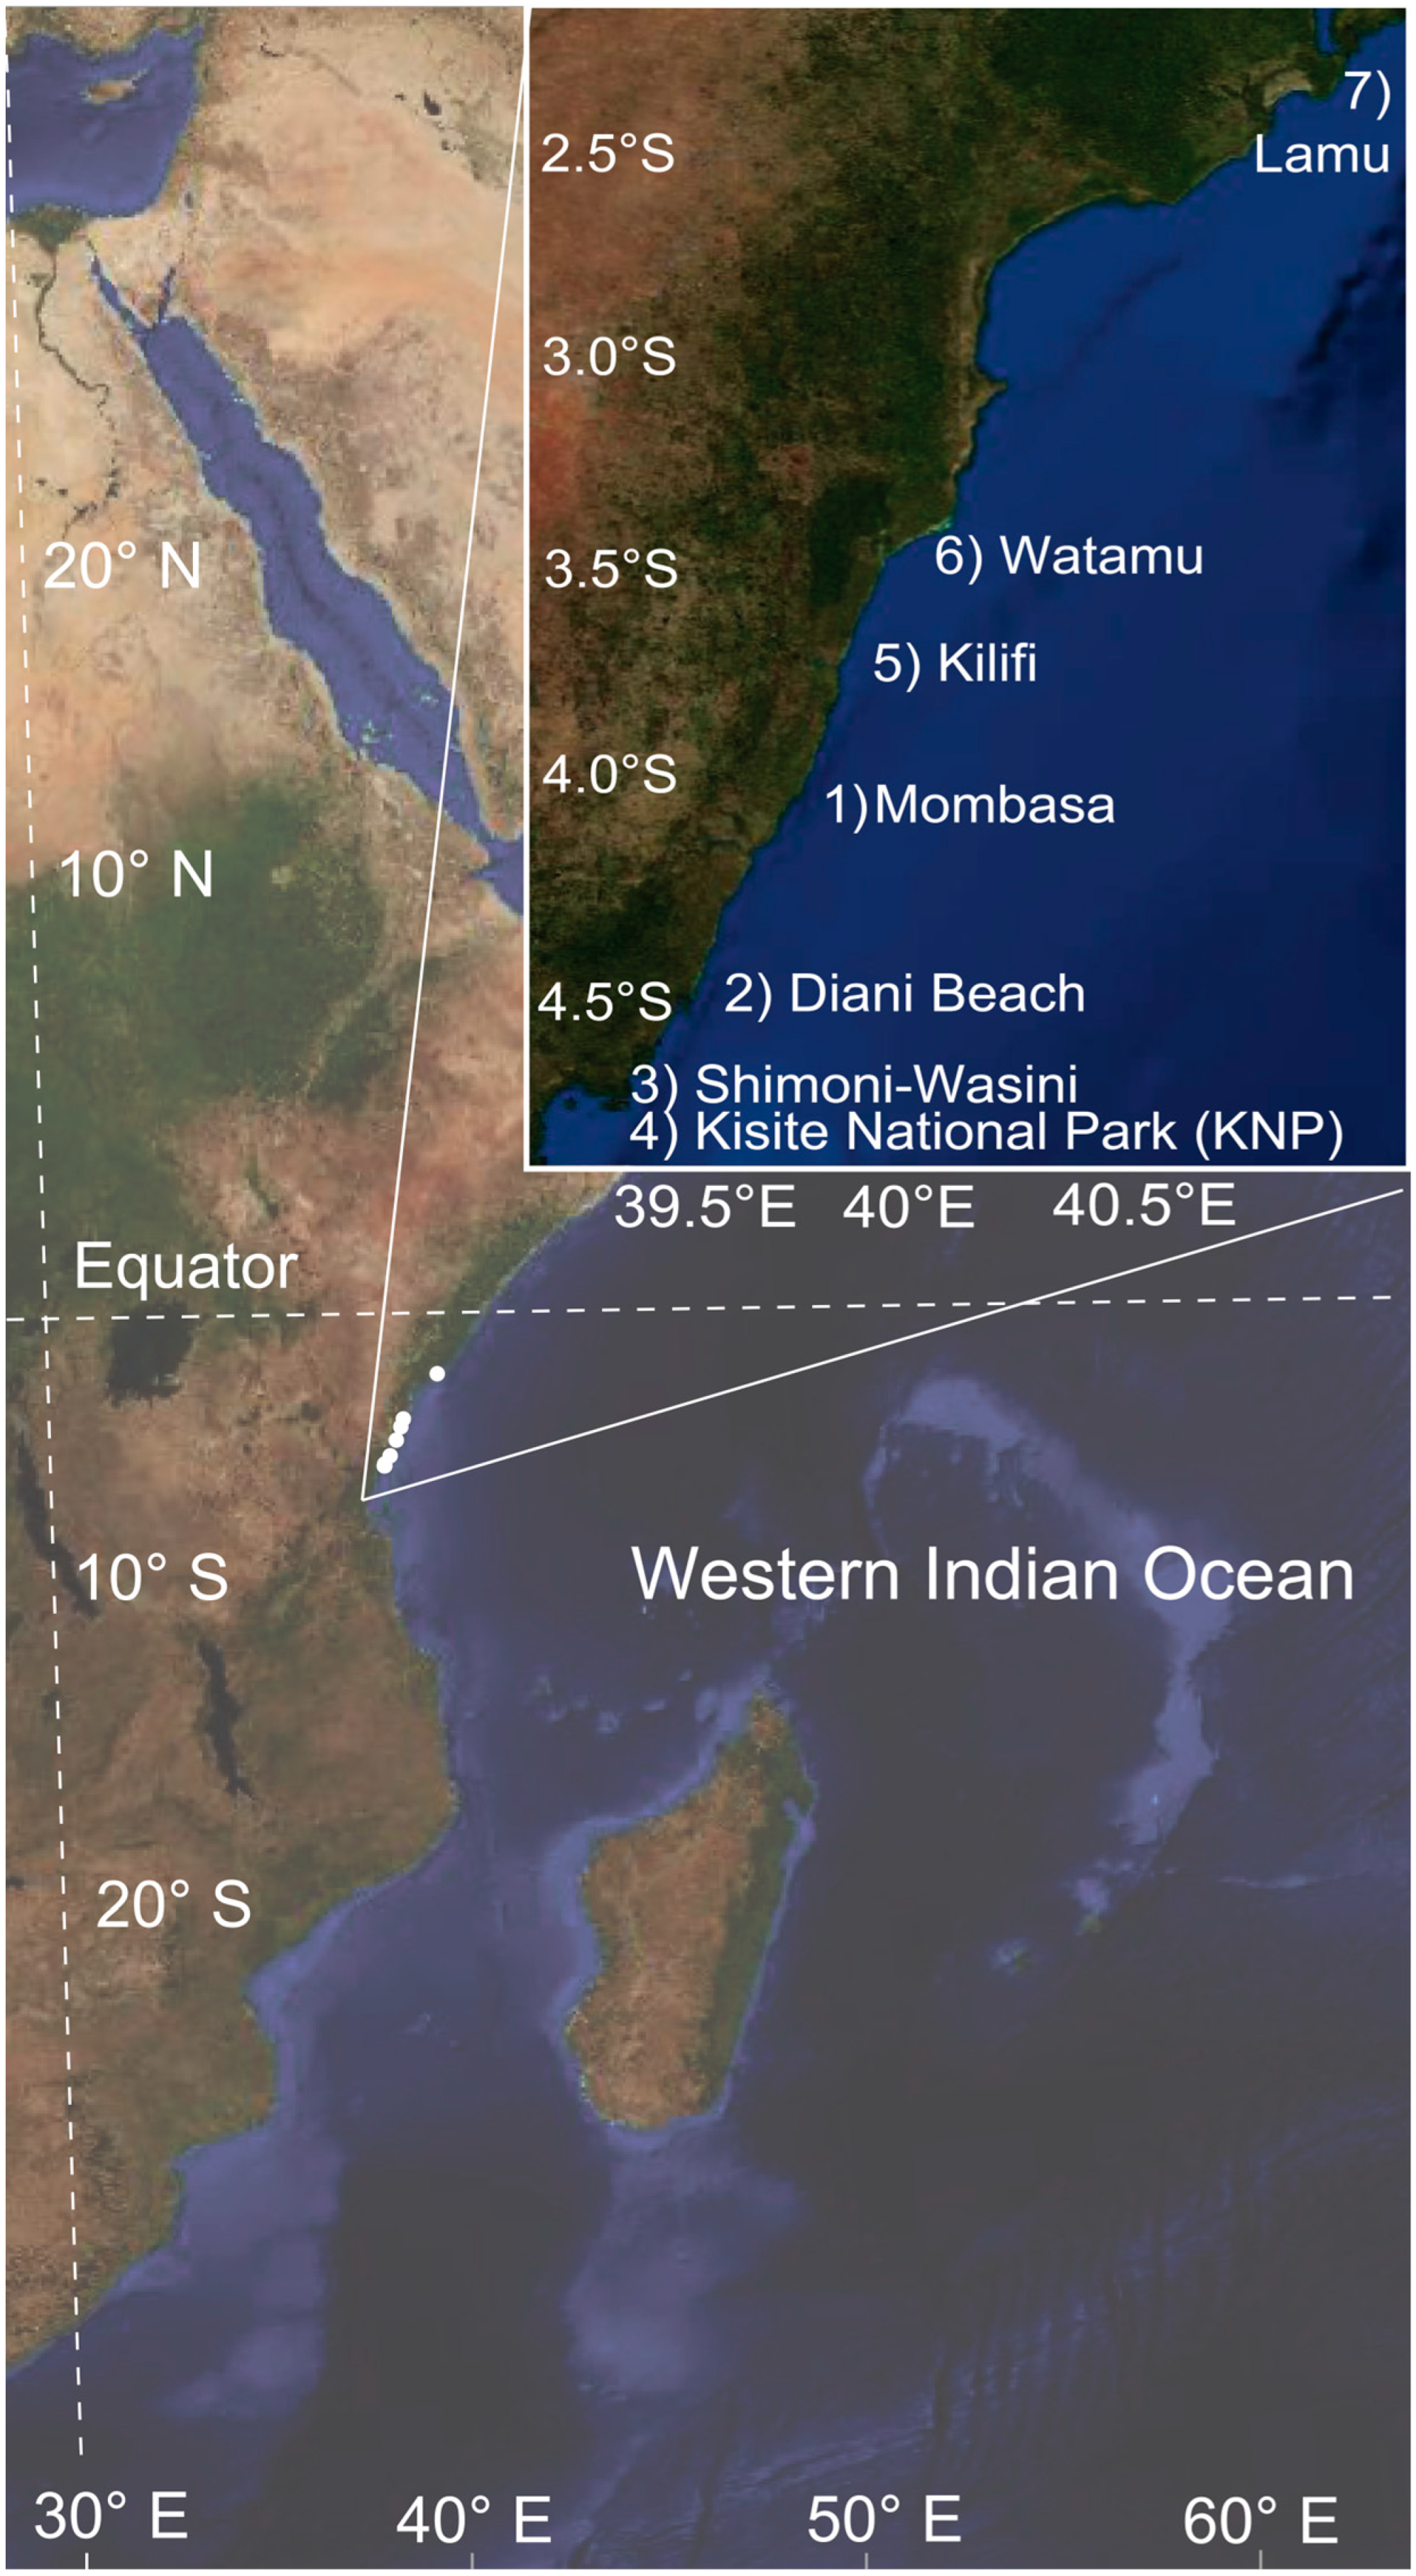
Figure 1. A map of Eastern Africa and the Western Indian Ocean with inset showing the study areas (numbered by order visited; see Table 1 for exact dates).
Environments 12 00276 g001
Figure 2. A representative image of the coral reef benthos. The 30 plus signs (“+”) were randomly overlaid by CoralNet. The label “HEAL” also corresponds to healthy corals and was included by accident; it was excluded from calculations.
Environments 12 00276 g002
Figure 3. Seawater temperature over the duration of the 2024 coral bleaching event along Kenya’s Swahili coastline. SST data from NOAA’s Coral Reef Watch (a) have been shown over a two-year period (ending in mid-May, the time of article submission), with panel (b) presenting a higher-resolution look into regional seawater temperature over a narrower time interval. HS = hot spot (current daily SST minus mean monthly maximum).
Environments 12 00276 g003
Figure 4. Regional variation in percent coral bleaching in Kenya. The left y-axis corresponds to the box plots (with means written either within or just above boxes) while the right y-axis corresponds to the orange line (number of degree-heating weeks [DHWs]), which reflects the average number of DHWs of all sites on that date. An inset shows the relationship between number of DHWs (NOAA SST-derived) and percentage of all coral tissues bleached across the 20 unique survey sites.
Environments 12 00276 g004
Figure 5. Healthy coral cover (%) and percent (%) coral bleaching at the survey sites. There are 12 hexagons instead of 20 (i.e., 1/site) in panel (a) because some represent the means of sites located nearby one another. A single hexagon shows both the healthy coral cover (upper legend) and mean % of all coral tissues bleached (lower legend), though note that the legend color schemes are inverted relative to one another (highest values in green and red, respectively). Also, healthy coral cover is scaled relative to the entire benthos, whereas % bleaching reflects the percentage of all coral tissue surface area that was bleached (Figure 4). Stacked bar charts portray differences in healthy (green/lower) vs. bleached (red/upper) coral percentages across the survey regions (b), and lowercase and uppercase letters signify non-parametric post-hoc differences in healthy and bleached coral cover, respectively (Kruskal–Wallis tests X2 = 414 and 210, respectively; p < 0.0001 for both). Values above the bars instead represent total % coral cover (healthy + bleached), and degree-heating weeks (DHWs; NOAA Coral Reef Watch estimates) are plotted along a navy blue line (right y-axis).
Environments 12 00276 g005
Figure 6. Declines in healthy coral cover over time in Kenya. Coral cover data from select references were plotted over time alongside the newly acquired 2024 data for three regions: south (a), central (b), and north (c). Shading about the best-fit trend lines represents 95% confidence, and panel (d) shows the data pooled across all regions over time.
Environments 12 00276 g006
Figure 7. Relationship between depth and bleaching prevalence across the 20 unique survey sites. The percentage of hard corals bleached (relative to total coral cover, not the benthos) was averaged across three depth bins: 0–5 m, 5–10 m, and >10 m.
Environments 12 00276 g007
Table 1. Summary of survey sites. Mean and maximum (max.) image depths have been shown, with the latter in parentheses. For the Shimoni-Wasini site, the exact coordinates have been included since the same area was surveyed twice. The temperatures (Temp.) were derived from a dive computer and reflect the mean across all sites within the respective region; see Figure 3 for NOAA SST data. DHWs = degree-heating weeks (on day of survey). KMFRI = Kenya Marine and Fisheries Research Institute. KNP = Kisite National Park. TS = tourist sites. Error terms represent standard deviation.
Region#TS/All SitesMean Image Depth (m) (max.)Dates (2024)Temp.- °C (DHWs)Latitudinal Range (°S)Longitudinal Range (°E)Key Local Agency
Mombasa 3/39.7 ± 5.9 (17)March 11–1432.5 (4)−3.975 to −3.99839.745 to 39.767KMFRI
Diani Beach 2/22.0 ± 3.0 (8)March 1632.0 (5)−4.377 to −4.43439.548 to 39.571Whale Shark Adventures
Shimoni-Wasini0/25.5 ± 2.0 (15)March 2032.0 (6)−4.6594439.38222REEFoLution
KNP 2/65.3 ± 2.6 (13)March 2131.6 (7)−4.685 to −4.71639.366 to 39.414REEFoLution
Kilifi 2/210.8 ± 1.0 (21)March 2631.3 (8)−3.606 to −3.62639.892 to 39.8973 Degrees South
Watamu2/47.1 ± 6.5 (26) &March 27–2932.3 (9)−3.374 to −3.40339.988 to 40.011A Rocha
Lamu0/32.8 ± 1.5 (8)April 332 + (10)−2.166 to −2.214 41.004 to 41.039Northern Rangelands Trust *
& Images taken deeper than 15 m were excluded from analysis due to light limitations and camera fogging issues. + Estimated (temp. data instead from TG7 underwater camera). * In collaboration with the Pate Conservancy.
Table 2. Summary of bleaching data from assessment of 2300 “tourist diver” photos. FNR = false-negative bleaching classification rate. FPR = false-positive bleaching classification rate.
MetricValueNotes/Details
#Images taken for informal “tourist diver” analysis2322
#Images used in tourist diver CoralNet analysis2300Twenty-two images failed quality control.
#Images used for initial CoralNet AI training360Scored 10,800 features manually.
CoralNet-calculated classification accuracy81%See “Classifier Overview” (https://coralnet.ucsd.edu/source/4963/ (accessed on 2 June 2025)) for details.
#Images for post-hoc CoralNet accuracy verification400Scored 12,000 features manually.
Manually calculated classification accuracy (%)84 ± 12%
#Images for assessment of FPR and FNR140Scored 4200 features manually.
Total #images scored manually for CoralNet training900
Total #images classified automatically by CoralNet1400
Total #features scored by CoralNet across 1400 images42,000
Total #features scored by human and CoralNet69,000
#Coral colonies scored for assessment of FPR and FNR1197
Overall accuracy of coral bleaching analysis88.1%
FPR (%)24.2%
FNR (%)2.2%
Disclaimer/Publisher’s Note: The statements, opinions and data contained in all publications are solely those of the individual author(s) and contributor(s) and not of MDPI and/or the editor(s). MDPI and/or the editor(s) disclaim responsibility for any injury to people or property resulting from any ideas, methods, instructions or products referred to in the content.