Abstract
The intensive use of nitrogen (N) fertilizers in maize (Zea mays L.) cropping in sub-Saharan Africa (SSA) contributes significantly to nitrous oxide (N2O) emissions. Due to limited data on emissions and emission factors (EFs) in SSA, this study investigates GHG emissions and proposes EFs under different fertilization regimes in maize cropping in Burkina Faso (West Africa). A randomized complete block design was used with five treatments: (i) control: no fertilizer (CK), (ii) cattle manure (M), (iii) chemical fertilizer (NPK), (iv) a combination of chemical fertilizer and cattle manure (NPKM) at the national recommended rate, and (v) farmers’ practices, which involve chemical fertilizer combined with manure at the farmers’ rate (NPKM+). Cumulative N2O emissions varied significantly among treatments (p < 0.05), with the highest under NPKM (2.86 kg N2O-N ha−1) and the lowest under CK (1.93 ± 0.11 kg N2O-N ha−1). NPKM also showed the highest methane (CH4) uptake (−0.62 kg CH4-C ha−1; p < 0.001), while CK exhibited an increasing trend (0.74 kg CH4-C ha−1). The highest N2O EF was recorded for NPK (0.37 ± 0.05%), 63% lower than the Intergovernmental Panel on Climate Change default value. Although NPKM treatment resulted in the highest global warming potential and maize yield, it also achieved the lowest greenhouse gas intensity per unit of yield, highlighting a more efficient trade-off between productivity and climate impact with nitrogen fertilizer use. NPKM+ was the most effective in maintaining high maize productivity with lower yield-scaled N2O emissions and GHG intensity. These findings suggest that an integrated approach combining organic and inorganic fertilizers can mitigate soil GHG emissions. Further research is needed to refine climate-smart fertilizer combinations for sustainable maize production in SSA.
1. Introduction
In recent decades, due to rapid population growth, agriculture has become a major source of greenhouse gas (GHG) emissions and a significant contributor to anthropogenic global warming [1]. Nitrogen fertilizer (NF) application has been one of the most common practices to increase crop production worldwide over the past several decades [2,3]. Globally, fertilizer use supports food production for approximately 50% of the world’s population [4]. In regions with low-fertility soils, farmers commonly apply both organic and inorganic fertilizers to sustain and improve crop yields [5,6]. Indeed, during fertilizer application, most of the NF applied to crops is lost in gaseous forms, particularly in ammonia and nitrous oxide [2,7] as well as other gaseous compounds (NOx and N2), through the processes of nitrification and denitrification [8]. Nitrogen fertilizer application from the agriculture sector is a major source of N2O emissions, accounting for at least 30% of total global N2O emissions to the atmosphere [9,10]. These substantial losses, which significantly contribute to greenhouse gas emissions, highlight the need for a more precise and efficient fertilization strategy.
According to the Intergovernmental Panel on Climate Change (IPCC), annual global N2O emissions in 2019 were estimated at 6600 Kt N2O yr−1, equivalent to 1.8 Gt CO2-eq yr−1, representing 69% of the global net anthropogenic GHG emissions from agriculture, forestry, and other land use [1]. Agricultural activities in Sub-Saharan Africa (SSA) have accounted for 64% of the region’s total N2O emissions, contributing to global GHG emissions [11]. Nitrogen and carbon released from organic and inorganic fertilizers significantly influence carbon dioxide (CO2) and methane (CH4) emissions, further contributing to global warming [12,13,14]. Therefore, when assessing the impact of agriculture on GHG emissions, it is essential to consider the combined effects of all GHGs [15].
Currently, N2O emissions from agricultural soils are primarily estimated using the emission factors (EFs) method [16,17]. The IPCC recommends a global default EF of 1% for upland crops refers to 0.01 kg of N2O-N emitted per kg of nitrogen applied (kg N2O-N per kg−1 N) [16]. This value is associated with considerable uncertainty due to the omission of climate, soil characteristics, and management practices, however [2,18]. Moreover, most developing countries rely on the IPCC Tier 1 approach for national greenhouse gas inventories [19,20]. Tier 1 method is a default approach using generalized emission factors to estimate GHG emissions at a local level when specific emission factors are not available [17]. Globally, emission and EF data remain scarce, with limited precise quantifications across diverse cropping systems [21]. Indeed, EFs are poorly documented in regions such as Northern Europe, Central America, Southeast Asia, and Northern South America [18]. In East Africa, some data on emissions exist [19,22,23]; however, field measurements specifically focused on EFs remain scarce across this region, the rest of SSA, and other developing countries [24,25]. Only [26,27] have provided EFs for carbon associated with biomass burning. This results in significant data gaps and uncertainties in national and regional GHG inventories [1,6]. Field research on GHG emissions and EFs in West Africa remains particularly limited. To our knowledge, [28] is the only study providing nitrous oxide emission factor (N2O EF) data for the region. However, conditions in western SSA may differ significantly from those in other regions due to variations in soil types, climate, altitude, and management practices [22]. Expanding research on emissions and EFs could help reduce current uncertainties.
Maize (Zea mays L.) is a key food crop in SSA, supporting over 70% of the population [29]. Financial constraints force most smallholder farmers to apply low fertilizer doses (<25 kg N ha−1) alone or in combination with animal manure, thus limiting yields in traditional maize cultivation [22,30]. To enhance agricultural production, an increasing number of farmers are adopting higher fertilizer doses. Numerous studies have demonstrated significant yield improvements with NF application [31,32]. However, this practice also influences GHG emissions [11,33]. To develop effective emission reduction strategies, the Paris Agreement (COP 21) recommends that each country provide activity data and EFs for GHG inventories [17,34]. Additionally, the IPCC encourages countries to adopt Tier 2 (using country-specific EFs) or Tier 3 (model-based) methods to improve estimate accuracy and reduce uncertainty when sufficient national data are available [16,35]. However, the lack of accurate data poses a significant challenge; many developing nations, particularly in SSA, struggle to provide regular updates. This hinders their ability to set complementary targets and achieve net-zero GHG emissions while ensuring food security [4,36,37]. Here, we assess GHG emissions from different fertilizer management practices currently used in SSA to establish a synoptic baseline for the continent, updating GHG inventories and supporting future mitigation strategies. Specifically, this study examines average daily GHG fluxes, cumulative emissions, and key emissions parameters, including EF and global warming potential (GWP), under different fertilization regimes in maize cropping in Burkina Faso. We address three main objectives by (1) assessing the effects of different fertilizer treatments on cumulative GHG emissions, (2) determining N2O EF for different NFs, and (3) evaluating the relationship between GHG emissions and maize yields across fertilization regimes. We hypothesize that mixture fertilization at recommended rates for tropical regions like Burkina Faso increases N2O in maize cropping systems. The findings of this study contribute to improving the accuracy of GHG emission estimates, establishing emissions baselines, and informing mitigation strategies. Ultimately, they provide insights into optimizing fertilization practices in SSA in the context of climate-smart agriculture.
2. Materials and Methods
2.1. Study Area
This study was conducted in Banaorodougou (11°20′91″ N; 4°22′41″ W) (Figure 1) in a smallholder maize farm located in the northern part of Bobo-Dioulasso, the second-largest city in western Burkina Faso. A dry tropical climate in the Sudanian climate zone characterizes the study site [38], with five months of humid season (June to September) and seven dry months (October to May). The mean annual rainfall and mean temperature at the site from 2013 to 2022 were 1153.48 ± 203 mm a−1 and 28.15 ± 0.25 °C, respectively. The daily mean temperature and precipitation during the maize growing seasons (Figure 2) were obtained from the nearest (5 km away) agrometeorological station of the Institut de l’Environnement et de Recherches Agricoles (INERA). Soils are characterized as Lixisols (soils with subsurface accumulation of low activity clays and high base saturation) according to the Harmonized World Soil Database map [39]. The soil physicochemical properties in the 0–20 cm layer before the start of the experiments include pH (H2O, 1:2.5): 5.64 ± 0.05, electrical conductivity (1:5): 87.6 ± 3.5 µS cm−1, soil organic carbon (C) content: 0.74 ± 0.06%, total nitrogen (N) content: 0.06 ± 0.005%, C/N: 11.80 ± 0.3, total potassium (K+) content: 1015 ± 43.3 mg kg−1, total phosphorus content: 141.43 ± 11.4 mg kg−1, bulk density: 1.35 ± 0.01 g cm−3, and granulometry with clay: 23.53 ± 1.13%, sand: 45.42 ± 0.65%, silt: 31.05 ± 0.65%.
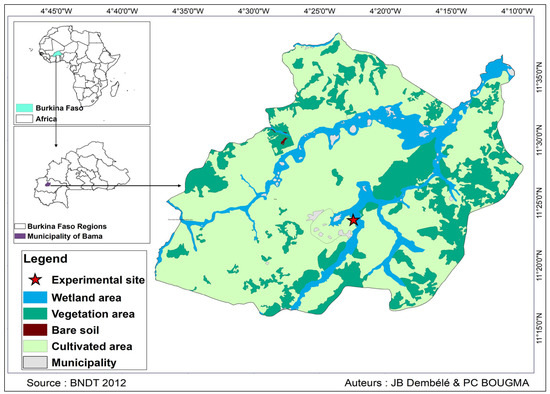
Figure 1.
Location of the study area.
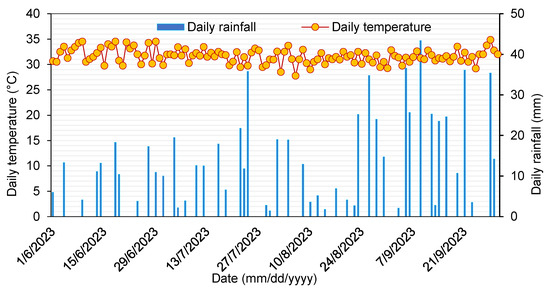
Figure 2.
Temporal dynamics of daily average air temperature and daily rainfall during the maize growing season in Banaorodougou, Burkina Faso.
2.2. Experimental Design and Crop Management
To assess the effects of existing fertilization regimes in maize cropping on N2O, CH4, and CO2 emissions from soil, an experimental site was established in July 2023. Farmers generally adopt different fertilization regimes in maize cropping in Burkina Faso. The treatments, along with the corresponding fertilizers and nitrogen application rates, are presented in Table 1. The fertilization regimes, including control plots, were arranged in a randomized complete block design with three replicates for each treatment. Treatments were implemented in individual plots of 30 m2 (6 m × 5 m). Buffer strips of 2 m separated individual plots and 4 m between blocks. The cattle manure used in this study had the following chemical composition: 16% organic matter, 0.53% total nitrogen (N), and 9.4% carbon (C), resulting in a C/N ratio of 17.7. The NPK fertilizer applied was a compound formulation with a nutrient content of 15-15-15 (N–P2O5–K2O). The cultivar “SR21” of Zea mays L. was sown directly after tillage, with around three seedlings per hole into the soil. Maize plants were maintained at the density of 62.500 plants ha−1, compressing 2 plants per pocket, with a row spacing of 80 × 40 cm. Before maize planting, cattle manure was incorporated as basal fertilizer with the hoe into the corresponding plots approximately 1 week before seeding. Two weeks after sowing the maize, NPK fertilizer was spread as basal fertilizers by side placement about 5–7 cm away from seedlings. Weeding was carried out manually twice, followed by hoeing, while other management practices implemented in the experimental fields were completely consistent with those applied by local farmers.

Table 1.
Description of treatments with corresponding fertilizers and nitrogen rates.
2.3. Gas Sampling and Measurements
N2O, CH4, and CO2 fluxes from the soil were estimated using the manual closed static chamber method, as employed in several studies [24,40]. Static chambers were deployed according to the Global Research Alliance N2O chamber methodology guidelines [41,42]. The chambers were made from opaque polyvinyl chloride plastic (40 cm height, 25 cm diameter). In each plot, three base rings (12 cm height) were inserted into a 5 cm soil surface to avoid lateral gas diffusion. Three chambers were installed along the diagonal of each plot to capture soil spatial variability, which may affect GHG emissions. The rings were removed only during management events (fertilization, tillage) and returned immediately after these activities. One chamber per plot was connected to a datalogger (GP2-advanced datalogger and controller/Delta-T Devices, Cambridge, UK) equipped with a sensor to measure the inside temperature, relative air humidity, and air pressure. All chambers were equipped with fans for air mixture and pressure equalization during sampling. Gas sampling was performed per block (all replications of each treatment) as recommended by [41]. To minimize diurnal variation in the flux pattern, measurements were conducted on each sampling day from 10:00 a.m. to 3:00 p.m., following the recommendation of [43] which demonstrated that gas fluxes measured during this time frame closely approximate daily averages. Gas was collected one day before fertilization for reference emissions, daily for 7 days following topdressing application, and weekly during the maize growth period. Measurements were also conducted before the harvest when gas was assumed to have dropped to its baseline rates. In total, gas sampling was conducted on 20 days during maize cropping season. To calculate gas fluxes, samples were taken at 0, 10, 20, and 30 min after the closure using a 20 mL polypropylene syringe and stored in 12 mL vacuum glass vials (Labco Exetainer, Labco Ltd., Lampeter, UK). Samples were subsequently sent to the Laboratory of Plant Biology and Ecology at the Université Joseph Ki-Zerbo (Burkina Faso) for analysis by gas chromatography (8610C, SRI Instruments, Torrance, CA, USA) with a flame ionization detector (FID) for CH4 and CO2 analysis and an electron capture detector (ECD) for N2O analysis. GHG fluxes were calculated based on the concentration change within the headspace of the flux chambers, determined as the slope of a linear regression between concentration and time, according to Equation (1). The calculation was accepted if the coefficient of determination R2 estimated from the linear regression was above 0.90 for each measurement [23,44].
where F (gas) = flux rate [(N2O μg N m−2 h−1); (CO2 mg C m−2 h−1) and (CH4 mg C m−2 h−1)]; b = mixing ratio increase (ppb h−1 for N2O and ppm h−1 for CO2 and CH4, respectively); VCh = chamber volume (m3); MW N2O-N molecular weight of N2O-N (28 g mol−1); MWCO2-C molecular weight of CO2-C (12 g mol−1); MWCH4-C molecular weight of CH4-C (12 g mol−1); ACh = base area of chamber (m2); and MVcorr = pressure- and temperature-corrected molar volume of air (m 3 mol−1), calculated used Equation (2):
where t air temperature during measurements (°C), p0 = standard atmospheric air pressure (Pa), and p1 air pressure during measurements (Pa).
2.4. Auxiliary Measurements
Parallel to gas flux measurements, soil temperature (°C) and volumetric water content (%) were monitored at a depth of 5 cm next to each chamber by a handheld digital device (WET150-Kit, Delta-T Devices Ltd., Cambridge, UK), calibrated for generic mineral soil. Soil temperature measurements from the replicated plots under the same treatments were averaged to produce a mean value for the treatment on each sampling date. Water-filled pore space (WFPS) was calculated based on volumetric water content, soil bulk density, and particle density, which was assumed to be 2.65 Mg m−3 [29,45]. Bulk density to a depth of 20 cm was calculated by dividing the weight of the oven-dried soil at 105 °C for 24 h by the volume of the core.
2.5. Estimation of Grain Yields
For each treatment, 3 subplots of 6 m2 (3 m 2 m) were installed at the maturity stage for grain yield assessment. Within subplots, the number of maize plants was counted, and their ears were harvested. Grains were oven-dried at 75 °C until constant weight. The average grain yield per subplot was determined and then multiplied by the plant density at the main plot level to obtain the final grain yield, which was adjusted to a 14% moisture level.
2.6. Soil Sampling and Analysis
Soil samples were collected before crop cultivation to analyze their physical and chemical characteristics. Three soil sampling points were chosen in each plot. Soil samples were collected at 0–20 cm soil depths from each point using a soil auger and mixed into one composite sample. Soil granulometry (clay, silt, and sand contents) was determined by the hydrometer method after the destruction of organic matter with hydrogen peroxide (H2O2). Soil carbon (C) and total nitrogen (N) were determined by dry combustion. Available soil nutrients, K and P, were determined by inductively coupled plasma–optical emission spectrometry (ICP-OES) after soil extraction using the ethylene-di-amine-tetra-acetic acid (EDTA) method. Soil pH (1:2.5 soil water suspension) and soil conductivity (1:5 soil water suspension) were analyzed using a digital pH meter and a conductivity meter. Bulk density was analyzed using Keen’s box method [46].
2.7. Data Calculation
2.7.1. Cumulative CO2, CH4, and N2O Emissions
The cumulative CO2, CH4, and N2O emissions during the maize growing season were calculated directly from the fluxes and by linear interpolation for days when no measurements were made using Equation (3) [47,48]:
where Ri is the daily emission rate of CO2, CH4, and N2O (kg ha−1 d−1) in the ith sampling interval; Di is the number of days in the ith sampling interval and n is the total number of sampling days. The number of days in the growing season was 103 days.
2.7.2. Grain Yield Calculation
The grain yield was determined using the formula provided by [49], as outlined in Equation (4):
where grain weight is in kg, the crop moisture content (MC) is in percentage (%), and plot area is in m2.
2.7.3. Global Warming Potential (GWP) and Greenhouse Gas Intensity (GHGI)
The global warming potential (GWP) of CH4 and N2O was calculated in a mass of CO2 equivalent (kg CO2 eq. ha−1) over the 100-yr time horizon. Radiative forcing potential of 1 for CO2, 27 for CH4, and 273 for N2O, as recently published by the IPCC, were used [50]. Greenhouse gas intensity (GHGI) was calculated by taking the ratio of GWP and corresponding grain yield for each treatment. GWP and GHGI were calculated using Equations (5) and (6), respectively [47,51].
2.7.4. Calculation of Yield-Scaled N2O Emissions
The yield-scaled N2O emission (YSNE) was calculated using Equation (7) [24] to estimate the N2O emissions per kilogram of grain yield produced during the cultivation period, a crucial metric for regulating food production and lowering the environmental impact.
where yield-scaled N2O emissions is the amount of N2O emitted per grain yield produced (g N2O-N kg−1 grain−1), N2O emissions is the cumulative emissions of this gas (kg N2O ha−1) during the growing season, and grain yield is the annual grain yield produced (kg ha−1).
2.7.5. Nitrous Oxide Emissions Factors Calculation
The direct N2O EF specific to the treatment during the growing season was calculated using Equation (8) [42]. EF values were calculated by subtracting the cumulative N2O emissions occurring in a control treatment where no N was added (N2O-control) from the cumulative N2O emissions in each experimental treatment where N was added (N2O-treatment), then dividing this by the amount of N applied (Napplied):
where EF N2O is the N2O emission factor (%) of N input lost as N2O-N, N2Otreatment is the cumulative N2O-N emission from each treatment applied (from sowing to harvest) in the fertilized and intercropped treatments, N2Ocontrol is the cumulative emission from the control treatment (background emission), and Napplied the estimated total input of N.
2.8. Statistical Tests
One-way ANOVA analyses were performed to test the effects of fertilization treatments on GHG emissions, GWP, GHGI, YSNE, and maize yields. Differences between treatments were highlighted using Fisher’s least significant difference (LSD) test at a 5% significance level. When needed, data were log-transformed to meet the assumptions of the ANOVA application, especially the normal distribution of the data and the homogeneity of the variance of their residuals, which were checked using the Shapiro–Wilk test and Levene’s test. In addition, linear regressions were performed to assess the relationship between the N rate and cumulative N2O fluxes and between the N rate and maize yields. The goodness of the relationships was evaluated based on the magnitude of the r-squared values and the significance of corresponding p-values. All statistical calculations, including some data visualizations, were performed using R programming (R 4.4.0) [52].
3. Results
3.1. Environmental Variables
The average daily air temperature was 31.4 °C, ranging from 27.8 to 33.7 °C. During the measurement period, total precipitation amounted to 210.2 mm, with heavy rainfall concentrated between 22 and 24 July 2023 (Figure 2). Variations in soil temperature and WFPS were consistent with those of air temperature and rainfall, respectively (Figure 2 and Figure 3a,b). Higher rainfall concentrations (>23 mm in three consecutive days) and lower air temperature (<31 °C) led to an increase in soil WFPS (58.16%) and a decrease in soil temperature (32.1 °C) under dry climatic conditions. Soil temperature and water-filled pore space were not significantly affected by fertilization treatment or date of sampling. The soil temperature during gas measurements ranged between 28.9 and 36.3 °C at a 0–5 cm depth across all treatments (Figure 3a). Because of higher rainfall in the rainy season (between 22 and 24 July), the overall WFPS during the maize season (average of 58.1%) exceeded that during the other days (Figure 3b).
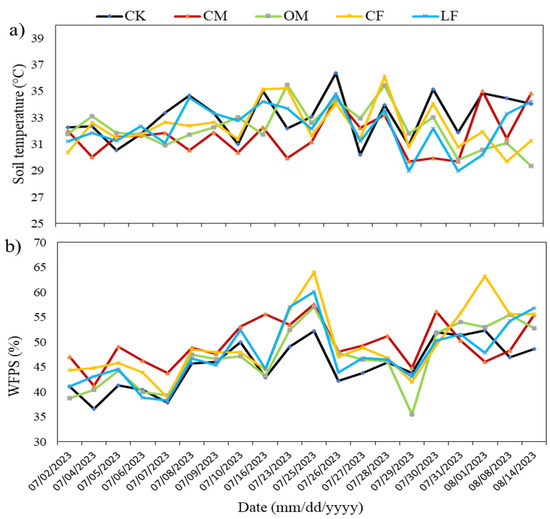
Figure 3.
Soil temperature (°C), (a), and WFPS (%) throughout (b) the growing season of maize in the experimental site. CK: control (no fertilization), NPKM: conventional mixture fertilizer, M: manure, NPK: only chemical fertilizer, and NPKM+: local farmers’ mixture fertilizers.
3.2. Dynamics of N2O, CH4, and CO2 Fluxes
3.2.1. Daily Dynamics
The dynamics of GHG emissions across different treatments exhibited varying fluctuation ranges during manure incorporation and NPK application (Figure 4a,c,e). The N2O fluxes were initially lower but increased during each fertilization. The highest N2O flux peaks (0.06 kg N2O-N ha−1 d−1) typically occurred within 4 days following chemical fertilization in the NPKM treatment, while the lowest average N2O flux (0.003 kg N2O-N ha−1 d−1) occurred under manure treatment (M). The peaks exhibited a decreasing trend of average values across the NPK (0.047), NPKM+ (0.043), M (0.040), and CK (0.023 kg N2O-N ha−1 d−1) treatments (Figure 4a). Soil CH4 fluxes were mostly positive but occasionally negative in all treatments with values ranging from −0.038 to 0.033 kg CH4-C ha−1 d−1 throughout the study period (Figure 4c). Maximum fluxes were observed earliest in the control treatment (0.033 kg CH4-C ha−1 d−1), while the negative flux (−0.0034 kg CH4-C ha−1 d−1) was observed with conventional mixed treatment three days after manure incorporation. The fluxes remained less variable during the rest of the growing season, except for the fertilization times with NPK, where mostly positive CH4 fluxes were observed from all treatments. The CO2 flux was not significantly affected by manure and inorganic N fertilization (Figure 4e). Although manure has been incorporated, CO2 flux did not peak considerably during these periods. Fertilization events seem to have led to minor variations in CO2 dynamics. Overall, soil CO2 emissions ranged between 4.27 and 17.38 kg CO2-C ha−1 d−1 for local fertilization practices (NPKM+) and chemical fertilization (NPK). Carbon dioxide emissions in the control treatment remained low, with the main rates commonly below 10.9 kg CO2-C ha−1 d−1, while the mixed treatment at the recommended rate recorded the highest rates, approximately 7% higher.
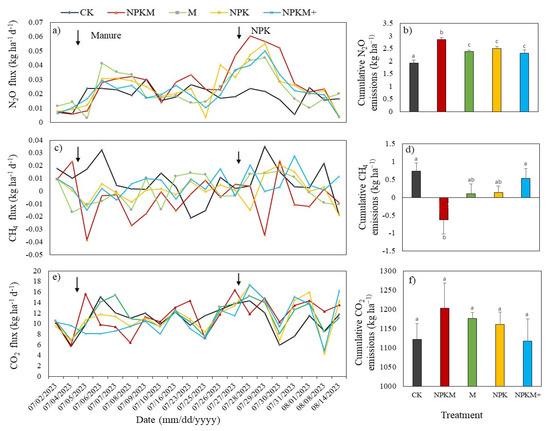
Figure 4.
Fluxes of (a) nitrous oxide (N2O), (c) methane (CH4), and (e) carbon dioxide (CO2); and cumulative emissions of (b) N2O, (d) CH4, and (f) CO2 during the maize growth period. CK: control (no fertilization), NPKM: conventional mixture fertilizer, M: manure fertilizer, NPK: chemical fertilizer, and NPKM+: local farmers’ mixture fertilizers. The arrows in figures (a,c,e) indicate the timing of fertilizer application. Different letters above the bars indicate significant differences between treatments (p < 0.05) by one-way ANOVA (LSD). The error bars represent the SE (n = 3).
3.2.2. Cumulative Emissions of N2O, CH4 and CO2
Cumulative emissions of N2O and CH4 during the maize growing season were significantly (p < 0.001) affected by fertilization (Table S1). Using both chemical and organic fertilizers at a recommended rate significantly increased N2O emissions. The cumulative N2O emissions from NPKM treatment were higher (2.86 ± 0.08 kg ha−1) than other treatments (Figure 4b). Compared to NPKM, the treatments NPK, M, NPKM+, and CK decreased the cumulative N2O emissions by 12.5%, 17%, 18.9%, and 32.5%, respectively. The cumulative emissions of CH4 from NPKM treatment (−0.62 kg CH4-C ha−1) were substantially lower than those under M (0.14 ± 0.17 kg CH4-C ha−1), NPK (0.10 ± 0.27 kg CH4-C ha−1), and NPKM+ (0.53 ± 0.26 kg CH4-C ha−1). However, the control treatment recorded the highest value of methane (0.74 ± 0.22 kg CH4-C ha−1). The cumulative CO2 emissions were not significantly different between treatments (p > 0.05). The NPKM treatment had the highest CO2 emission, and the NPKM+ treatment had the lowest (Figure 4f).
3.3. N2O Emission Factor, Yield-Scaled N2O Emission, Global Warming Potential, and GHG Intensity
Fertilizer treatments did not significantly affect EF, and YSNE (p > 0.05) (Table 2). However, GWP showed a marginal significance (p = 0.054), indicating notable differences among the treatments, while GHGI varied considerably between fertilizer treatments (p ˂ 0.01). The EF values of N2O ranged from 0.22% to 0.37% in the NPKM+ and NPK treatments, respectively, with an average of 0.30% (Table 2). In general, mixed fertilization demonstrated a relative potential to reduce EFs by at least 19.4% compared to single NPK fertilizers. Regarding GWP, the results indicated that existing fertilization regimes significantly increase their values compared to the control. The highest GWP value was recorded in NPKM treatment (769.23 ± 14.32 kg CO2 eq. ha−1) and the lowest in NPKM+ (649.65 ± 10.02 kg CO2 eq. ha−1), representing an 18.4% reduction. In general, in terms of GWP contribution, CO2 is the main contributor, followed by N2O. Among the treatments, NPKM shows the highest N2O contribution to the GWP, accounting for approximately 40%. Conversely, the same treatment contributes the least in terms of CO2 emissions (Table 2). The results showed that the no-fertilization treatment (CK) exhibited a higher GHGI of 1.15 ± 0.16 kg CO2 eq kg−1 grain yield, while the lowest rates were observed under NPKM treatment (0.69 ± 0.006 kg CO2 eq kg−1 grain yield). Additionally, the control treatment produced the highest YSNE, estimated at 1.27 ± 0.06 g N2O-N kg−1 grain, which was statistically similar to the other treatments and followed the order NPK > M > NPKM > NPKM+ (Table 2).
Table 2.
Effect of different fertilizers treatment on N2O emission factor, yield-scaled N2O emission, global warming potential, and greenhouse gas intensity.
3.4. Relationship Between N Rate and N2O Emissions During Maize Growth Season
Linear regression highlighted a correlation (R2 = 0.77) between N rate and cumulative N2O emissions. Emissions were positively and significantly correlated with N inputs (Figure 5). N2O emissions were 48% higher at the highest nitrogen levels compared to the control, which received no nitrogen input.
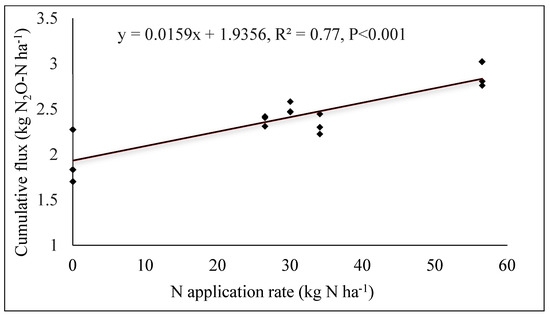
Figure 5.
N2O emissions as linear functions of nitrogen fertilizer rates.
3.5. Effect of Fertilizer Application on Maize Grain
Fertilization treatments had significant effects on grain yields (p ˂ 0.001). The average grain yield ranged from 2850.58 ± 81.72 to 11,453.21 ± 73.14 kg ha−1 (Table S1). NPKM treatment exhibited the best-performing yields. Considering NPKM fertilization as a reference, grain yield was reduced by 27.6% under manure fertilization. Maize responses to existing fertilization regimes in terms of grain yields are illustrated in Figure 6a. Additionally, positive correlations were found between nitrogen rate and grain yield (Figure 6b).
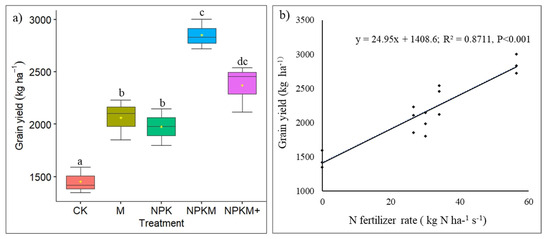
Figure 6.
Boxplot showing the variation in grain yield of maize under fertilizer treatments applied (a). Relationship between N fertilizer application rate and maize yield (b). The median and the mean are represented by a horizontal line and a dot in the boxplot, respectively. Different letters above the bars indicate significant differences between treatments (p < 0.05) by one-way ANOVA (LSD).
4. Discussion
4.1. Effect of Fertilizer Treatment on N2O Emissions
The increase in soil N2O emissions immediately after fertilizer application coincided with precipitation events, which led to increased soil moisture. This could have triggered substrate availability, microbial activity, and mineralization of C and N, resulting in a pulse of N2O fluxes [5]. Rainfall increases soil moisture, which can reduce oxygen availability and create anaerobic conditions that favor denitrification. Fertilizer application adds nitrogen, typically in the form of ammonium or nitrate, and may also enhance the availability of organic carbon. Both nitrate (NO3−) and organic carbon serve as essential substrates for denitrifying bacteria. Under moist and low-oxygen conditions, these microbes convert nitrate into gaseous forms of nitrogen. However, when the process is incomplete or environmental conditions are suboptimal, nitrogen is emitted primarily as nitrous oxide (N2O) instead of being fully reduced to dinitrogen gas (N2) [53,54]. This aligns with the findings of [23], who observed peak N2O fluxes following N fertilizer applications. In terms of cumulative N2O emissions, conventional mixed fertilization (NPKM) resulted in the highest emissions, likely due to the increased nitrogen rate, which directly affects soil nitrogen availability and bioactivity [35,55]. The increase in N2O from NPKM could be also related to the high NH4+ and NO3− contents from fertilizers, which facilitate the activity of nitrite reducers (nirS and nirK genes), thereby leading to N2O production through the denitrification process [56]. In addition, the observed increase in N2O under NPKM treatments may result from conditions that promote incomplete denitrification such as high nitrate availability, insufficient carbon, or transient anaerobic conditions, which hinder the full reduction of N2O to N2 [53]. The use of animal manure as an organic amendment in mixture fertilization could result in increased labile C and N substrates for microbial N2O consumption and production [7]. While this may enhance N2O production through increased substrate availability and partial anaerobic conditions, it may also enable N2O consumption via complete denitrification depending on whether conditions support the full reduction of N2O to N2 [53]. The combination of chemical fertilizer and cattle manure could increase the abundance of nirS-harboring bacteria responsible for denitrification and emissions [37,57]. The minimal difference in soil N2O emissions between treatments (M, NPK, NPKM+) may be due to the lower total nitrogen content in both organic and inorganic fertilizers. In the manure-only treatment (M), N2O emissions were reduced to 17% of those in the NPKM treatment, aligning with the findings of [58,59], who reported reductions of 16% and 55% in emissions from manure compared to inorganic nitrogen, respectively.
Manure-derived nitrogen reduces organic nitrogen mineralization and autotrophic nitrification rates [55], thereby promoting nitrogen uptake by plants and enhancing microbial assimilation of mineral nitrogen [59]. Organic fertilizer is potentially more stable to microbial decomposition than chemical fertilizer, as it can significantly mitigate GHG emissions. The seasonal cumulative N2O emissions found in this study were higher than those found in SSA studies [23,24,44] that reported N2O fluxes ranging between 0.02 and 1.5 kg N2O-N ha−1. Conversely, in other regions (China and Spain), some studies [36,60] recorded the highest emissions at up to 29.4 ± 1.1 kg N2O-N ha−1. These differences may result from soil types, climate conditions, and land use management, including fertilizer type, rate, and quality [7,29,61].
4.2. Effect of Fertilizer Treatment on CH4 Emissions
CH4 fluxes varied significantly over time throughout the experiment. The slight decline in CH4 emissions in the NPKM treatment at the beginning of the sampling period was likely due to the combined effects of carbon from manure and reduced soil oxygen levels caused by precipitation. During nitrogen fertilization, the soil water content may have influenced methanogen activity, impacting CH4 emissions by increasing uptake [62]. Cumulative soil CH4 emissions were significantly affected by the fertilization treatment throughout the experiment (Figure 4d). The highest CH4 emissions in the control treatment could be largely attributed to the high WFPS (Figure 3b) controlling CH4 production and consumption in soils [63], but also to enhanced methane oxidation because of the relatively high pH [23]. This study found that CH4 uptake was highest under mixed fertilizer (NPKM) due to degradable organic matter from manure, which improved soil aeration, water retention, and root respiration [29,31,64]. The negative CH4 flux in NPKM was attributed to enhanced diffusion of atmospheric O2 and CH4, promoting uptake by methanotrophs. Methane oxidation by bacteria and methanogens further increased CH4 uptake [19,23]. These results can also be explained by methane oxidation by methanotrophic bacteria, but also by methanogens [65] to CO2, thus increasing CH4 uptake. The study observed higher soil CH4 fluxes under farmers’ fertilizer practices (Figure 4d). Co-fertilizing manure with chemical fertilizers increased methanogenic diversity and abundance, with labile carbon from manure supporting methanotrophic populations. Additionally, cattle manure may release CH4 upon application [24]. The study found that microbial activity and CH4 uptake were low in mineral fertilizer treatments due to reduced oxidation activity. Cumulative CH4 emissions were slightly higher than those reported in SSA [19,24], where agricultural soils mainly acted as CH4 sinks. However, our results differed from those of [44] in Cameroon, who reported higher emissions. These differences were attributed to variations in soil properties, which affect GHG flux dynamics.
4.3. Effect of Fertilizer Treatment on CO2 Emissions
Across different fertilizers, CO2 fluxes showed a similar pattern of variation, consistent with the findings of a previous study [54]. The fluxes of CO2 peaked after fertilization, which mainly stemmed from the increase in soil respiration and microbial activity associated with the application of N fertilizer and increased soil moisture following a rainfall event [54,55]. The N-dependent C-use efficiency associated with soil CO2 emissions observed here is consistent with previous findings [5,66]. CO2 emissions are directly proportional to the rate of organic amendments input. A high amount of animal manure had a positive correlation with CO2 emissions. Even though no significant differences were observed between treatments, the use of manure and its combination with chemical fertilizers at the recommended rate led to increased cumulative CO2 emissions. The increasing organic matter combined with the loading of nutrients from manure can stimulate the microbiome activity, thereby enhancing soil quality [12,31]. Additionally, rainfall and frequent soil tillage were observed during the experiment [29,38], which may have promoted CO2 emissions. However, the low CO2 emissions observed in plots receiving only chemical fertilizers or under control conditions were attributed to low soil organic carbon (SOC) resulting from the absence of organic fertilization. The cumulative CO2 fluxes in the present study ranged from 1118 to 1203 kg CO2-C ha−1; higher than those observed under tropical conditions by others [19,29].
4.4. Effect of Fertilizer Treatments on N2O Emission Factors
Areas with both high and low EFs exist across all continents, with EFs for maize worldwide ranging from 0.08% to 3.77% [18]. The direct N2O EFs determined in this study were lower than the default 1% EF currently proposed by the IPCC for global and dry climates [16]. This demonstrated that using the IPCC’s EF may overestimate more than 78% of N2O emissions for dry climate zones. Several experimental studies on maize crops carried out in tropical climates have reported emission factors (EF) ranging from 0.1 % to 0.9% across maize cropping systems in SSA, including findings by [28] in Ghana, refs. [24,61] in Kenya, ref. [20] in Tanzania, and [25] in Ethiopia. The mean EF observed in this study was lower than both the global EF (0.97%) proposed by [2] for various environmental and ecological zones and the global nitrous oxide emission factor (0.57%) reported in a meta-analysis by [64]. It was also lower than Australia’s EF (0.57%) reported by [67], the UK’s EF (0.6%) by [68], and China’s EF (0.56%) proposed by [69].
The lower N2O EFs observed in our study compared to the IPCC default value and most previous studies may be due to lower nitrogen input levels as well as differences in environmental conditions, soil types, and management practices [2,18,33]. This may also be due to the duration of the experiment. When comparing emission factors based on fertilizer types, our results showed that maize cultivation under mineral fertilization had higher N2O EFs than under organic fertilization, which is consistent with previous studies finding higher EFs from inorganic NF [35,70]. Globally, the nitrogen application rate has a positive effect on EF [2]. However, some observations have also confirmed a nonlinear response to the N application rate [70].
4.5. Yield-Scaled N2O Emissions, Global Warming Potential, and GHG Intensity Following Fertilization Practices
The YSNE did not differ across N fertilization treatments, although emissions showed significant variation. This could be attributed to the negative correlation between N inputs and YSNE, where an increase in nitrogen inputs does not necessarily lead to higher YSNE. The combination of low emissions from local practices and higher yields contributed to a lower YSNE value, weakening the relationship between N2O emissions and YSNE and resulting in this non-significant effect between all treatments. There was an optimal N input rate that reduced YSNE. This finding aligns with global YNSE from the study of [4], with a lower YSNE average of 0.211 g N2O-N kg−1 grain. Conversely, low crop yields, probably due to low fertilization, resulted in high YSNE, as mentioned by [6,22]. These results suggest that local farming practices that reduce YSNE could be key to developing effective strategies for balancing food security and N2O emissions reduction. Yield-scaled N2O emissions could be lowered if maize yield is increased with optimal N input [71].
In our study, the combined fertilizer (NPKM) and the single inorganic fertilizer application (NPK) exhibited the highest GWP value. This is largely explained by the impact of N2O rather than CO2, as CO2 emissions are statistically similar across the different treatments. This is due primarily to higher cumulative N2O emissions compared to other fertilizer treatments, as N2O contributed the largest share to the overall GWP, especially in dryland agriculture [29,31]. The contribution of N2O to the GWP in the NPKM treatment can be explained by elevated N2O emissions, which are themselves associated with high nitrogen inputs. The observed differences in GWP between treatments in our context are mainly due to variations in nitrogen application rates [33], whereas discrepancies in other studies are largely attributed to differences in environmental conditions, crop types, and fertilization methods [51]. Adding manure to NF increased N2O emissions, likely due to the higher mineral nitrogen content (particularly NH4+) in the organic matter [36]. Regarding CO2, the NPKM treatment shows the lowest contribution, partly due to negative CH4 values. This negative CH4 balance indicates net CH4 uptake by methanotrophic bacteria, which oxidize CH4 into CO2. Although this microbial process increases CO2 emissions, it ultimately reduces the overall GWP contribution by mitigating CH4, a gas with a higher global warming potential than CO2. This underscores the importance of implementing additional strategies, such as using nitrification inhibitors, to reduce N2O emissions and enhance nitrogen conservation in manure [33].
The greenhouse gas intensity (GHGI) decreased with increasing levels of nitrogen fertilizer and GWP. This decrease was primarily driven by an increase in yield at high nitrogen application levels (NPKM treatment), as higher nitrogen inputs led to higher maize grain production. This result occurred because the increased grain yield had a positive effect on GHGI, while lower yields corresponded to higher GHGI values, particularly for the NPK and CK (Figure 6a and Table 1) treatments. Similar findings were observed by demonstrating the balancing effect of crop yields on GHGI [19,72]. Moreover, small changes in maize yield can result in substantial differences in GHGI across treatments [29].
4.6. Effect of Maize Grain Yield to Nitrogen Fertilizers
Our study found that the recommended mixed fertilizer (NPKM) produced the highest yield, while the NPKM+, NPK, and M treatments showed no significant differences in grain yield. The higher grain yields observed under the NPKM treatment can be largely attributed to the combined benefits of both fertilizer types, which supply a diverse range of essential nutrients. When organic fertilizer and inorganic fertilizer are applied together, crops preferentially absorb the nutrients released by inorganic fertilizers, readily available for plant uptake [33]. The study highlights the long-term benefits of organic fertilizers, particularly cattle manure, which enhance soil structure, increase organic carbon, and improve nitrogen availability, leading to higher maize yields [7,37,73]. Combining organic and chemical fertilizers is an effective strategy for maintaining yields [74,75]. Although local practices combine both manure and NPK, yields are still slightly lower than recommended practices. This is due to the low doses, which are almost two times lower than those recommended. The N fertilization rate is significantly lower than what plants require. Chemical fertilizers revealed low yields. Similar findings were noted by [76], who found that chemical fertilizer did not improve yield but slightly acidified the soil. In our study, the average grain yield under conventional fertilization was lower than maize yields in Sub-Saharan Africa and tropical or subtropical regions worldwide, despite conventional NF producing relatively higher yields [22]. This study also found that nitrogen application rates influence grain yield, with higher inputs leading to greater yield potential. However, low nitrogen inputs and small farm sizes contribute to significant yield gaps in Sub-Saharan Africa [3,30]. Addressing these gaps while reducing greenhouse gas emissions through climate-smart agriculture remains a key challenge for smallholder farmers and stakeholders in the region.
5. Conclusions
This study highlights the impact of current fertilization practices on greenhouse gas (GHG) emissions, emission factors (EFs), global warming potential (GWP), greenhouse gas intensity (GHGI), and yield-scaled nitrogen efficiency (YSNE) in maize cropping in Burkina Faso. As endorsed by the Burkina Faso Ministry of Agriculture, the recommended mixed fertilization approach increased nitrous oxide (N2O) emissions by 20.1% and 48.18% compared to single manure and the control treatment, respectively. The methane (CH4) uptake was relatively high in the NPKM treatment, suggesting that methanotrophic populations had increased due to microbial activity, enhancing CH4 diffusion. Surprisingly, carbon dioxide showed no significant response to these treatments. Among the various fertilizers, the single application of NPK fertilizer resulted in the highest direct EFs.
In line with findings from other studies in Sub-Saharan Africa (SSA), the N2O EFs observed in this study were lower than the default EFs provided by the IPCC, suggesting that these default values may overestimate N2O emissions. Overall, the use of manure fertilizer reduces the GWP in maize cropping. Mixture fertilization at the recommended dose has the greatest positive effect on maize yield compared to a single application of manure or chemical fertilizer. However, since this fertilization regime also increases GHG emissions, further research is needed to develop a smart mixed fertilization strategy that minimizes emissions while maintaining optimal maize yields. Based on our findings, a potential approach for designing such a strategy could involve reducing the rate of synthetic nitrogen application. Organic fertilizers, such as manure, may offer a more sustainable alternative to chemical fertilizers, significantly mitigating greenhouse gas emissions. The one-year experiment conducted in this study may not provide sufficient insight into the long-term effects of different fertilization regimes on GHG fluxes. We recommend establishing long-term experiments across various agroecological zones with varying types of soil to provide a robust GHG emission profile in maize cropping systems.
This research provides emissions data and emission factors that can be used to develop tailored guidance addressing gaps in greenhouse gas emissions accounting and reporting challenges. Nevertheless, our measurements in SSA show results comparable to those from other tropical and subtropical regions, reinforcing confidence that our projections offer valuable insights into future patterns of soil N2O emissions. This approach supports consistent, comprehensive, and transparent reporting, helping to strengthen capacities for the upcoming global stocktake. Our findings will aid decision-making processes related to the implementation of climate-smart agriculture in Sub-Saharan Africa.
Supplementary Materials
The following supporting information can be downloaded at: https://www.mdpi.com/article/10.3390/environments12070211/s1, Table S1: Average cumulative soil GHG fluxes under different soil fertility management throughout the growing season.
Author Contributions
P.-t.C.B.: Conceptualization, Writing, Methodology, Visualization. O.O.: Funding acquisition, Investigation, Conceptualization, Supervision. A.L.: Project administration, Funding acquisition, Methodology, Reviewing. L.B.: Funding acquisition, Writing, Conceptualization. M.M.: Study design, Reviewing. A.W.G.: Methodology, Conceptualization, Reviewing. V.S.O.Y.: Data acquisition, Formal analysis. I.D.: Data acquisition and curation, Formal analysis. A.F.R.Z.: Data acquisition, Methodology. C.M.: Material and methods, Gas analysis, Data curation. J.M.: Writing, Reviewing, Proofreading. All authors have read and agreed to the published version of the manuscript.
Funding
This study was funded by the German Federal Ministry of Education and Research (BMBF) within the WASCAL II Research Call (WRAP 2.0) under the project “Greenhouse Gas Determination in West Africa’s Agricultural Landscapes” (GreenGaDe) within the framework of the West African Science Service Centre for Climate Change and Adapted Land Use (WASCAL); grant numbers 01LG2081A (Burkina Faso and Niger) and, 01LG2078A (Germany). The research was also financially supported by the Capacity Building Initiative for Transparency (CBIT) for logistical assistance through the Ministry of Environment, Water, and Sanitation of Burkina Faso.
Data Availability Statement
The datasets analyzed in this study are available upon reasonable request from the corresponding author.
Acknowledgments
We thank the project managers of the GreenGade project (Greenhouse Gas Determination in West Africa’s Agricultural Landscapes), Larissa Raatz, Juliane Helm, and Juliane Alison Christ for their support. We extend our gratitude to field guides and local populations for their assistance.
Conflicts of Interest
The authors declare no conflicts of interest.
References
- IPCC. Climate Change 2022: Mitigation of Climate Change; Contribution of Working Group 656 III to the Sixth Assessment Report of the Intergovernmental Panel on Climate Change, 657 Chapter 11; Climate Change; IPCC: Geneva, Switzerland, 2022. [Google Scholar]
- Ge, X.; Xie, D.; Mulder, J.; Duan, L. Reevaluating the Drivers of Fertilizer-Induced N2O Emission: Insights from Interpretable Machine Learning. Environ. Sci. Technol. 2024, 58, 15672–15680. [Google Scholar] [CrossRef] [PubMed]
- Guo, C.; Liu, X.; He, X. A Global Meta-Analysis of Crop Yield and Agricultural Greenhouse Gas Emissions under Nitrogen Fertilizer Application. Sci. Total Environ. 2022, 831, 154982. [Google Scholar] [CrossRef] [PubMed]
- Yao, Z.; Guo, H.; Wang, Y.; Zhan, Y.; Zhang, T.; Wang, R.; Zheng, X.; Butterbach-Bahl, K. A Global Meta-Analysis of Yield-Scaled N2O Emissions and Its Mitigation Efforts for Maize, Wheat, and Rice. Glob. Chang. Biol. 2024, 30, e17177. [Google Scholar] [CrossRef] [PubMed]
- Liang, L.L.; Grantz, D.A.; Jenerette, G.D. Multivariate Regulation of Soil CO2 and N2O Pulse Emissions from Agricultural Soils. Glob. Chang. Biol. 2016, 22, 1286–1298. [Google Scholar] [CrossRef]
- Pelster, D.; Rufino, M.; Rosenstock, T.; Mango, J.; Saiz, G.; Diaz-Pines, E.; Baldi, G.; Butterbach-Bahl, K. Smallholder Farms in Eastern African Tropical Highlands Have Low Soil Greenhouse Gas Fluxes. Biogeosciences 2017, 14, 187–202. [Google Scholar] [CrossRef]
- Shakoor, A.; Shahzad, S.M.; Chatterjee, N.; Arif, M.S.; Farooq, T.H.; Altaf, M.M.; Tufail, M.A.; Dar, A.A.; Mehmood, T. Nitrous Oxide Emission from Agricultural Soils: Application of Animal Manure or Biochar? A Global Meta-Analysis. J. Environ. Manag. 2021, 285, 112170. [Google Scholar] [CrossRef]
- Cowan, N.; Levy, P.; Moring, A.; Simmons, I.; Bache, C.; Stephens, A.; Marinheiro, J.; Brichet, J.; Song, L.; Pickard, A.; et al. Nitrogen Use Efficiency and N2O and NH3 Losses Attributed to Three Fertiliser Types Applied to an Intensively Managed Silage Crop. Biogeosciences 2019, 16, 4731–4745. [Google Scholar] [CrossRef]
- Menegat, S.; Ledo, A.; Tirado, R. Greenhouse Gas Emissions from Global Production and Use of Nitrogen Synthetic Fertilisers in Agriculture. Sci. Rep. 2022, 12, 14490. [Google Scholar] [CrossRef]
- Tian, H.; Xu, R.; Canadell, J.G.; Thompson, R.L.; Winiwarter, W.; Suntharalingam, P.; Davidson, E.A.; Ciais, P.; Jackson, R.B.; Janssens-Maenhout, G.; et al. A Comprehensive Quantification of Global Nitrous Oxide Sources and Sinks. Nature 2020, 586, 248–256. [Google Scholar] [CrossRef]
- Omotoso, A.B.; Omotayo, A.O. The Interplay between Agriculture, Greenhouse Gases, and Climate Change in Sub-Saharan Africa. Reg. Environ. Chang. 2024, 24, 1. [Google Scholar] [CrossRef]
- Manka’abusi, D.; Lompo, D.J.P.; Steiner, C.; Ingold, M.; Akoto-Danso, E.K.; Werner, S.; Häring, V.; Nyarko, G.; Marschner, B.; Buerkert, A. Carbon Dioxide and Gaseous Nitrogen Emissions from Biochar-Amended Soils under Wastewater Irrigated Urban Vegetable Production of Burkina Faso and Ghana. J. Plant Nutr. Soil Sci. 2020, 183, 500–516. [Google Scholar] [CrossRef]
- Tongwane, M.I.; Moeletsi, M.E. A Review of Greenhouse Gas Emissions from the Agriculture Sector in Africa. Agric. Syst. 2018, 166, 124–134. [Google Scholar] [CrossRef]
- Xia, F.; Mei, K.; Xu, Y.; Zhang, C.; Dahlgren, R.A.; Zhang, M. Response of N2O Emission to Manure Application in Field Trials of Agricultural Soils across the Globe. Sci. Total Environ. 2020, 733, 139390. [Google Scholar] [CrossRef] [PubMed]
- Wang, X.; Bai, J.; Xie, T.; Wang, W.; Zhang, G.; Yin, S.; Wang, D. Effects of Biological Nitrification Inhibitors on Nitrogen Use Efficiency and Greenhouse Gas Emissions in Agricultural Soils: A Review. Ecotoxicol. Environ. Saf. 2021, 220, 112338. [Google Scholar] [CrossRef]
- IPCC. Chapter 11: N2O Emissions from Managed Soils, and CO2 Emissions from Lime and Urea Application; IPCC: Geneva, Switzerland, 2019. [Google Scholar]
- Umemiya, C.; White, M.K. National GHG Inventory Capacity in Developing Countries–a Global Assessment of Progress. Clim. Policy 2024, 24, 164–176. [Google Scholar] [CrossRef]
- Cui, X.; Zhou, F.; Ciais, P.; Davidson, E.A.; Tubiello, F.N.; Niu, X.; Ju, X.; Canadell, J.G.; Bouwman, A.F.; Jackson, R.B.; et al. Global Mapping of Crop-Specific Emission Factors Highlights Hotspots of Nitrous Oxide Mitigation. Nat. Food 2021, 2, 886–893. [Google Scholar] [CrossRef]
- Githongo, M.W.; Musafiri, C.M.; Macharia, J.M.; Kiboi, M.N.; Fliessbach, A.; Muriuki, A.; Ngetich, F.K. Greenhouse Gas Fluxes from Selected Soil Fertility Management Practices in Humic Nitisols of Upper Eastern Kenya. Sustainability 2022, 14, 1938. [Google Scholar] [CrossRef]
- Zheng, J.; Qu, Y.; Kilasara, M.M.; Mmari, W.N.; Funakawa, S. Soil-Atmosphere Exchange of Nitrous Oxide in Two Tanzanian Croplands: Effects of Nitrogen and Stover Management. Agric. For. Meteorol. 2019, 275, 24–36. [Google Scholar] [CrossRef]
- Yang, X.; Li, S.; Du, T.; Kang, S.; Siddique, K.H.M.; Butterbach-Bahl, K. Greenhouse Gas Emissions and Crop-Specific Emission Factors of Eight Upland Crops Based on a Six-Year Field Experiment in the North China Plain. Sustain. Prod. Consum. 2024, 50, 416–430. [Google Scholar] [CrossRef]
- Leitner, S.; Pelster, D.E.; Werner, C.; Merbold, L.; Baggs, E.M.; Mapanda, F.; Butterbach-Bahl, K. Closing Maize Yield Gaps in Sub-Saharan Africa Will Boost Soil N2O Emissions. Curr. Opin. Environ. Sustain. 2020, 47, 95–105. [Google Scholar] [CrossRef]
- Musafiri, C.M.; Macharia, J.M.; Kiboi, M.N.; Ng’etich, O.K.; Shisanya, C.A.; Okeyo, J.M.; Mugendi, D.N.; Okwuosa, E.A.; Ngetich, F.K. Soil Greenhouse Gas Fluxes from Maize Cropping System under Different Soil Fertility Management Technologies in Kenya. Agric. Ecosyst. Environ. 2020, 301, 107064. [Google Scholar] [CrossRef]
- Macharia, J.M.; Pelster, D.E.; Ngetich, F.K.; Shisanya, C.A.; Mucheru-Muna, M.; Mugendi, D.N. Soil Greenhouse Gas Fluxes From Maize Production Under Different Soil Fertility Management Practices in East Africa. J. Geophys. Res. Biogeosci. 2020, 125, e06977. [Google Scholar] [CrossRef]
- Raji, G.S.; Dörsch, P. Effect of Legume Intercropping on N2O Emissions and CH4 Uptake during Maize Production in the Great Rift Valley, Ethiopia. Biogeosciences 2020, 17, 345–359. [Google Scholar] [CrossRef]
- Bougma, P.t.C.; Bondé, L.; Yaro, V.S.O.; Gebremichael, A.W.; Ouédraogo, O. Assessing Carbon Emissions from Biomass Burning in Croplands in Burkina Faso, West Africa. Fire 2023, 6, 402. [Google Scholar] [CrossRef]
- Yaro, V.S.O.; Bondé, L.; Bougma, P.T.C.; Sedgo, I.; Guuroh, R.T.; Gebremichael, A.W.; Neya, T.; Linstädter, A.; Ouédraogo, O. Greenhouse Gas Emission from Prescribed Fires Is Influenced by Vegetation Types in West African Savannas. Sci. Rep. 2024, 14, 23754. [Google Scholar] [CrossRef]
- Atakora, W.K.; Kwakye, P.K.; Weymann, D.; Brüggemann, N. Stimulus of Nitrogen Fertilizers and Soil Characteristics on Maize Yield and Nitrous Oxide Emission from Ferric Luvisol in the Guinea Savanna Agro-Ecological Zone of Ghana. Sci. Afr. 2019, 6, e00141. [Google Scholar] [CrossRef]
- Alasinrin, S.Y.; Salako, F.K.; Busari, M.A.; Sainju, U.M.; Badmus, B.S.; Isimikalu, T.O. Greenhouse Gas Emissions in Response to Tillage, Nitrogen Fertilization, and Manure Application in the Tropics. Soil. Tillage Res. 2024, 245, 106296. [Google Scholar] [CrossRef]
- Ntinyari, W.; Gweyi-Onyango, J.P. Greenhouse Gases Emissions in Agricultural Systems and Climate Change Effects in Sub- Saharan Africa. In African Handbook of Climate Change Adaptation; Springer International Publishing: Berlin/Heidelberg, Germany, 2021; pp. 1081–1105. ISBN 9783030451066. [Google Scholar]
- Liu, P.; Lin, Y.; Liu, X.; Deng, M.; Zhang, P.; Ren, X.; Chen, X. Manure Substitution with Appropriate N Rate Enhanced the Soil Quality, Crop Productivity and Net Ecosystem Economic Benefit: A Sustainable Rainfed Wheat Practice. Field Crops Res. 2023, 304, 109164. [Google Scholar] [CrossRef]
- Wang, Y.; Li, Q.; Li, C. Organic Fertilizer Has a Greater Effect on Soil Microbial Community Structure and Carbon and Nitrogen Mineralization than Planting Pattern in Rainfed Farmland of the Loess Plateau. Front. Environ. Sci. 2023, 11, 1232527. [Google Scholar] [CrossRef]
- Wang, J.; Hussain, S.; Sun, X.; Chen, X.; Ma, Z.; Zhang, Q.; Yu, X.; Zhang, P.; Ren, X.; Saqib, M.; et al. Nitrogen Application at a Lower Rate Reduce Net Field Global Warming Potential and Greenhouse Gas Intensity in Winter Wheat Grown in Semi-Arid Region of the Loess Plateau. Field Crops Res. 2022, 280, 108475. [Google Scholar] [CrossRef]
- Yona, L.; Cashore, B.; Jackson, R.B.; Ometto, J.; Bradford, M.A. Refining National Greenhouse Gas Inventories. Ambio 2020, 49, 1581–1586. [Google Scholar] [CrossRef] [PubMed]
- Akiyama, H.; Sano, T.; Nishina, K.; Sudo, S.; Oura, N.; Fujimori, M.; Uezono, I.; Yano, S.; Ohkoshi, S.; Fujita, Y.; et al. N2O Emission Factors for Organic Amendments in Japan from Measurement Campaign and Systematic Review. Sci. Total Environ. 2023, 864, 161088. [Google Scholar] [CrossRef] [PubMed]
- He, Z.; Xia, Z.; Zhang, Y.; Liu, X.; Oenema, O.; Ros, G.H.; de Vries, W.; Xu, W.; Hou, Y.; Wang, H.; et al. Ammonia Mitigation Measures Reduce Greenhouse Gas Emissions from an Integrated Manure-Cropland System. J. Clean. Prod. 2023, 422, 138561. [Google Scholar] [CrossRef]
- Sriphirom, P.; Chidthaisong, A.; Yagi, K.; Nobuntou, W.; Luanmanee, S.; Boonapatcharoen, N.; Suksong, W. Direct Nitrous Oxide Emissions from a Crop Rotation of Maize and Mung Bean after Different Long-Term Fertilizer Applications in Thailand. Field Crops Res. 2024, 312, 109382. [Google Scholar] [CrossRef]
- Lompo, D.J.P.; Sangaré, S.A.K.; Compaoré, E.; Papoada Sedogo, M.; Predotova, M.; Schlecht, E.; Buerkert, A. Gaseous Emissions of Nitrogen and Carbon from Urban Vegetable Gardens in Bobo-Dioulasso, Burkina Faso. J. Plant Nutr. Soil. Sci. 2012, 175, 846–853. [Google Scholar] [CrossRef]
- FAO. International Institute for Applied Systems Analysis (IIASA); FAO: Rome, Italy, 2023. [Google Scholar]
- Oertel, C.; Matschullat, J.; Zurba, K.; Zimmermann, F.; Erasmi, S. Greenhouse Gas Emissions from Soils—A Review. Chem. Der Erde 2016, 76, 327–352. [Google Scholar] [CrossRef]
- Charteris, A.F.; Chadwick, D.R.; Thorman, R.E.; Vallejo, A.; de Klein, C.A.M.; Rochette, P.; Cárdenas, L.M. Global Research Alliance N2O Chamber Methodology Guidelines: Recommendations for Deployment and Accounting for Sources of Variability. J. Environ. Qual. 2020, 49, 1092–1109. [Google Scholar] [CrossRef]
- de Klein, C.A.M.; Alfaro, M.A.; Giltrap, D.; Topp, C.F.E.; Simon, P.L.; Noble, A.D.L.; van der Weerden, T.J. Global Research Alliance N2O Chamber Methodology Guidelines: Statistical Considerations, Emission Factor Calculation, and Data Reporting. J. Environ. Qual. 2020, 49, 1156–1167. [Google Scholar] [CrossRef]
- Brümmer, C.; Brüggemann, N.; Butterbach-Bahl, K.; Falk, U.; Szarzynski, J.; Vielhauer, K.; Wassmann, R.; Papen, H. Soil-Atmosphere Exchange of N2O and NO in near-Natural Savanna and Agricultural Land in Burkina Faso (W. Africa). Ecosystems 2008, 11, 582–600. [Google Scholar] [CrossRef]
- Kum, C.T.; Ngwabie, N.M.; Tening, A.S.; Tsamo, C. Soil Greenhouse Gas Fluxes and Net Global Warming Potential from Two Maize Farming Practices in the Bamenda Highlands, Cameroon. Heliyon 2024, 10, e34855. [Google Scholar] [CrossRef]
- Niu, Y.; Luo, J.; Liu, D.; Müller, C.; Zaman, M.; Lindsey, S.; Ding, W. Effect of Biochar and Nitrapyrin on Nitrous Oxide and Nitric Oxide Emissions from a Sandy Loam Soil Cropped to Maize. Biol. Fertil. Soils 2018, 54, 645–658. [Google Scholar] [CrossRef]
- Bandyopadhyay, K.; Aggarwal, P.; Chakraborty, D.; Profile, S.; Pradhan, S. Practical Manual on Measurement of Soil Physical Properties Practical; Notion Press: Chennai, India, 2012; ISBN 9788188708796. [Google Scholar]
- Kim, G.W.; Gutierrez-Suson, J.; Kim, P.J. Optimum N Rate for Grain Yield Coincides with Minimum Greenhouse Gas Intensity in Flooded Rice Fields. Field Crops Res. 2019, 237, 23–31. [Google Scholar] [CrossRef]
- Zhang, S.; Xue, L.; Liu, J.; Jia, P.; Feng, Y.; Xu, Y.; Li, Z.; Zhao, X. One–Third Substitution of Nitrogen with Cow Manure or Biochar Greatly Reduced N2O Emission and Carbon Footprint in Saline–Alkali Soils. Field Crops Res. 2024, 316, 109517. [Google Scholar] [CrossRef]
- Tandzi, L.N.; Mutengwa, C.S. Estimation of Maize (Zea mays L.) Yield Per Harvest Area: Appropriate Methods. Agronomy 2020, 10, 29. [Google Scholar] [CrossRef]
- Lightfoot, H.D.; Ratzer, G. Reliable Physics Demand Revision of the IPCC Global Warming Potentials. J. Basic. Appl. Sci. 2024, 20, 54–58. [Google Scholar] [CrossRef]
- Liang, Z.; Jin, X.; Zhai, P.; Zhao, Y.; Cai, J.; Li, S.; Yang, S.; Li, C.; Li, C. Combination of Organic Fertilizer and Slow-Release Fertilizer Increases Pineapple Yields, Agronomic Efficiency and Reduces Greenhouse Gas Emissions under Reduced Fertilization Conditions in Tropical Areas. J. Clean. Prod. 2022, 343, 131054. [Google Scholar] [CrossRef]
- R Core Team. A Language and Environment for Statistical Computing. R Foundation for Statistical Computing; R Core Team: Vienna, Austria, 2023. [Google Scholar]
- Liu, B.; Frostegård, Å.; Bakken, L.R. Impaired Reduction of N2O to N2 in Acid Soils Is Due to a Posttranscriptional Interference with the Expression of NosZ. mBio 2014, 5, e01383-14. [Google Scholar] [CrossRef]
- Gao, Z.; Wang, C.; Zhao, J.; Wang, K.; Shang, M.; Qin, Y.; Bo, X.; Chen, F.; Chu, Q. Adopting Different Irrigation and Nitrogen Management Based on Precipitation Year Types Balances Winter Wheat Yields and Greenhouse Gas Emissions. Field Crops Res. 2022, 280, 108484. [Google Scholar] [CrossRef]
- Pei, Y.; Chen, X.; Niu, Z.; Su, X.; Wang, Y.; Wang, X. Effects of Nitrogen Fertilizer Substitution by Cow Manure on Yield, Net GHG Emissions, Carbon and Nitrogen Footprints in Sweet Maize Farmland in the Pearl River Delta in China. J. Clean. Prod. 2023, 399, 136676. [Google Scholar] [CrossRef]
- Zhang, Y.; Guo, G.; Wu, H.; Mu, Y.; Liu, P.; Liu, J.; Zhang, C. The Coupling Interaction of NO2− with NH4+ or NO3− as an Important Source of N2O Emission from Agricultural Soil in the North China Plain. Sci. Total Environ. 2019, 692, 82–88. [Google Scholar] [CrossRef]
- Huang, R.; Wang, Y.; Liu, J.; Gao, J.; Zhang, Y.; Ni, J.; Xie, D.; Wang, Z.; Gao, M. Partial Substitution of Chemical Fertilizer by Organic Materials Changed the Abundance, Diversity, and Activity of NirS-Type Denitrifying Bacterial Communities in a Vegetable Soil. Appl. Soil. Ecol. 2020, 152, 103589. [Google Scholar] [CrossRef]
- Nyamadzawo, G.; Shi, Y.; Chirinda, N.; Olesen, J.E.; Mapanda, F.; Wuta, M.; Wu, W.; Meng, F.; Oelofse, M.; de Neergaard, A.; et al. Combining Organic and Inorganic Nitrogen Fertilisation Reduces N2O Emissions from Cereal Crops: A Comparative Analysis of China and Zimbabwe. Mitig. Adapt. Strateg. Glob. Chang. 2017, 22, 233–245. [Google Scholar] [CrossRef]
- Xu, Y.; Luo, B.; Jia, R.; Xiao, J.; Wang, X.; Yang, Y.; Xue, S.; Zeng, Z.; Brown, R.W.; Zang, H. Quantifying Synergies and Trade-Offs in the Food-Energy-Soil-Environment Nexus under Organic Fertilization. J. Environ. Manag. 2024, 349, 119526. [Google Scholar] [CrossRef] [PubMed]
- Zhang, T.; Liu, H.; Luo, J.; Wang, H.; Zhai, L.; Geng, Y.; Zhang, Y.; Li, J.; Lei, Q.; Bashir, M.A.; et al. Long-Term Manure Application Increased Greenhouse Gas Emissions but Had No Effect on Ammonia Volatilization in a Northern China Upland Field. Sci. Total Environ. 2018, 633, 230–239. [Google Scholar] [CrossRef]
- Hickman, J.E.; Tully, K.L.; Groffman, P.M.; Diru, W.; Palm, C.A. A Potential Tipping Point in Tropical Agriculture: Avoiding Rapid Increases in Nitrous Oxide Fluxes from Agricultural Intensification in Kenya. J. Geophys. Res. Biogeosci. 2015, 120, 938–951. [Google Scholar] [CrossRef]
- Pareja-Sánchez, E.; Cantero-Martínez, C.; Álvaro-Fuentes, J.; Plaza-Bonilla, D. Tillage and Nitrogen Fertilization in Irrigated Maize: Key Practices to Reduce Soil CO2 and CH4 Emissions. Soil. Tillage Res. 2019, 191, 29–36. [Google Scholar] [CrossRef]
- Fernández-Ortega, J.; Álvaro-Fuentes, J.; Cantero-Martínez, C. Double-Cropping, Tillage and Nitrogen Fertilization Effects on Soil CO2 and CH4 Emissions. Agric. Ecosyst. Environ. 2024, 359, 108758. [Google Scholar] [CrossRef]
- Ren, F.; Zhang, X.; Liu, J.; Sun, N.; Wu, L.; Li, Z.; Xu, M. A Synthetic Analysis of Greenhouse Gas Emissions from Manure Amended Agricultural Soils in China. Sci. Rep. 2017, 7, 8123. [Google Scholar] [CrossRef]
- Knief, C. Diversity of Methane-Cycling Microorganisms in Soils and Their Relation to Oxygen. Curr. Issues Mol. Biol. 2019, 33, 23–56. [Google Scholar] [CrossRef]
- Zhang, S.; Zamanian, K.; Raza, S.; Raheb, A.; Feng, Y.; Zhao, X. A Balance among Irrigation and Fertilization Regimes to Reduce Greenhouse Gases Emissions from Saline and Alkaline Soils. Land Degrad. Dev. 2024, 35, 168–182. [Google Scholar] [CrossRef]
- Grace, P.; De Rosa, D.; Shcherbak, I.; Strazzabosco, A.; Rowlings, D.; Scheer, C.; Barton, L.; Wang, W.; Schwenke, G.; Armstrong, R.; et al. Revised Emission Factors for Estimating Direct Nitrous Oxide Emissions from Nitrogen Inputs in Australia’s Agricultural Production Systems: A Meta-Analysis. Soil. Res. 2023, 62, SR23070. [Google Scholar] [CrossRef]
- Thorman, R.E.; Nicholson, F.A.; Topp, C.F.E.; Bell, M.J.; Cardenas, L.M.; Chadwick, D.R.; Cloy, J.M.; Misselbrook, T.H.; Rees, R.M.; Watson, C.J.; et al. Towards Country-Specific Nitrous Oxide Emission Factors for Manures Applied to Arable and Grassland Soils in the UK. Front. Sustain. Food Syst. 2020, 4, 62. [Google Scholar] [CrossRef]
- Zhang, X.; Fang, Q.; Zhang, T.; Ma, W.; Velthof, G.L.; Hou, Y.; Oenema, O.; Zhang, F. Benefits and Trade-Offs of Replacing Synthetic Fertilizers by Animal Manures in Crop Production in China: A Meta-Analysis. Glob. Chang. Biol. 2020, 26, 888–900. [Google Scholar] [CrossRef]
- Yue, Q.; Wu, H.; Sun, J.; Cheng, K.; Smith, P.; Hillier, J.; Xu, X.; Pan, G. Deriving Emission Factors and Estimating Direct Nitrous Oxide Emissions for Crop Cultivation in China. Environ. Sci. Technol. 2019, 53, 10246–10257. [Google Scholar] [CrossRef]
- Rahman, M.S.; Ferdous, J.; Mumu, N.J.; Kamruzzaman, M.; Eckhardt, C.; Zaman, M.; Müller, C.; Jahangir, M.M.R. Crop Residues Integration with Nitrogen Rates Reduces Yield-Scaled Nitrous Oxide Emissions and Improves Maize Yield and Soil Quality. J. Integr. Environ. Sci. 2024, 21, 2310856. [Google Scholar] [CrossRef]
- Hu, Y.; Li, D.; Wu, Y.; Liu, S.; Li, L.; Chen, W.; Wu, S.; Meng, Q.; Feng, H.; Siddique, K.H.M. Mitigating Greenhouse Gas Emissions by Replacing Inorganic Fertilizer with Organic Fertilizer in Wheat–Maize Rotation Systems in China. J. Environ. Manag. 2023, 344, 118494. [Google Scholar] [CrossRef]
- Wang, Y.; Liu, X.; Yan, Q.; Hu, Y. Impacts of Slash Burning on Soil Carbon Pools Vary with Slope Position in a Pine Plantation in Subtropical China. Catena 2019, 183, 104212. [Google Scholar] [CrossRef]
- Menšík, L.; Hlisnikovský, L.; Pospíšilová, L.; Kunzová, E. The Effect of Application of Organic Manures and Mineral Fertilizers on the State of Soil Organic Matter and Nutrients in the Long-Term Field Experiment. J. Soils Sediments 2018, 18, 2813–2822. [Google Scholar] [CrossRef]
- Wang, H.; Xu, J.; Liu, X.; Zhang, D.; Li, L.; Li, W.; Sheng, L. Effects of Long-Term Application of Organic Fertilizer on Improving Organic Matter Content and Retarding Acidity in Red Soil from China. Soil Tillage Res. 2019, 195, 104382. [Google Scholar] [CrossRef]
- Aluoch, S.O.; Li, Z.; Li, X.; Hu, C.; Mburu, D.M.; Yang, J.; Xu, Q.; Yang, Y.; Su, H. Effect of Mineral N Fertilizer and Organic Input on Maize Yield and Soil Water Content for Assessing Optimal N and Irrigation Rates in Central Kenya. Field Crops Res. 2022, 277, 108420. [Google Scholar] [CrossRef]
Disclaimer/Publisher’s Note: The statements, opinions and data contained in all publications are solely those of the individual author(s) and contributor(s) and not of MDPI and/or the editor(s). MDPI and/or the editor(s) disclaim responsibility for any injury to people or property resulting from any ideas, methods, instructions or products referred to in the content. |
© 2025 by the authors. Licensee MDPI, Basel, Switzerland. This article is an open access article distributed under the terms and conditions of the Creative Commons Attribution (CC BY) license (https://creativecommons.org/licenses/by/4.0/).