Article

Design of a Technical Decision-Making Strategy to Collect Biomass Waste from the Palm Oil Industry as a Renewable Energy Source: Case Study in Colombia

by
Jader Alean
1,*,
Marlon Bastidas
2,
Efraín Boom-Cárcamo
1,2,
Juan C. Maya
3,
Farid Chejne
3,
Say Ramírez
1,
Diego Nieto
4,
Carlos Ceballos
1,
Adonis Saurith
1 and
Marlon Córdoba-Ramirez
1
1
Facultad de Ingeniería, Universidad de La Guajira, Riohacha 440002, Colombia
2
Programa de Ingeniería Agroindustrial, Facultad de Ingeniería, Universidad Popular del Cesar, Valledupar 200001, Colombia
3
Grupo de Investigación TAYEA, Departamento de Procesos y Energía, Facultad de Minas, Universidad Nacional de Colombia-Sede Medellín, Medellín 050034, Colombia
4
Federación Nacional de Cultivadores de Palma de Aceite—FEDEPALMA, Bogotá 111711, Colombia
*
Author to whom correspondence should be addressed.
Environments 2025, 12(5), 165; https://doi.org/10.3390/environments12050165 (registering DOI)
Submission received: 7 February 2025 / Revised: 2 April 2025 / Accepted: 7 April 2025 / Published: 16 May 2025

Abstract

:
This work presents an effective design of a strategy to manage biomass waste (empty fruit bunch—EFB, kernel shell, and fiber) available from the processing of oil palm (Elaeis guineensis) in Colombia as a renewable energy source. This type of study is conducted for the first time in the country, and the proposed strategy is structured in four phases. Firstly, an inventory of available biomass waste was prepared based on information from 45 African palm oil companies of the approximately 70 that exist in the country. It was determined that the country had about 2762 kt of available waste (63.64% EFB, 12.55% kernel shell, and 23.81% fiber) for the year 2023. The estimates were conducted using a model that correlates processing capacity, the biomass generated, and the biomass demanded. The validation was performed using national reports. Subsequently, the minimum number (six) of storage centers in Colombia, where the largest amount of biomass can be stored, was determined. The center of gravity method was used to find the geographical location of each bulk storage center (municipality of Aracataca, Agustín Codazzi, San Martín, Puerto Wilches, Castilla La Nueva, and Cabuyaru). The next step was to determine the transportation costs as a decision criterion to select the best bulk storage center. When the required storage capacity does not exceed 211 kt·year−1, Agustín Codazzi is the best option because it has the lowest transportation cost (USD 1.01·t−1). When the storage capacity requirements exceed 211 kt·year−1 but are less than 423 kt·year−1, then Puerto Wilches and/or Aracataca are the best options (transportation cost of USD 1.7·t−1). In all cases, Cabuyaru has the highest costs (USD 6.56·t−1). Finally, an energy potential of 50,196 × 106 GJ·year−1 for the collected biomass was estimated, which makes this kind of waste an environmental alternative that could replace coal in Colombia.

1. Introduction

Colombia’s energy transition policies are geared toward clean energy. In this regard, agriculture plays a significant role because biomass waste has an energy potential that can be harnessed thermally, electrically, or as fuels [1]. This becomes even more important when considering the fact that the generation of agro-industrial waste in various stages of production processes is often a problem for industry, as these are not always adequately disposed of, leading to potential environmental impact. Therefore, designing strategies to give value to agro-industrial waste is crucial to promote circular economy schemes and sustainable development in a country or region [2].
In Colombia, inventories have been compiled to quantify the amount of biomass waste generated in various agricultural chains [1,3,4,5,6,7,8]. For the first semester of 2019, it was estimated that out of the 2,020,662 Agricultural Production Units (UPAs) reported by the National Administrative Department of Statistics [9], only 5.6% (13,157 UPAs) reported the utilization of their waste in agro-industrial activities; out of this quantity, 83% used their waste for composting, 15% for animal feed, and 2% for electricity, fuel, or heat generation [9]. Despite the low percentage of use for energy, it has been possible to estimate how much electricity can be generated by harnessing the available biomass in the country (15 GW for 2013) [6,8]. However, there are technical, economic, government, policy, and social barriers that make biomass utilization financially unviable [7,8,10,11,12,13,14]. One major barrier in Colombia is that a significant portion of agricultural biomass waste is produced in remote areas, directly impacting transportation costs [8]. Hence, designing biomass storage strategies to enable subsequent use is a critical aspect to effectively manage the final disposal of waste [10].
Many studies on biomass supply chains for energy purposes have been reported in the literature [15,16,17,18,19,20]. Some are based on multi-objective optimization models that aim to minimize costs while maximizing social and environmental benefits [21,22,23,24,25,26]; others include additional criteria. For instance, Zaharee et al. [27] integrate intermodal transportation (trucks and trains) into the biomass supply model according to biomass demand, a strategy that helps reduce gaseous pollutant emissions from transportation. Costa et al. [28] assess the technical, environmental, and economic impact of biomass logistics in the context of a hybrid energy system (heat and electricity). Gital-Durmaz and Bilgen [29] suggest that, in designing biomass supply chains, both the transportation distance and the available quantity of waste should be considered. Additionally, the authors recommend that the design of the supply chain should follow a strategy that includes integrating the geographic locations of biomass sources, employing a hierarchical approach with a multi-objective linear programming model aimed at maximizing profitability and minimizing the distance between collection points and power generation facilities.
Stochastic models using genetic algorithms have been employed for random decision making in biomass supply [30]. While various models exist, most studies treat biomass supply and demand as uncertain parameters. Additionally, other influential factors—such as political regulations, government subsidies, biomass market dynamics, and oil prices—are often difficult to quantify and therefore frequently overlooked [20]. No method is better than the other; the choice depends on the need and the information available to create the biomass storage strategy. This means that not all methods are used simultaneously; the method chosen will always depend on the scenario. Therefore, logistics strictly depend on factors such as location, costs, and social or environmental aspects.
In the case of palm oil production plants, the combustion of residual biomass is a feasible solution for local thermal energy needs when demanded. However, surplus biomass waste often exceeds on-site requirements, leading to untapped energy and material valorization potential. To optimize its utilization, it is crucial to design straightforward and effective methodologies to identify strategic collection points for these excess residues; transport and logistics could account for up to 90% of the total feedstock cost [31].
Integrating biomass waste into broader energy systems—such as power generation, polygeneration, or biorefinery schemes—can significantly enhance economic returns and environmental sustainability. These approaches support a circular economy by enabling the production of biofuels, biochemicals, and other high-value-added products, maximizing the efficiency of biomass resource management [32].
To achieve this, it is essential to assess the optimal conversion pathway for transforming biomass into the desired product. In this regard, thermochemical processes—primarily gasification and pyrolysis—offer a diverse range of valuable outputs. Moreover, hybrid scenarios that integrate thermochemical and biochemical conversion routes can further improve the efficiency of biomass waste utilization [32]. Regardless of the chosen optimal solution, the key bottleneck remains the supply chain and logistics required to transport biomass to the processing site.
In this study, a biomass supply strategy is proposed to establish a central biomass storage district based on criteria to group the largest amount of biomass within a smaller radius of action and generate the lowest transportation cost. The case study considers biomass waste (EFB, fiber, and kernel shell) generated from the industrial processing of oil palm fresh fruit bunches (FFBs) in Colombia. This type of work has not been carried out in the country and sets a roadmap for the utilization of biomass waste in Colombia, becoming a fundamental tool for decision makers in the agro-industrial sector of the country and for shaping public policy regarding the utilization of this type of waste.

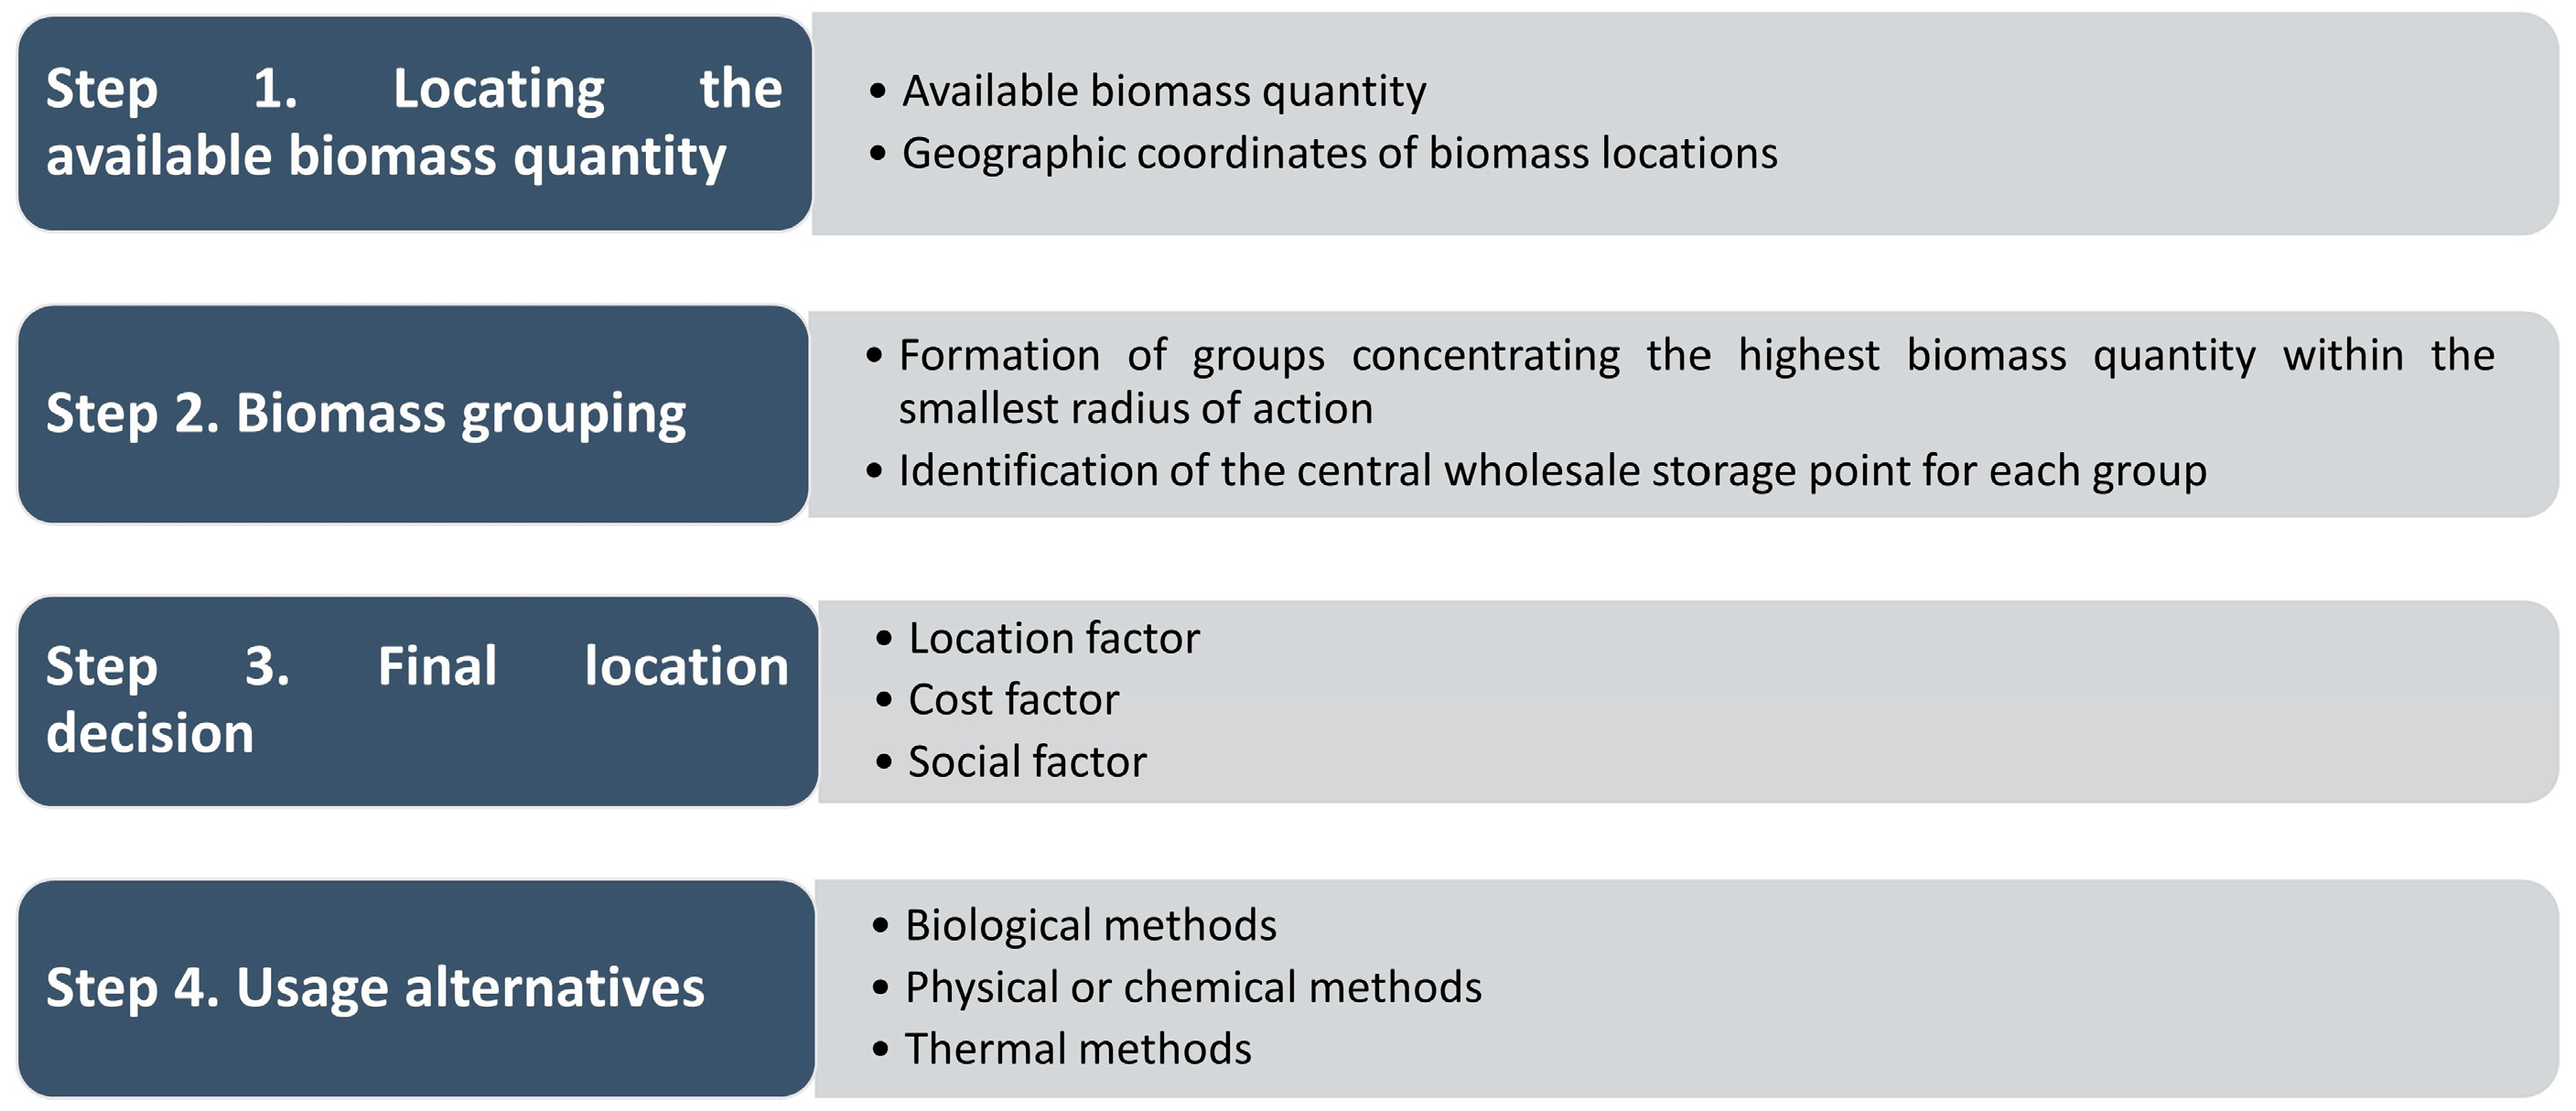
2. Materials and Methods

To compile an inventory of the available waste in oil palm companies in Colombia, 45 out of approximately 70 companies in the country were selected. The selection criteria included choosing companies with the most significant impact on national palm oil production. To implement the proposed strategy, the algorithm presented in Figure 1 is suggested.
Step 1. Locating the available biomass quantity. It is necessary to determine the amount of available biomass waste, identify the locations where it is disposed of, and obtain Cartesian coordinates for these points. The oil palm industry in Colombia has the particularity of using some of its biomass waste for internal energy generation processes. Therefore, to ascertain the quantity of available waste, it is essential to understand how much biomass is consumed internally by the companies and how much remains available. For this reason, a mathematical model (Equations (1)–(7)) was developed. It incorporates variables (required steam flow and required energy flow) and constants (boiler efficiency and calorific value of the biomass used) to estimate the biomass consumed in an oil palm industry boiler and the remaining biomass. Additionally, in the model, it is necessary to consider the value of the parameters k 1 and η . The first parameter ( k 1 , assumed to be 0.5) is a relationship that is handled experimentally in the industrial sector of oil palm processing, and it represents the tons of steam per ton of FFB. The second ( η , assumed to be 0.85) represents the efficiency of the boiler, and to determine its value, the type of boiler normally used in African palm oil companies in Colombia was considered.
m ˙ R V = k 1 m ˙ X
Q ˙ R V = k 2 m ˙ R V
Q ˙ E N = Q ˙ R V η
m ˙ F R = k 3 Q ˙ E N 100 C P F
m ˙ C R = k 3 Q ˙ E N 100 C P C
m ˙ T R = m ˙ F R + m ˙ C R
m ˙ T D = m ˙ T G m ˙ T R
where m ˙ R V is the required steam flow in t·h−1; m ˙ X is the amount of processed FFB per company in t·h−1; Q ˙ R V is the energy flow in steam in kcal·h−1; k 2 equals 0.64 Gcal ·t−1 of steam; Q ˙ E N is the required energy flow in kcal·h−1; m ˙ F R is the required fiber consumption in t·h−1; m ˙ C R is the required kernel shell consumption in t·h−1; C P F is the calorific value of the fiber, that is, 2.8 Gcal·t−1 of fiber [33]; C P C is the calorific value of the kernel shell, that is, 4.5 Gcal·t−1 of kernel shell [34] (these data are on a dry basis, and the moisture percentages are ∼55%, ∼7%, and ∼32%, respectively [33,34]). k 3 is the supply percentage (60% for fiber and 40% for kernel shell); m ˙ T R is the total biomass required by the company for use in boilers in t·h−1; m ˙ T G is the total biomass generated by each company in t·h−1; and m ˙ T D is the total biomass available in each company (kernel shell, fiber, and EFB) in t·h−1. It is important to keep in mind that all variables with a dot on top represent flows or are expressed per unit of time.
To solve the model, it is necessary to know the quantities of FFB processed by companies m ˙ X . Therefore, an inventory of the amount of FFB processed was compiled in 45 companies out of the approximately 70 existing in the country. The biomass residue generated m ˙ T G was estimated, considering that the percentage is around 45% (7% kernel shell, 14% fiber, and 24% EFB) [35,36,37,38]. From these percentages, the generated biomass residue was calculated, and with the model described above (Equations (3)–(7)), the biomass waste available per company was estimated m ˙ T D .
Step 2. Biomass grouping. After establishing the geographical location of the available biomass, groups that concentrate the highest amount of biomass within the smallest radius of action must be formed, and a central bulk storage point must be determined for each group. To determine the geographical location of a central bulk storage point, the center of gravity method is proposed. This method allows locating a central facility considering existing ones [31]. To achieve this, the quantities of biomass waste with their respective coordinates should be taken, and Equations (8) and (9) should be solved for each group.
X = i = 1 n X i m ˙ i i = 1 n m ˙ i
Y = i = 1 n Y i m ˙ i i = 1 n m ˙ i
where m ˙ i is the quantity of waste (t·year−1); X i and Y i are the Cartesian coordinates where the biomass is located; X and Y are the coordinates of the new storage center (main warehouse) or the potential company that will use the biomass.
Step 3. Final location decision. The final decision should consider factors such as location (road conditions, biomass dispersion, proximity to customers–suppliers, proximity to the main plant, ports, free trade zones, safeguarded or nature reserve zones), costs (biomass, transportation, productivity, labor, services, taxes, leasing, or land prices), and/or social aspects (availability of labor, partnerships, social security, environment, and climate).
Step 4. Usage alternatives. The criteria for choosing biomass to generate value-added products must be established. The utilization criteria can be biological (ethanol, hydrogen, sugars, composting, chemicals, CO2 capture), chemical (cellulose, pellets, plastic additives, insulating materials, binders, paper), thermal (energy, activated carbon, hydrogen, pyrolytic oil, biochar), or combinations of the mentioned criteria (polygeneration system) [5,39,40,41,42].
This study proposes the use of oil palm biomass waste from an energy perspective (combustion). To do so, its theoretical energy potential was estimated using Equation (10). Additionally, to estimate the amount of carbon dioxide generated during biomass combustion (Equation (13)), it is necessary to establish the amount of carbon in the biomass in terms of mass (Equation (11)) and moles (Equation (12)). Finally, to obtain Equation (13), it is necessary to consider that, in a complete combustion reaction, the molar ratio of C to CO2 is 1:1, as observed in the following reaction:
C + O 2 C O 2
Q ˙ i = 1000 m ˙ i P C i
m ˙ C i =   1000 m ˙ i % C T i 100
m o l ˙ C i = m ˙ C i W M C
m ˙ C O 2 i = m o l ˙ C i W M C O 2
where Q ˙ i is the amount of energy supplied by biomass (kJ·year−1); m ˙ i is the amount of biomass (t·year−1); 1000 is the conversion factor from kg to t; P C i is the higher heating value of biomass (kJ·kg−1); m ˙ C i is the amount of carbon in the studied biomass (kg·year−1); % C T i is the percentage of total carbon in the biomass; m o l ˙ C i is the amount of carbon in the studied biomass (kmol·year−1); W M C is the molecular weight of carbon (12 kg·kmol−1); m ˙ C O 2 i is the amount of carbon dioxide generated during the combustion of biomass (kg·year−1); W M C O 2 is the molecular weight of carbon dioxide (44 kg·kmol−1).
Comparing the energy potential of biomass waste (Equation (10)) with that of a fossil fuel, such as coal, Equation (14) can be used to calculate how much coal is required to supply the energy contained in the biomass. Finally, to calculate the amount of carbon dioxide that can be generated during the complete combustion of this coal (Equation (17)), just like in the biomass, it is necessary to establish the amount of carbon in coal in terms of mass (Equation (15)) or moles (Equation (16)).
m ˙ c o a l = Q ˙ i   P C c o a l
m ˙ C c o a l = m ˙ c o a l % C T c o a l 100
m o l ˙ C c o a l = m ˙ C c o a l W M C
m ˙ C O 2 c o a l = m o l ˙ C c o a l W M C O 2
where m ˙ c o a l is the amount of coal needed to replace the energy contained in the biomass (kg·year−1); P C c o a l is the higher heating value of coal (kJ·kg−1); m ˙ C c o a l is the amount of carbon in coal (kg·year−1); % C T c o a l is the percentage of total carbon in coal; m o l ˙ C c o a l is the amount of carbon in coal (kmol·year−1); and m ˙ C O 2 c o a l is the amount of carbon dioxide generated during coal combustion (kg·year−1).

3. Results and Discussion

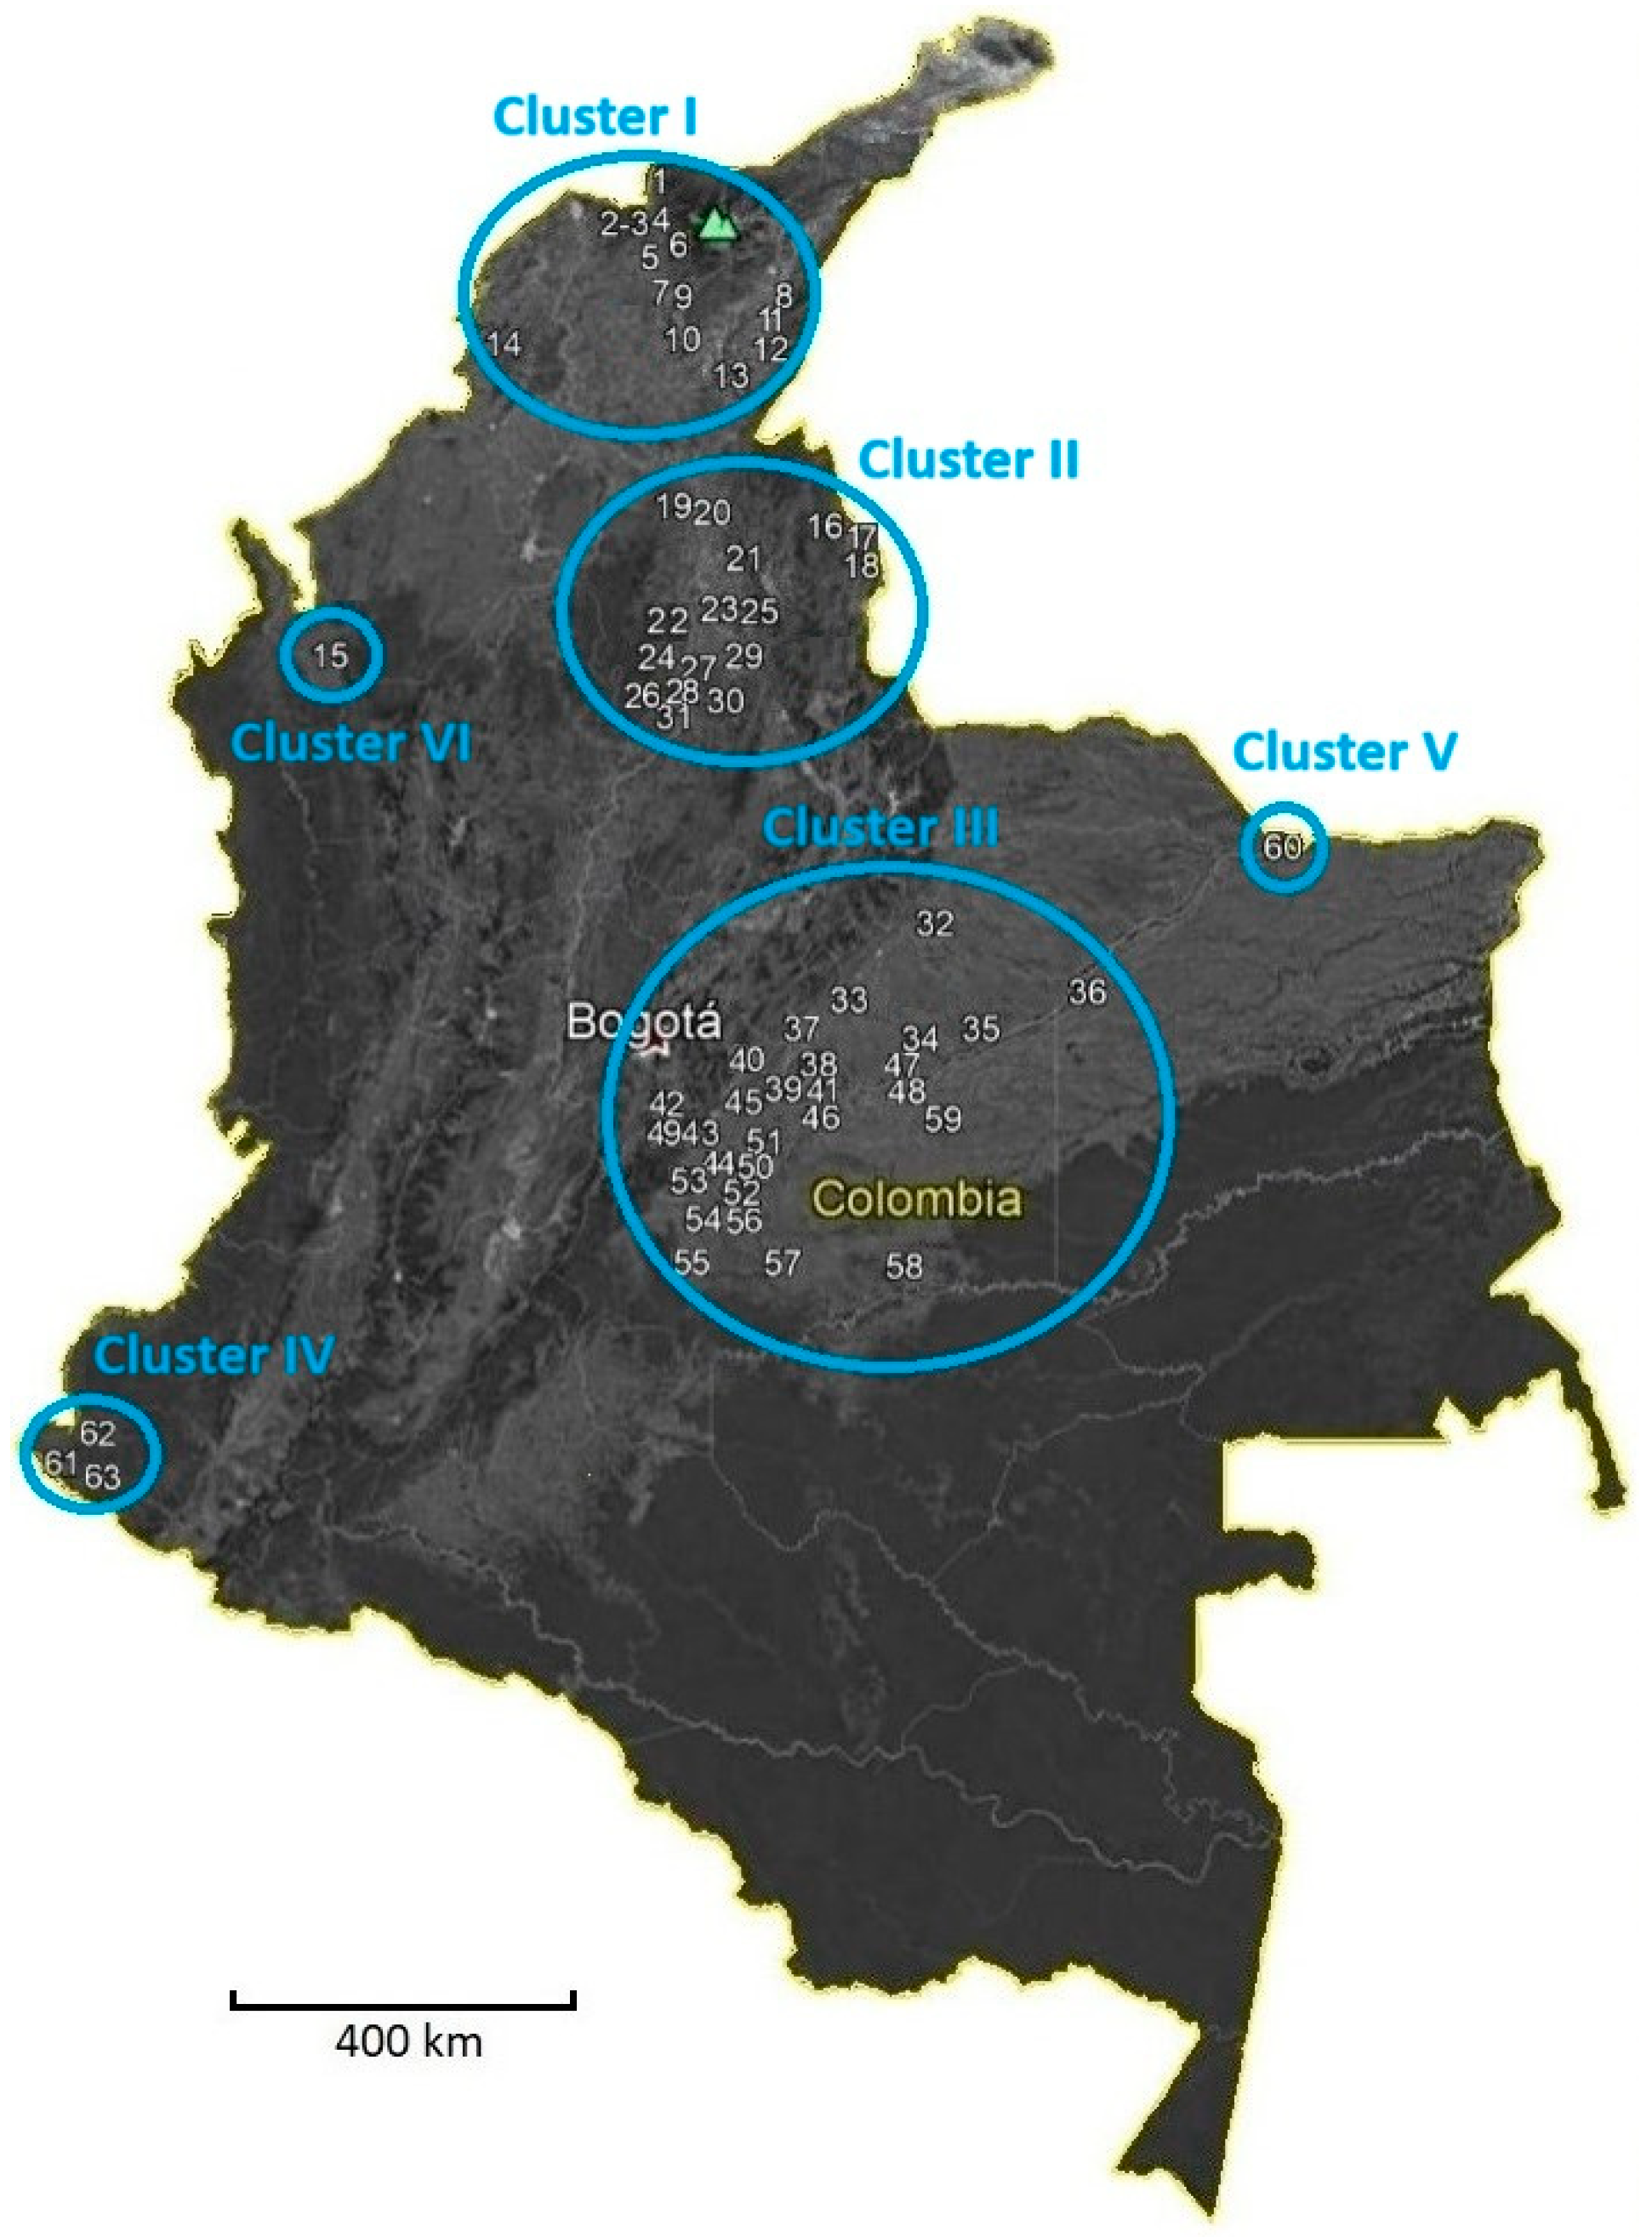
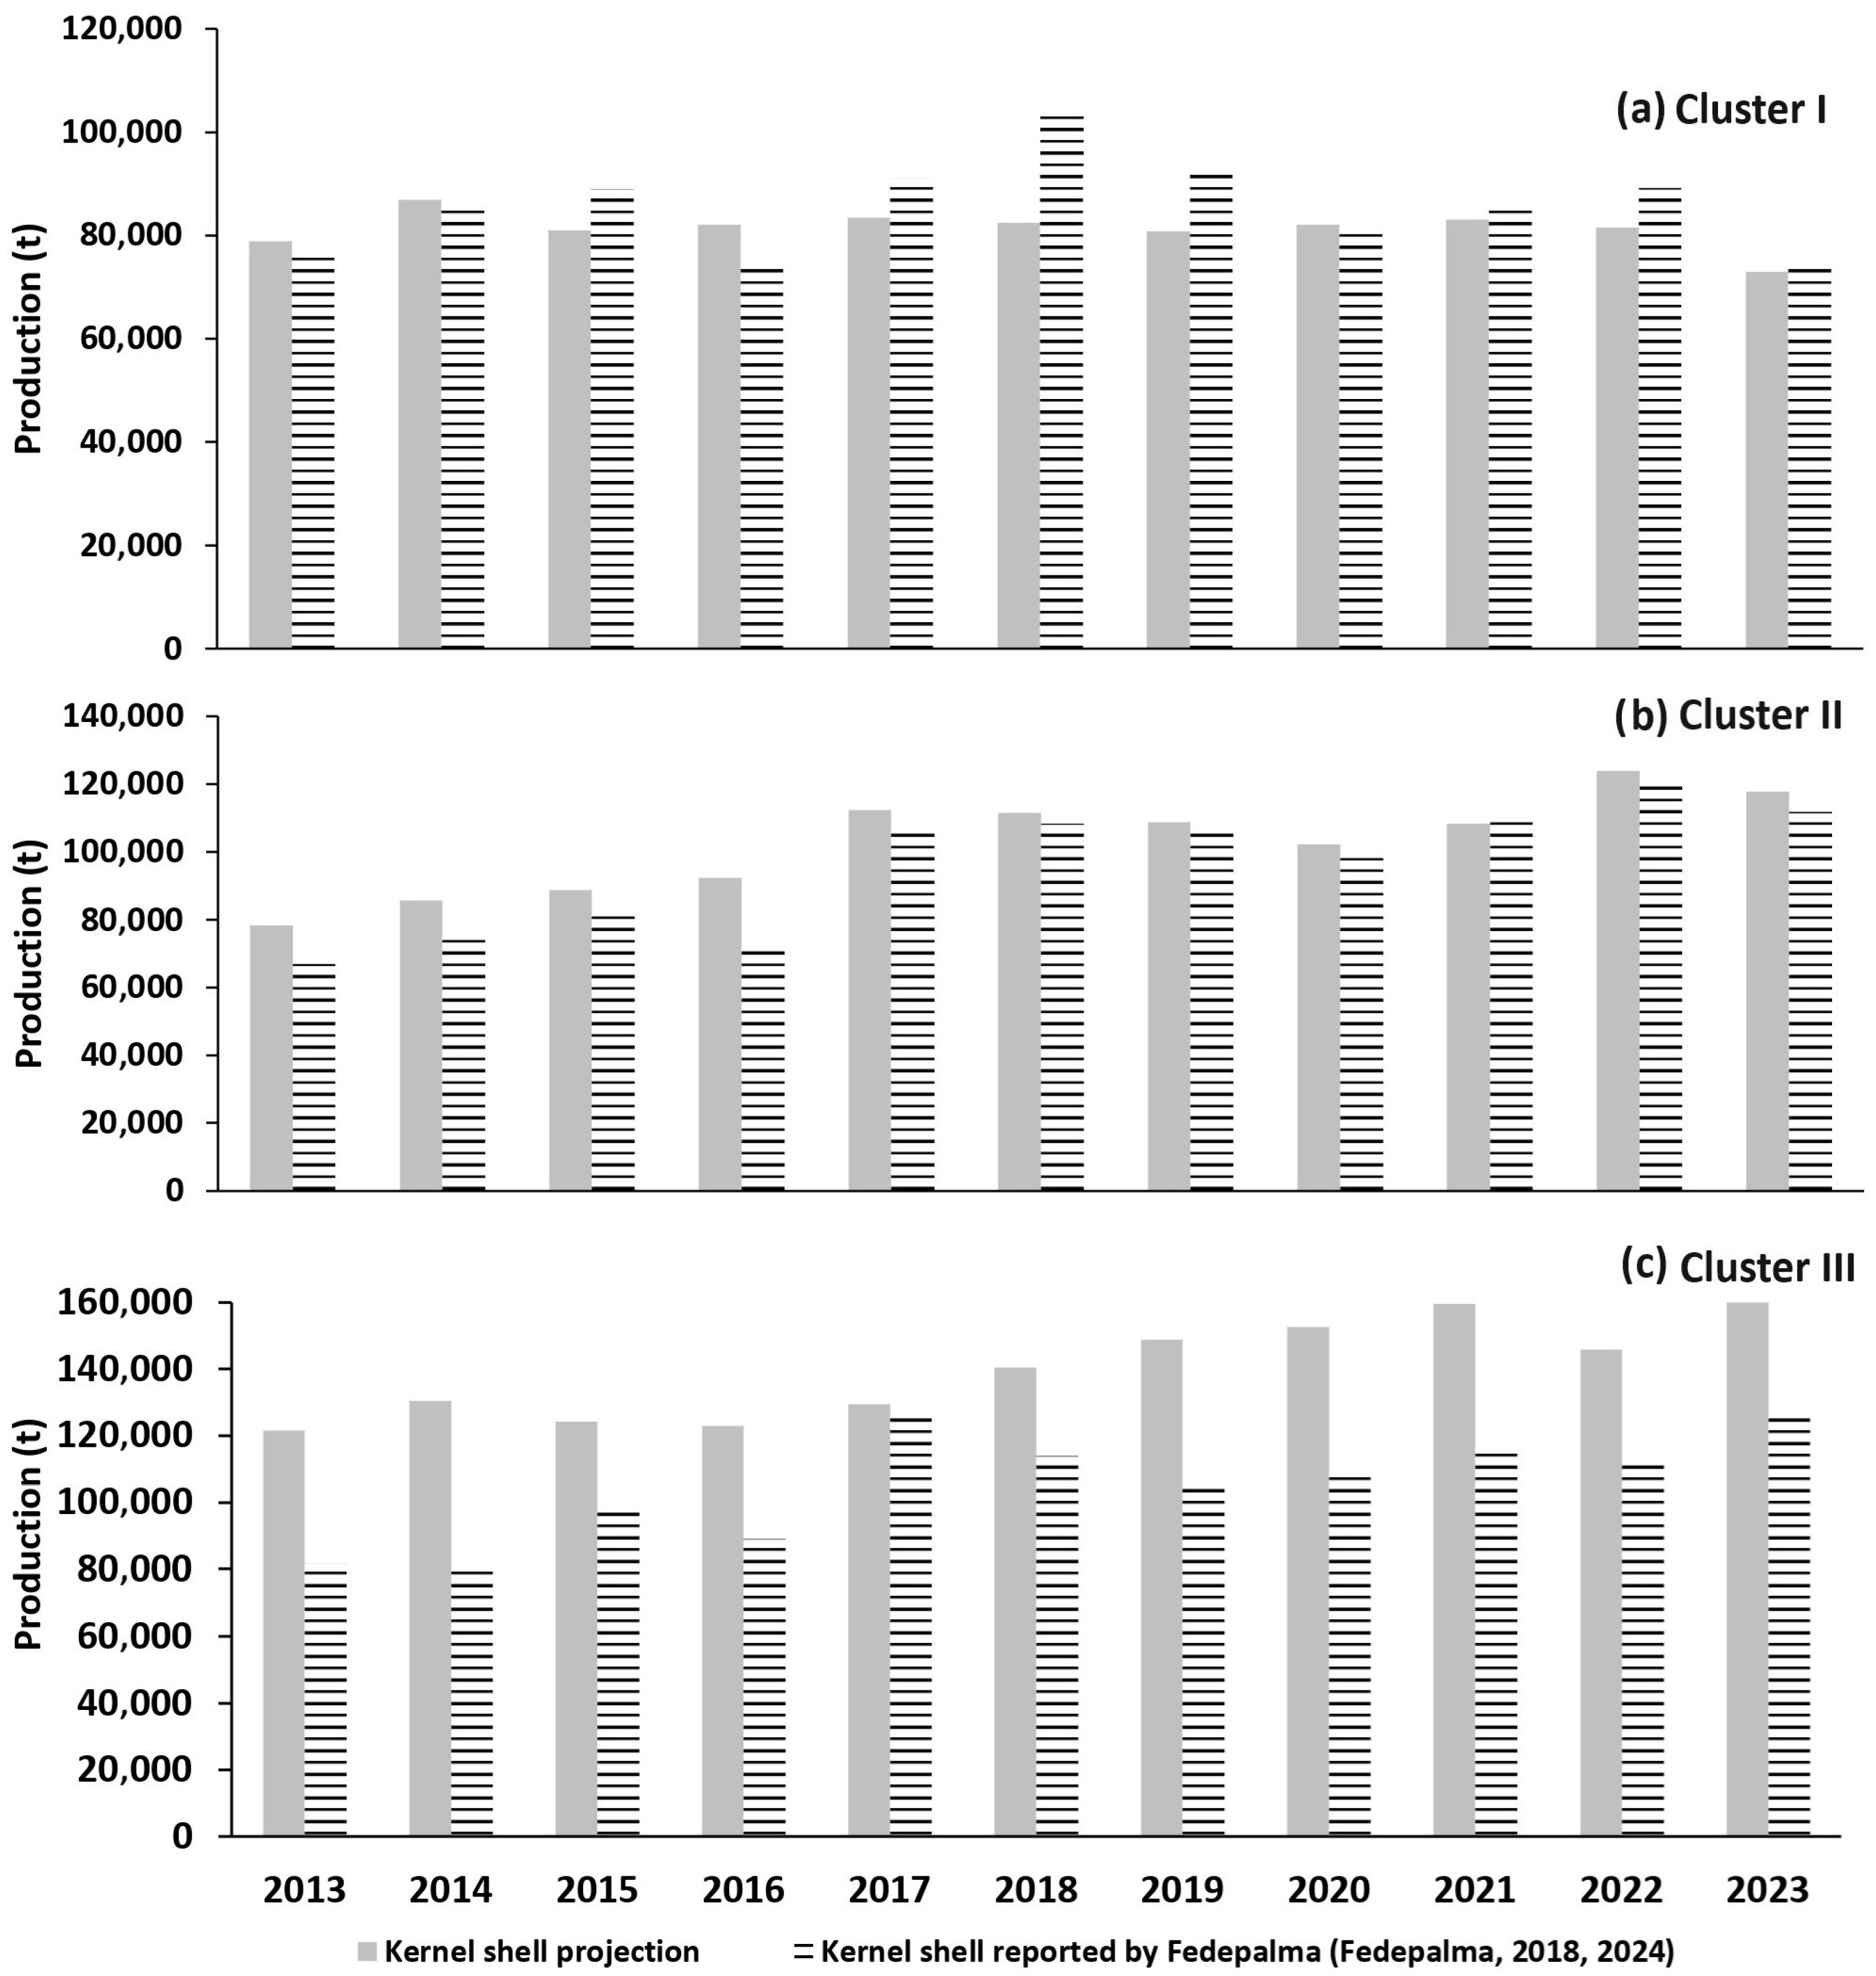
3.1. Location of Available Biomass Waste from the Oil Palm Industry

In the country, biomass waste (kernel shell, fiber, and EFB) from fresh fruit bunches (FFBs) is generated at 70 points across the national territory, corresponding to the locations of oil palm extraction companies. Figure 2 shows the map of Colombia, illustrating that the country’s palm oil industry is concentrated in six clusters (blue circles), each with a service radius of less than 400 linear kilometers. Some of the biomass waste (kernel shell and fiber) generated during the palm oil extraction process is used for energy purposes in the boilers of these companies. The remaining biomass is designated for commercialization or internal use within companies. Therefore, the amount of biomass used in boilers depends on their capacity and determines the available biomass.
The solution to the model (Equations (1)–(7)) for companies in clusters I, II, and III is presented in Table 1, Table 2 and Table 3, respectively. Cluster IV is not considered because of the low impact on national palm oil production. Clusters V and VI are not considered because waste is concentrated in only one company; they are isolated from the other clusters; and their quantity is small compared to those concentrated in clusters I, II, and III. The letters (A–O) in Table 1, Table 2 and Table 3 represent the names of the different companies. The data were collected through surveys conducted during visits to companies in the year 2019. Throughout the process, the confidentiality of the collected information was ensured. These surveys were designed in collaboration with field experts and tailored to the specific needs of our research, as this topic is of particular interest in shaping energy policy in Colombia, both at the public and private levels. With the waste contribution percentages from each of the companies and the latest official FFB production data reported to date in Colombia [43,44], an estimate of the waste available until 2023 was made (Figure 3). To achieve this, it was considered that the capacity of the companies has not grown significantly in the last ten years. It is worth noting that the estimation was not carried out beyond 2023 because, in Colombia, neither Fedepalma nor any other organization has reported more updated data yet.
To validate the estimates, only the values of kernel shell reported by Fedepalma were considered [43,44]. The country reports the national production of FFB as well as the data on available kernel shell, which is not the case for fiber and EFB. Figure 4 shows that the trends are well marked in clusters I and II; in cluster III, it is not as noticeable, which may be due to the percentages varying from company to company.

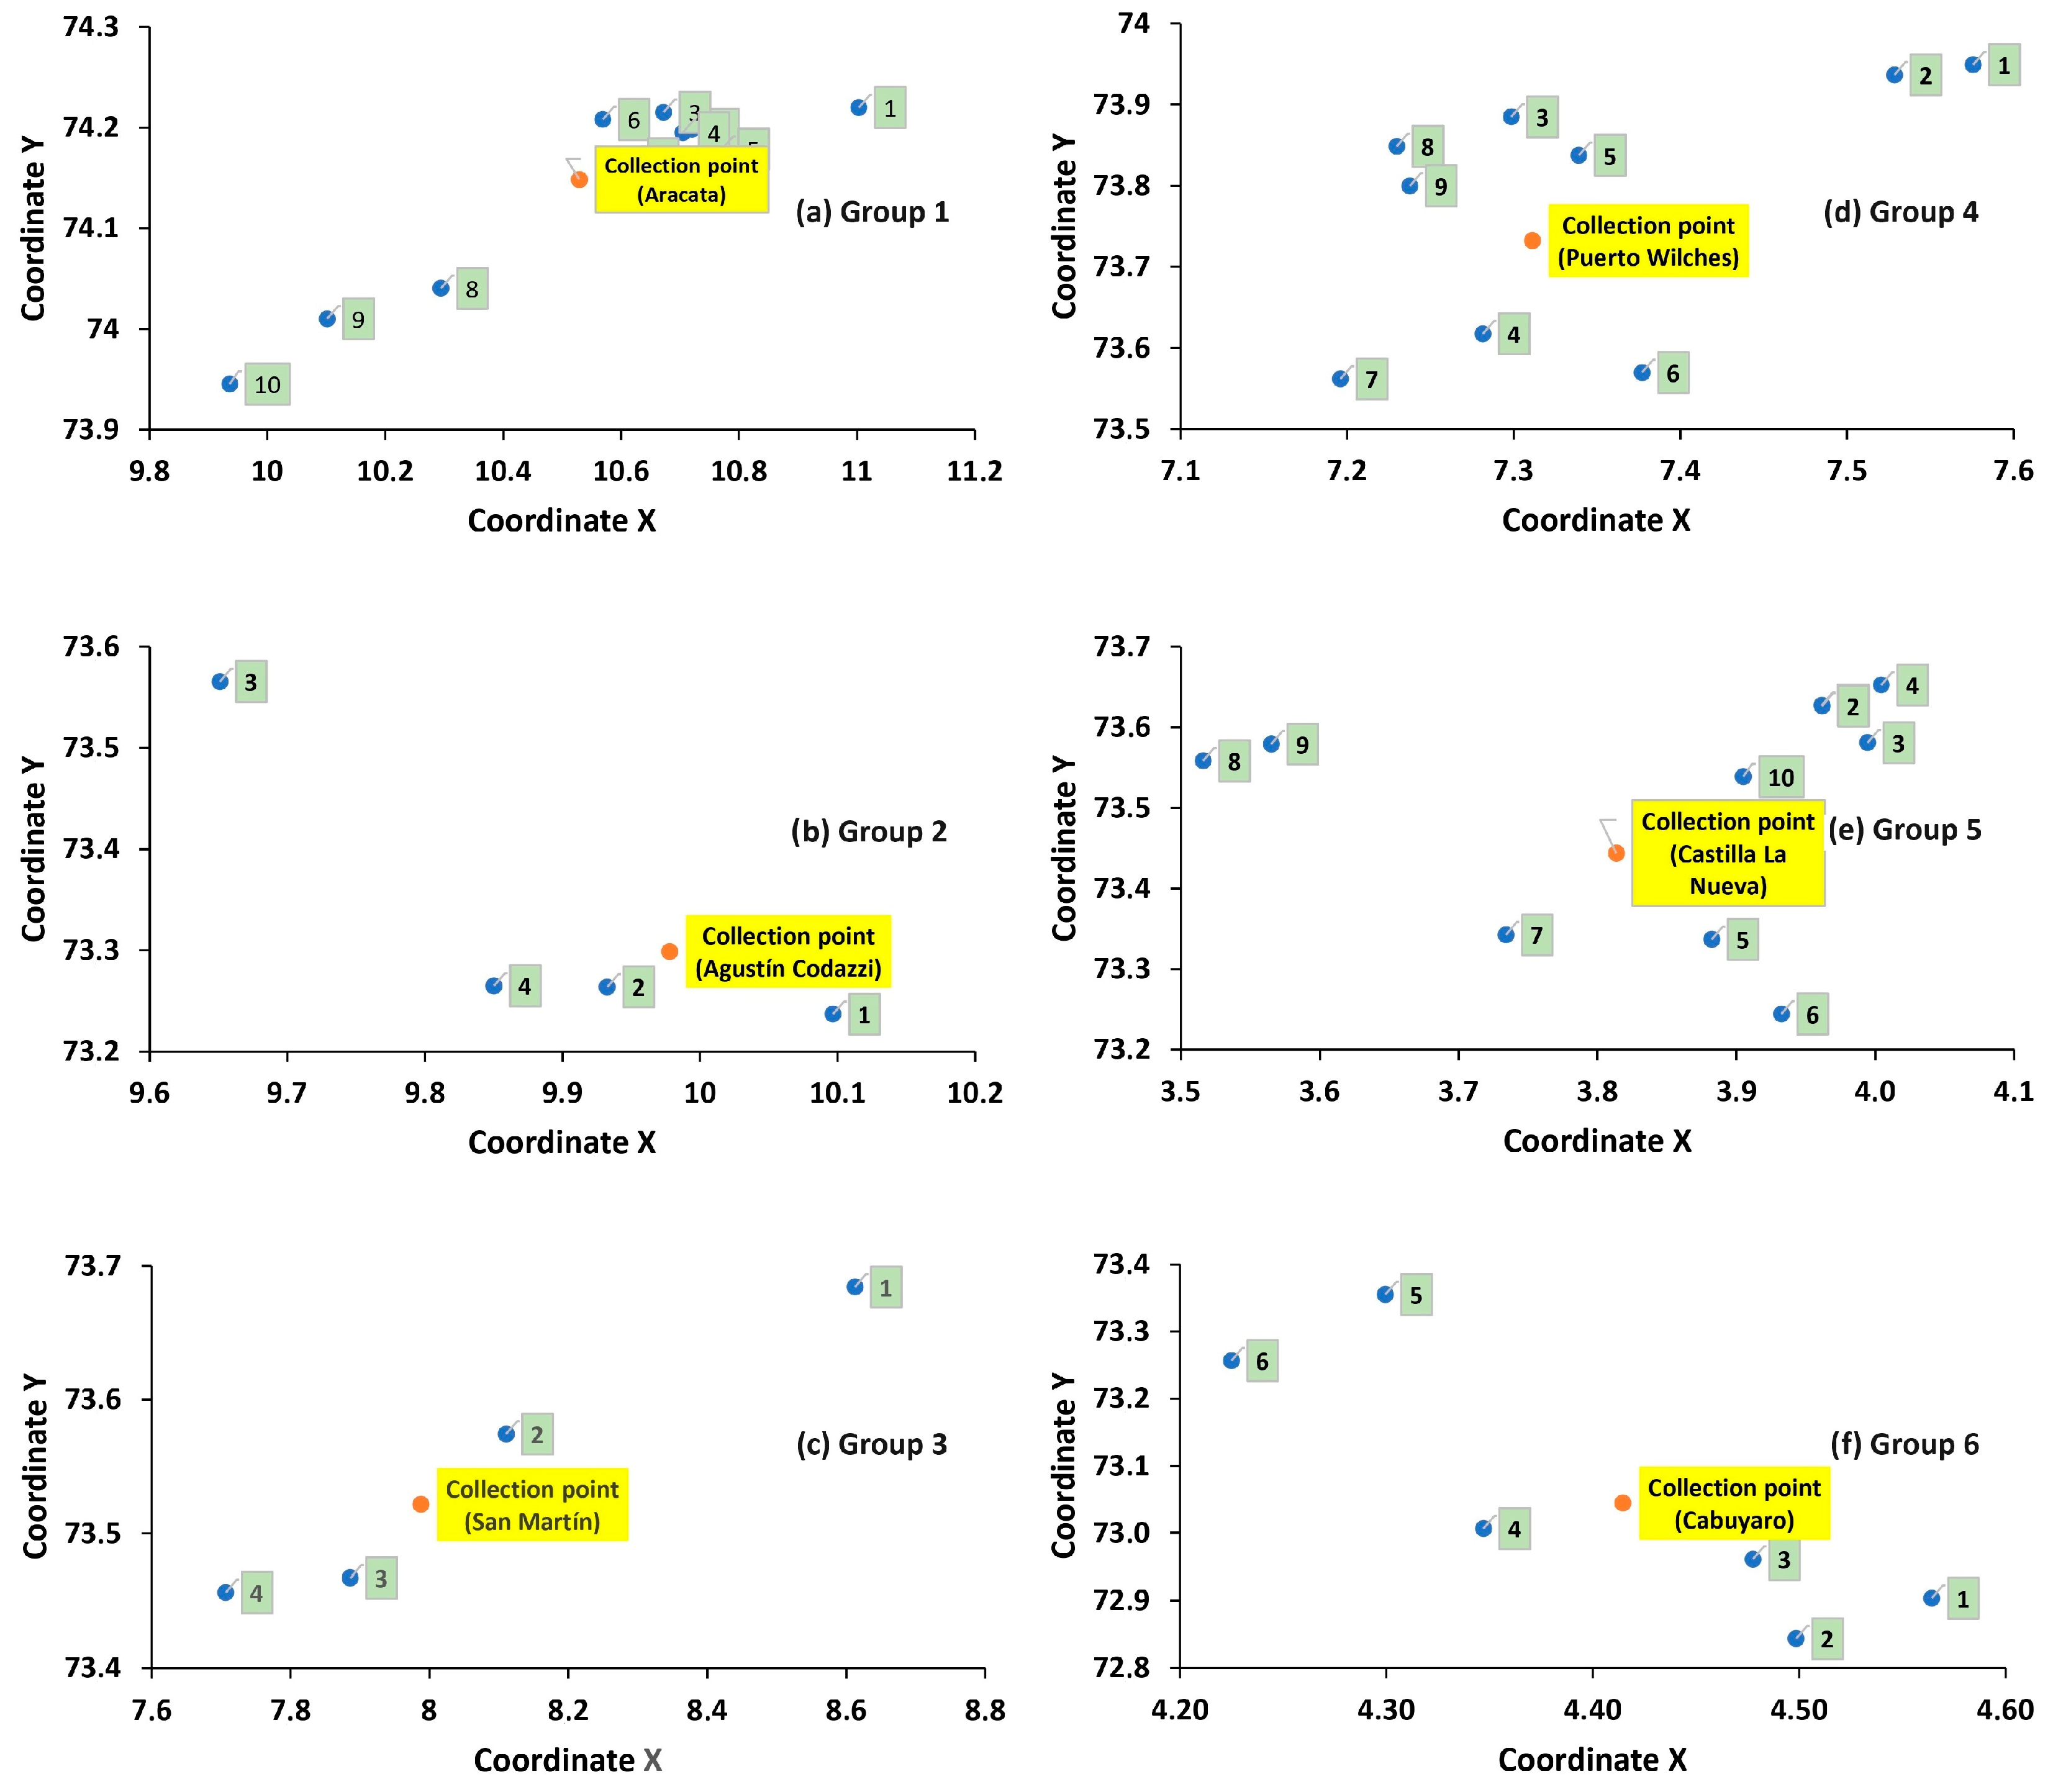
3.2. Biomass Waste Collection

As mentioned above, two criteria must be met for biomass collection: the first is grouping the largest amount of biomass over the shortest distance possible; the second is determining a central geographical collection point for each group. Therefore, to meet the first criterion, the Google Earth application was used to locate the companies (points where biomass is generated) and select those connected by roads at distances ranging from 90 to 160 km (Table 4). Studies in Colombia on the collection of other biomass waste suggest circular distances of 150 km to consider the social and economic aspects of the study area [45], such as proximity to the customer, manpower availability, corporate alliances, security, transport costs, fixed costs, and productivity costs.
Table 4 shows the distribution of companies in groups according to their proximity, assuming that, on average, companies operate 4500 h per year. Group 6 concentrates the highest amount of biomass per kilometer (4.97 kt·year−1·km−1), and the number of companies is also lower (5) compared to group 5. The latter accumulates the highest amount of biomass per year (699.7 kt·year−1), but it is dispersed over a greater distance (160 km). The data reported in Table 4 were calculated based on the biomass estimated for 2023 (Figure 3). It was considered that the national production [44] for that year was 406 t·h−1, 530 t·h−1, and 351 t·h−1 (Figure 2) for clusters I, II, and III, respectively.
To meet the criterion to determine the central collection point for each group in Table 4, the center of gravity method was used. To achieve this, it was necessary to use the geographical coordinates (Cartesian mode) of the companies. Subsequently, Equations (8) and (9) were solved for each group, thus finding the coordinates of the central bulk storage points (Figure 5). The coordinates correspond to the municipalities of Aracataca—Magdalena (group 1), Agustín Codazzi—Cesar (group 2), San Martín—Cesar (group 3), Puerto Wilches—Santander (group 4), Castilla La Nueva—Meta (group 5), and Cabuyaro—Meta (group 6). Additionally, Table 5 shows the connection distances between each company and its respective collection center.
With the groups and their central points, a window to the country is opened, showing that in Colombia, six key points can be considered for the operation of energy districts, polygeneration plants, or bulk biomass waste storage centers.

3.3. Final Decision

The cost factor was selected as the decision criterion, considering only the costs of raw materials (waste) and transportation. In the country, the unit costs of biomass per ton in 2023 were close to USD 5, USD 37.5, and USD 12.5 for EFB, kernel shell, and fiber, respectively. These costs and the amount of biomass per year (Table 4) were used to calculate the biomass costs (Table 5). To calculate transportation costs, factors such as the amount of biomass per year, the number of trips considering transportation in 25-ton trucks, loading time (2 h), unloading time (2 h), actual distance from each company to the central storage point, and the cost per kilometer of travel were considered. The latter varies for each group because it depends on variables such as tolls, travel hours, and road conditions. Many variables must be considered; therefore, the platform of the Ministry of Transportation of Colombia [46] was used to calculate the cost of transportation per kilometer in 2023.
Table 6 shows that group 6 has the highest transportation cost per ton (USD 6.56·t−1), but it does not accumulate the largest amount of biomass. However, group 2 has the lowest transportation cost per ton (USD 1.01·t−1) but collects only 30% of the biomass of group 5 (maximum amount collected per group) and 37% of what group 6 collects.
Figure 6 illustrates the relationship between variable costs (associated with biomass and transportation) and biomass availability for each analyzed scenario. This graph serves as a decision-making tool, helping identify the most cost-effective location for a biomass utilization facility by considering raw material availability and scenario-specific associated costs. The selection of a facility’s location is fundamentally constrained by biomass availability within a given region.
The decision-making process for facility installation can follow two main approaches. The first is a product-driven approach, where a specific product and its required production capacity are defined, and the necessary biomass is then estimated to meet these targets. The second is a resource-driven approach, which identifies the available biomass and determines the most viable products and their corresponding scale. In this second approach, feasibility is strictly limited by the available biomass, and the data in Table 6 would only serve to compare the variable costs of utilizing the biomass in its local region against the costs in other analyzed regions.
In contrast, when the required biomass is predetermined based on a specific production target, Figure 6 suggests that for processing capacities of up to 211 kt·year−1, establishing a collection center in Agustín Codazzi is the most cost-effective option. For capacities between 211 and 423 kt·year−1, Puerto Wilches or Aracataca emerge as viable alternatives. Facilities processing between 423 and 500 kt·year−1 would benefit from a collection center in Puerto Wilches, while for capacities exceeding 500 kt·year−1, Castilla la Nueva offers the most economically favorable location.
It is essential to highlight that these recommendations are based solely on variable cost optimization. They do not account for fixed costs, potential economies of scale, or multi-site facility configurations, which could further refine investment decisions. Future studies should explore the feasibility of multiple collection centers and distributed processing facilities to enhance overall system efficiency.

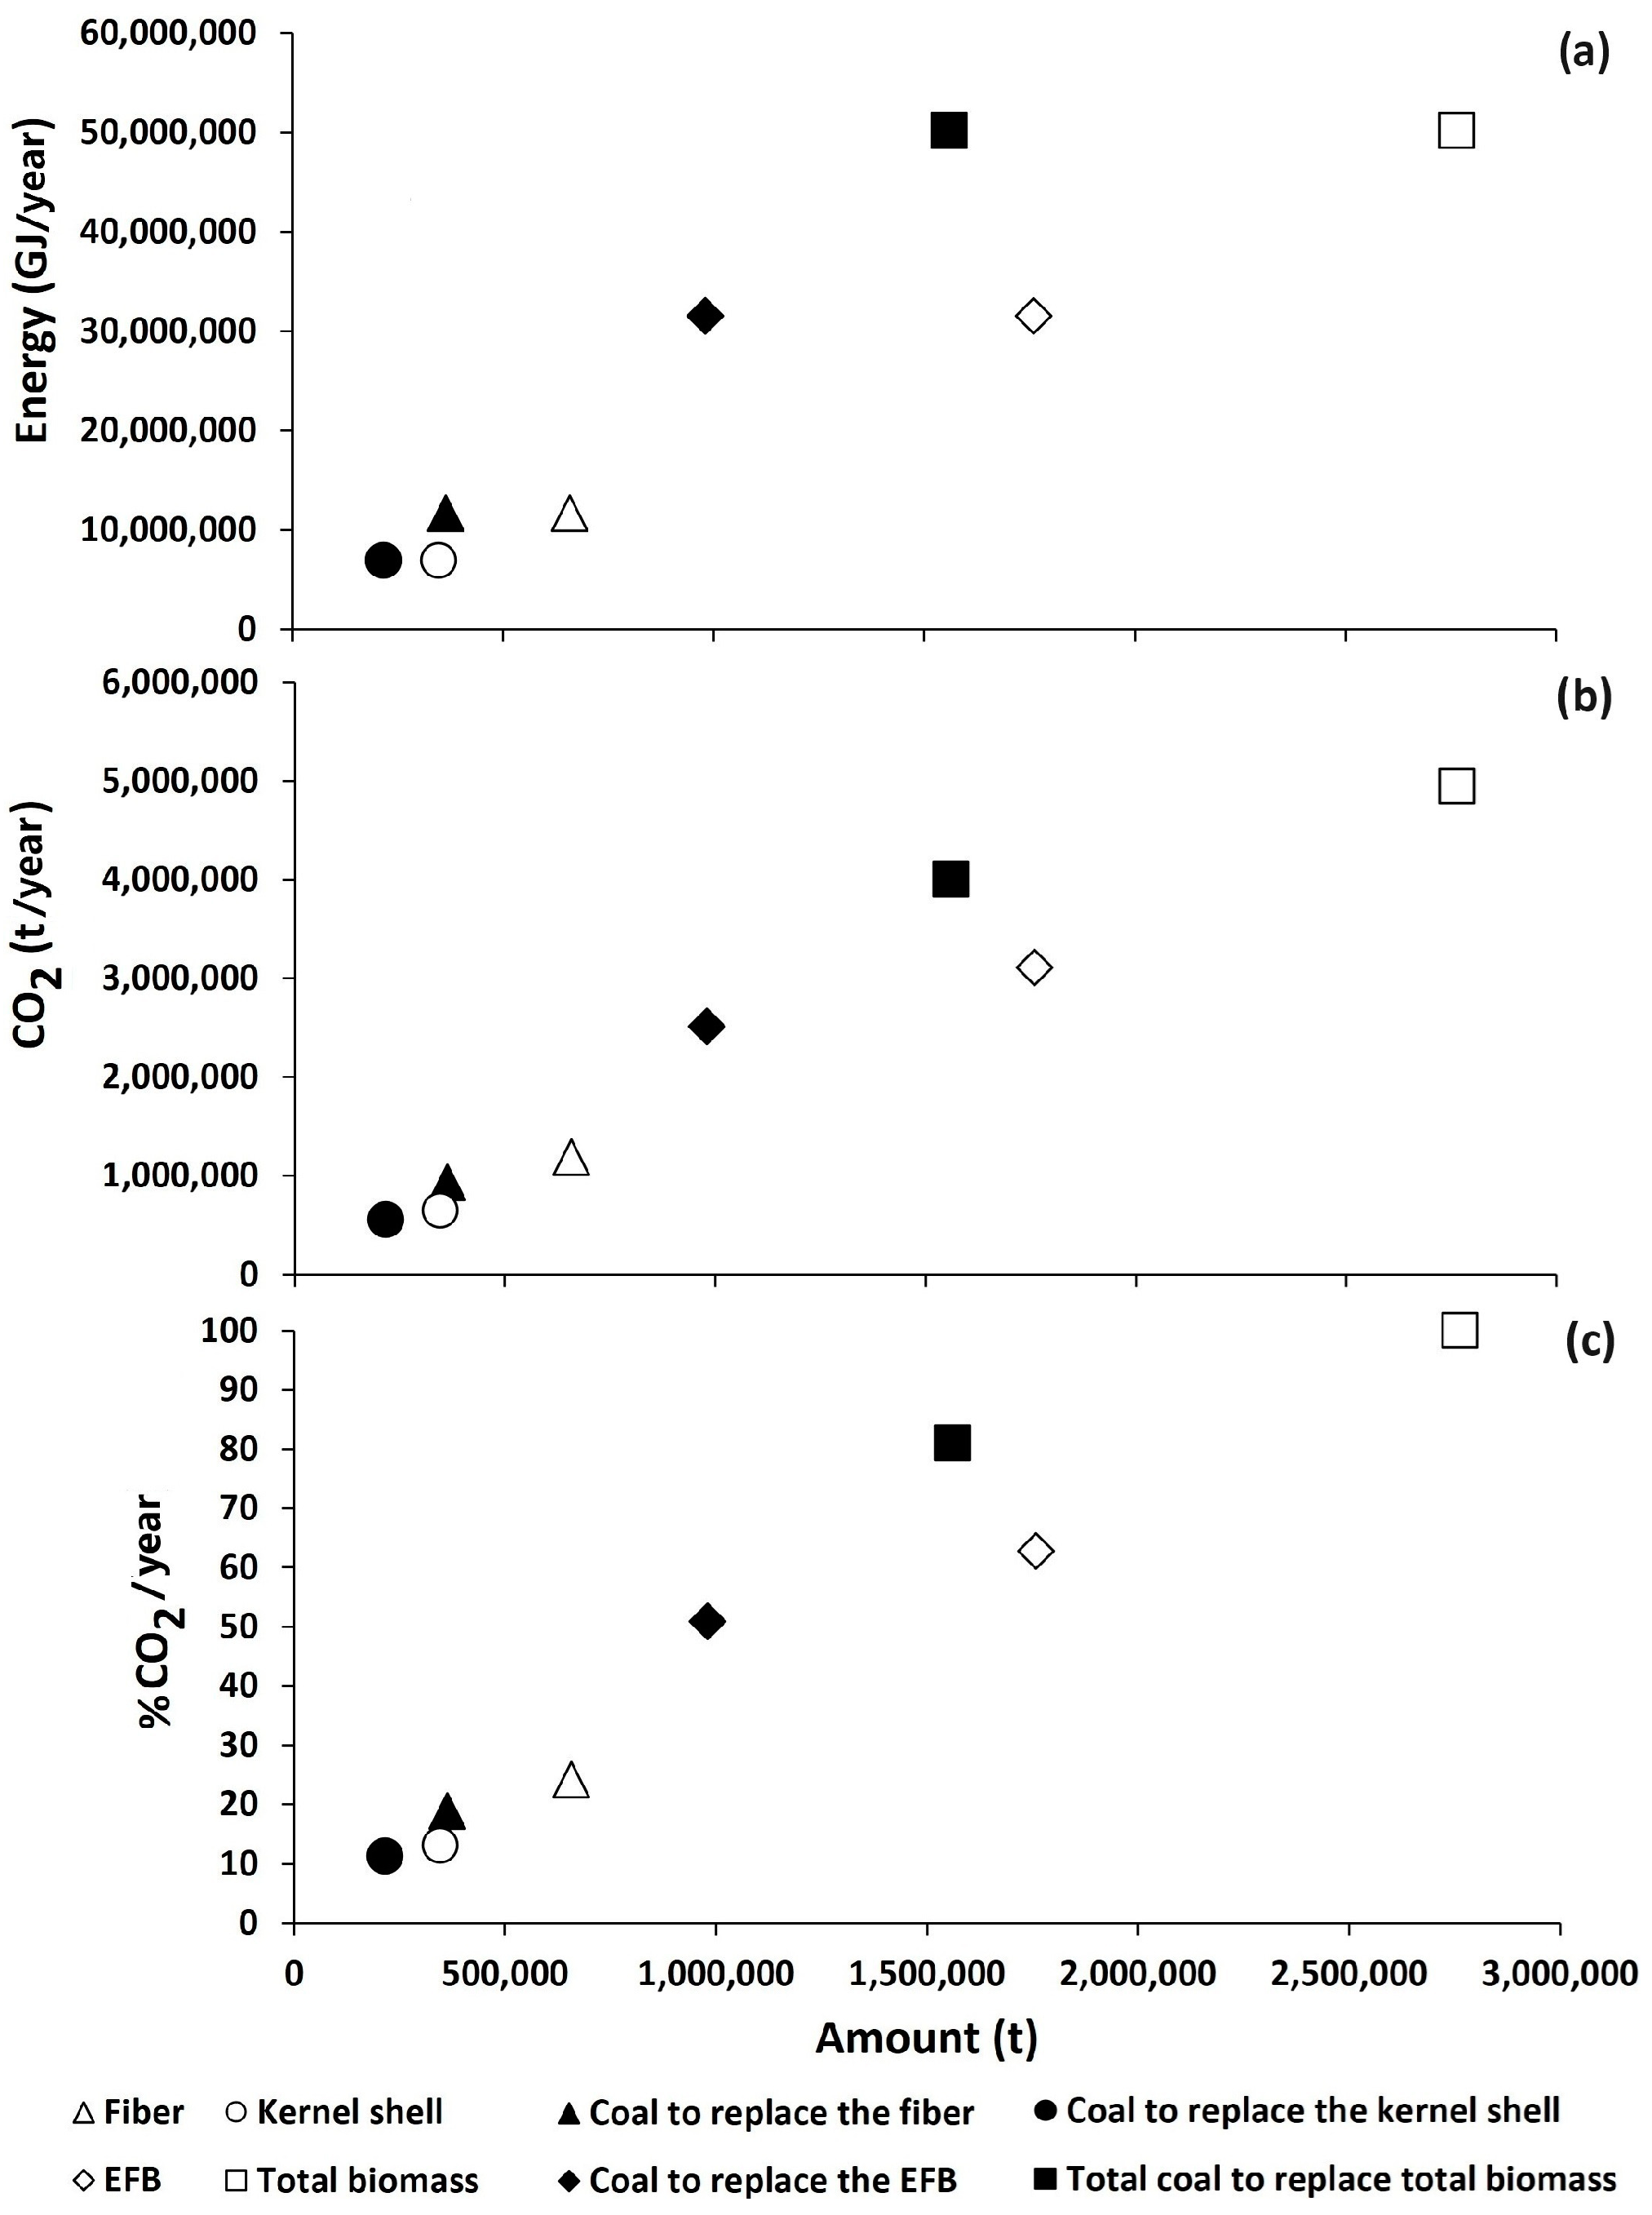
3.4. Alternative Use

According to the data presented in Table 4, it is estimated that in 2023, approximately 2.76 × 10³ kt·year−1 of biomass was available in the country, of which 63.64% was EFB, 12.55 % was kernel shell, and 23.81% was fiber. By relating these biomass quantities to their respective heating values (17,940 kJ·kg−1 for EFB, 20,095 kJ·kg−1 for kernel shell, and 17,770 kJ·kg−1 for fiber [33,34]; all data are on a dry basis, and the moisture percentages are ∼55%, ∼7%, and ∼32%, respectively [33,34]), the energy potential of the available biomass is 31.54 × 10⁶ GJ·year−1 for EFB, 6.97 × 10⁶ GJ·year−1 for kernel shell, and 11.69 × 10⁶ GJ·year−1 for fiber (Figure 7a). If we replace this energy with a non-renewable fuel like coal, around 1.56 × 10³ kt of coal would not be burned (Figure 7a). Additionally, comparing the combustion of available biomass and the mentioned amount of coal, 2.76 × 10³ kt·year−1 of biomass would generate around 4.95 × 10³ kt·year−1 of CO2 (assuming that the percentage of total carbon in fiber, EFB, and kernel shell is 49.5%, 48.19%, and 51%, respectively), while 1.56 × 10³ kt of coal with 70% of total carbon would produce around 4.00 × 10³ kt·year−1 of CO2 (Figure 7b). As observed, the value is lower; however, unlike coal, in biomass combustion, the CO2 cycle can be considered neutral because it is required by palm cultivation itself during growth; thus, it represents a reduction of around 80%·year−1 in CO2 (Figure 7c).

4. Conclusions

Biomass waste generated from palm oil processing in Colombia presents an opportunity to produce value-added products for energy purposes. In this context, it was determined that approximately 2762.6 kt of biomass was generated in 2023 by the country’s palm industries, with an energy potential of 50.20 × 10⁶ GJ, which remained available at the companies after the palm oil processing. Additionally, the study reveals the existence of six strategic points for bulk biomass storage in the country. Considering the capacities of the storage centers, the lowest biomass transportation cost is USD 1.01·t−1, and it can be used to store up to 211 kt·year−1 annually in the municipality of Codazzi. The highest transportation cost is USD 6.56·t−1, suitable for storing up to 571.47 kt·year−1 in the municipality of Cabuyaro. Finally, the thermal utilization of the available biomass is proposed as an alternative to replace coal and reduce the CO2 emissions that would result from its combustion.
It must be mentioned that future studies should employ more detailed siting optimization algorithms to refine location selection. The center of gravity method was chosen due to its low data requirements, making it suitable for Colombia, where logistical cost data, infrastructure constraints, and demand variations remain incomplete. While more sophisticated optimization approaches require extensive datasets, the center of gravity method provides a practical and computationally efficient approximation, given the current data limitations. Additionally, this study does not quantify CO2-equivalent emissions from transportation or incorporate a comprehensive life cycle analysis (LCA). Recognizing these aspects, it is important to emphasize the need for future research integrating efficiency assessments and environmental impact analyses. Despite these limitations, this paper constitutes one of the first references in the Colombian context, providing valuable baseline data for researchers, industry professionals, and policymakers.

Author Contributions

J.A.: Conceptualization, formal analysis, methodology, writing—review and editing, funding acquisition; J.C.M.: Formal analysis, writing—original draft; S.R.: Formal analysis, validation, visualization; F.C.: Conceptualization, methodology, formal analysis, resources, funding acquisition; D.N.: Validation, formal analysis, supervision; M.B.: Conceptualization, funding acquisition, resources, supervision; A.S.: Validation, writing—original draft; E.B.-C.: Conceptualization, validation, formal analysis; C.C.: Validation, writing—review and editing; M.C.-R.: Writing—original draft, writing—review and editing. All authors have read and agreed to the published version of the manuscript.

Funding

Marlon Bastidas wants to thank Universidad Popular del Cesar (agreement no. 064/2022 of internal research projects). Efrain Boom wants to thank the Minciencias Ph.D. Scholarship Program (Bicentennial number 001). Carlos Ceballos wants to thank the project “Hybrid Polygeneration Scheme (Thermochemical, Biological) for Fossil Substitution from Organic Waste”, contract number ICETEX-2022-0666. Juan C. Maya and Farid Chejne want to thank the Ministry of Science and Technology—MINCIENCIAS for co-financing the project “Development of new advanced technologies of industry 4.0 for SMEs and MSMEs for polymer processing to increase energy and productive efficiency” through contract number 127-2022. Marlon Cordoba-Ramirez wants to thank Universidad de La Guajira for financing the project “Evaluation of physicochemical properties of biochar derived from lignocellulosic biomass gasification” (agreement no. 017/2023 of internal projects). Additionally, the authors want to thank the Alliance for Biomass and Sustainability Research—ABISURE of Universidad Nacional de Colombia (Hermes code 53024).

Data Availability Statement

Data will be made available on request.

Conflicts of Interest

The authors declare no conflicts of interest.

References

  1. UPME. Atlas del Potencial Energético de la Biomasa Residual en Colombia; 2010; pp. 1–180. Available online: https://www1.upme.gov.co/siame/Paginas/atlas-del-potencial-energetico-de-la-biomasa.aspx (accessed on 22 September 2024).
  2. Hosen, M.E.; Siddik, M.N.A.; Miah, M.F.; Kabiraj, S. Biomass energy for sustainable development: Evidence from Asian countries. Environ. Dev. Sustain. 2024, 26, 3617–3637. [Google Scholar] [CrossRef]
  3. Gutiérrez, A.S.; Eras, J.J.C.; Hens, L.; Vandecasteele, C. The energy potential of agriculture, agroindustrial, livestock, and slaughterhouse biomass wastes through direct combustion and anaerobic digestion. The case of Colombia. J. Clean. Prod. 2020, 269, 122317. [Google Scholar] [CrossRef]
  4. Montes, C.F.; Felipe, A.; González, R. Potential Use of Waste from Caldense Agroindustry According to Its Structural Composition. Fac. Cienc. Básicas 2018, 14, 143–151. [Google Scholar]
  5. Ramírez, N.; Arévale, A.; García-Nuñez, J. Inventario de la biomasa disponible en plantas de beneficio para su aprovechamiento y caracterización fisicoquímica de la tusa en Colombia. Rev. Palmas 2015, 36, 41–54. [Google Scholar]
  6. UNIDO. Informe Final: Observatorio de Energia Renovable Para America Latina y el Caribe. 2013. Available online: https://www.unido.org/sites/default/files/2014-01/Management.Statement.Evaluation.Observatory.ES_0.pdf (accessed on 10 August 2024).
  7. Macías, R.J.; Ceballos, C.; Ordonez-Loza, J.; Ortiz, M.; Gómez, C.A.; Chejne, F.; Vélez, F. Evaluation of the performance of a solar photovoltaic—Biomass gasifier system as electricity supplier. Energy 2022, 260, 125046. [Google Scholar] [CrossRef]
  8. Gómez-Navarro, T.; Ribó-Pérez, D. Assessing the obstacles to the participation of renewable energy sources in the electricity market of Colombia. Renew. Sustain. Energy Rev. 2018, 90, 131–141. [Google Scholar] [CrossRef]
  9. DANE. Boletín Técnico Encuesta Nacional Agropecuaria (ENA). 2019. Available online: https://www.dane.gov.co/index.php/estadisticas-por-tema/agropecuario/encuesta-nacional-agropecuaria-ena (accessed on 26 November 2020).
  10. Hiloidhari, M.; Sharno, M.A.; Baruah, D.C.; Bezbaruah, A.N. Green and sustainable biomass supply chain for environmental, social and economic benefits. Biomass Bioenergy 2023, 175, 106893. [Google Scholar] [CrossRef]
  11. Ghimire, M.; Pandey, S.; Woo, J.R. Assessing stakeholders’ risk perception in public-private partnerships for waste-to-energy projects: A case study of Nepal. Energy Sustain. Dev. 2024, 79, 101414. [Google Scholar] [CrossRef]
  12. Auer, V.; Rauch, P. Wood supply chain risks and risk mitigation strategies: A systematic review focusing on the Northern hemisphere. Biomass Bioenergy 2021, 148, 106001. [Google Scholar] [CrossRef]
  13. Galik, C.S.; Benedum, M.E.; Kauffman, M.; Becker, D.R. Opportunities and barriers to forest biomass energy: A case study of four U.S. states. Biomass Bioenergy 2021, 148, 106035. [Google Scholar] [CrossRef]
  14. McCormick, K.; Kåberger, T. Key barriers for bioenergy in Europe: Economic conditions, know-how and institutional capacity, and supply chain co-ordination. Biomass Bioenergy 2007, 31, 443–452. [Google Scholar] [CrossRef]
  15. Martinez-Valencia, L.; Garcia-Perez, M.; Wolcott, M.P. Supply chain configuration of sustainable aviation fuel: Review, challenges, and pathways for including environmental and social benefits. Renew. Sustain. Energy Rev. 2021, 152, 111680. [Google Scholar] [CrossRef]
  16. Jazinaninejad, M.; Nematollahi, M.; Zamenjani, A.S.; Tajbakhsh, A. Sustainable operations, managerial decisions, and quantitative analytics of biomass supply chains: A systematic literature review. J. Clean. Prod. 2022, 374, 133889. [Google Scholar] [CrossRef]
  17. Marques, A.; Rasinmäki, J.; Soares, R.; Amorim, P. Planning woody biomass supply in hot systems under variable chips energy content. Biomass Bioenergy 2018, 108, 265–277. [Google Scholar] [CrossRef]
  18. James, N.; Ramli, W.; Daud, W.; Kartom, S.; Shahbudin, M.; Irwan, M.; Samsatli, S.; Frederick, J.; Tapia, D.; Azlina, W.; et al. Modelling and optimisation of oil palm biomass value chains and the environment–food–energy–water nexus in peninsular Malaysia. Biomass Bioenergy 2021, 144, 105912. [Google Scholar] [CrossRef]
  19. Bambara, L.D.F.; Sawadogo, M.; Roy, D.; Blin, J.; Anciaux, D.; Ouiminga, S.K. Wild and cultivated biomass supply chain for biofuel production. A comparative study in West Africa. Energy Sustain. Dev. 2019, 53, 1–14. [Google Scholar] [CrossRef]
  20. Zahraee, S.M.; Shiwakoti, N.; Stasinopoulos, P. Biomass supply chain environmental and socio-economic analysis: 40-Years comprehensive review of methods, decision issues, sustainability challenges, and the way forward. Biomass Bioenergy 2020, 142, 105777. [Google Scholar] [CrossRef]
  21. França, L.C.d.J.; e Silva, C.S.J.; Mucida, D.P.; da Costa, J.S.; Gomide, L.R. Towards renewable energy projects under sustainable watersheds principles for forest biomass supply. Biomass Bioenergy 2023, 176, 106916. [Google Scholar] [CrossRef]
  22. Yildiz, H.; Ayvaz, B.; Kuşakcı, A.; Deveci, M.; Garg, H. Sustainability assessment of biomass-based energy supply chain using multi-objective optimization model. Environ. Dev. Sustain. 2023, 26, 15451–15493. [Google Scholar] [CrossRef]
  23. Mohtashami, Z.; Bozorgi-Amiri, A.; Tavakkoli-Moghaddam, R. A two-stage multi-objective second generation biodiesel supply chain design considering social sustainability: A case study. Energy 2021, 233, 121020. [Google Scholar] [CrossRef]
  24. Chen, A.; Liu, Y. Designing globalized robust supply chain network for sustainable biomass-based power generation problem. J. Clean. Prod. 2023, 413, 137403. [Google Scholar] [CrossRef]
  25. Rentizelas, A.A.; Tatsiopoulos, I.P.; Tolis, A. An optimization model for multi-biomass tri-generation energy supply. Biomass Bioenergy 2009, 33, 223–233. [Google Scholar] [CrossRef]
  26. Nandi, S.; Gonela, V.; Awudu, I. A resource-based and institutional theory-driven model of large-scale biomass-based bioethanol supply chains: An emerging economy policy perspective. Biomass Bioenergy 2023, 174, 106813. [Google Scholar] [CrossRef]
  27. Zahraee, S.M.; Shiwakoti, N.; Stasinopoulos, P. Environmental emissions and cost vs. intermodal transportation technological development trade-off for the design of woody biomass supply chain. Procedia CIRP 2022, 109, 134–139. [Google Scholar] [CrossRef]
  28. Costa, M.; Piazzullo, D.; Di Battista, D.; De Vita, A. Sustainability assessment of the whole biomass-to-energy chain of a combined heat and power plant based on biomass gasification: Biomass supply chain management and life cycle assessment. J. Environ. Manag. 2022, 317, 115434. [Google Scholar] [CrossRef] [PubMed]
  29. Durmaz, Y.G.; Bilgen, B. Multi-objective optimization of sustainable biomass supply chain network design. Appl. Energy 2020, 272, 115259. [Google Scholar] [CrossRef]
  30. Mirkouei, A.; Haapala, K.R.; Sessions, J.; Murthy, G.S. A mixed biomass-based energy supply chain for enhancing economic and environmental sustainability benefits: A multi-criteria decision making framework. Appl. Energy 2017, 206, 1088–1101. [Google Scholar] [CrossRef]
  31. Martínez-Valencia, L.; Valle, J.A.; Jessup, E.; Galarza, M.P.; Chejne-Janna, F.; Garcia-Perez, M. Chapter 2—Biomass resources and supply chains. In Thermochemical Conversion of Lignocellulosic Materials; Garcia-Perez, M., Chejne-Janna, F., Eds.; Elsevier: Amsterdam, The Netherlands, 2025; pp. 33–72. [Google Scholar] [CrossRef]
  32. Ionescu, G.; Bulmǎu, C. Biomass conversion into valuable products within the integrated management of bio-resources. In E3S Web of Conferences; EDP Sciences: Les Ulis, France, 2019. [Google Scholar] [CrossRef]
  33. Talero, G.; Rincón, S.; Gómez, A. Biomass torrefaction in a standard retort: A study on oil palm solid residues. Fuel 2019, 244, 366–378. [Google Scholar] [CrossRef]
  34. Marrugo, G.; Valde, C.F.; Chejne, F. Characterization of Colombian Agroindustrial Biomass Residues as Energy Resources. Energy Fuels 2016, 30, 8386–8398. [Google Scholar] [CrossRef]
  35. Gourich, W.; Song, C.P.; Qua, K.S.; Chan, E.S. The potential of palm bioenergy in achieving Malaysia’s renewable energy target and climate ambition in line with the Paris Agreement. Energy Sustain. Dev. 2023, 76, 101296. [Google Scholar] [CrossRef]
  36. Montoya, J.; Valdés, C.; Chaquea, H.; Pecha, M.B.; Chejne, F. Surplus electricity production and LCOE estimation in Colombian palm oil mills using empty fresh bunches (EFB) as fuel. Energy 2020, 202, 101296. [Google Scholar] [CrossRef]
  37. Dalimin, M. Renewable energy update: Malaysia. Renew. Energy 1995, 6, 435–439. [Google Scholar] [CrossRef]
  38. Nabila, R.; Hidayat, W.; Haryanto, A.; Hasanudin, U.; Iryani, D.A.; Lee, S.; Kim, S.; Kim, S.; Chun, D.; Choi, H.; et al. Oil palm biomass in Indonesia: Thermochemical upgrading and its utilization. Renew. Sustain. Energy Rev. 2023, 176, 113193. [Google Scholar] [CrossRef]
  39. Abdulrazik, A.; Elsholkami, M.; Elkamel, A.; Simon, L. Multi-products productions from Malaysian oil palm empty fruit bunch (EFB): Analyzing economic potentials from the optimal biomass supply chain. J. Clean. Prod. 2017, 168, 131–148. [Google Scholar] [CrossRef]
  40. Rhofita, E.I.; Rachmat, R.; Meyer, M.; Montastruc, L. Mapping analysis of biomass residue valorization as the future green energy generation in Indonesia. J. Clean. Prod. 2022, 354, 131667. [Google Scholar] [CrossRef]
  41. Chang, G.; Shi, P.; Guo, Y.; Wang, L.; Wang, C. Enhanced pyrolysis of palm kernel shell wastes to bio-based chemicals and syngas using red mud as an additive. J. Clean. Prod. 2020, 272, 122847. [Google Scholar] [CrossRef]
  42. Anvari, S.; Aguado, R.; Jurado, F.; Fendri, M.; Zaier, H.; Larbi, A.; Vera, D. Analysis of agricultural waste/byproduct biomass potential for bioenergy: The case of Tunisia. Energy Sustain. Dev. 2024, 78, 101367. [Google Scholar] [CrossRef]
  43. Fedepalma. La agroindustria de la palma de aceite en Colombia y en el mundo 2013–2017. In Anuario Estadístico—Statistical Yearbook; Fedepalma: Bogotá, Colombia, 2018. [Google Scholar]
  44. Fedepalma. Minianuario Estadístico 2024—Principales Cifras de la Agroindustria de la Palma de Aceite en Colombia; Fedepalma: Bogotá, Colombia, 2024. [Google Scholar]
  45. Piedrahita-Rodríguez, S.; Urrea, S.C.; García, D.A.E.; Ortiz-Sánchez, M.; Solarte-Toro, J.C.; Alzate, C.A.C. Life cycle assessment and potential geolocation of a multi-feedstock biorefinery: Integration of the avocado and plantain value chains in rural zones. Bioresour. Technol. Rep. 2023, 21, 101318. [Google Scholar] [CrossRef]
  46. Mintransporte, Sistema de Información de Costos Eficientes Para el Transporte Automotor de Carga SICE-TAC—Ministerio de Transporte de Colombia. 2023. Available online: https://plc.mintransporte.gov.co/runtime/empresa/ctl/sicetac/mid/417 (accessed on 28 July 2023).
Figure 1. Biomass storage strategy for subsequent industrial use.
Environments 12 00165 g001
Figure 2. Location of oil palm extraction companies and clusters (blue circles) in Colombia.
Environments 12 00165 g002
Figure 3. Estimate of oil palm waste from 2013 to 2023 in (a) Cluster I, (b) Cluster II, and (c) Cluster III.
Environments 12 00165 g003
Figure 4. Validation of kernel shell estimates from 2013 to 2023 in (a) Cluster I, (b) Cluster II, and (c) Cluster III.
Environments 12 00165 g004
Figure 5. Waste collection points in Cartesian coordinates for (a) Group 1, (b) Group 2, (c) Group 3, (d) Group 4, (e) Group 5, and (f) Group 6.
Environments 12 00165 g005
Figure 6. Transport cost of biomass to each central point.
Environments 12 00165 g006
Figure 7. (a) Energy and (b,c) CO2 that can be generated from the estimated biomass.
Environments 12 00165 g007
Table 1. FFB waste generated and available in cluster I.
CompaniesFFB m ˙ X in t/hGenerated Biomass m ˙ T G in t/hRequired Steam Flow m ˙ R V in t/hEnergy Flow Steam Q ˙ R V in kcal·h−1Required Energy Flow Q ˙ E N in kcal·h−1Required Biomass m ˙ T R in t/hAvailable Biomass m ˙ T D in t/h
EFBKernel ShellFiberSubtotalEFBKernel ShellFiberSubtotalEFBKernel ShellFiberSubtotal
A37.098.552.855.2916.691911,868,29313,962,697-1.162.093.268.551.693.2013.43
B38.208.812.945.4517.191912,224,97514,382,323-1.202.163.368.811.743.2913.84
C35.368.152.725.0415.911811,314,33813,310,985-1.112.003.118.151.613.0512.80
D19.494.491.502.788.77106,236,0757,336,559-0.611.101.714.490.891.687.06
E53.4212.314.107.6224.042717,093,33520,109,806-1.683.024.6912.312.434.6119.35
F33.967.832.614.8515.281710,867,40812,785,186-1.071.922.987.831.542.9312.30
G29.686.842.284.2313.36159,496,95611,172,890-0.931.682.616.841.352.5610.75
H9.672.230.741.384.3553,095,5743,641,851-0.300.550.852.230.440.833.50
I5.551.280.430.792.5031,774,7542,087,946-0.170.310.491.280.250.482.01
J13.443.101.031.926.0574,300,4365,059,337-0.420.761.183.100.611.164.87
K69.8716.115.379.9731.443522,359,90526,305,771-2.193.956.1416.113.186.0225.31
L4.651.070.360.662.0921,487,3981,749,881-0.150.260.411.070.210.401.68
M32.587.512.504.6514.661610,424,70212,264,356-1.021.842.867.511.482.8111.80
N9.722.240.751.394.3853,111,2673,660,314-0.310.550.852.240.440.843.52
O15.333.531.182.196.9084,904,5175,770,020-0.480.871.353.530.701.325.55
Total40894.0431.3558.21183.60204130,559,935153,599,923-12.8023.0435.8494.0418.5535.27147.76
Table 2. FFB waste generated and available in cluster II.
CompaniesFFB m ˙ X in t/hGenerated Biomass m ˙ T G in t/hRequired Steam Flow m ˙ R V in t/hEnergy Flow Steam Q ˙ R V in kcal·h−1Required Energy Flow Q ˙ E N in kcal·h−1Required Biomass m ˙ T R in t/hAvailable Biomass m ˙ T D in t/h
EFBKernel ShellFiberSubtotalEFBKernel ShellFiberSubtotalEFBKernel ShellFiberSubtotal
A43.339.993.336.1819.502213,866,54516,313,582-1.362.453.819.991.973.7415.69
B45.8410.573.526.5420.632314,669,67417,258,440-1.442.594.0310.572.083.9516.60
C32.637.522.514.6614.681610,440,56112,283,013-1.021.842.877.521.482.8111.82
D28.896.662.224.1213.00149,245,56610,877,137-0.911.632.546.661.312.4910.46
E90.8720.956.9812.9740.894529,079,87034,211,612-2.855.137.9820.954.137.8332.91
F24.855.731.913.5511.18127,950,8859,353,982-0.781.402.185.731.132.149.00
G56.6813.064.358.0925.512818,138,39621,339,290-1.783.204.9813.062.584.8920.53
H80.8518.636.2111.5436.384025,871,07630,436,560-2.544.577.1018.633.686.9729.28
I31.887.352.454.5514.341610,200,70512,000,830-1.001.802.807.351.452.7511.54
J4.381.010.340.621.9721,400,1191,647,199-0.140.250.381.010.200.381.58
K38.158.792.935.4417.171912,207,06114,361,249-1.202.153.358.791.733.2913.82
L41.559.583.195.9318.702113,297,18315,643,745-1.302.353.659.581.893.5815.05
M22.975.291.763.2810.34117,349,6098,646,599-0.721.302.025.291.041.988.32
N7.131.640.551.023.2142,282,7492,685,587-0.220.400.631.640.320.622.58
Total550.00126.7742.2678.48247.5275176,000,000207,058,824-17.2531.0648.31126.7725.0047.42199.19
Table 3. FFB waste generated and available in cluster III.
Companies FFB m ˙ X  in t/hGenerated Biomass  m ˙ T G  in t/hRequired Steam Flow  m ˙ R V  in t/hEnergy Flow Steam Q ˙ R V in kcal·h−1Required Energy Flow Q ˙ E N in kcal·h−1Required Biomass m ˙ T R in t/hAvailable Biomass m ˙ T D in t/h
EFB Kernel Shell Fiber Subtotal EFB Kernel Shell Fiber Subtotal EFB Kernel Shell Fiber Subtotal
A23.135.331.783.3010.4111.567,400,4238,706,380-0.731.312.035.331.051.998.38
B106.4924.548.1815.1947.9253.2434,075,68940,089,046-3.346.019.3524.544.849.1838.56
C47.9111.043.686.8421.5623.9615,331,48818,037,045-1.502.714.2111.042.184.1317.35
D1.250.290.100.180.560.62399,088469,515-0.040.070.110.290.060.110.45
E63.7014.684.899.0928.6731.8520,384,32623,981,559-2.003.605.6014.682.905.4923.07
F42.109.703.236.0118.9521.0513,472,56015,850,071-1.322.383.709.701.913.6315.25
G38.088.782.935.4317.1419.0412,185,83214,336,273-1.192.153.358.781.733.2813.79
H10.522.430.811.504.745.263,367,3173,961,550-0.330.590.922.430.480.913.81
I14.533.351.122.076.547.274,651,0935,471,874-0.460.821.283.350.661.255.26
J5.161.190.400.742.322.581,651,8541,943,358-0.160.290.451.190.230.451.87
K150.8034.7611.5921.5267.8675.4048,256,50456,772,358-4.738.5213.2534.766.8513.0054.61
L23.385.391.803.3410.5211.697,482,9688,803,492-0.731.322.055.391.062.028.47
M20.034.621.542.869.0110.026,410,3157,541,547-0.631.131.764.620.911.737.25
N31.227.202.404.4514.0515.619,989,43111,752,271-0.981.762.747.201.422.6911.31
O53.1812.264.097.5923.9326.5917,019,13420,022,511-1.673.004.6712.262.424.5919.26
P1.510.350.120.210.680.75481,976567,031-0.050.090.130.350.070.130.55
Total633.00145.9048.6390.32284.85316.50202,560,000238,305,882-19.8635.7555.60145.9028.7754.57229.25
Table 4. Available biomass by groups considering the grouping of companies with distances between 90 and 160 km according to the estimates put forward for 2023.
GroupsCompaniesDistance (km)Available Biomass (kt·year−1)Available Biomass (kt·year−1·km−1)
EFBKernel ShellFiberSubtotalEFBKernel ShellFiberSubtotal
110120269.4453.14100.78423.372.250.440.843.53
2490134.4126.5150.28211.21.490.290.562.35
34129232.3245.8286.9365.041.80.360.672.83
49108313.0261.73117.08491.832.90.571.084.55
510160445.3187.82166.57699.72.780.551.044.37
66115363.771.73136.04571.473.160.621.184.97
Total1758.21346.75657.652762.6114.382.845.3822.6
Table 5. Distance from each of the companies to the collection center of each group.
Group 1Group 2Group 3Group 4Group 5Group 6
CompaniesDistance to
Aracataca (km)
CompaniesDistance to
Codazzi (km)
CompaniesDistance to
San Martín (km)
CompaniesDistance to
P. Wilches (km)
CompaniesDistance to
Castilla (km)
CompaniesDistance to Cabuyaru (km)
158.519190124123.7150.8
220213.3225.7218.2223.7260
315390351.437.3349333.4
420421.1451.4440.8445425.7
539------------510.5553.55121
65------------663665.46103
75------------749.6750.5------
88------------817.2864.1------
980------------920.3956.4------
10123------------------1025.7------
Table 6. Estimated biomass and transportation costs.
GroupCentral Point
(Municipality)
Available Biomass
(kt·Year−1)
Cost of Available Biomass (USD·Year−1)Transport Cost
USD·km−1USD·Year−1USD·t−1
1Aracataca423.364,599,7301.25711,4291.68
2Codazzi211.202,294,6201.19212,3631.01
3San Martín365.043,966,0421.671,145,0353.14
4Puerto Wilches491.835,343,6101.35839,1661.71
5Castilla La Nueva699.707,602,0062.333,474,6334.97
6Cabuyaro571.476,208,8612.063,748,2226.56
Total2762.630,014,8699.8510,130,85219.05
Disclaimer/Publisher’s Note: The statements, opinions and data contained in all publications are solely those of the individual author(s) and contributor(s) and not of MDPI and/or the editor(s). MDPI and/or the editor(s) disclaim responsibility for any injury to people or property resulting from any ideas, methods, instructions or products referred to in the content.

