Article

Mine Water Discharge Chemistry and Potential Risk in a Former Mining Area

1
Somes-Tisa Water Basin Administration, 17 Vanatorului Street, 400213 Cluj Napoca, Romania
2
Research Institute for Analytical Instrumentation, National Institute of Research and Development for Optoelectronics INOE 2000, 67 Donath Street, 400293 Cluj Napoca, Romania
*
Author to whom correspondence should be addressed.
Environments 2025, 12(3), 76; https://doi.org/10.3390/environments12030076
Submission received: 2 February 2025 / Revised: 21 February 2025 / Accepted: 25 February 2025 / Published: 1 March 2025

Abstract

:
The Maramures region, located in North-Western Romania, was a renowned center of mining and smelting in the last century. Nowadays, all the mines have been decommissioned or are under conservation and greening works, but the acidic waters from some closed or abandoned mine galleries negatively affect the nearby streams and, in some cases, the entire river system. In this study, 46 elements and 6 anion concentrations were used to assess the pollution in 12 mine water discharge samples collected in two mining areas in Maramures. The results showed high concentrations of sulfate (average 1264 mg/L) and toxic elements, namely Mn (average 25.1 mg/L), Fe (average 23.0 mg/L), and Zn (average 12.5 mg/L). The sum of the REEs concentration ranged from 1.24 µg/L to 2917 µg/L, with an average of 363 µg/L, with La, Ce, and Nd being the most abundant. High correlations were found between REEs and Li, Be, Al, Sc, V, Mn, Fe, Co, Ni, Y, SO42−, and NO2. According to the pollution index, the discharge of mine water poses different degrees of ecological risk. The health hazard index calculated for 37 elements revealed an extremely high non-cancer risk and, in addition, an increased carcinogenic risk for Cd, As, and Cr.

1. Introduction

Mine water discharges during underground operations and after mine closures or abandonment remain a global concern, with adverse environmental and public health impacts [1]. In the case of abandoned mines without a legally responsible owner, wastewater often flows downstream, with minimal or no treatment, unless local governments or other organizations assume responsibility for the mine management. These waters, also called acid mine drainage, are often acidic and are formed when metallic sulfide ores such as sphalerite (ZnS), pyrite (Fe2S), chalcopyrite (CuFeS2) come into contact with oxygen, water, and microorganisms, leading to sulfuric acid that can dissolve various minerals [2].
Acid mine drainage is characterized by a low pH and high metal concentrations, which can contaminate receiving waters and destroy the surrounding ecosystems [3,4]. Contamination with toxic elements like Cd, Cr, Pb, Hg, and As is considered to be one of the most prominent issues affecting water quality. Due to their non-biodegradability and tendency to accumulate, contamination by such toxic elements is a significant environmental issue worldwide, particularly when natural and/or anthropogenic processes lead to their release into ground and surface waters [5,6]. In addition, toxic elements can pass in the human body via drinking water or the food chain, affecting the human health [7]. Dietary exposure to toxic elements has been associated with cardiovascular, respiratory, renal, immunological, and oncological pathologies [8,9,10].
Rare Earth elements (REEs) include fifteen lanthanide elements, from La to Lu, together with Sc and Y due to their similar properties [11]. REEs occur collectively in various minerals in the Earth’s crust, exhibit comparable chemical properties and geochemical behavior, and are split into light REEs (LREEs) and heavy REEs (HREEs) [12,13]. The LREEs include the elements from La to Sm (La, Ce, Pr, Nd, Sm), and the HREEs comprise the elements from Eu to Lu (Eu, Gd, Tb, Dy, Ho, Er, Tm, Yb, Lu) [14,15]. REEs have multiple applications in high-tech industries (computers, smartphones, LEDs, TVs, magnets, hard drives) and are considered critical elements of strategic importance [12,16]. Although the REEs have low toxicity, their ability to bioaccumulate and persist can lead to negative effects on human health, including DNA damage, cell death, neurological disorders, oxidative stress, pneumoconiosis, changes in the bone structure, cytotoxicity, genotoxicity, and the development of fibrotic tissue [17].
Mining in the Maramures region of NW Romania dates back to ancient times, as the region is rich in complex nonferrous ores containing Cu, Pb, Zn, Au, and Ag. Nonferrous mining and ore processing flourished in the 20th century and contributed to the economic development of the region. The oldest mining basins in the area are those of Baia Mare and Baia Borsa. In these areas, base metals (Cu, Pb, Zn) and polymetallic ores were mined in extensive underground mining operations. The decline in gold and base metal prices, together with the more stringent environmental legislation in recent decades, has led to the gradual closure of ore-processing facilities and mines in the area. Although mining activity in these areas has been discontinued, the mining and ore-processing wastes and acid mine water discharges still represent a major source of environmental pollution in the area [18]. During the operational phase of underground mining, precipitation and infiltrating groundwater are continuously pumped from underground and treated, if necessary, before being discharged to the surrounding river system. After the mine closure, the underground galleries are slowly filled with water until the galleries are flooded. In contact with the gallery walls, the flood water can dissolve various elements and then reach the surface and the nearby streams. In the case of most mines, the mine water is untreated or only partially treated, mainly by neutralization and element precipitation with hydrated lime (Ca(OH)2) or limestone (CaCO3). Seepage from mine galleries carries metals that pollute streams and then entire rivers, with negative consequences for the ecosystems and populations through water ingestion [19,20,21]. Therefore, mine closures and environmental rehabilitation are critical to the sustainable development of the mining industry.
The current study aims to determine the concentrations of major, trace, and REEs in mine water discharge samples from several closed mines to assess the water pollution by calculating the pollution index and the human health risk to the local population by water ingestion. Thus, this investigation provides information on the risk of untreated or unsuitably treated mine water discharges and their impact on the ecological and functional quality of river systems and pollution in mining regions.

2. Materials and Methods
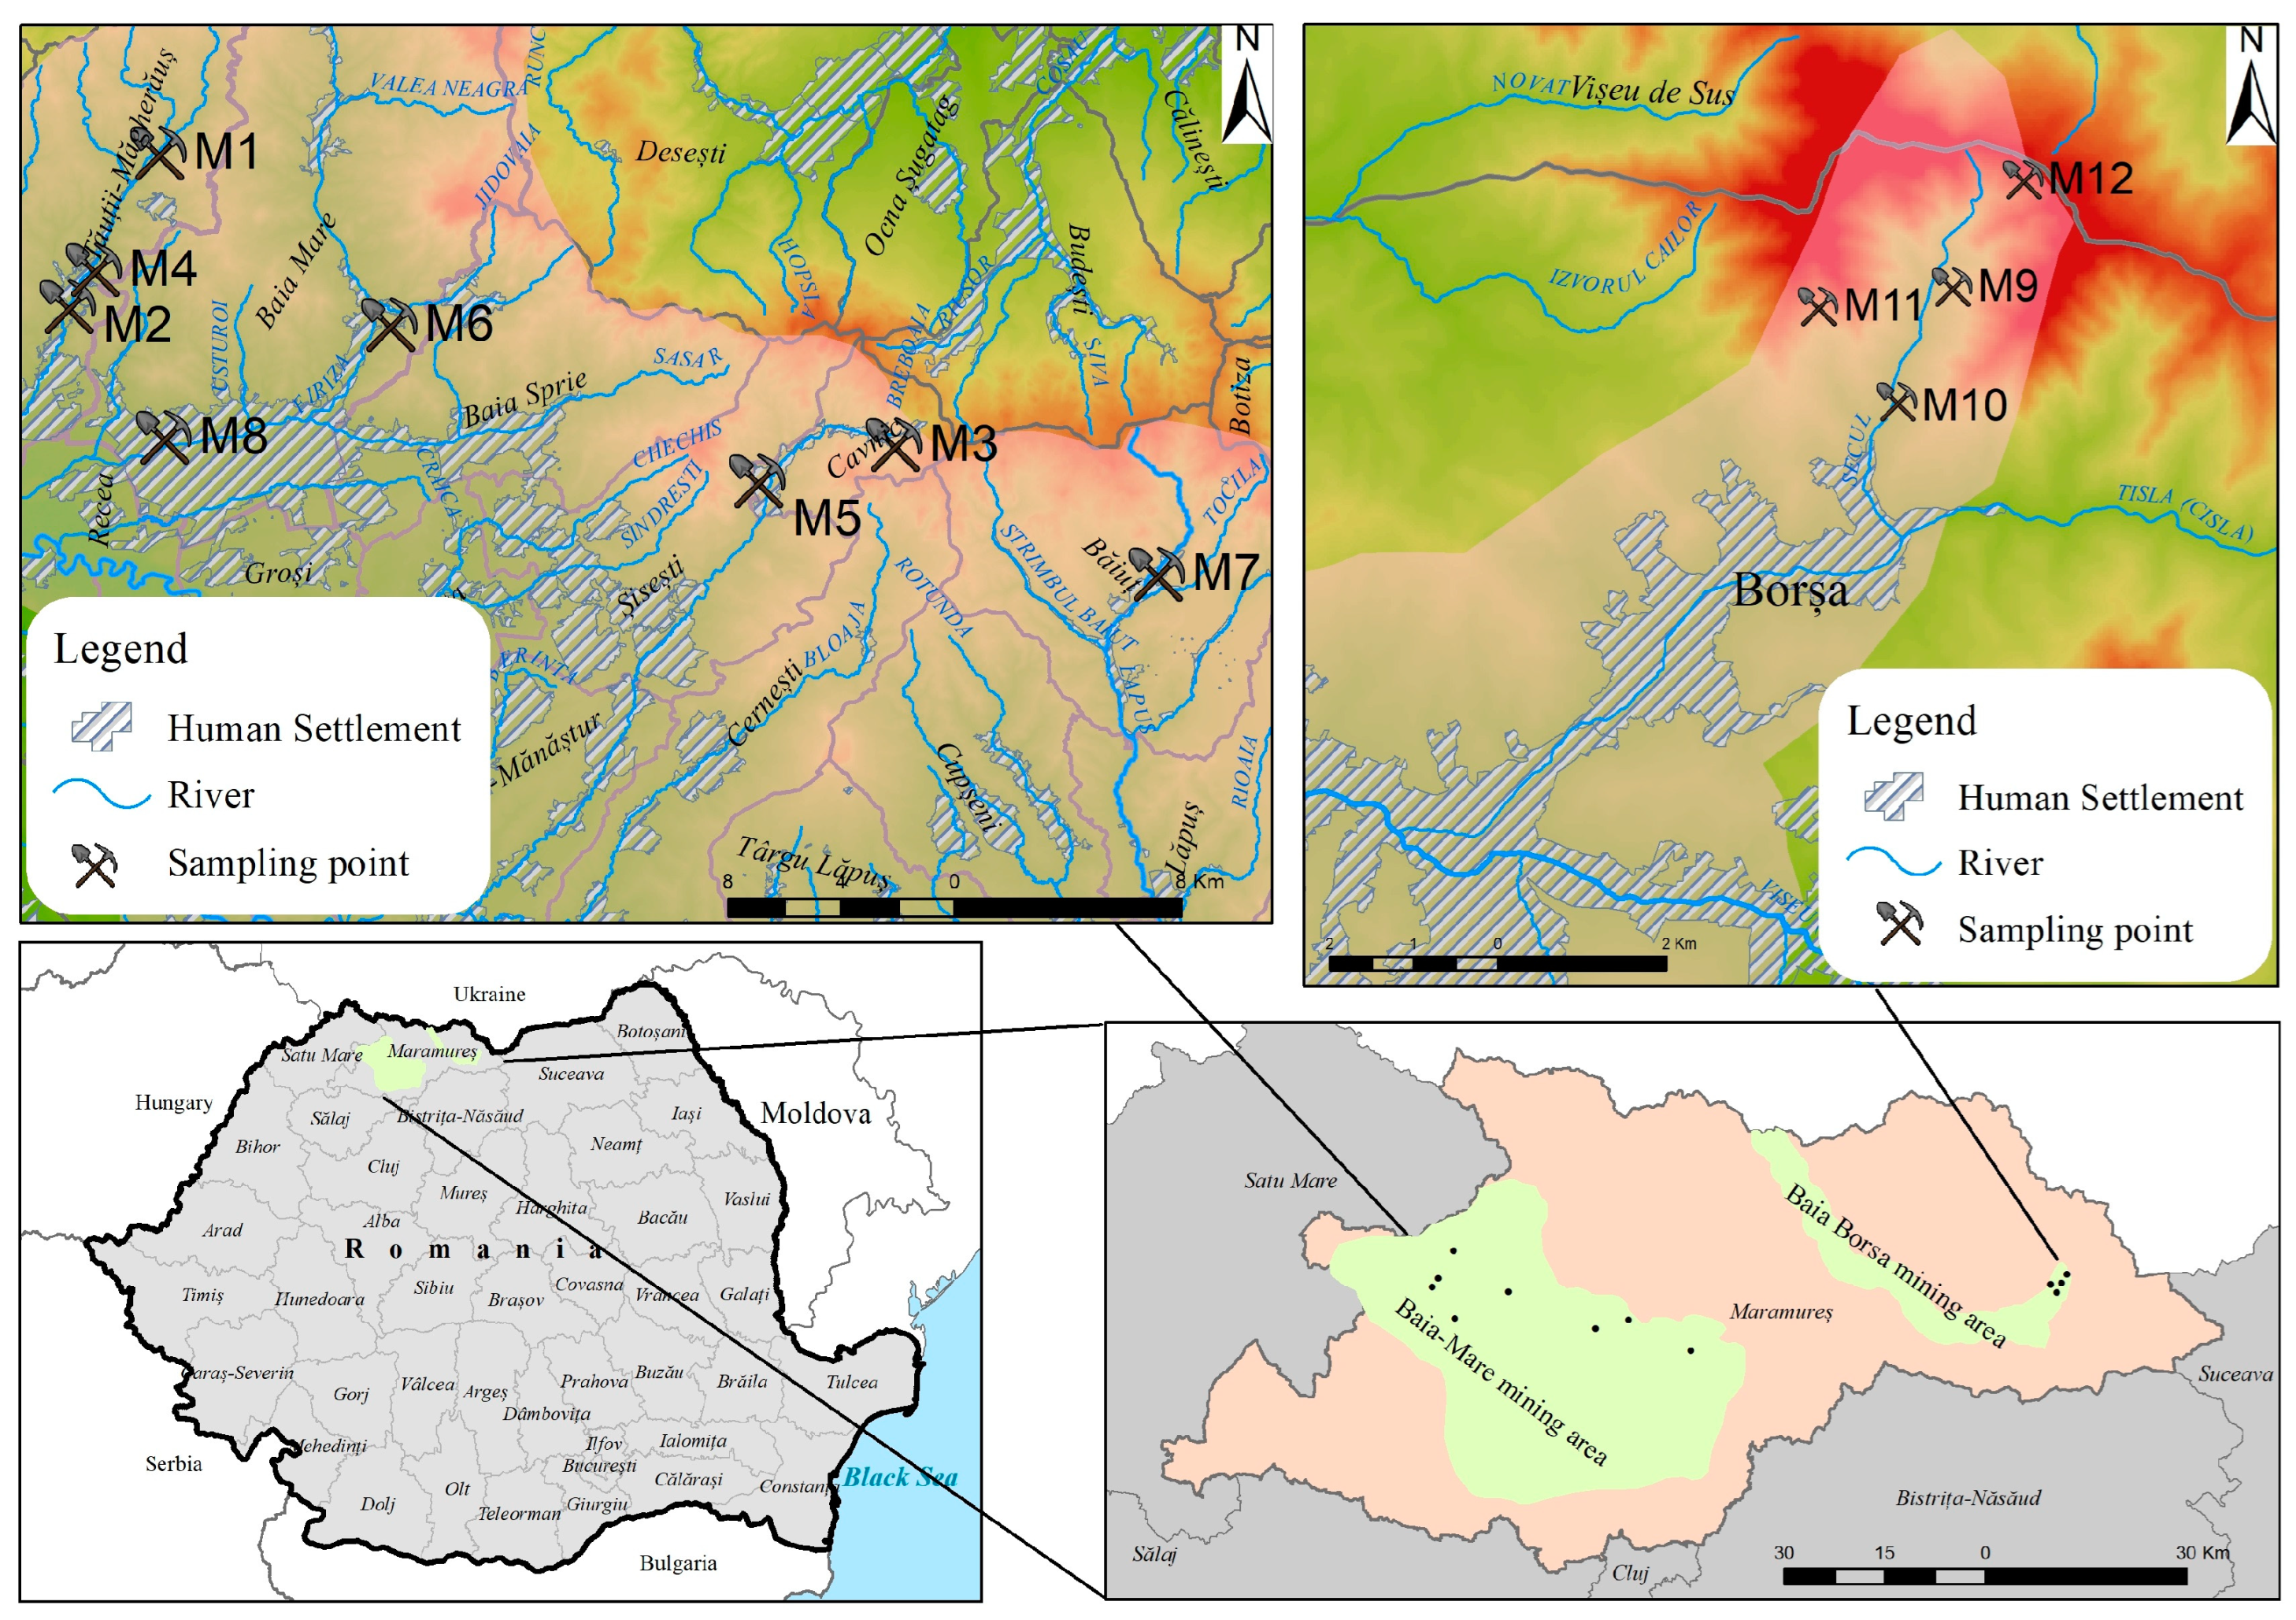
2.1. Study Area

Acid mine drainage is one of the most common mining wastes that can affect the surrounding environment for many years if not properly managed. In the Maramures region, NW Romania, twelve mine water samples were collected in September 2023, eight in the Baia Mare area (M1–M8) and four in Baia Borsa (M9–M12) mining areas, located approximately 150 km apart. The Baia Mare area is situated in the Gutai Mountains, and Baia Borsa is situated in the Toroiaga-Tibles Mountains, with both areas a part of the NW Carpathian Mountains [22]. The sampling sites and their description are presented in Table 1 and Figure 1.
The investigated mining areas contain volcanic rocks of the Mesozoic age, with massive sulfide deposits characterized by polymetallic mineralization. The constituent elements of sulfides of nonferrous mineralization are Pb, Zn ± Cu, Au, and Ag. Their most distinctive geochemical feature is the high content of Cd, Co, Ni, Ge, Tl, Se, Te, Bi, Sb, As, Sn, Mo, and W [19,22].

2.2. Sampling and Analytical Methods

At each location, the water samples were collected by directly immersing a pre-cleaned polyethylene bucket under the surface of the water. The pH and total dissolved solids (TDS) were measured on-site via a portable multiparameter (WTW, Weilheim, Germany). The samples were filtered on-site through 0.45 µm cellulose acetate syringe filters. For metal determination, the filtered samples were acidified to a pH < 2 with 65% HNO3 (Merck, Darmstadt, Germany). For the other parameters, the filtered samples were stored at 4 °C until analysis.
In the laboratory, the water samples were analyzed for anions (F, Cl, NO2, NO3, SO42−, PO43−) using a 761 IC ion chromatograph (Metrohm, Herisau, Switzerland), after filtration over 0.45 μm cellulose acetate membrane filters. The total acidity, total alkalinity, and bicarbonate (HCO3) were determined by titration [23,24]. The metals were analyzed using a 7500 CX inductively coupled plasma mass spectrometer (Agilent Technologies, Santa Clara, CA, USA) after digestion using an Xpert microwave system (Berghof, Eningen, Germany) with 65% HNO3. To prepare the standard solutions and dilute the samples, the ultrapure water was produced using a Direct Q3 Milli-Q system (Millipore, Molsheim, France).
The ion chromatograph was calibrated using an IC Multi-element standard I (Certipur Merck, Darmstadt, Germany) containing PO43− (1000 mg/L), NO3, SO42− (500 mg/L), Cl (250 mg/L), and an NO2 standard (1000 mg/L) diluted appropriately with ultrapure water. The ICP-MS was calibrated using calibration solutions (0.01–100 μg/L) prepared from multi-element standard solutions II and III (Perkin Elmer, Waltham, MA, USA). A mixed solution of Rh-Re served as an internal standard to correct for overall instrumental drift and matrix effects [14].
The accuracy of the measurements was checked using 1643f NIST-Trace in water (National Institute of Standards and Technology, Gaithersburg, MD, USA) for metal analysis and SPS-NUTR WW1 (Spectrapure standards, Manglerud, Oslo, Norway) for anions analysis. The reproducibility of the metals and anions expressed as the relative standard deviation was less than 10% and 12%, respectively, while the recoveries were 96–105% and 91–104%, respectively.
The limits of detection (LODs) were determined by multiplying three times the ratio of the standard deviation of the mean signal of 10 blank samples by the slope of the calibration curve. The LODs for metals were in the range of 0.003 µg/L (Lu)–10 µg/L (Ca, Mg, Na). The LOD for anions using ion chromatography was 0.010 mg/L for NO2, 0.100 mg/L for NO3, 0.004 mg/L for SO42−, and 0.025 mg/L for PO43−.

2.3. Pollution Indices

Metal pollution for each mine water was assessed by calculating the metal evaluation index (MEI), which indicates the overall status of water quality related to metal content [25] according to Equation (1).
MEI = ∑Ce
where Ce represents the contamination coefficient of the studied elements, calculated according to Equation (2)
Ce = ce/MACe
where Ce represents the contamination coefficient of the element, ce is the measured value of the element, and MACe is the maximum allowable concentration of the element. The MEI values were calculated for 3 sets of elements, for which guideline values are established in the Romanian legislation: (i) the MEI for surface waters was calculated considering the concentrations of Be, V, Cr, Co, Ni, Cu, As, Mo, Cd, Sn, Ba, Tl, and Pb and their corresponding quality standards were established by Regulation 161/2006 on the hazardous and priority hazardous substances in surface waters [26]; (ii) the MEI for wastewater to be discharged into natural receptors was calculated on the basis of the concentrations of Al, Cr, Mn, Fe, Co, Ni, Cu, Zn, As, Mo, Cd, and Pb and their corresponding limits established by Government Decision 188/2002 approving the pollutant load limits prior to the discharge of industrial and municipal wastewater into natural receptors [27]; (iii) the MEI for REEs was calculated based on the REEs concentration and MAC values provided by Sneller et al. [28] (Table 2).
The MEI values indicate low (MEI < 10), medium (10 < MEI < 20), and high (MEI > 20) pollution levels [25,29].
The potential ecological risk index (RI), initially described by Hakanson [30] for sediments, then adapted by other authors to evaluate the risk of different types of waters, was calculated according to Equation (3) [31].
RI = ∑Tre × Ce
where Tre represents the toxic response factor of the element and Ce is the contamination coefficient of the element, calculated according to Equation (2). The values of Tr were set as the toxicological factors in the risk index approach, as follows: 30 (Cd), 10 (As), 5 (Pb), 5 (Ni), 5 (Cu), 2 (Cr), and 1 (Zn) [30].
According to the RI values, the potential ecological risk is divided into five classes, as follows: RI < 150, low; 150 < RI < 300, moderate; 300 < RI < 600, strong; >600 < RI < 5000, very strong, and RI > 5000, extremely strong risk [31].

2.4. Human Health Risk Assessment to Metals via Water Consumption

To evaluate the non-carcinogenic human health risk by water consumption, the chronic daily intake (CDI) of each metal was calculated for the adult population using Equation (4) [32,33].
CDI = (C × IR × EF × ED × 10−3)/(BW × AT)
where CDI is the chronic daily intake (mg/kg/day), C is the concentration of the metal in the water sample, in µg/L, IR is the intake rate, i.e., the water amount consumed daily (2.5 L/day) [34], EF is the exposure frequency (365 days/year), ED is the exposure duration (70 years), BW is the average body weight (70 kg for an adult), and AT is the average exposure time, the period of time in which the concentration is regarded as constant (AT = 70 × 365 = 25,550 days).
The non-carcinogenic risk is assessed by comparing the calculated CDI with the chronic oral reference dose values (RfD) established by the United States Environmental Protection Agency [34]. The RfD is the maximum acceptable oral dose of a substance or element, below which no adverse non-cancer health effects result from a lifetime of exposure. The ratio between CDI and RfD is the hazard quotient (HQ). The potential risk to human health from exposure to multiple metals was measured by the chronic hazard index (HI) by summing all the HQs calculated for each individual metal. The HQ or HI values below 1 indicate no apparent health risks, values exceeding 1 denote the possibility of adverse health effects, and values above 10 indicate severe chronic health effects [33].
The carcinogenic risk (CR) for the water ingestion was calculated only for metals with defined carcinogenic slope factors (CSF), namely Pb, As, Cd, Cr, and REEs, using Equation (5) [35,36,37].
CR = CDI × CSF
The CR value between 10−4 and 10−6 designates that the carcinogenic risk is considered acceptable, the CR < 10− 6 specifies a negligible carcinogenic risk, and a CR > 10−4 indicates an unacceptable carcinogenic risk. The CSF quantitatively defines the relationship between the dose and response and is used to estimate the risk of cancer associated with lifetime exposure to a carcinogenic or potentially carcinogenic substance by ingestion and is 1.5 (As), 6.3 (Cd), 0.0085 (Pb), and 0.5 (Cr) mg/kg/day, respectively [35,37], and the CSF for REEs has been set at 3.2 × 10⁻¹² mg/kg/day for all REEs [36].

2.5. Data Analysis

The water type was determined based on the Piper diagram drawn via GW Chart software version 1.29.0.0. The diagram consists of three components: a central diamond plot—reflecting all ions along with two trilinear plots—one dedicated to cations and the other for anions [38]. Ficklin diagram was drawn to discriminate and categorize the different mine water samples [39].
Pearson correlation and principal component analysis (PCA) were used to explore the relationships between the concentrations of metals and anions. A significance level of p < 0.05 was considered statistically significant. The PCA was used to reduce data and extract a small number of independent components named PCs. The varimax rotation was applied on the PCs with eigenvalues higher than 2. To categorize the samples based on their chemical composition, Agglomerative Hierarchical Clustering (AHC) was conducted using a squared Euclidean distance and Ward linkage method. Statistical analysis was carried out using the XLStat (Addinsoft, Paris, France) software (BASIC+, 2019.3.2).

3. Results and Discussions

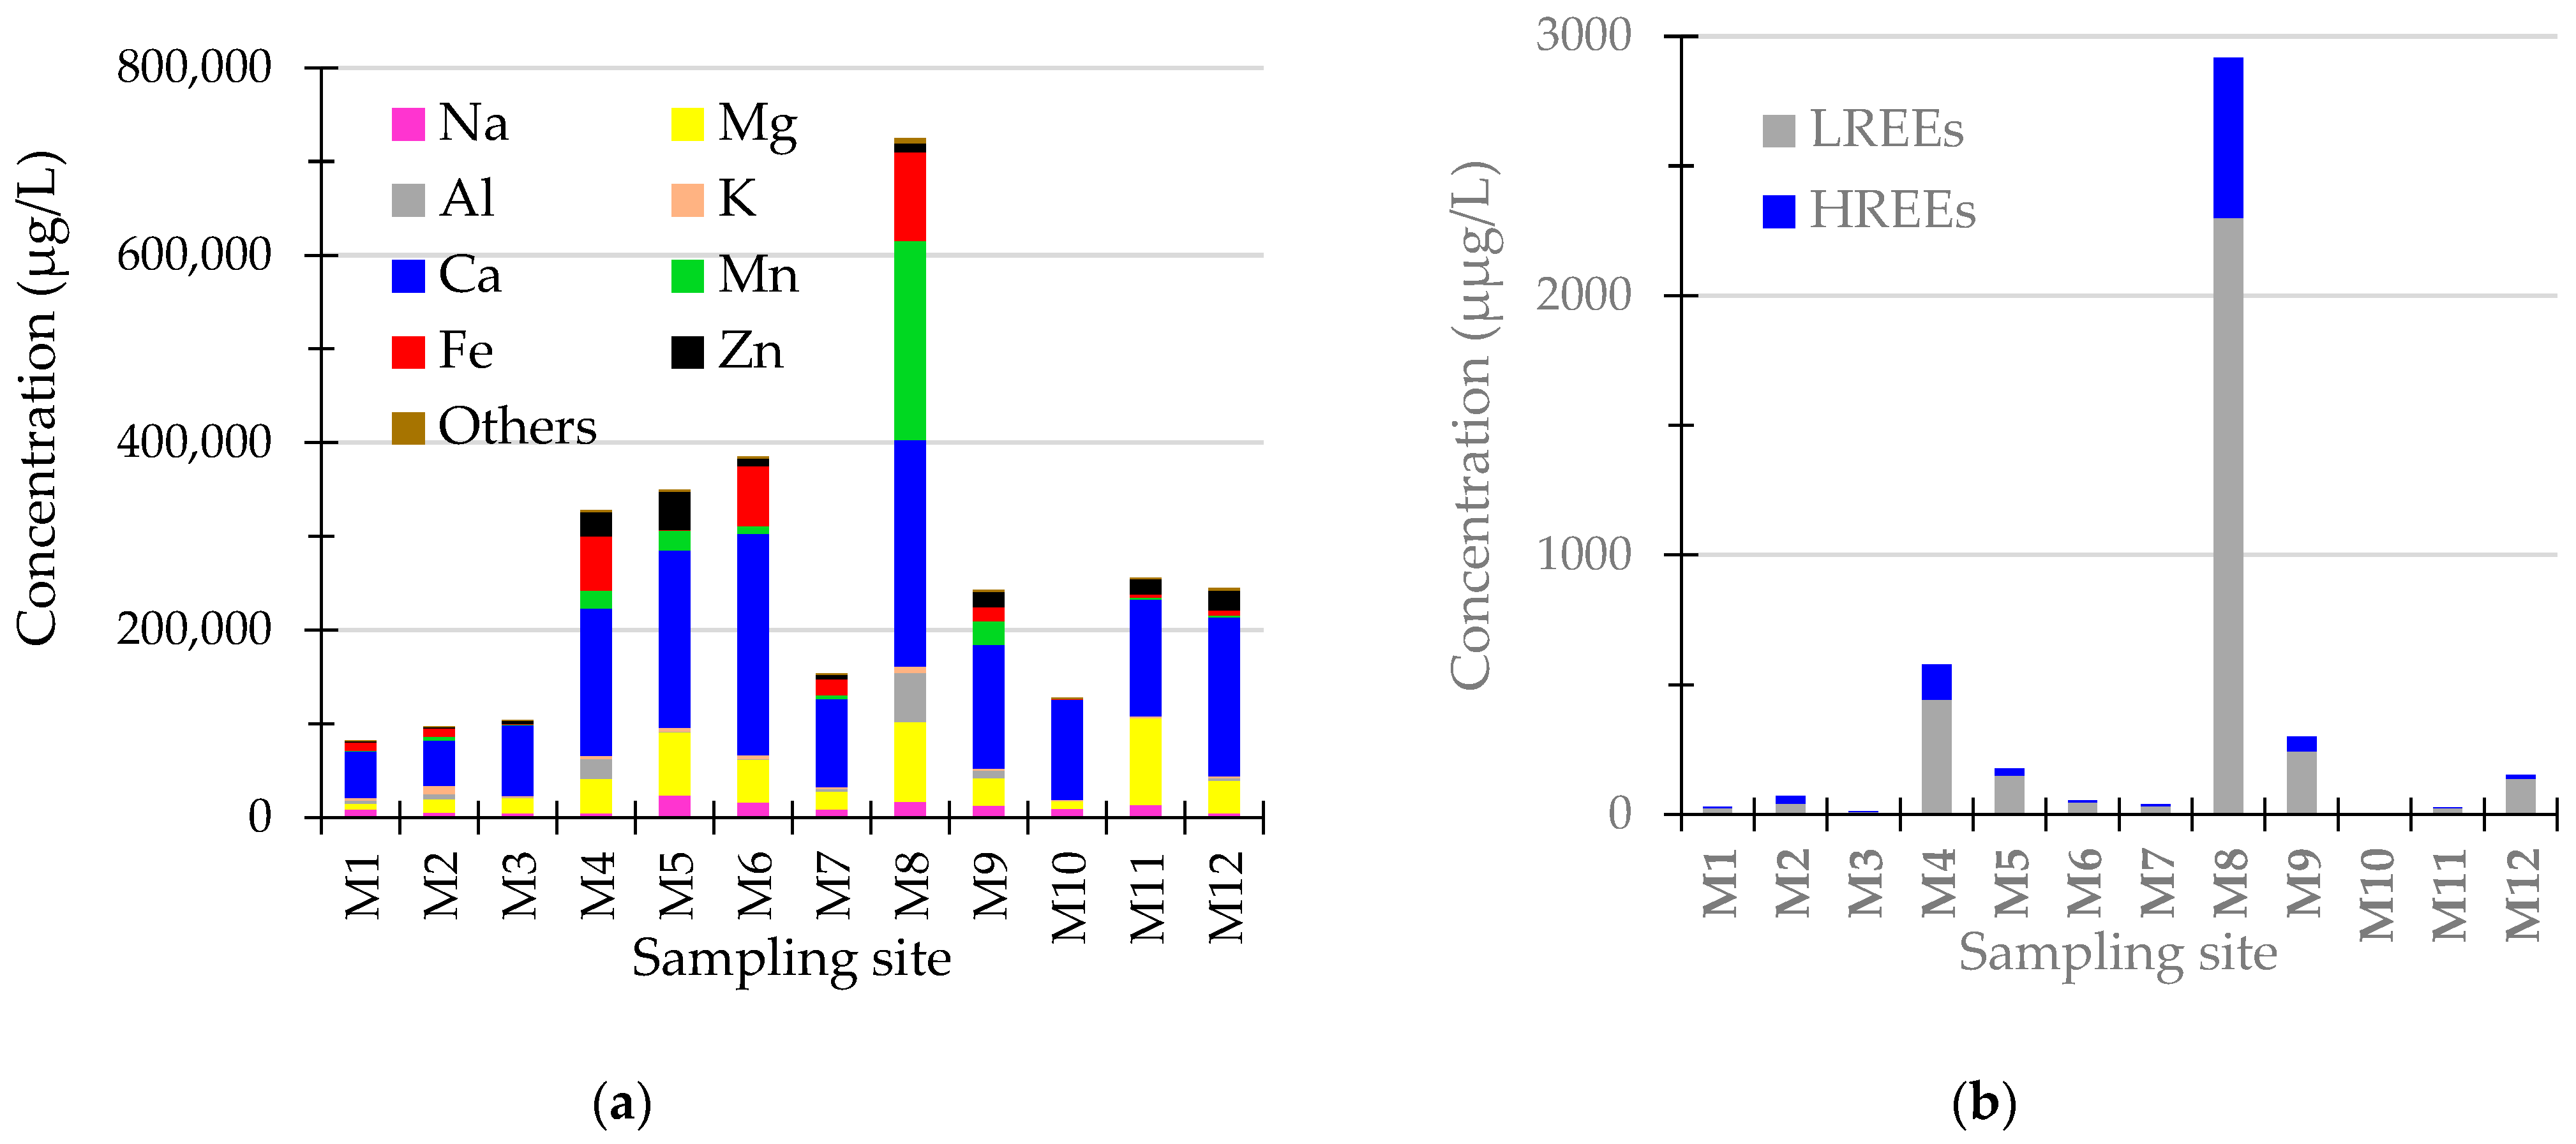
3.1. Hydrochemical Properties

The physicochemical analysis of the mine water samples is presented in Table 3. The sum of La, Ce, Pr, Nd, and Sm concentrations represents the concentration of LREEs, while the sum of Eu, Gd, Tb, Dy, Ho, Er, Tm, and Yb concentrations denotes the concentration of HREEs. The sum of the 14 naturally occurring REEs was expressed as the total REEs (ΣREEs). The sum of the 14 REEs and Y and Sc was expressed as ΣREY.
The TDS varied largely, from 594 mg/L (sample M1) to 4150 mg/L (sample M8), with an average concentration of 2216 mg/L. The SO42− concentration ranged from 74.4 mg/L (sample M10) to 8500 mg/L (sample M8), whereas the total acidity ranged from 0 to 100 mg CaCO3/L. The pH values ranged from 2.34 (sample M8) to 7.49 (sample M10), with an average value of 5.28. In nine samples, the pH values were in the acidic range. PO43− concentrations were below the limit of detection (0.025 mg/L) in all samples. In the mine waters, the average elements’ concentration was dominated by Ca, Mg, Mn, Fe, Zn, and Na, with average concentrations higher than 10,000 µg/L (Figure 2a). Average concentrations lower than 1 µg/L were found for Zr, Tl, and Th and, among REEs, for Tm and Lu.
The most toxic elements for living organisms in aqueous systems are Ni, Cr, Cd, Pb, As, Cu, and Zn. Some of these elements are essential (Cu, Zn, Cr) in low concentrations but, at high concentrations, can be carcinogenic, mutagenic, or teratogenic [29]. The concentrations of Mn, Cu, Zn, As, and Cd were comparable with those in the AMD from the Smolnik mine in Slovakia [32] and were significantly lower than in the acid mine water sample from the Poderosa mine in the Iberian Peninsula, Spain [40]. Also, the concentrations of Mn, Co, Ni, Zn, and As in the Crocodile River, South Africa, located in the western basin of the Witwatersrand mining area, were comparable with the concentrations obtained in the present study [41].
The concentration of ∑REE in the investigated water samples varied over three orders of magnitude and ranged between 1.24 μg/L in sample M10 and 2917 μg/L in sample M8 (average 363 μg/L and standard deviation 821 μg/L), with Ce, Nd, La, and Gd being the most abundant, accounting for the (79.2% ± 6.93%) of the total REEs (Figure 2b). The average concentration of Y was comparable to the average concentrations of Nd and La. Additionally, the concentration of LREEs ranged from 1.05 μg/L to 2299 μg/L, whereas the concentration of HREEs ranged from 0.19 μg/L to 618 μg/L, with an average of 288 μg/L and 75.3 μg/L, respectively. Like other studies [15,42], the ∑REE concentrations in mine drainage samples increased as the pH levels decreased.
The average concentration of ∑REEs in the mine waters collected from the Baia Mare area (137 µg/L) is comparable to the ∑REEs average concentration in the samples collected from the Baia Borsa area (120 µg/L) if the M8, containing the highest REE concentrations, is not accounted for. In each sample, the concentration of LREE was higher than the concentration of HREE, with the ratio ∑LREEs/∑HREEs ranging from 1.50 to 10.5 (5.41 ± 2.50). The five most critical REEs (the sum of Dy, Eu, Nd, Tb, and Y) [1] accounted for 41.7% (average) of the total weight of all REEs.
The concentration of the ∑REEs was comparable to the concentration of ∑REEs in the waste waters of Jaintia coalfield (India), Hanes mine (Romania), Esperanza mine (Spain), coal mine drainage of the Northern Appalachian coal basin (USA) from the abandoned mine sites of Pennsylvania (USA), and in the Ronneburg mine (Germany) [15,16,43]. The REE concentrations were higher than in the acid mine drainage originating from the Xingren coalfield, China, where ∑REE ranged from 118 to 926 µg/L and was higher than in the mine drainage from the inactive Zn-Pb mine of Santa Lucia (Cuba), where ∑REE ranged from 370 to 860 µg/L [15].
The variations in element concentrations in the waters studied can be attributed to composition of the host rock, natural weathering processes, the time of closure/abandonment of the mine, the effectiveness of neutralization processes with minerals such as calcite (CaCO3) or dolomite (CaMg(CO3)2), or the efficiency of other types of remediation activities.
The representation of the acid mine drainage samples on the Ficklin diagram [39] showed the grouping of samples based on their pH and total element content (Figure 3).
Most of the samples are classified as “near-neutral, extreme-element”, M4 and M8 as “high-acid, extreme-element”, M7 and M9 as “acid-extreme-element”, and only samples M1 and M2 as “near-neutral-high element” and “acid-high element”, respectively. Although in other studies [31], most of the mine drainage samples are considered to be highly acidic with extreme element concentrations, in our case, the presence of several samples in class “near neutral” could be explained by the occasional use of limestone for neutralization and precipitation of elements.

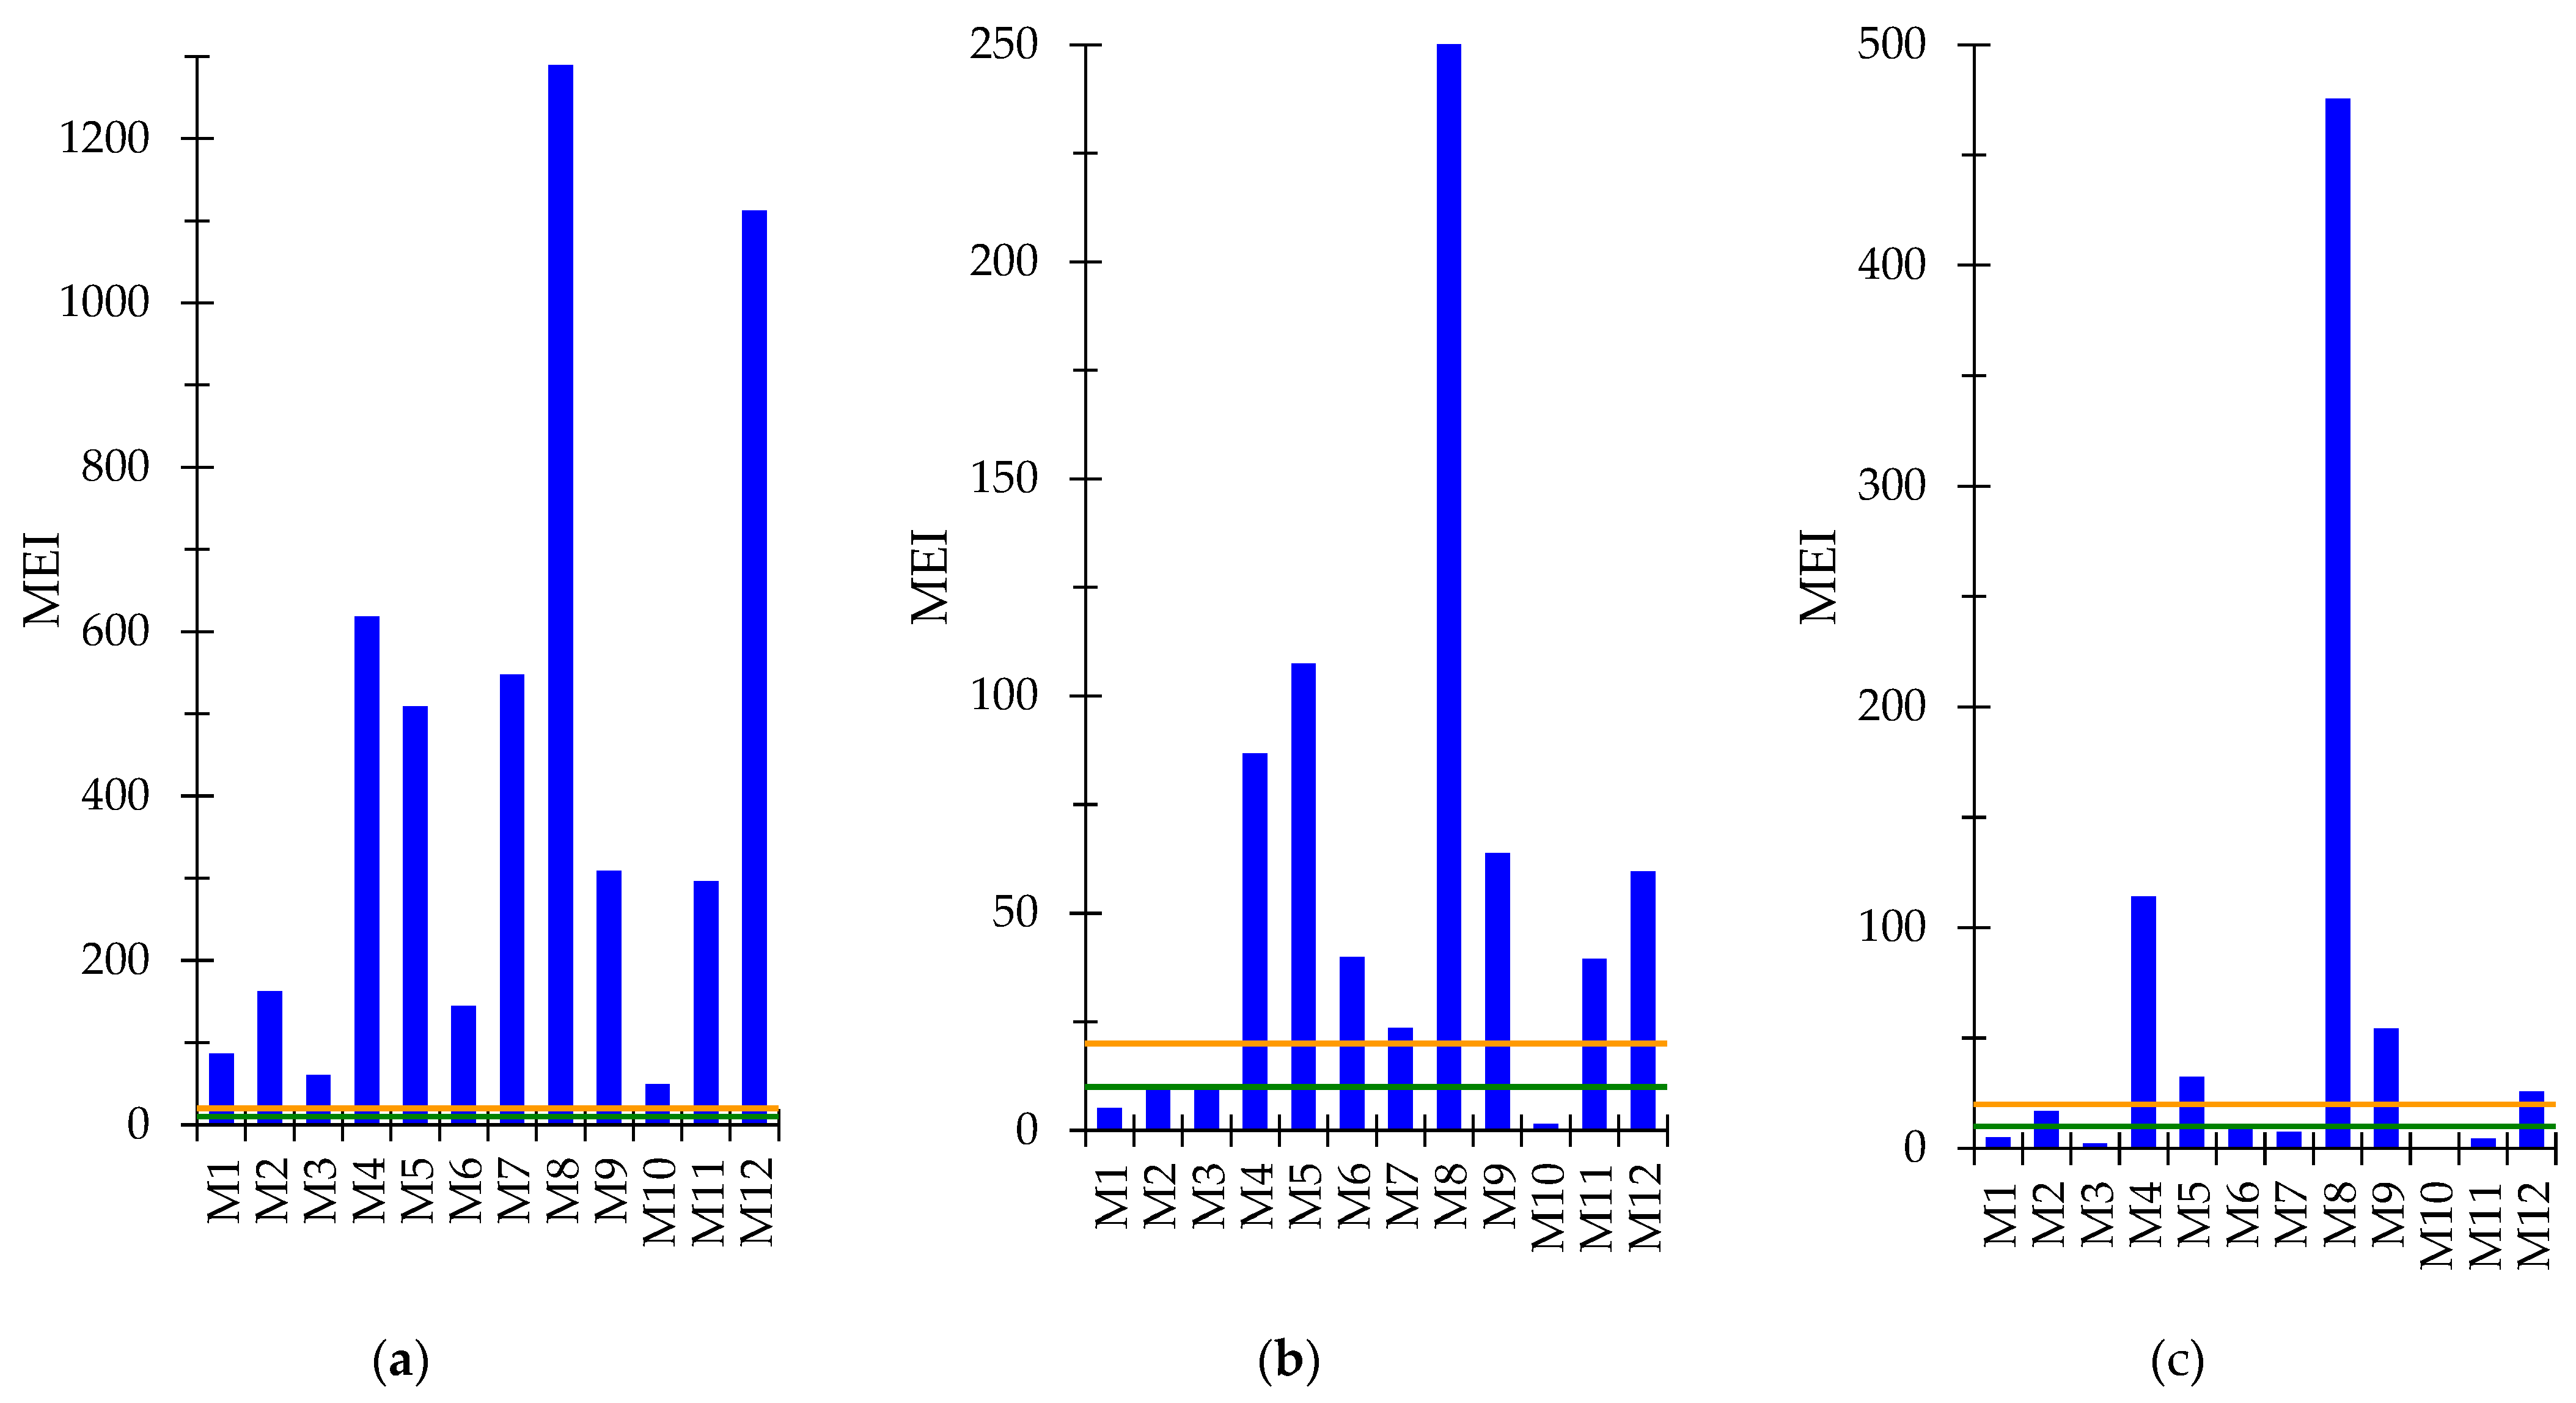
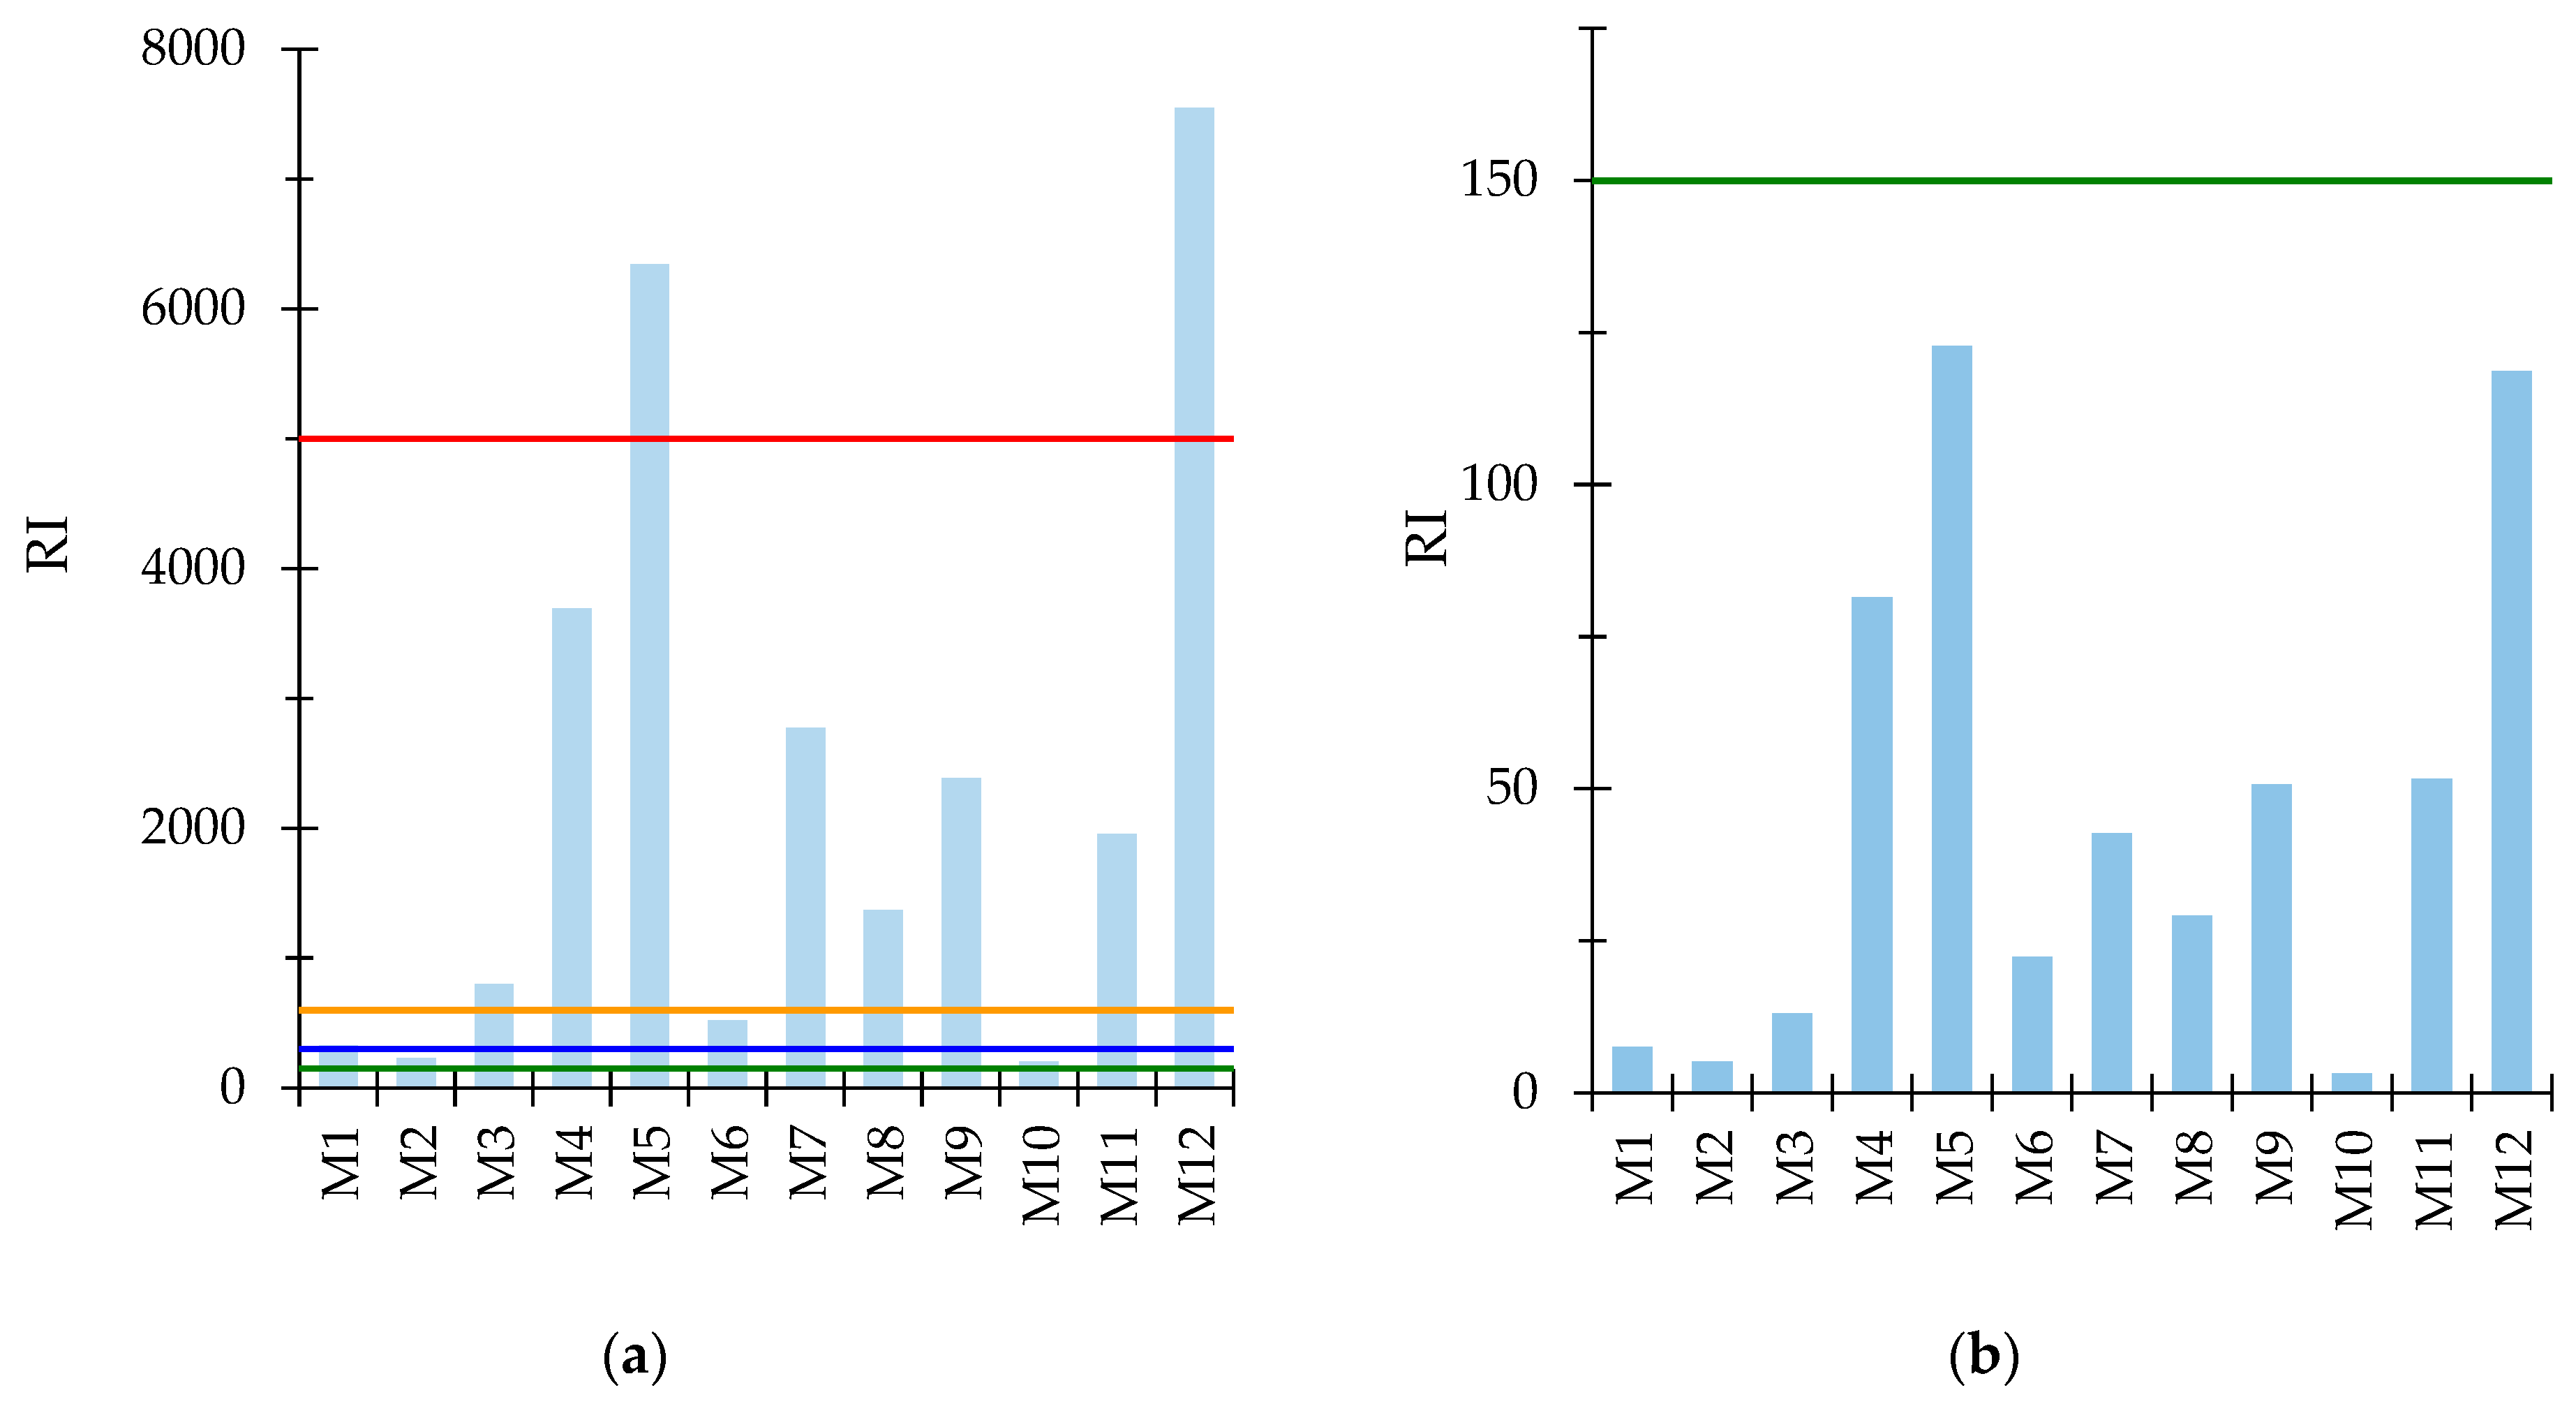
3.2. Potential Ecological Risk

The MEI values were calculated based on the concentrations of Be, V, Cr, Co, Ni, Cu, As, Mo, Cd, Sn, Ba, Tl, and Pb, and the quality standards of these elements in surface water [26] varied in the range of 49.8 (M10)–1290 (M8), with an average value of 432. All the MEI values were up to 60 times higher than the threshold value of 20, indicating highly polluted waters (Figure 4a).
The MEI values were calculated using the concentrations of Al, Cr, Mn, Fe, Co, Ni, Cu, Zn, As, Mo, Cd, and Pb, and the limit values of these elements for wastewater for discharge into natural receptors [27], varied in the range of 1.57 (M10)–253 (M8), with an average value of 58.2. Four values were below 10 (samples M1, M2, M3, and M10), and the other eight values were above 20, suggesting low and high polluted waters (Figure 4b). The two calculation modes provide two dissimilar results; the differences are attributed to the fact that the MACs set by the legislation are very different, and only eight metals are common.
The values of MEI calculated for the eight REEs that have MACs [28] ranged from 0.228 (M10) to 476 (M8), with an average value of 62.3. In five samples (M4, M5, M8, M9, M12), the MEI exceeded a value of 20, indicating highly polluted waters (Figure 4c).
Similar to the MEI, the potential ecological risk index (RI) was calculated in two ways: (i) based on Tr and the threshold values of Cd, As, Ni, Cu, Pb, and Cr in surface water [26,30], and (ii) based on Tr and limit values for Cd, As, Ni, Cu, Pb, Cr, and Zn for industrial and urban wastewater discharges to natural receptors [27,30]. The RI values based on the surface water thresholds (Figure 5a) varied between 199 (M10) and 7546 (M12), dividing the samples as follows: M2 and M10 recorded a moderate risk; M1 and M6 fell into a strong risk; M3, M4, M7, M8, M9, and M11 exhibited a very strong risk, and sample M5 belonged to the extremely strong risk class. No sample recorded a low risk. The major contribution to the RI value was attributed to Cd (50.8%), followed by Cu (41.5%), Ni (5.71%), Pb (0.973%), As (0.784%), and Cr (0.314%), considering the average concentration of the six elements.
The calculated RI values considered the limit values for industrial and urban wastewater when discharged to natural receptors (Figure 5b) and ranged from 3.12 (M10) to 123 (M5), placing the samples in the low-risk class. The methods/mathematical models used to calculate the MEI and RI have an important drawback as only a few elements have MACs set in legislation, and even fewer elements have Tr values assigned in the literature. This fact could lead to an underestimation of the potential ecological risk by ignoring other elements present in the samples.

3.3. Health Risk Assessment via Water Consumption

Several villages and small villages are located near the mine water discharges. Residents occasionally use the water in their households for various needs, mostly for watering the gardens. Therefore, the risk has been assessed under the worst-case scenario, in which the residents near the study areas may use the water for drinking purposes. Residents may be exposed to metals through water ingestion, which may lead to health risks, including respiratory, neurological, cardiovascular, and reproductive system damage, as well as carcinogenic and mutagenic effects [17].

3.3.1. Non-Carcinogenic Risk to Metals Through Water Consumption

The values obtained for the calculated chronic daily intake (CDI), hazard quotient (HQ), and hazard index (HI) from water consumption, together with the RfD values, are shown in Table 4. Considering the maximum CDI values, the exposure to Sc, Sb, Sr, Ba, V, Cr, Ni, Mo, Zr, and Y through water consumption is lower than the RfD, confirming that there is a low risk of adverse health effects caused by their ingestion with water. On the contrary, the exposure to Cu, As, Zn, Al, Fe, Pb, U, Li, and Th slightly exceeds the RfD values, indicating the presence of risk by water consumption. The large exceedance of the RfD in the case of elements Cd, Co, Tl, and Mn indicates a high risk to the health of consumers of contaminated water. A high average value for HQ (Table 4) was calculated for Mn (37.3), accounting for 40.7% of the HI due to the high Mn concentrations measured in the mine water samples. Apart from Mn, the average values of HQ above the unit were recorded for Tl (20.1), Cd (14.2), Co (8.29), and Th (2.65), accounting for 21.9%, 15.4%, 9.03%, and 2.89% of the HI, respectively. The average values of a HQ close to the unit were calculated for Li, Zn, Fe, and Al. The highest risk was observed for the sample M8 (HI = 466), followed by M4 (HI = 207) and M5 (HI = 108), with an HI greater than 100.
The estimated daily intake of the sum of the 14 REEs was in the range of 0.044–104 µg/kg/day (average value of 13.0 µg/kg/day) and in the range of 0.311–123 µg/kg/day (average value of 15.5 µg/kg/day) for REY. For La, Ce, and Y, tolerable daily intake (TDI) thresholds of 51.3, 161.5, and 145.5 µg/kg/day were derived based on the no observed adverse effect level by the European Food Safety Authority [14,44]. For the ∑REE, the TDI set for La (51.3 µg/kg/day) was adopted [44]. The intake of REEs through water consumption was lower (except for sample M8) than the RfD for ∑REEs, as well as the TDI of 51.3 µg/kg/day [14,44]. The estimated daily intake for other metals (Al, Mn, Fe, Zn, and Sr) was considerably higher than those for REEs. The non-carcinogenic risk of REEs was the highest in sample M8 (HQ = 5.21) and the lowest in sample M10 (HQ = 0.0022), with all the values below the safe value of the unit, except for sample M8.
Recently, the European Food Safety Authority updated the risk assessment of inorganic As by ingestion in 2024 and established a reference value of 0.06 µg/kg bw per day derived from a case-control study of skin cancer. This value represents a conventional estimate of the minimum dose that may be associated with increased induction of skin cancer following exposure to inorganic As [49]. Using this reference value, the HQ varied from 0.625 to 18.6, with an average value of 7.87, indicating a high risk of skin cancer from water ingestion. A TDI of 6 µg/kg bw has been established for Sb [44]. Considering the assessed exposure to Sb, the average daily intake (0.046 µg/kg bw) from water consumption would represent only 0.76% of a TDI, indicating a negligible risk to the health of potential consumers. A TDI of 0.2 mg/kg bw per day has been established for Ba [44]. At the highest exposure (0.0052 mg/kg/day) from water consumption, only 2.6% of the TDI would be met, indicating a negligible risk of adverse health effects from Ba intake.

3.3.2. Carcinogenic Risk to Metals Through Water Consumption

The carcinogenic risk calculated for Pb, Cd, As, Cr, and REEs is shown in Table 5.
Regarding the carcinogenic risk, the exposure to REEs through water was negligible, with all CR values lower than 10−6. The CR values for Cd were higher than 10−4, indicating an unacceptable risk, except for sample M2, with a CR in the acceptable range. The same observation was valid for As and Cr, with CR values higher than 10−4, indicating an unacceptable risk, except for sample M11 for As and for samples M2, M3, M6, and M11 for Cr, with CRs in the acceptable range. For Pb, the CR values showed an acceptable risk (10−4 < CR < 10−6), except for samples M1, M2, M9, M10, and M12, with a negligible carcinogenic risk.

3.4. Statistical Analysis
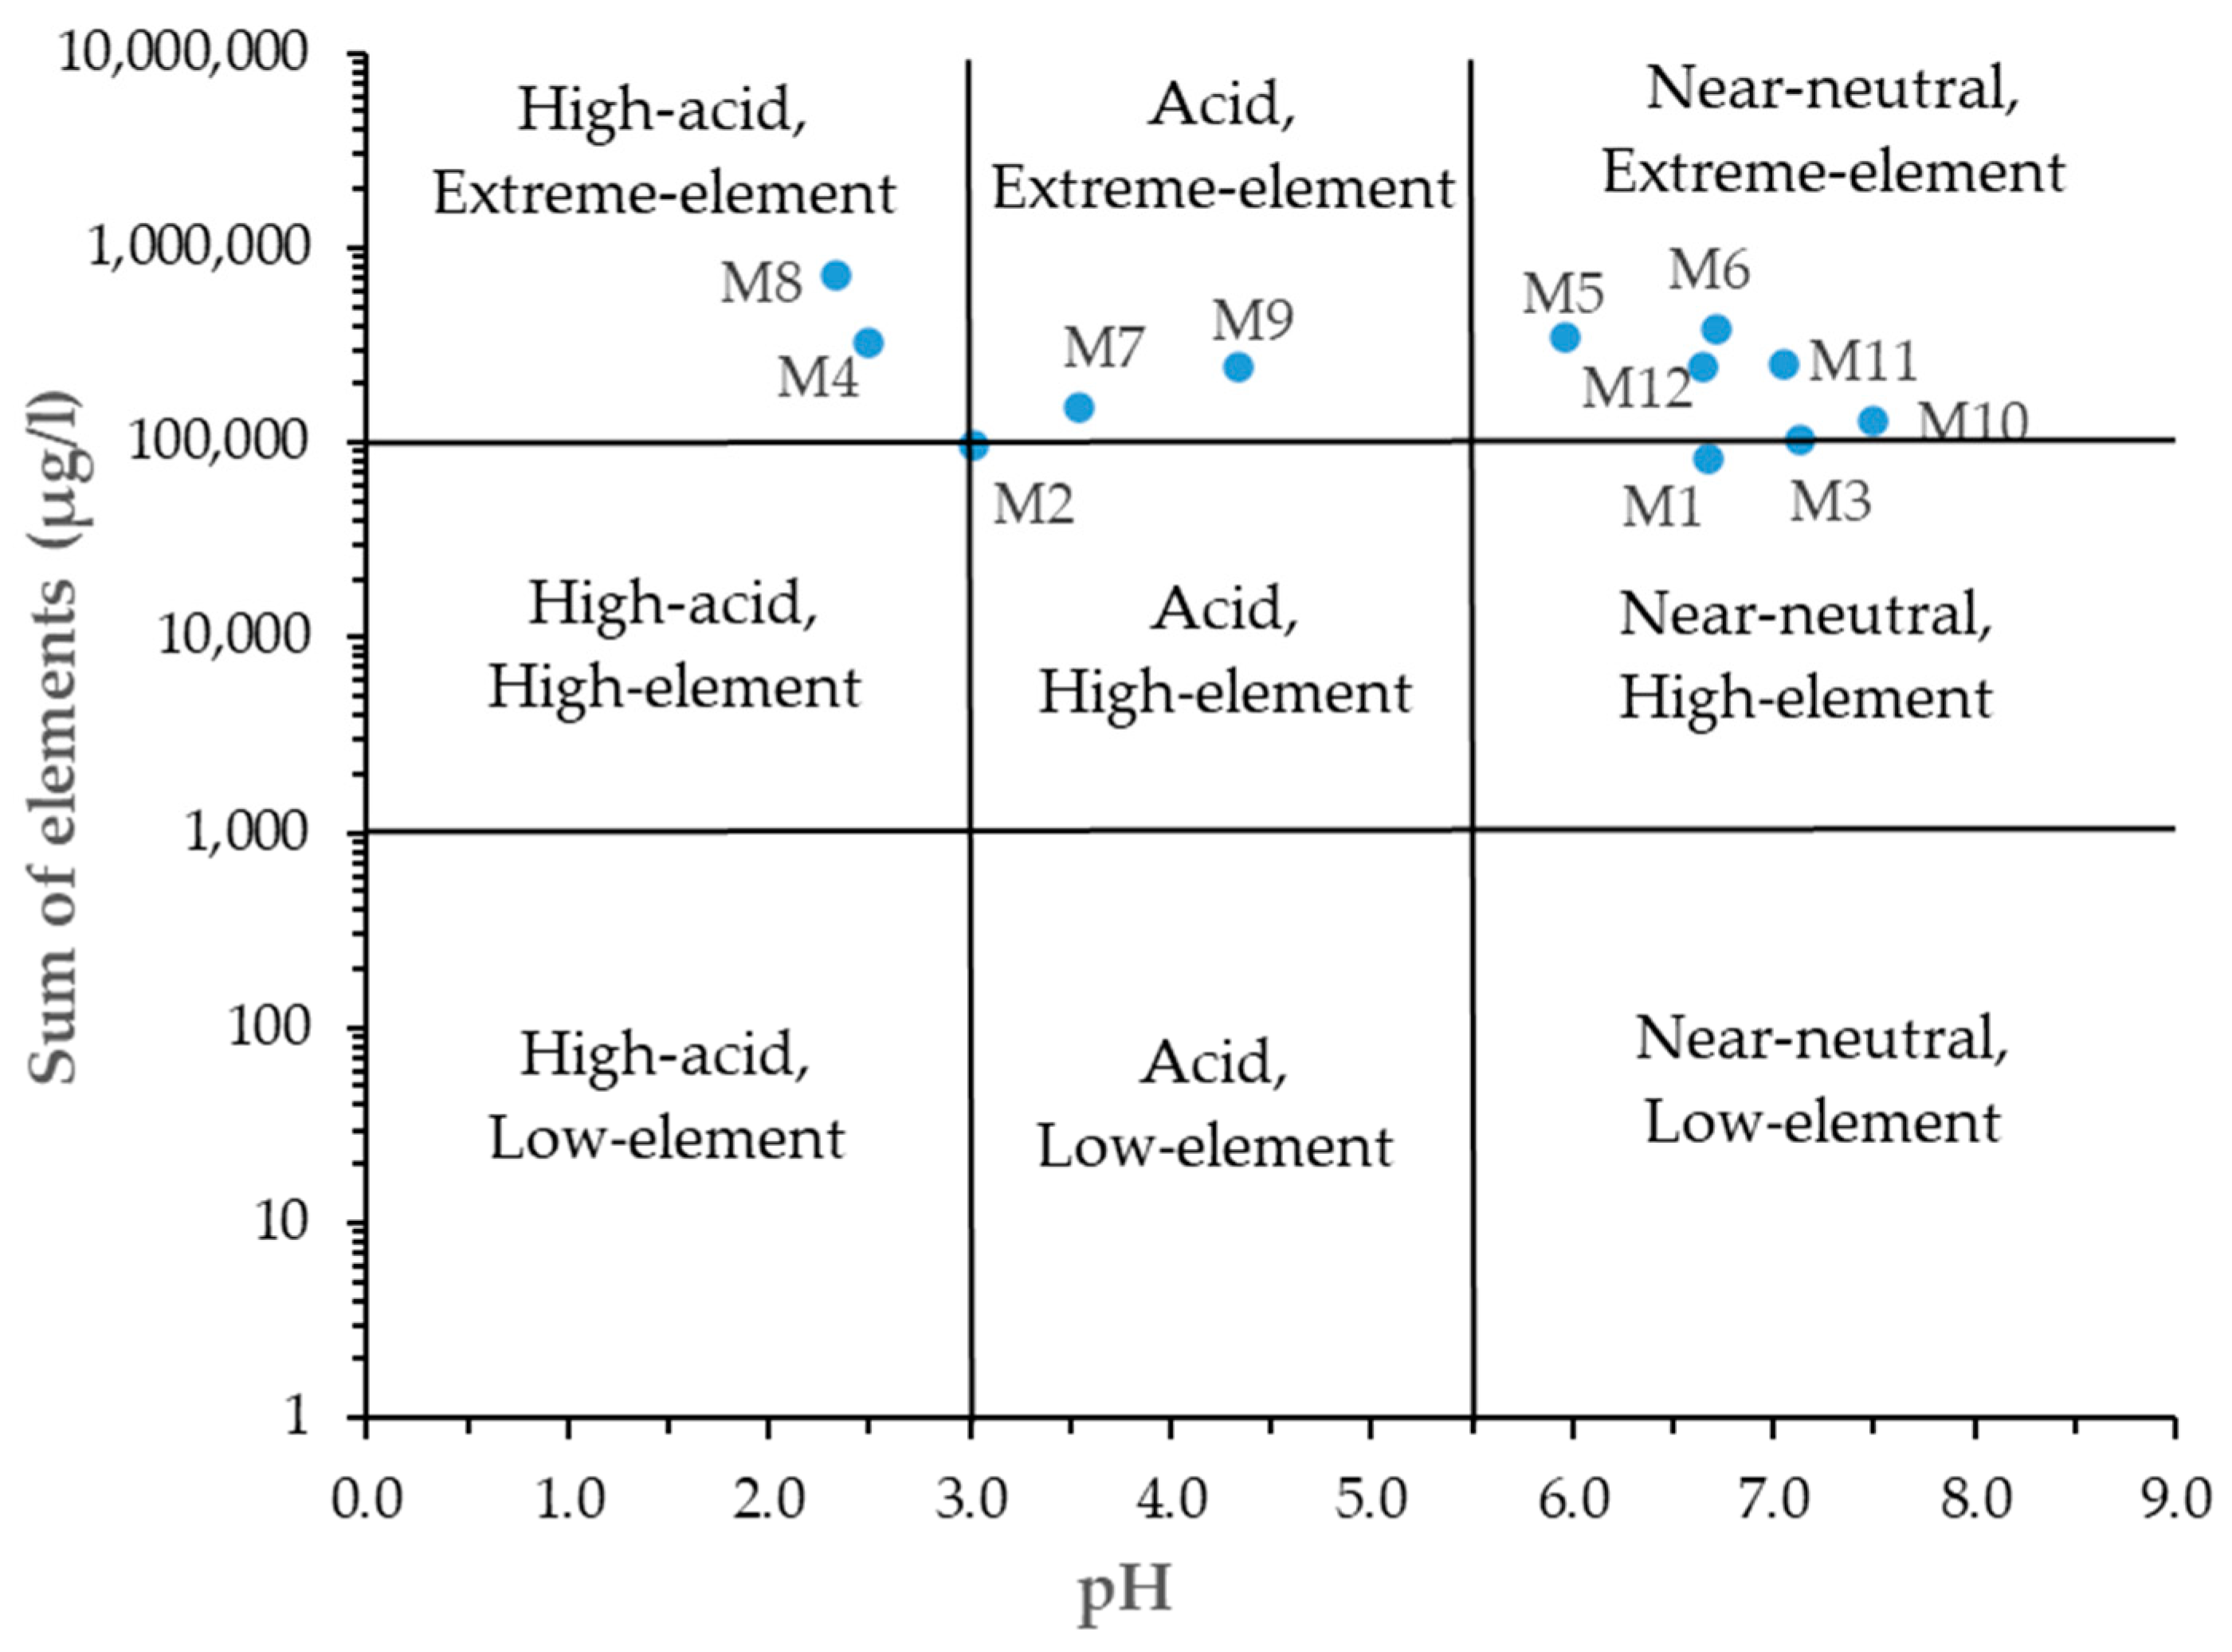
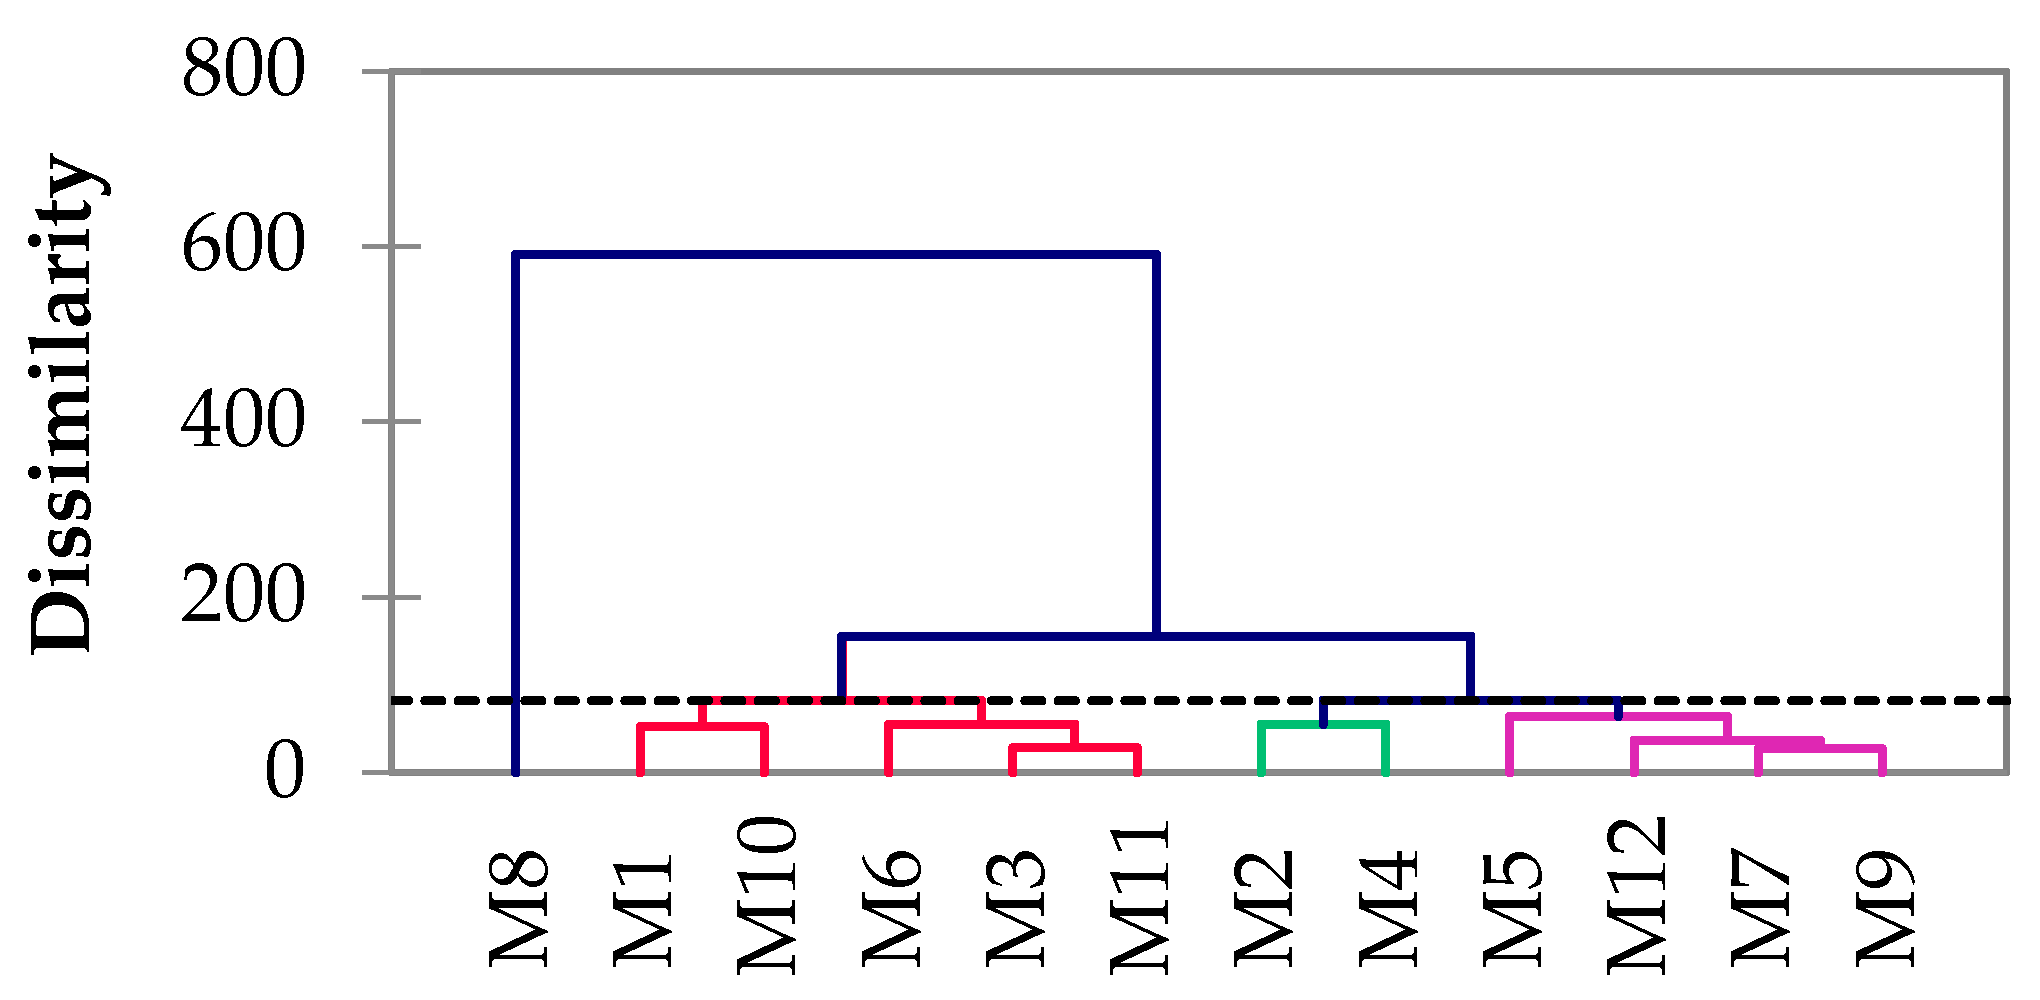
Pearson correlations revealed significant correlations among most elements. The Pearson correlation coefficient (r) ranged between −0.026 and 1.000. The correlation between the two variables was considered strong when the 0.7 < |r| < 1.0, moderate when the 0.5 < |r| < 0.7, and weak when the |r| < 0.5 [36]. All REEs revealed strong correlations with each other and also with Li, Be, Al, Sc, V, Mn, Fe, Co, Ni, Y, SO42−, and NO2, moderate correlations with Mg, Ca, Ti, Cr, Rb, Th, pH, and TDS, and weak correlations with Na, K, Cu, As, Sr, Zr, Mo, Cd, Sn, Sb, Cs, Ba, Tl, Pb, and U. The As, Zn, Sr, and U showed positive and negative correlations with different anions. The Water pH correlated negatively with all the anions and metals (except positive correlations with Ba, Sb, Sn, Mo, Zr, Sr, Cu, Na), whereas the total alkalinity, CaCO3, and HCO3 correlated positively. The total alkalinity, CaCO3, and HCO3 negatively correlated with all the anions, TDS, and metals, except with Ba, Sb, Sn, Mo, Zr, Sr, Na, and U, which were positively correlated. The significant correlations among REEs and the other elements indicated their common origin.
The hierarchical relationship between the 12 samples is shown in Figure 6. The analyzed samples were grouped into two distinct branches; one main branch was represented by M8, and the second one by the other investigated samples; they were grouped into three subdivisions, namely, M9, M7, M12, and M5 in the first one, M4 and M2 in the second, and the third subdivision consisted of M11, M3, M6, M10, and M1. The natural geological background is the same in both studied areas, so it is expected that all samples will have similar compositions. In addition, all samples, except sample M8, represent natural mine drainage and sample M8 represents an artificial mine water collection channel that gathers water from multiple galleries, leaking from the Sasar mine, with various other influences, including urban and traffic impacts, and is located in the vicinity of the Baia Mare city.
The different elements and anions classified together indicate that their contents are intercorrelated. The PCA extracted six components, with eigenvalues higher than two, comprising 90% of the total variance. The biplot for the first and the second components, which account for 57.85%, is shown in Figure 7. The first component had strong loadings of all REEs, Li, Be, Mg, Al, Ca, Sc, Ti, V, Cr, Mn, Fe, Co, Ni, Y, Th, SO42−, NO2, and TDS, accounting for 47.79% of the total variance. The second component explained 10.06% of the total variance, with strong loadings of K, Rb, Cu, Cs, Tl, pH, F, and Cl. The first two components suggested a clear separation between the elements and were consistent with the Pearson correlations. The third component explained 9.16% of the variance and showed positive loadings of Zr, Mo, Sn, and Sb. The grouping of all REEs into one component confirms their similar behavior in mine water discharges in the investigated areas.

3.5. Water Typology

According to the Piper diagram, the majority of the samples are classified into the CaMgSO4 water-type category. Samples M1 and M10 are characterized as CaMgHCO3 water types, and M3 is situated between the two water-type categories (Figure 8).
M1 and M10 are included in the CaMgHCO3- water-type category due to the lowest amounts of Mg, TDS, and SO42−. Based on the cations trilinear plot, the samples are characterized into two water types categories: magnesium (M11) and calcium types (all samples except for M11). The anion trilinear plot indicated that the M1 and M10 are included in the bicarbonate type, while M2, M4–M9, M11, and M12 are included in the sulfate water type. Sample M3 is situated between the two water-type categories.

4. Conclusions

In order to assess the adverse effects of water discharges from derelict mines located in NW Romania, the concentrations of metals, including REEs and anions, were considered important monitoring parameters whose values are regulated in many countries. The obtained results indicated that the REEs were present in each sample, and their concentrations varied over a wide range (1.24–2917 µg/L), with the lowest value for Lu and the highest for Ce. The LREEs were observed to be more prevalent than the HREEs, accounting for (81.9 ± 8.17) % of the total REEs. The Pearson correlation matrix showed that all REEs were highly correlated (α = 0.05) with each other and with SO42−, NO2, Li, Be, Al, Sc, V, Mn, Fe, Co, Ni, and Y. The potential ecological risk index (RI) varied between 199 and 7546 and classified the samples into moderate, strong, very strong, and extremely strong risk categories, with no sample recording a low risk. The major contribution to the RI value was attributed to Cd (50.8%), followed by Cu (41.5%), Ni (5.71%), Pb (0.973%), As (0.784%), and Cr (0.314%), considering the average concentration of these elements. The estimated average daily intake of REEs (13.0 µg/kg/day) from water consumption was below the tolerable daily intake (except for sample M8) and did not pose any non-carcinogenic and carcinogenic health risks. The hazard index calculated for 37 elements, including 14 REEs, from water consumption was extremely high (91.8 ± 131), far exceeding the safe value of the unit, with the highest HQ values for Mn (37.3), Tl (20.1), Cd (14.2), Co (8.29), and Th (2.65). The highest risk was observed for sample M8, followed by M4 and M5, with HIs greater than 100. Regarding the carcinogenic risk, the exposure to Cd, As, and Cr through water resulted in an unacceptable risk for most of the samples. Further studies should explore the geological and hydrogeological conditions of abandoned mines and investigate the efficient treatment of mine drainage water and the remediation of mine-affected areas.

Author Contributions

Conceptualization, M.M. and A.M.; methodology, M.M.; investigation, M.M., O.C., L.L. and A.M.; writing—original draft preparation, M.M., O.C., L.L. and A.M.; writing—review and editing, M.M., O.C., L.L. and A.M.; supervision, M.M. All authors have read and agreed to the published version of the manuscript.

Funding

This research received no external funding.

Data Availability Statement

The original contributions presented in this study are included in the article. Further inquiries can be directed to the corresponding author(s).

Acknowledgments

O.C. acknowledges the support of the Romania–France bilateral projects within the Brancusi Integrated Actions Program, National Research Development and Innovation Plan 2022–2027 (PNCDI IV), European and International Cooperation Program, The Bilateral/Multilateral Subprogramme, contr. no. 2BMFR⁄2024.

Conflicts of Interest

The authors declare no conflicts of interest.

References

  1. Wei, X.; Zhang, S.; Shimko, J.; Dengler, R.W., II. Mine Drainage: Treatment Technologies and Rare Earth Elements. Water Environ. Res. 2019, 91, 1061–1068. [Google Scholar] [CrossRef] [PubMed]
  2. Tomiyama, S.; Igarashi, T. The Potential Threat of Mine Drainage to Groundwater Resources. Curr. Opin. Environ. Sci. Health 2022, 27, 100347. [Google Scholar] [CrossRef]
  3. Roa, A.; Lopez, J.; Cortina, J.L. Recovery of Rare Earth Elements from Acidic Mine Waters: A circular treatment scheme utilizing selective precipitation and ion exchange. Sep. Purif. Technol. 2024, 338, 126525. [Google Scholar] [CrossRef]
  4. Bogush, A.A.; Dabu, C.; Tikhova, V.D.; Kim, J.K.; Campos, L.C. Biomass Ashes for Acid Mine Drainage Remediation. Waste Biomass Valori. 2020, 11, 4977–4989. [Google Scholar] [CrossRef]
  5. Rahman, Z.; Singh, V.P. The Relative Impact of Toxic Heavy Metals (THMs) (Arsenic (As), Cadmium (Cd), Chromium (Cr)(VI), Mercury (Hg), and Lead (Pb)) on the Total Environment: An Overview. Environ. Monit. Assess. 2019, 191, 419. [Google Scholar] [CrossRef]
  6. Yan, F.; Li, N.; Wang, J.; Wu, H. Ecological Footprint Model of Heavy Metal Pollution in Water Environment Based on The Potential Ecological Risk Index. J. Environ. Manag. 2023, 344, 118708. [Google Scholar] [CrossRef]
  7. Bhat, M.A.; Janaszek, A. Evaluation of Potentially Toxic Elements and Microplastics in the Water Treatment Facility. Environ. Monit. Assess. 2024, 196, 475. [Google Scholar] [CrossRef] [PubMed]
  8. Miclean, M.; Cadar, O.; Levei, E.A.; Roman, R.; Ozunu, A.; Levei, L. Metal (Pb, Cu, Cd, and Zn) Transfer along Food Chain and Health Risk Assessment through Raw Milk Consumption from Free-Range Cows. Int. J. Environ. Res. Public Health 2019, 16, 4064. [Google Scholar] [CrossRef]
  9. Nyarko, E.; Boateng, C.M.; Asamoah, O.; Edusei, M.O.; Mahu, E. Potential Human Health Risks Associated with Ingestion of Heavy Metals through Fish Consumption in the Gulf of Guinea. Toxicol. Rep. 2023, 10, 117–123. [Google Scholar] [CrossRef]
  10. Zheng, K.; Zeng, Z.; Tian, Q.; Huang, J.; Zhong, Q.; Huo, X. Epidemiological Evidence for the Effect of Environmental Heavy Metal Exposure on the Immune System in Children. Sci. Total Environ. 2023, 868, 161691. [Google Scholar] [CrossRef]
  11. Tao, Y.; Shen, L.; Feng, C.; Yang, R.; Qu, J.; Ju, H.; Zhang, Y. Distribution of Rare Earth Elements (REEs) and Their Roles in Plant Growth: A Review. Environ. Pollut. 2021, 298, 118540. [Google Scholar] [CrossRef]
  12. Gajendra, N.; Yilmaz, D.; Vila, M.C.; Dinis, M.L.; Levei, E.A.; Török, A.I.; Avsar, D.; Preveniou, A.; Hansen, A.M.; Aaen, S.B.; et al. Towards a European Sustainable Beneficiation of Rare Earth Elements Bearing Minerals: A Review. Sci. Total Environ. 2025; under review. [Google Scholar]
  13. Gao, X.; Han, G.; Liu, J.; Zhang, S. Spatial Distribution and Sources of Rare Earth Elements in Urban River Water: The Indicators of Anthropogenic Inputs. Water 2023, 15, 654. [Google Scholar] [CrossRef]
  14. Miclean, M.; Levei, E.A.; Tanaselia, C.; Cadar, O. Rare Earth Elements Transfer from Soil to Vegetables and Health Risks Associated with Vegetable Consumption in a Former Mining Area. Agronomy 2023, 13, 1399. [Google Scholar] [CrossRef]
  15. Pyrgaki, K.; Gemeni, V.; Karkalis, C.; Koukouzas, N.; Koutsovitis, P.; Petrounias, P. Geochemical Occurrence of Rare Earth Elements in Mining Waste and Mine Water: A Review. Minerals 2021, 11, 860. [Google Scholar] [CrossRef]
  16. Costis, S.; Mueller, K.K.; Coudert, L.; Neculita, C.M.; Reynier, N.; Blais, J.F. Recovery Potential of Rare Earth Elements from Mining and Industrial Residues: A Review and Cases Studies. J. Geochem. Explor. 2020, 221, 106699. [Google Scholar] [CrossRef]
  17. Wang, W.; Yang, Y.; Wang, D.; Huang, L. Toxic Effects of Rare Earth Elements on Human Health: A Review. Toxics 2024, 12, 317. [Google Scholar] [CrossRef]
  18. Toderaș, M.; Florea, V.A.; Itu, R.B. Stability Analysis of the Tailings Dam for the Purpose of Closing, Greening, and Ensuring Its Safety—Study Case. Sustainability 2023, 15, 7606. [Google Scholar] [CrossRef]
  19. Januszewsk, A.; Siuda, R.; Kruszewski, L. Composition and Geochemistry of Recently Formed Secondary Mineral Parageneses from the Breiner Mine, Maramureș, Romania. J. Geochem. Explor. 2025, 269, 107638. [Google Scholar] [CrossRef]
  20. National Company of Precious and Non-Ferrous Metals, REMIN–S.A. Baia Mare. Available online: http://www.remin.ro/istorie.php (accessed on 15 October 2024).
  21. Levei, E.; Frentiu, T.; Ponta, M.; Senila, M.; Miclean, M.; Roman, C.; Cordos, E. Characterisation of Soil Quality and Mobility of Cd, Cu, Pb and Zn in the Baia Mare area Northwest Romania Following the Historical Pollution. Int. J. Environ. Anal. Chem. 2009, 89, 635–649. [Google Scholar] [CrossRef]
  22. Berbeleac, I. Lead–Zinc ore Deposits; Technical Publishing House: Bucharest, Romania, 1998; pp. 457–462. [Google Scholar]
  23. Moldovan, A.; Hoaghia, M.-A.; Kovacs, E.; Mirea, I.C.; Kenesz, M.; Arghir, R.A.; Petculescu, A.; Levei, E.A.; Moldovan, O.T. Quality and Health Risk Assessment Associated with Water Consumption—A Case Study on Karstic Springs. Water 2020, 12, 3510. [Google Scholar] [CrossRef]
  24. APHA. Standard Methods for the Examination of Water and Wastewater (American Public Health Association), 22nd ed.; American Water Works Association, Water Environment Federation: Washington, DC, USA, 2012. [Google Scholar]
  25. Herojeet, R.; Naik, P.K.; Rishi, M.S. A New Indexing Approach for Evaluating Heavy Metal Contamination in Groundwater. Chemosphere 2020, 245, 125598. [Google Scholar] [CrossRef]
  26. Order 161. In Order for the Approval of the Normative on the Classification of Surface Water Quality in Order to Establish the Ecological Status of Water Bodies; Published in the Official Gazette, no. 511 from 13 June 2006; Ministry of Environment and Water Management: Hong Kong, China, 2006. (In Romanian)
  27. Government Decision 188 of 28 February 2002 Approving the Norms Concerning the Conditions of Wastewater Discharge in the Aquatic Environment; Published in the Official Gazette, Part I no. 187 of 20 March 2002. (In Romanian). Available online: https://managerdemediu.ro/wp-content/uploads/2020/04/NTPA-001-din-2002-Normativul-privind-stabilirea-limitelor-de-%C3%AEnc%C4%83rcare-cu-poluan%C5%A3i-a-apelor-uzate-industriale-%C5%9Fi-urbane-la-evacuarea-%C3%AEn-receptorii-naturali.pdf (accessed on 10 October 2024).
  28. Sneller, F.E.C.; Kalf, D.F.; Weltje, L.; Van Wezel, A.P. Maximum Permissible Concentrations and Negligible Concentrations for Rare Earth Elements (REEs); RIVM report 601501 011; National Institute of Public Health and the Environment: Bilthoven, The Netherlands, 2000; Available online: https://rivm.openrepository.com/server/api/core/bitstreams/23f90326-1e54-4214-83d7-de22fcb0864c/content (accessed on 10 October 2024).
  29. Moldovan, A.; Török, A.I.; Kovacs, E.; Cadar, O.; Mirea, I.C.; Micle, V. Metal Contents and Pollution Indices Assessment of Surface Water, Soil, and Sediment from the Aries, River Basin Mining Area, Romania. Sustainability 2022, 14, 8024. [Google Scholar] [CrossRef]
  30. Hakanson, L. An Ecological Risk Index for Aquatic Pollution Control. A Sedimentological Approach. Water Res. 1980, 14, 975–1001. [Google Scholar] [CrossRef]
  31. Gomes, P.; Valente, T. Seasonal Impact of Acid Mine Drainage on Water Quality and Potential Ecological Risk in an Old Sulfide Exploitation. Environ. Sci. Pollut. Res. 2024, 31, 21124–21135. [Google Scholar] [CrossRef]
  32. Singovszka, E.; Balintova, M.; Junakova, N. The impact of heavy metals in water from abandoned mine on human health. SN Appl. Sci. 2020, 2, 934. [Google Scholar] [CrossRef]
  33. Emmanuel, U.C.; Chukudi, M.I.; Monday, S.S.; Antony, A.I. Human Health Risk Assessment of Heavy Metals in Drinking Water Sources in Three Senatorial Districts of Anambra State, Nigeria. Toxicol. Rep. 2022, 15, 869–875. [Google Scholar] [CrossRef] [PubMed]
  34. USEPA Regional Screening Level (RSL) Summary Table. Available online: https://www.epa.gov/risk/regional-screening-levels-rsls-users-guide#toxicity (accessed on 10 October 2024).
  35. Canpolat, O.; Varol, M.; Okan, O.O.; Eris, K.K.; Caglar, M. A Comparison of Trace Element Concentrations in Surface and Deep Water of The Keban Dam Lake (Turkey) And Associated Health Risk Assessment. Environ. Res. 2020, 190, 110012. [Google Scholar] [CrossRef]
  36. Veskovic, J.; Lucic, M.; Ristic, M.; Peric-Grujic, A.; Onjia, A. Spatial Variability of Rare Earth Elements in Groundwater in the Vicinity of a Coal-Fired Power Plant and Associated Health Risk. Toxics 2024, 12, 62. [Google Scholar] [CrossRef]
  37. Wu, X.; Zhao, X.; Hu, J.; Li, X.; Guo, X.; Wang, Q.; Liu, Y.; Gong, Z.; Wu, Y.; Fang, M.; et al. Occurrence and Health Risk Assessment of Toxic Metals and Rare Earth Elements in Microalgae: Insight into Potential Risk Factors in New Sustainable Food Resources. Food Chem. X 2024, 23, 101697. [Google Scholar] [CrossRef]
  38. Resz, M.-A.; Roman, C.; Senila, M.; Török, A.I.; Kovacs, E. A Comprehensive Approach to the Chemistry, Pollution Impact and Risk Assessment of Drinking Water Sources in a Former Industrialized Area of Romania. Water 2023, 15, 1180. [Google Scholar] [CrossRef]
  39. Ficklin, W.H.; Plumlee, G.S.; Smith, K.S.; McHugh, J.B. Geochemical Classification of Mine Drainages and Natural Drainages in Mineralized Areas. In Proceedings of the International Symposium on Water-Rock Interaction, Park City, UT, USA, 13 March 1992; Kharaka, Y.K., Maest, A.S., Eds.; Balkema AA: Rotterdam, The Netherlands, 1992; Volume 7, pp. 381–384. [Google Scholar]
  40. Hermassi, M.; Granados, M.; Valderrama, C.; Ayora, C.; Cortina, J.L. Recovery of Rare Earth Elements from Acidic Mine Waters: An Unknown Secondary Resource. Sci. Total Environ. 2022, 810, 152258. [Google Scholar] [CrossRef]
  41. Windisch, J.; Gradwohl, A.; Gilbert, B.M.; Dos Santos, Q.M.; Wallner, G.; Avenant-Oldewage, A.; Jirsa, F. Toxic Elements in Sediment and Water of the Crocodile River (West) System, South Africa, Following Acid Mine Drainage. Appl. Sci. 2022, 12, 10531. [Google Scholar] [CrossRef]
  42. Gomes, P.; Valente, T.; Marques, R.; Prudencio, M.I.; Pamplona, J. Rare Earth Elements—Source and Evolution in An Aquatic System Dominated by Mine-Influenced Waters. J. Environ. Manag. 2022, 322, 116125. [Google Scholar] [CrossRef] [PubMed]
  43. Royer-Lavallee, A.; Neculita, C.M.; Coudert, L. Removal and Potential Recovery of Rare Earth Elements from Mine Water. J. Ind. Eng. Chem. 2020, 89, 47–57. [Google Scholar] [CrossRef]
  44. Kowalczyk, E.; Givelet, L.; Amlund, H.; Sloth, J.J.; Hansen, M. Risk Assessment of Rare Earth Elements, Antimony, Barium, Boron, Lithium, Tellurium, Thallium and Vanadium in Teas. EFSA J. 2022, 20, e200410. [Google Scholar] [CrossRef] [PubMed]
  45. Duru, C.E.; Duru, I.A. Mobility of Aluminum and Mineral Elements between Aluminum Foil and Bean Cake (Moimoi) Mediated by pH and Salinity During Cooking. SN Appl. Sci. 2020, 2, 348. [Google Scholar] [CrossRef]
  46. Wong, C.; Roberts, S.M.; Saab, I.N. Review of Regulatory Reference Values and Background Levels for Heavy Metals in The Human Diet. Regul. Toxicol. Pharmacol. 2022, 130, 105122. [Google Scholar] [CrossRef]
  47. Integrated Risk Information System (IRIS); U.S. Environmental Protection Agency; National Center for Environmental Assessment. Thallium (I), Soluble Salts; CASRN Various. 2009. Available online: https://iris.epa.gov/static/pdfs/1012_summary.pdf (accessed on 10 October 2024).
  48. U.S. Food and Drug Administration. Arsenic in Rice and Rice Products Risk Assessment Report. 2016. Available online: http://www.fda.gov/Food/FoodScienceResearch/RiskSafetyAssessment/default.htm (accessed on 10 October 2024).
  49. European Food Safety Authority. Update of the Risk Assessment of Inorganic Arsenic in Food. 2024. Available online: https://www.efsa.europa.eu/en/plain-language-summary/update-risk-assessment-inorganic-arsenic-food (accessed on 10 October 2024).
Figure 1. Map of the study area and sampling sites.
Environments 12 00076 g001
Figure 2. (a) Concentration of major elements in mine waters; (b) Concentration of light REEs (LREEs) and heavy REEs (HREEs) in mine waters.
Environments 12 00076 g002
Figure 3. Ficklin diagram showing different classifications of the mine waters.
Environments 12 00076 g003
Figure 4. Metal evaluation index (MEI) (a) for Be, V, Cr, Co, Ni, Cu, As, Mo, Cd, Sn, Ba, Tl and Pb calculated based on the quality standards of elements in surface water; (b) for Al, Cr, Mn, Fe, Co, Ni, Cu, Zn, As, Mo, Cd and Pb calculated based on the limit values of elements for wastewater for discharge into natural receptors; (c) for REEs. Mine waters with MEI values below 10 (green line) have low metal pollution levels, those with MEI values between 10 (green line) and 20 (red line) are moderately polluted, whereas those with MEI above 20 (red line) are highly polluted.
Environments 12 00076 g004
Figure 5. Potential ecological risk index (RI) (a) for Cd, As, Ni, Cu, Pb, Cr calculated based on the quality standards of elements in surface water; (b) for Cd, As, Ni, Cu, Pb, Cr, Zn calculated based on the limit values of elements for wastewater for discharge into natural receptors. Mine waters with RI values below 150 (green line) have low ecological risk, those between 150 (green line) and 300 (blue line) have moderate ecological risk, between 300 (blue line) and 600 (orange line) have strong risk, between 600 (orange line) and 5000 (red line) have very high risk, whereas those above 5000 (red line) have extremely strong risk.
Environments 12 00076 g005
Figure 6. Agglomerative hierarchical clustering of the mine waters based on their chemical composition (each color represents a group of samples with similar properties).
Environments 12 00076 g006
Figure 7. Principal component analysis (PCA) in mine waters of total element variables in association with the sampling location.
Environments 12 00076 g007
Figure 8. Classification results of the mine water discharges using Piper diagram.
Environments 12 00076 g008
Table 1. Sampling sites in Maramures region, NW Romania.
SampleMining AreaSampling Site Description
M1Baia MareSurface water from Baita River, after the confluence with Tyuzosa mine drainage
M2Mine drainage from Tarnita mine gallery, collected near the Baita village
M3Mine drainage from Reiner mine gallery, collected near the Cavnic town
M4Surface water from Red Valley, after the input of Campurele mine drainage treatment plant, collected upstream Baita Valley confluence
M5Mine drainage from Cavnic mine gallery, collected near Cavnic town
M6Mine drainage from Herja mine gallery, collected near Baia Sprie town
M7Mine drainage from Baiut mine gallery, collected near Targu Lapus town
M8Mine drainage from Sasar mine galleries, collected near Baia Mare city
M9Baia BorsaMine drainage from Emerik mine gallery, collected near Baia Borsa town
M10Mine drainage from Colbu mine gallery, collected near Baia Borsa town
M11Mine drainage from Burloaia mine gallery, collected near Baia Borsa town
M12Mine drainage from Gura Baii mine gallery, collected near Baia Borsa town
Table 2. Maximum allowable concentration (MAC) used in MEI calculation.
MAC (µg/L)
Surface water 1BeVCrCoNiCuAsMoCdSnBaTlPb
0.051.22.50.72.11.37.23.61.02.22002.01.7
Wastewater discharged in natural receptors 2AlCrMnFeCoNiCuZnAsMoCdPb-
50001000100050001000500100500100100200200-
REEs 3YLaCePrNdSmGdDy-----
6.410.122.19.11.88.27.19.3-----
1 quality standards for hazardous and priority hazardous substances in surface water set by Romanian legislation, Order 161/2006 [26]. 2 limit values for pollutant load limits for industrial and urban wastewater for discharge into natural receptors set by Romanian Government Decision 188/2002 [27]. 3 Maximum Permissible Concentrations for Rare Earth Elements given by Sneller et al. [28].
Table 3. Concentrations (expressed as average ± 2 × standard deviation, m ± 2 s) of elements, anions, total dissolved solids (TDS), acidity and total alkalinity in water samples (n = 12).
ParameterpHTDS (mg/L)Na (µg/L)Mg (µg/L)Al (µg/L)K (µg/L)
m ± 2 s
(min–max)
5.28 ± 3.96
(2.34–7.49)
2216 ± 2112
(594–4150)
10,772 ± 12,104 (4523–23,941)38,033 ± 58,636 (6468–92,489)8083 ± 184,978 (72.8–51,934)3434 ± 4704
(1316–8895)
ParameterCa (µg/L)Mn (µg/L)Fe (µg/L)Co (µg/L)Ni (µg/L)Cu (µg/L)
m ± 2 s
(min–max)
135,368 ± 130,858
(48,126–24,2061)
25,085 ± 119,198 (48.2–212,247)22,975 ± 62,386 (372–94,569)69.6 ± 252 (0.674–459)56.2 ± 76.4
(11.1–135)
253 ± 702
(16,386–1236)
ParameterZn (µg/L)As (µg/L)Cr (µg/L)Mo (µg/L)Cd (µg/L)Pb (µg/L)
m ± 2 s
(min–max)
12492 ± 24346 (317–40469)13.2 ± 22.8
(1.05–31.3)
9.19 ± 13.9
(2.55–22.3)
1.30 ± 3.02 (0.199–5.57)39.7 ± 98.4
(0.339–164)
7.76 ± 15.34 (<0.010–20.1)
ParameterLi (µg/L)Be (µg/L)Ba (µg/L)La (µg/L)Ce (µg/L)Pr (µg/L)
m ± 2 s
(min–max)
86.4 ± 177
(21.1–345)
2.86 ± 12.5
(0.024–22.1)
33.4 ± 71.8
(11.7–144)
51.6 ± 226
(0.424–404)
144 ± 674
(0.335–1198)
19.6 ± 96.8
(0.049–172)
ParameterNd (µg/L)Sm (µg/L)Eu (µg/L)Gd (µg/L)Tb (µg/L)Dy (µg/L)
m ± 2 s
(min–max)
57.7 ± 236
(0.193–417)
14.5 ± 61.8
(0.048–109)
4.65 ± 21.0
(0.025–36.9)
23.0 ± 102.6 (0.054–181)3.49 ± 16.04 (0.010–28.3)20.3 ± 95.6
(0.043–169)
ParameterHo (µg/L)Er (µg/L)Tm (µg/L)Yb (µg/L)Lu (µg/L)Rb (µg/L)
m ± 2 s
(min–max)
3.93 ± 18.74 (0.011–33.1)10.1 ± 48.6
(0.021–85.8)
1.29 ± 6.24 (<0.004–11.0)7.46 ± 36.4
(0.023–64.1)
1.10 ± 5.38 (<0.003–9.50)25.2 ± 53.8
(3.38–80.5)
ParameterSr (µg/L)Y (µg/L)Zr (µg/L)Sn (µg/L)Cs (µg/L)U (µg/L)
m ± 2 s
(min–max)
502 ± 562
(110–975)
59.2 ± 268
(0.259–475
0.886 ± 1.130
(0.372–2.23)
3.41 ± 7.66
(1.10–15.1)
7.03 ± 16.54 (0.208–24.9)2.26 ± 5.46 (<0.005–8.57)
ParameterTh (µg/L)Tl (µg/L)Sc (µg/L)Ti (µg/L)Sb (µg/L)V (µg/L)
m ± 2 s
(min–max)
0.742 ± 1.816 (0.021–2.48)1.69 ± 6.26 (<0.007–9.99)11.2 ± 25.8
(1.59–49.8)
212 ± 199
(109–412)
1.28 ± 3.32
(0.107–4.86)
2.65 ± 9.62
(0.241–15.1)
ParameterΣLREE (µg/L)ΣHREE (µg/L)ΣREE (µg/L)ΣREY (µg/L)Acidity (mg/L CaCO3)Alcalinity (mg/L)
m ± 2 s
(min–max)
288 ± 1292
(1.05–2299)
75.3 ± 350 (0.193–618)363 ± 1642
(1.24–2917)
433 ± 1934
(8.70–3442)
43.8 ± 85.4
(0–100)
0.875 ± 1.708
(0–2.00)
ParameterSO42− (mg/L)HCO3 (mg/L)NO2 (mg/L)NO3 (mg/L)F (mg/L)Cl (mg/L)
m ± 2 s
(min–max)
1264 ± 4620
(74.4–8500)
53.4 ± 104.2
(0–122)
1.09 ± 2.10
(0.025–3.70)
1.94 ± 3.76
(0.10–5.31)
1.60 ± 3.48
(0.025–4.70)
6.63 ± 8.66
(0.690–12.5)
Table 4. Reference doses (RfD, mg/kg/day), chronic daily intake (CDI, mg/kg/day), hazard quotient (HQ) and hazard index (HI) through water consumption (expressed as average ± 2 × standard deviation, m ± 2 s).
ElementRfD 1CDIHQHI
m ± 2 sMin–Maxm ± 2 sMin–Maxm ± 2 s
(Min–Max)
Al2.86 × 10−10.29 ± 1.10.003–1.91.0 ± 3.70.01–6.591.8 ± 262
(4.54–466)
V5.04 × 10−39.0 × 10⁻⁵ ± 3.4 × 10−41.0 × 10−5–5.4 × 10−40.02 ± 0.070.002–0.11
Cr3.00 × 10−33.0 × 10⁻⁴ ± 4.0 × 10−41.0 × 10−4–8.0 × 10−40.11 ± 0.160.03–0.27
Mn2.40 × 10−20.92 ± 4.30.002–7.6 37 ± 1770.07–316
Fe7.00 × 10−10.82 ± 2.20.013–3.41.2 ± 3.20.02–4.8
Co3.00 × 10−32.0 × 10⁻³ ± 1.0 × 10−22.0 × 10−5–1.6 × 10−28.3 ± 300.08–55
Ni2.00 × 10−22.0 × 10⁻³ ± 2.0 × 10−34.0 × 10−4–5.0 × 10−30.10 ± 0.140.02–0.24
Cu4.00 × 10−29.0 × 10⁻³ ± 2.6 × 10−21.0 × 10−3–4.4 × 10−20.23 ± 0.630.02–1.1
Zn3.00 × 10−10.45 ± 0.870.011–1.451.5 ± 2.90.04–4.8
Sr6.00 × 10−10.02 ± 0.020.004–0.0350.03 ± 0.030.01–0.06
Mo5.00 × 10−35.0 × 10⁻⁵ ± 1.0 × 10−41.0 × 10−5–2.0 × 10−49.3 × 10−3 ± 2.2 × 10−21.4 × 10−3–4.0 × 10⁻²
Cd1.00 × 10−41.4 × 10⁻³ ± 3.6 × 10−31.0 × 10−5–6.0 × 10−314 ± 350.12–58.4
Pb3.00 × 10−42.8 × 10⁻⁴ ± 5.4 × 10−44.0 × 10−7–7.0 × 10−40.92 ± 1.81.2 × 10−3–2.4
U2.00 × 10−48.0 × 10⁻⁴ ± 1.8 × 10−42.0 × 10−7 –3.1 × 10−40.40 ± 0.970.001–1.5
Li2.00 × 10−33.0 × 10⁻³ ± 6.0 × 10−30.001–0.0121.5 ± 3.20.38–6.2
Th1.002.7 × 10−5 ± 6.4 × 10−58.0 × 10−7–8.9 × 10−52.7 ± 6.50.08–8.9
Tl3.00 × 10−66.0 × 10⁻⁵ ± 2.2 × 10⁻⁴ 2.3 × 10⁻⁷ –35.7 × 10−520 ± 740.08–119
Sb4.00 × 10−44.6 × 10⁻⁵ ± 1.2 × 10⁻⁴ 3.8 × 10⁻⁶ –1.74 × 10−50.11 ± 0.309.6 × 10−3–4.34 × 10⁻¹
Zr8.00 × 10−53.2 × 10⁻⁵ ± 4.0 × 10⁻⁵ 1.3 × 10⁻⁵ –7.9 × 10−50.40 ± 0.500.17–0.99
Ba2.00 × 10−11.2 × 10⁻³ ± 2.6 × 10−34.0 × 10−4–5.2 × 10−36.0 × 10−3 ± 1.3 × 10−22.1 × 10−3–2.6 × 10⁻²
As3.00 × 10−44.7 × 10⁻⁴ ± 8.2 × 10−43.8 × 10−5–1.1 × 10−30.79 ± 2.10.06–1.9
∑REE2.00 × 10−20.01 ± 0.064.4 × 10−5–1.0 × 10−10.65 ± 2.92.2 × 10−3–5.2
Sc2.00 × 10−24.0 × 10⁻⁵ ± 1.0 × 10−55.7 × 10−5–1.8 × 10−30.02 ± 0.052.8 × 10−3–8.9 × 10⁻²
Y2.00 × 10−22.1 × 10⁻³ ± 9.6 × 10−39.3 × 10−6–1.7 × 10−20.11 ± 0.485.0 × 10−4–8.5 × 10⁻¹
1 Based on references [44,45,46,47,48].
Table 5. Carcinogenic risk (CR) through water consumption (expressed as average ± 2 × standard deviation, m ± 2 s).
ElementCR
m ± 2 sMin–Max
Pb2.4 × 10−6 ± 4.7 × 10−63.0 × 10−9–6.1 × 10⁻⁶
Cd8.9 × 10−3 ± 2.2 × 10−27.6 × 10−5–3.681 × 10⁻²
As0.79 ± 0.00120.062–1.9
Cr1.6 × 10−4 ± 2.5 × 10−44.6 × 10−5–4.0 × 10⁻⁴
REEs4.1 × 10−14 ± 1.9 × 10−131.4 × 10⁻¹⁶–3.3 × 10⁻¹³
Disclaimer/Publisher’s Note: The statements, opinions and data contained in all publications are solely those of the individual author(s) and contributor(s) and not of MDPI and/or the editor(s). MDPI and/or the editor(s) disclaim responsibility for any injury to people or property resulting from any ideas, methods, instructions or products referred to in the content.

