Article

Understanding the Origin of Wet Deposition Black Carbon in North America During the Fall Season

1
Environmental Chemistry and Technology Program, University of Wisconsin-Madison, Madison, WI 53706, USA
2
Wisconsin State Laboratory of Hygiene, University of Wisconsin-Madison, Madison, WI 53706, USA
*
Author to whom correspondence should be addressed.
Current address: Department of Chemistry, School of Science, King Mongkut’s Institute of Technology Ladkrabang, 1 Chalongkrung 1 Alley, Ladkrabang District, Bangkok 10520, Thailand.
Environments 2025, 12(2), 58; https://doi.org/10.3390/environments12020058
Submission received: 17 December 2024 / Revised: 17 January 2025 / Accepted: 21 January 2025 / Published: 10 February 2025

Abstract

:
Black carbon (BC) aerosols emitted from biomass, fossil fuel, and waste combustion contribute to the radiation budget imbalance and are transported over extensive distances in the Earth’s atmosphere. These aerosols undergo physical and chemical modifications with co-existing aerosols (e.g., nitrate, sulfate, ammonium) through aging processes during long-range transport and are primarily removed from the troposphere by wet deposition. Using precipitation samples collected in North America between 26 October and 1 December 2020 by the National Atmospheric Deposition Program (NADP), we investigated the relationships between BC and both water-soluble ions and water-soluble organic carbon (WSOC) using Spearman’s rank coefficients. We then attempted to identify the sources of BC in the wet deposition using factor analysis (FA) and satellite data of fire smoke. BC showed a very strong correlation with nitrate (ρ = 0.83). Strong correlations were also found with WSOC, ammonium, calcium, and sulfate ions (ρ = 0.78, 0.74, 0.74, and 0.67, respectively). FA showed that BC was in the same factor as nitrate, ammonium, sulfate, and WSOC, indicating that BC could originate from secondary aerosol formation and biomass burning. Supported by satellite data of fire and smoke, BC and other correlated pollutants were believed to be associated with wildfire outbreaks in several states in the United States (US) during November 2020.

1. Introduction

Black carbon aerosol (i.e., BC, or soot) is the predominant light-absorbing particulate in the atmosphere released through incomplete combustion of biomass, fossil fuels, and carbon-containing materials [1,2,3,4]. Once they enter the atmosphere, BC aerosols impact the radiational budget balance and climate on global and local scales by absorbing radiation energy, reflecting sunlight, accelerating snow and ice melting, and altering monsoon and precipitation patterns [1,4,5,6,7,8,9,10]. These aerosols have a relatively short residence time in the atmosphere (days to weeks) [11,12] and are primarily removed from the atmosphere by wet deposition processes [13,14,15,16]. BC particles may be incorporated into precipitation through particle aging and wet scavenging. Aging processes are interactions in which other air pollutant aerosols (e.g., nitrate, sulfate, and organics) modify the physical and chemical properties of BC aerosols through condensation or coagulation on the BC hydrophobic aerosol cores [17]. These processes occur during long-range transport, allowing the aerosols to gain an affinity for water on their hydrophilic coatings [18,19]. Hydrophobic BC aerosols can act as cloud condensation nuclei (CCN) or ice nuclei (IN) in the in-cloud scavenging (i.e., rainout) above the cloud base and be removed from the atmosphere along with other air pollutants [20,21]. Wet scavenging via CCN formation is believed to be the primary pathway for BC wet removal [22,23], as long-range transported BC aerosols frequently exist in the small-size mode that favors nucleation activation [21]. Another type of BC wet deposition, namely below-cloud scavenging (i.e., washout), involves collision and coalescence between water droplets and BC or other aerosols, such as sulfate, ammonium, and nitrate [20,21]. This removal mechanism is thought to contribute approximately one-tenth of the total wet deposition [24]. Further, it can also effectively remove airborne hydrophobic compounds, such as BC aerosols that are not fully coated with hydrophilic materials [25].
Despite the significant impact of BC on the Earth’s radiation balance and climate change, only a few studies have focused on continuously collecting BC wet deposition data. Only a small quantity of sites globally has been used to obtain invaluable information about BC in wet deposition [26]. Furthermore, BC wet-deposition research far too often focuses on quantifying BC concentrations and wet removal fluxes. This trend of BC wet-deposition research leaves the relationships between BC and other air pollutants unexplored even though many aerosols (e.g., nitrate, sulfate, ammonium, Na+) significantly take part in BC particle aging and wet removal processes [20,27].
In our recent attempt to fill the data gap, we investigated the wet deposition of BC in North America between 26 October and 1 December 2020, with a dataset of 478 weekly samples collected by the National Atmospheric Deposition Program (NADP) in North America, from 209 locations in the US, Canada, US Virgin Islands, and Puerto Rico. Our findings indicated high BC wet deposition in the central US, which could be driven by high levels of precipitation, and is somewhat consistent with forest fire emissions in November 2020 [28]. This dataset contains additional information on acidity, conductivity, water-soluble ions, and water-soluble organic carbon (WSOC), which are beneficial for further understanding BC wet deposition and its impacts. In this study, therefore, we utilized the same dataset to (1) explore the relationships between BC and coexisting air pollutants in precipitation using Spearman’s rank coefficients and (2) identify the potential sources of BC in the precipitation using factor analysis (FA) and fire/smoke satellite data.

2. Materials and Methods

2.1. NADP National Trend Network (NTN) Samples

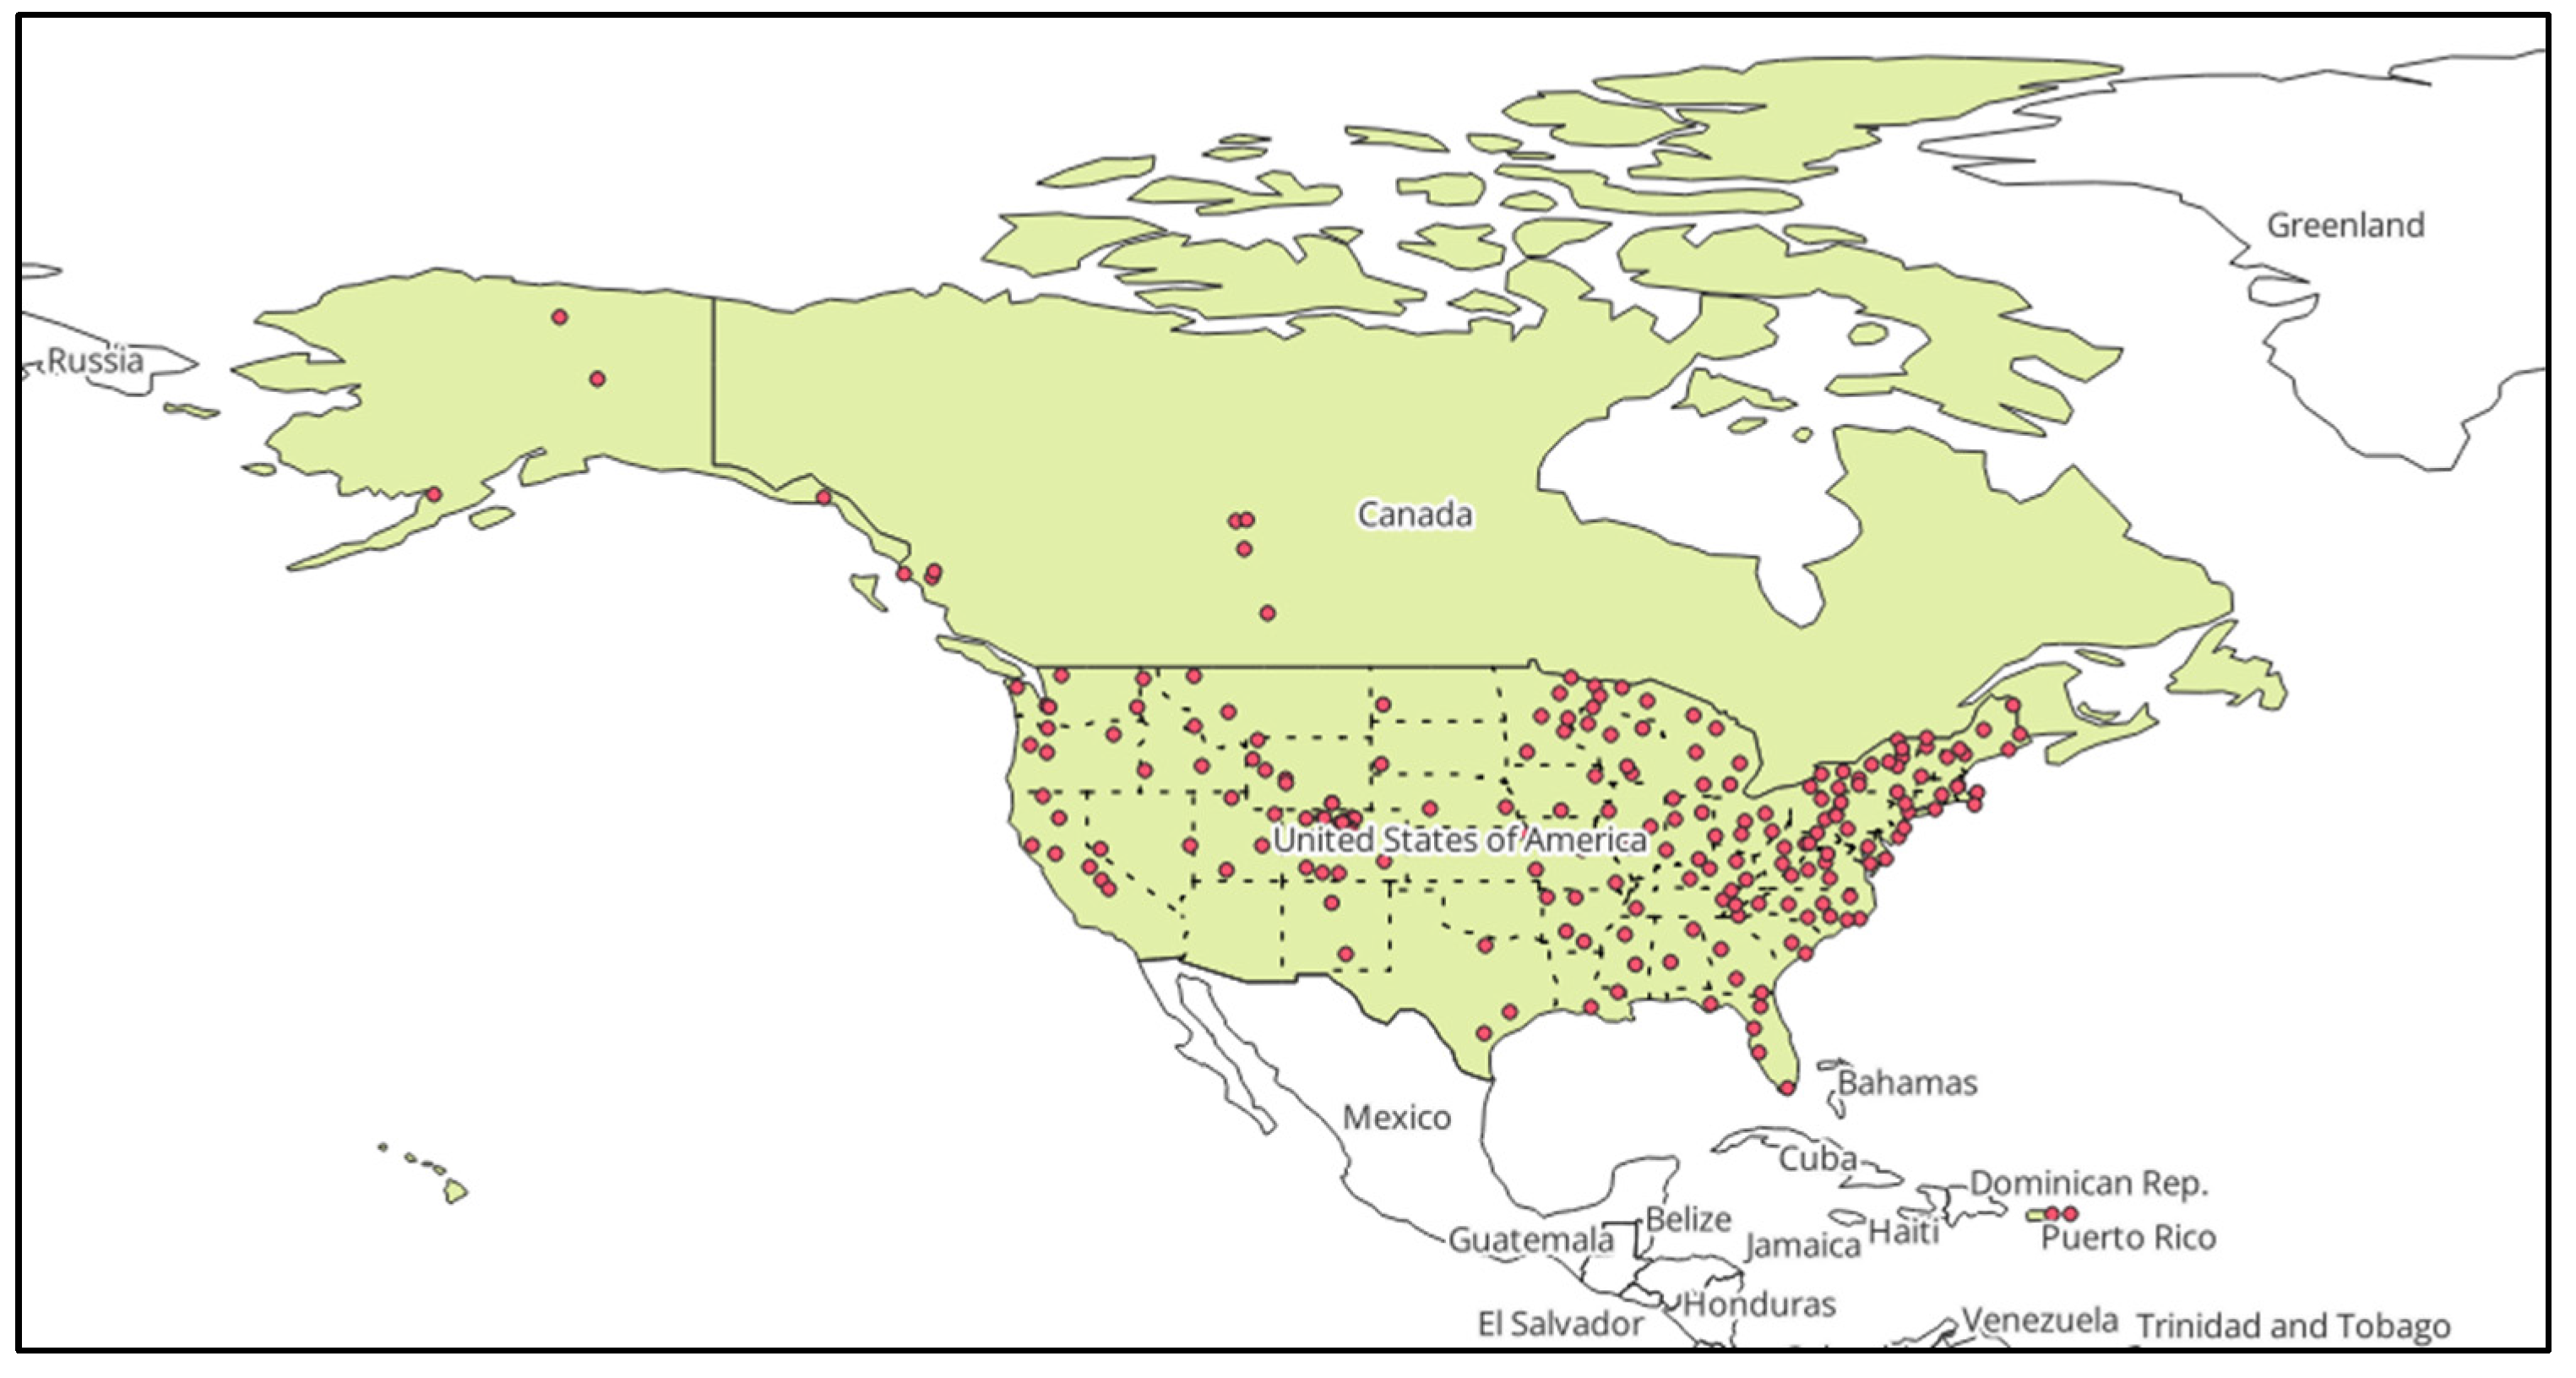
2.1.1. Sampling Sites

The wet- deposition samples used in this study were traditional samples collected by the National Trend Network (NTN), as used in Sricharoenvech et al. [28]. A total of 638 weekly NTN samples were collected at NADP sites in North America and provided by the NADP in this study. Due to our strict time limit and the study scope (November 2020), we selected only 478 samples containing precipitation from wet deposition events that occurred between 26 October and 1 December 2020. These samples were collected at 209 sites: 199 in the US, 8 in Canada, 1 in the US Virgin Islands, and 1 in Puerto Rico. Out of 209 sites, 8 and 15 sites were urban and suburban locations, respectively, while the others were classified as isolated, rural, or unspecified-type locations [28]. The locations of the sampling sites are demonstrated in Figure 1.

2.1.2. Wet Deposition Sample Collection Method and Shipment

The sample collection processes were previously described in detail in Sricharoenvech et al. [28]. To collect the precipitation samples, ACM Model 301 (Aerochem Metrics, Inc., Miami, FL, USA) and N-CON ADS automated wet-deposition samplers (N-CON Systems Co. Inc., Arnoldsville, GA, USA) were used with NADP 29 cm diameter high-density polyethylene (HDPE) plastic buckets and deployed at each site. Briefly, the bucket samples were collected by NADP personnel weekly, weighed, and transferred into 1 L Nalgene HDPE plastic wide-mouth bottles before shipment to the NADP at Wisconsin State Laboratory of Hygiene (WSLH), University of Wisconsin–Madison, Madison, WI, USA. Upon their arrival at NADP, regular samples were poured from the original bottles for routine chemical analyses. The remaining samples were kept in a refrigerator and then used for BC and WSOC measurements at the Water Science and Engineering Laboratory (WSEL), University of Wisconsin–Madison, Madison, WI, USA. All of the NADP’s standard operation procedures (SOPs) for sample collection and shipping are available on the NADP’s website (https://nadp.slh.wisc.edu/networks/national-trends-network/, assessed 1 October 2024).

2.1.3. NADP National Trend Network (NTN) Sampling Container Preparation

The sample buckets and bottles were precleaned at the Central Analytical Laboratory (CAL), WSLH, by following the NADP’s NTN SOPs for supply preparation (see https://nadp.slh.wisc.edu/quality-assurance/, assessed 1 October 2024). In brief, the buckets and bottles for sample collection were precleaned by scrubbing and rinsing with reverse osmosis water (RO, >18 MΩ), spraying with 3% hydrogen peroxide solution (10 min sit time), and cleaning in an industrial dishwasher. The dishwasher was supplied with RO and was run for four cycles (two cycles of a 4 min rinse cycle at room temperature and two cycles of a 6 min rinse cycle at 50 °C). For new buckets and lids, a step of overnight cleaning in 1% Citrajet® (Alconox Inc., White Plains, NY, USA) was added after scrubbing. Following the dishwasher step, the containers were rinsed again with RO, allowed to dry under a clean air bench (HEPA), and finally sealed in clean low-density polyethylene (LDPE) bags.

2.2. NADP Measurements

The measurements of acidity, conductivity, and water-soluble ions are included in the regular NADP/NTN routines, following the NADP’s SOPs. The parameters measured included free acidity (H+), conductivity, water-soluble cations (Na+, K+, NH4+, Mg2+, Ca2+), and water-soluble anions (Cl, NO3, SO42−, PO43−). The list of SOPs and quality assurance documentation used in this study are shown in Table S1. Their full descriptions can be found on the NADP website (https://nadp.slh.wisc.edu/quality-assurance/, accessed on 1 October 2024).
The measurements of conductivity and pH were conducted by using a Mettler Toledo Seven Excellence™ benchtop meter (Mettler-Toledo, LLC, Columbus, OH, USA) with a conductivity module and a pH module, respectively. The remainder of each sample was then filtered using vacuum filtration apparatus equipped with 47 mm 0.45 µm Supor® Membrane disk filters (for samples ≥ 28 mL) or using Acrodisc® Sterile Syringe Filters with a 0.45 µm Supor® Membrane (for samples between 4 and 27 mL) (Pall Corporation, Port Washington, NY, USA). The filtrates were kept in square 60 mL HDPE bottles until analyzed for (1) ammonium and orthophosphate using flow injection analysis (FIA); (2) Na+, K+, Mg2+, and Ca2+ using inductively coupled plasma–optical emission spectroscopy (ICP-OES); and (3) Cl, NO3, and SO42− using ion chromatography (IC).

2.3. Black Carbon (BC) and Water-Soluble Organic Carbon (WSOC) Analyses

2.3.1. Sample Preparation

The wet-deposition samples used in the BC and WSOC analyses were excess unfiltered samples from the NTN’s routine chemical analyses (Section 2.2). On each analysis day, the unfiltered and refrigerated samples were picked up from the WSLH and prepared for BC and WSOC measurements at the WSEL.
The samples were sonicated in their original 1 L Nalgene HDPE plastic bottles using an ultrasonic bath (Branson Ultrasonics Corporation, Brookfield, CT, USA) for 10 min. Any samples with visible bird droppings, dirt particles, animal matter, or plant matter were considered potentially compromised and rejected from the analyses of BC and WSOC.

2.3.2. Cleaning Procedures for Labware and Glass Microfiber Filters

All labware and glass microfiber filters were prepared in bulk before the sample preparation. Glass labware was washed with Citranox® (Alconox Inc., White Plains, NY, USA) solution in ultrapure Milli-Q water (Milli-Q water®, EMD Millipore Corporation, Burlington, MA, USA), rinsed multiple times with Milli-Q water, soaked in a 10% hydrochloric acid (HCl) bath overnight, rinsed again with Milli-Q water, air-dried overnight, wrapped in aluminum foil, and baked at 450 °C for 8 h in a furnace. Plastic equipment was washed with Citranox® solution, rinsed with Milli-Q water, soaked overnight in ultrapure water, and allowed to dry under large delicate-task fiber wipes (Kimwipes™, Kimberly-Clark Professional™) in a fume hood. Glass microfiber filters were prepared by wrapping the filters with aluminum foil and heating them in a furnace at 450 °C for 8 h. Due to limited laboratory supplies, the syringe and filter holder parts were disassembled and separately rinsed 3 times with ~500 mL of ultrapure water between samples.

2.3.3. Black Carbon (BC) Analysis

A single-particle intracavity-laser-induced incandescence technique was utilized with a Single-Particle Soot Photometer (SP2) (Droplet Measurement Technologies, Boulder, CO, USA) to measure the concentrations of BC in the wet-deposition samples. This technique measures the incandescent emission signal strength from individual incandescent particles absorbing energy from a 1064 nm neodymium-doped yttrium aluminum garnet (Nd:YAG) intracavity laser. Conversion from the signal strength to the mass of refractory BC (rBC) was performed using mass calibration standards because the incandescent signal strength is correlated with rBC mass [29].
A full description of the rBC analysis in this study, including the self-dispersing aqueous rBC standard preparation, instrument setup and calibrations, blanks, and calculations, can be found in Sricharoenvech et al. [28]. Briefly, the wet-deposition samples were aerosolized using a nebulizer. Particles were separated from the water via condensation in a 145 °C heated glass chamber with an inline cold zone (2 °C) and finally introduced to the SP2 instrument. Before the measurements, the instrument was calibrated using known-concentration rBC standards (ranging from 0.5 to 50 ppb) prepared from a self-dispersing fullerene soot primary standard. This primary standard was made by partially oxidizing as-produced fullerene soot (572497-5G, Sigma-Aldrich, Burlington, MA, USA) with nitric acid (HNO3) gas for at least 20 h.
Our previous study [28] observed high rBC recovery in sample collection buckets and bottles (≥84% and 95%, respectively) over a one-week period. This indicated that the BC wet-deposition samples were stable in their original bottles until analyzed.

2.3.4. Water-Soluble Organic Carbon (WSOC) Analysis

A total of 40 mL of each sonicated sample was filtered through a 25 mm glass microfiber filter (WHA1825025, GF/F grade, Whatman®, Sigma-Aldrich, Burlington, MA, USA) using a 50 mL glass syringe (Tomopal Inc., Sacramento, CA, USA) attached with a 25 mm stainless steel Luer lock filter holder (XX3002500, EMD Millipore Corporation, Burlington, MA, USA). Glass 40 mL vials were used to collect the filtrates and remained closed with lids and polytetrafluoroethylene (PTFE)/silicone septa until the analysis.
The WSOC concentrations in the wet deposition samples were measured using a total organic carbon (TOC) analyzer (Siever M9, GE Analytical Instruments, Boulder, CO, USA). The instrument was set up to measure each filtrate in quadruplicate using the total carbon (TC) and inorganic carbon (IC) methods. The WSOC concentrations were automatically calculated by the TOC analyzer by subtracting IC from TC. The first measurement of every filtrate was rejected from the calculations to prevent the inaccurate reading caused by carryover. During the analysis, 50 samples gave invalid results due to instrument errors, and were subsequently removed from the study.

2.4. Quality Assurance and Quality Control (QA/QC)

2.4.1. NTN Supply Quality Control (QC)

The NTN supplies used in this study were supplies that passed the QC check by NADP staff at CAL. Supplies from new lots were randomly selected from each lot to check for contamination. Additionally, some supplies were tested on a regular basis (weekly or monthly) to ensure that the cleaning processes were satisfactory, the supplies remained clean, and the introduction of new supply lots did not introduce contamination to the existing supplies.

2.4.2. Analysis of rBC

Approximately 10% of the total number of samples on each analysis day were randomly selected for the measurements as duplicates. At the beginning and the end of each daily analytical sequence, a set of rBC standards with known concentrations (0.5 to 50 ppb) was run and compared. A blank check and a 1 ppb standard were also performed every 11 measurements (10 samples + 1 duplicate). Regarding contamination from sampling methods, the results from the rBC leaching experiments in our previous study confirmed that no significant BC contamination occurred during the sample collection and storage [28].

2.4.3. Analysis of WSOC

Approximately 10% of the total number of samples on each analysis day were randomly selected for the measurements as duplicates. At the beginning of each analytical sequence, two blank checks were performed to ensure no contamination from carryover from the previous sequence. A blank check was performed every 11 measurements (10 samples + 1 duplicate). The first measurement of every analyte was rejected from the calculations to prevent the inaccurate reading caused by carryovers.

2.5. Statistical Analysis

An NTN dataset containing information on weekly precipitation amount, free acidity (H+), conductivity, and water-soluble ions (Na+, K+, NH4+, Mg2+, Ca2+, Cl, NO3, SO42−, PO43−) was curated and provided by the NADP (see https://nadp.slh.wisc.edu/networks/national-trends-network/, accessed 1 October 2024). The NTN dataset was then combined with the chemical analysis results of rBC and WSOC to generate the main dataset used in this study (See Supplemental Information B).
A Shapiro–Wilk test was performed to investigate the normality of each parameter. The relationships between rBC, acidity, conductivity, water-soluble cations (Na+, K+, NH4+, Mg2+, Ca2+), water-soluble anions (Cl, NO3, SO42−, PO43−), and WSOC were investigated using Spearman’s rank coefficients. Both the Shapiro–Wilk test and Spearman’s rank coefficient computation were performed using R (version 4.2.2).
The association of rBC with potential sources was investigated using factor analysis (FA). Previously, we hypothesized that precipitation BC might have originated from wildfire emissions [28]. Therefore, in this study, we conducted FA with a varimax rotation and a loading threshold of 0.8 or above as a confirmatory analysis using the “psych” package (version 2.5.5) in R. The varimax rotation is an orthogonal adjustment of the factors designed to maximize the variance shared among items and separate these from other factors, resulting in a simple, easy-to-interpret structure with minimal cross-loadings. Meanwhile, the loading threshold of 0.8 or above means retaining only strongly related factors. The dataset used in the FA contained the concentrations of rBC, Na+, K+, NH4+, Mg2+, Ca2+, Cl, NO3, SO42−, PO43−, and WSOC. In this study, we only considered factors that collectively accounted for 90% of the variation. These factors were then used to identify the potential sources of BC in wet deposition.

3. Results and Discussion

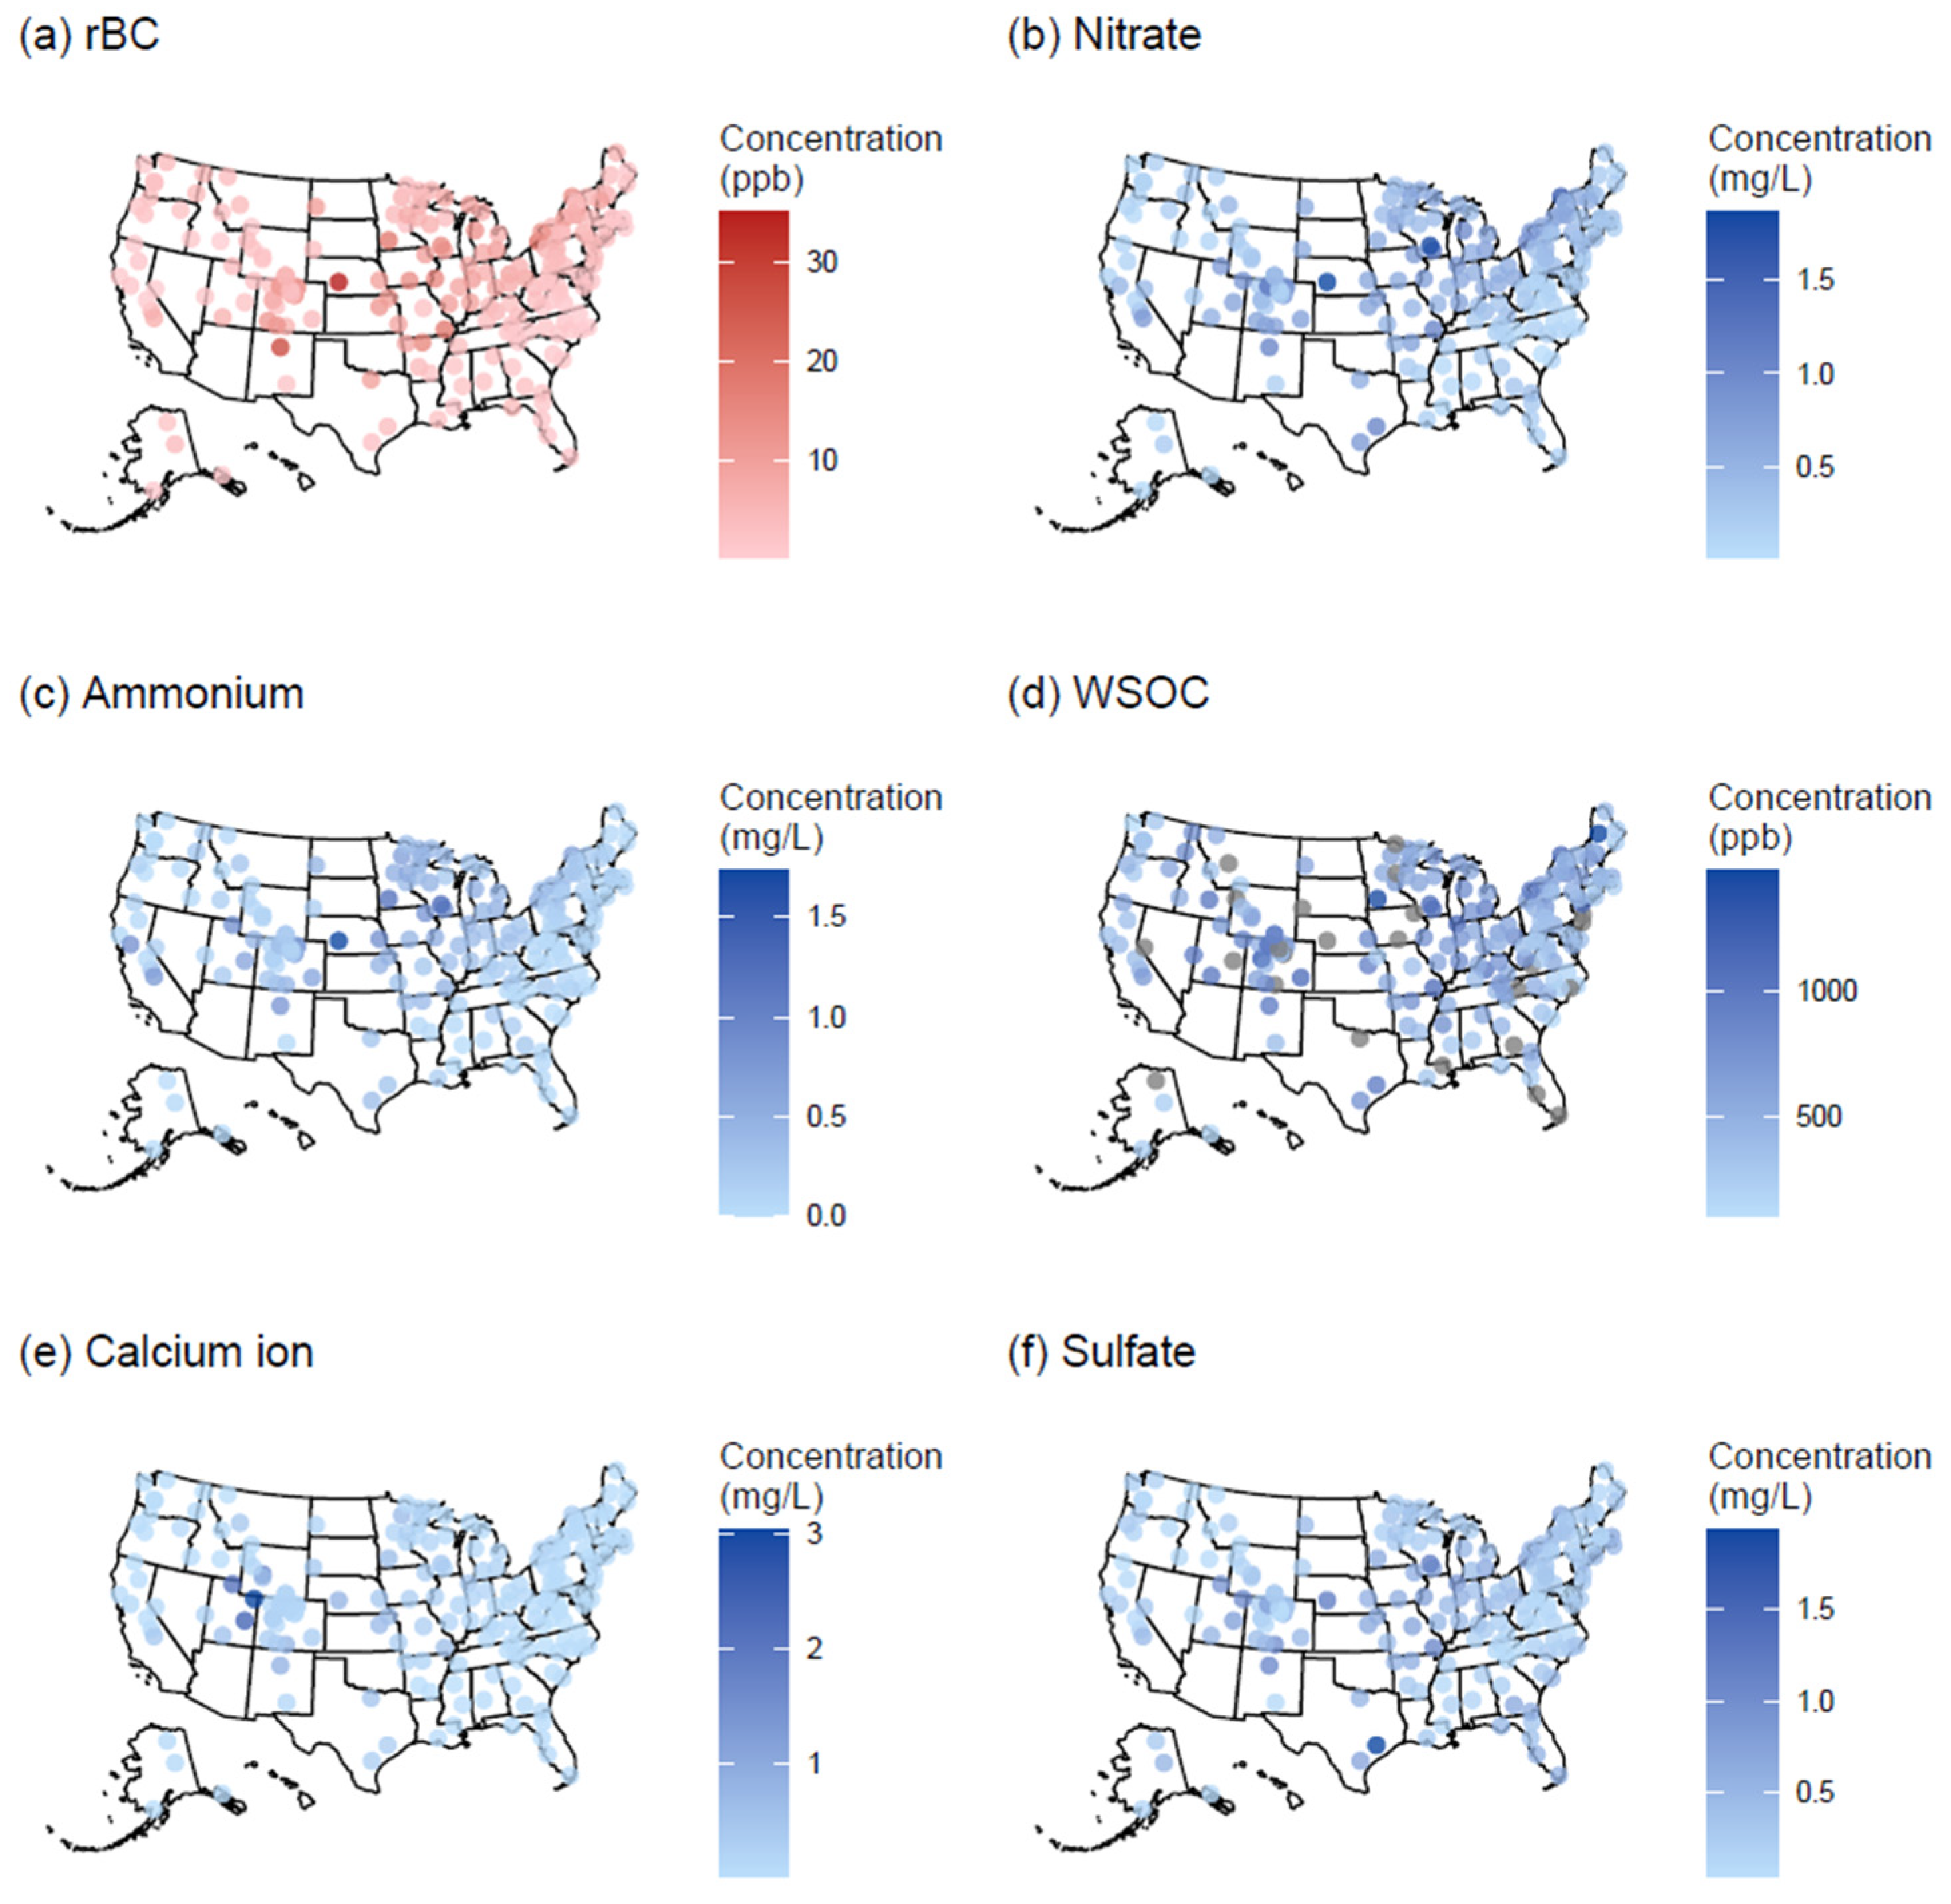
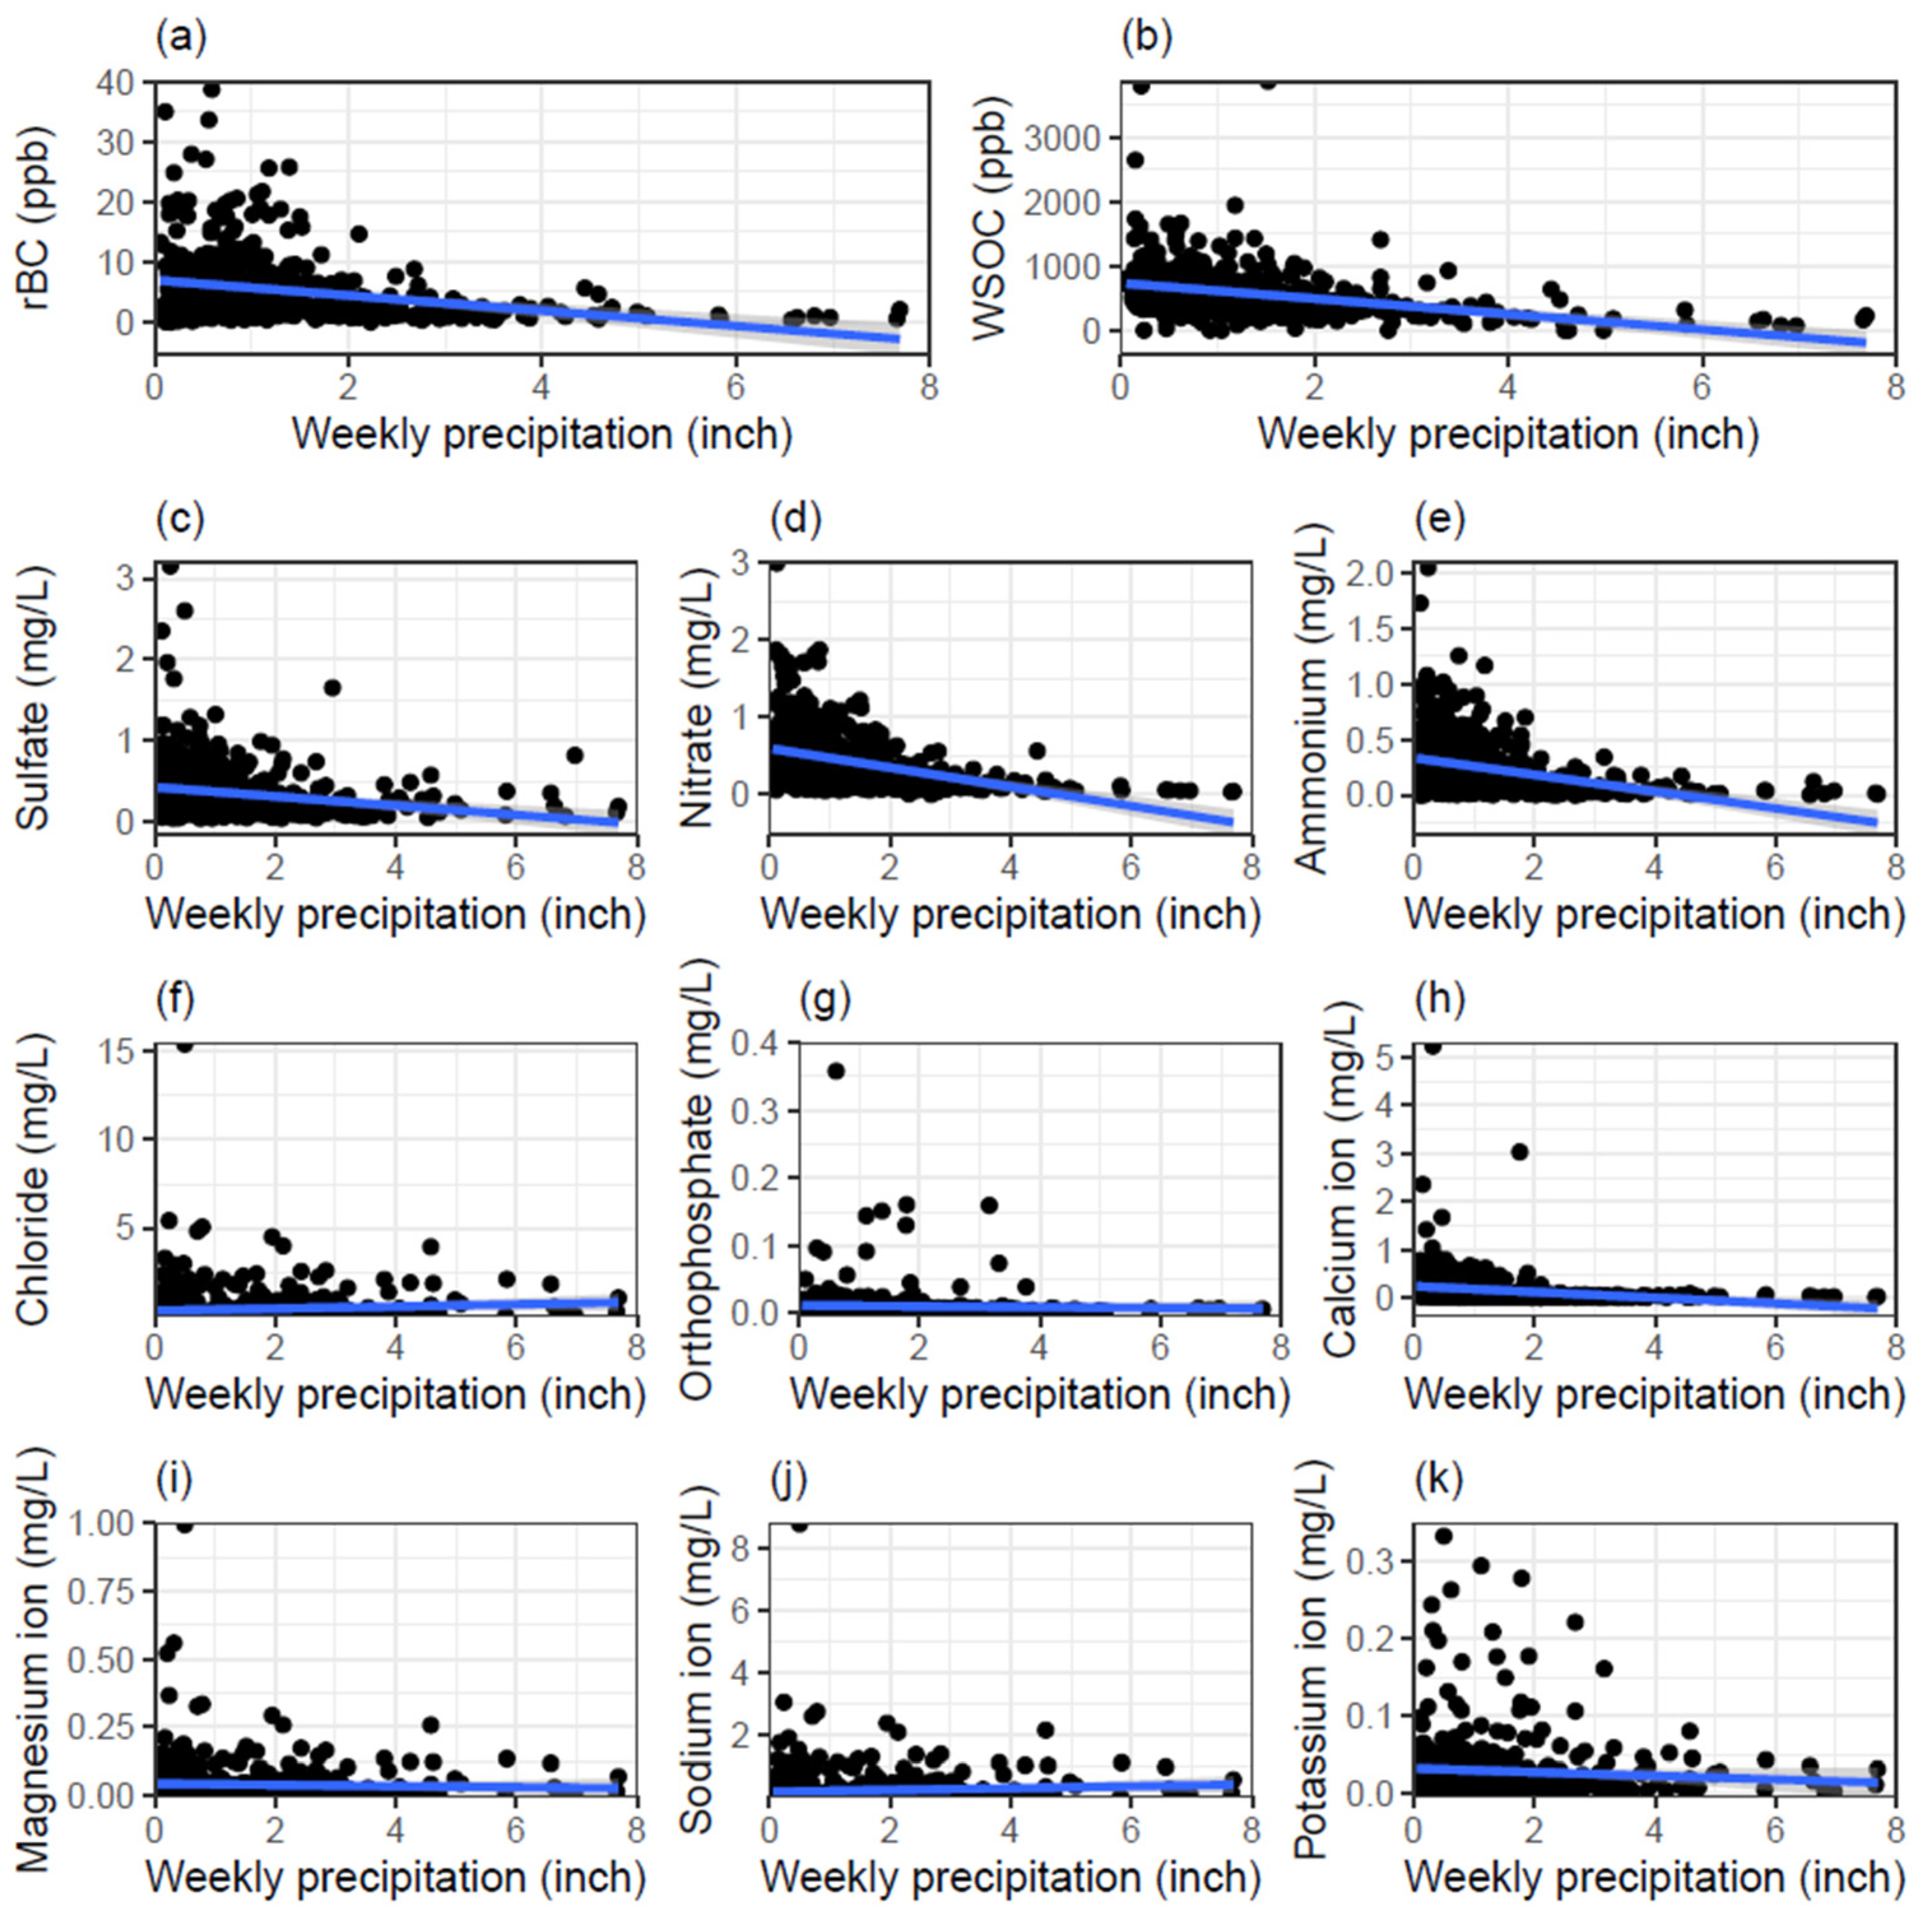
3.1. Results of NADP Measurements

A total of 478 weekly wet deposition samples from precipitation events between 26 October and 1 December 2020 were collected at 209 NADP NTN sites and measured for rBC, WSOC, and water-soluble ions. Out of the 478 samples, 29 samples did not have WSOC information, as instrumental errors occurred during the analysis. A statistical summary of the measurements can be found in Table 1.
Figure 2 shows the concentrations of rBC, NO3, NH4+, WSOC, Ca2+, and SO42− at NTN sites in the contiguous US and Alaska between 26 October and 1 December 2020. These constituents were selected for mapping because they showed important correlations with rBC (see Section 3.2). As seen in the maps, the spatial pattern of monthly rBC concentrations in the contiguous US and Alaska are similar to those patterns of NO3, NH4+, WSOC, Ca2+, and SO42−. Meanwhile, the spatial pattern of rBC concentrations was slightly different from some other water-soluble ions (e.g., PO43− and Cl, as shown in Supplemental Information A, Figure S1). These results could indicate that rBC in the wet deposition may share the same origins as NO3, NH4+, WSOC, SO42−, and Ca2+.

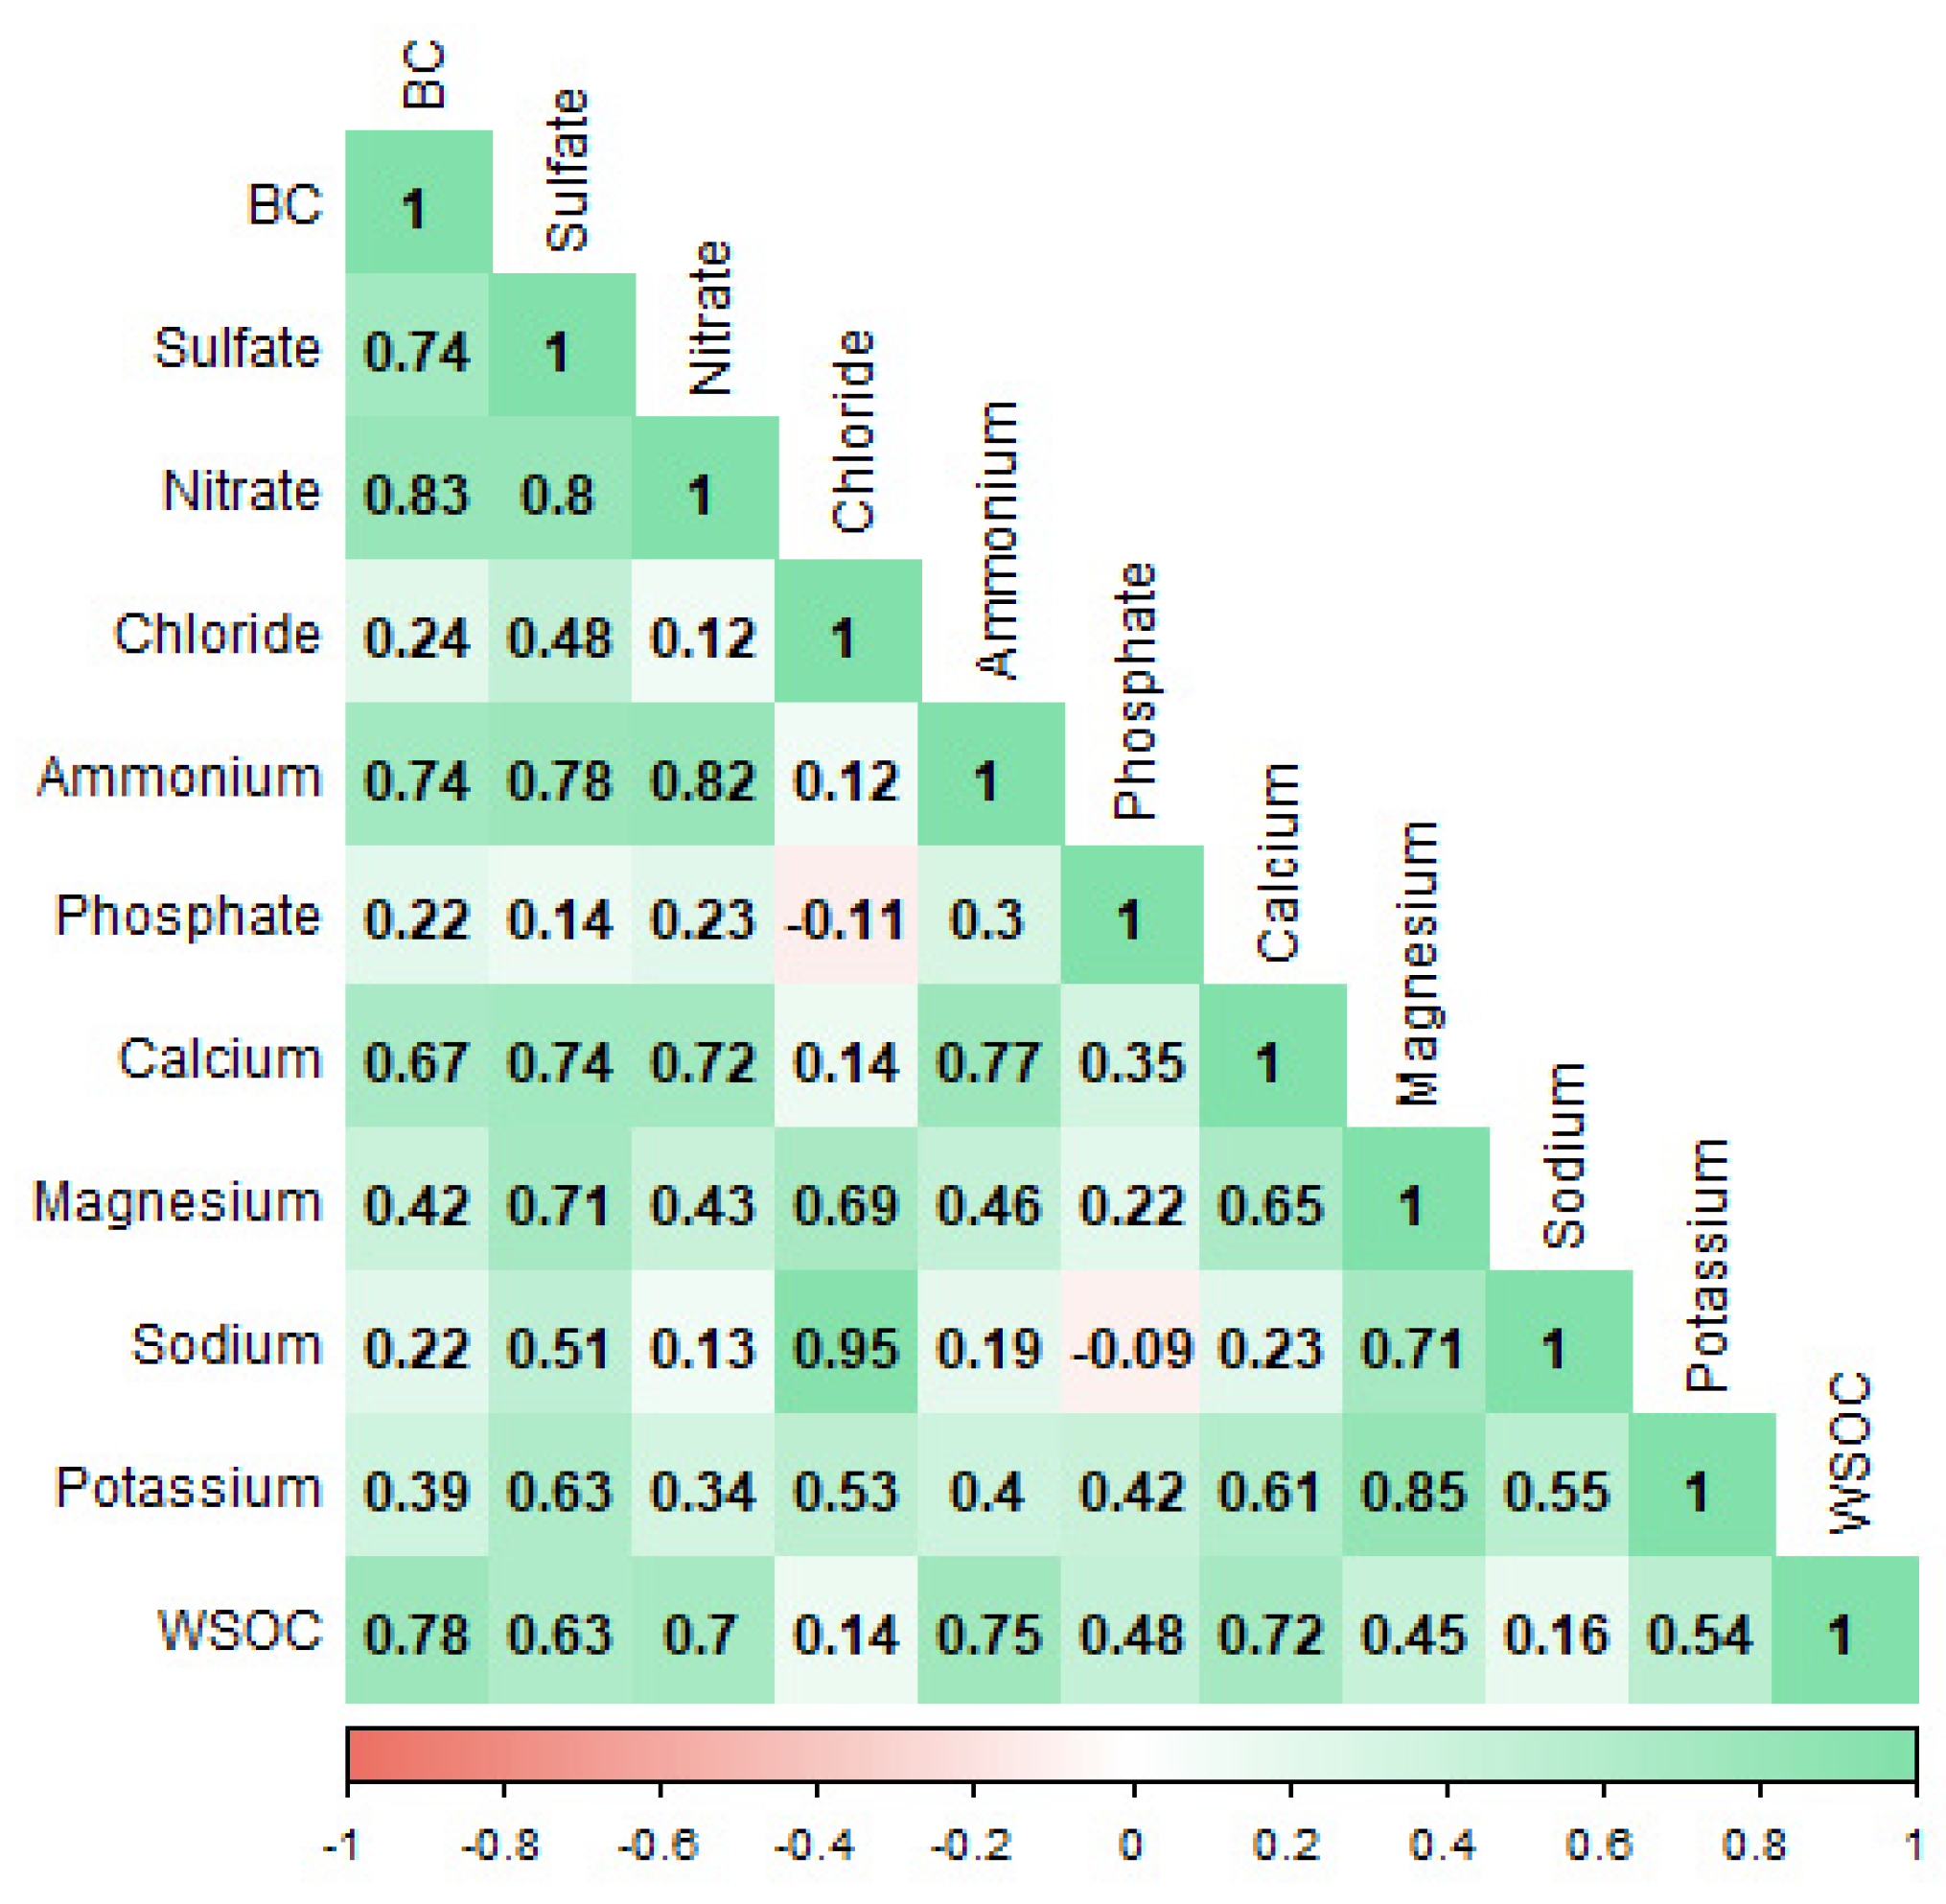
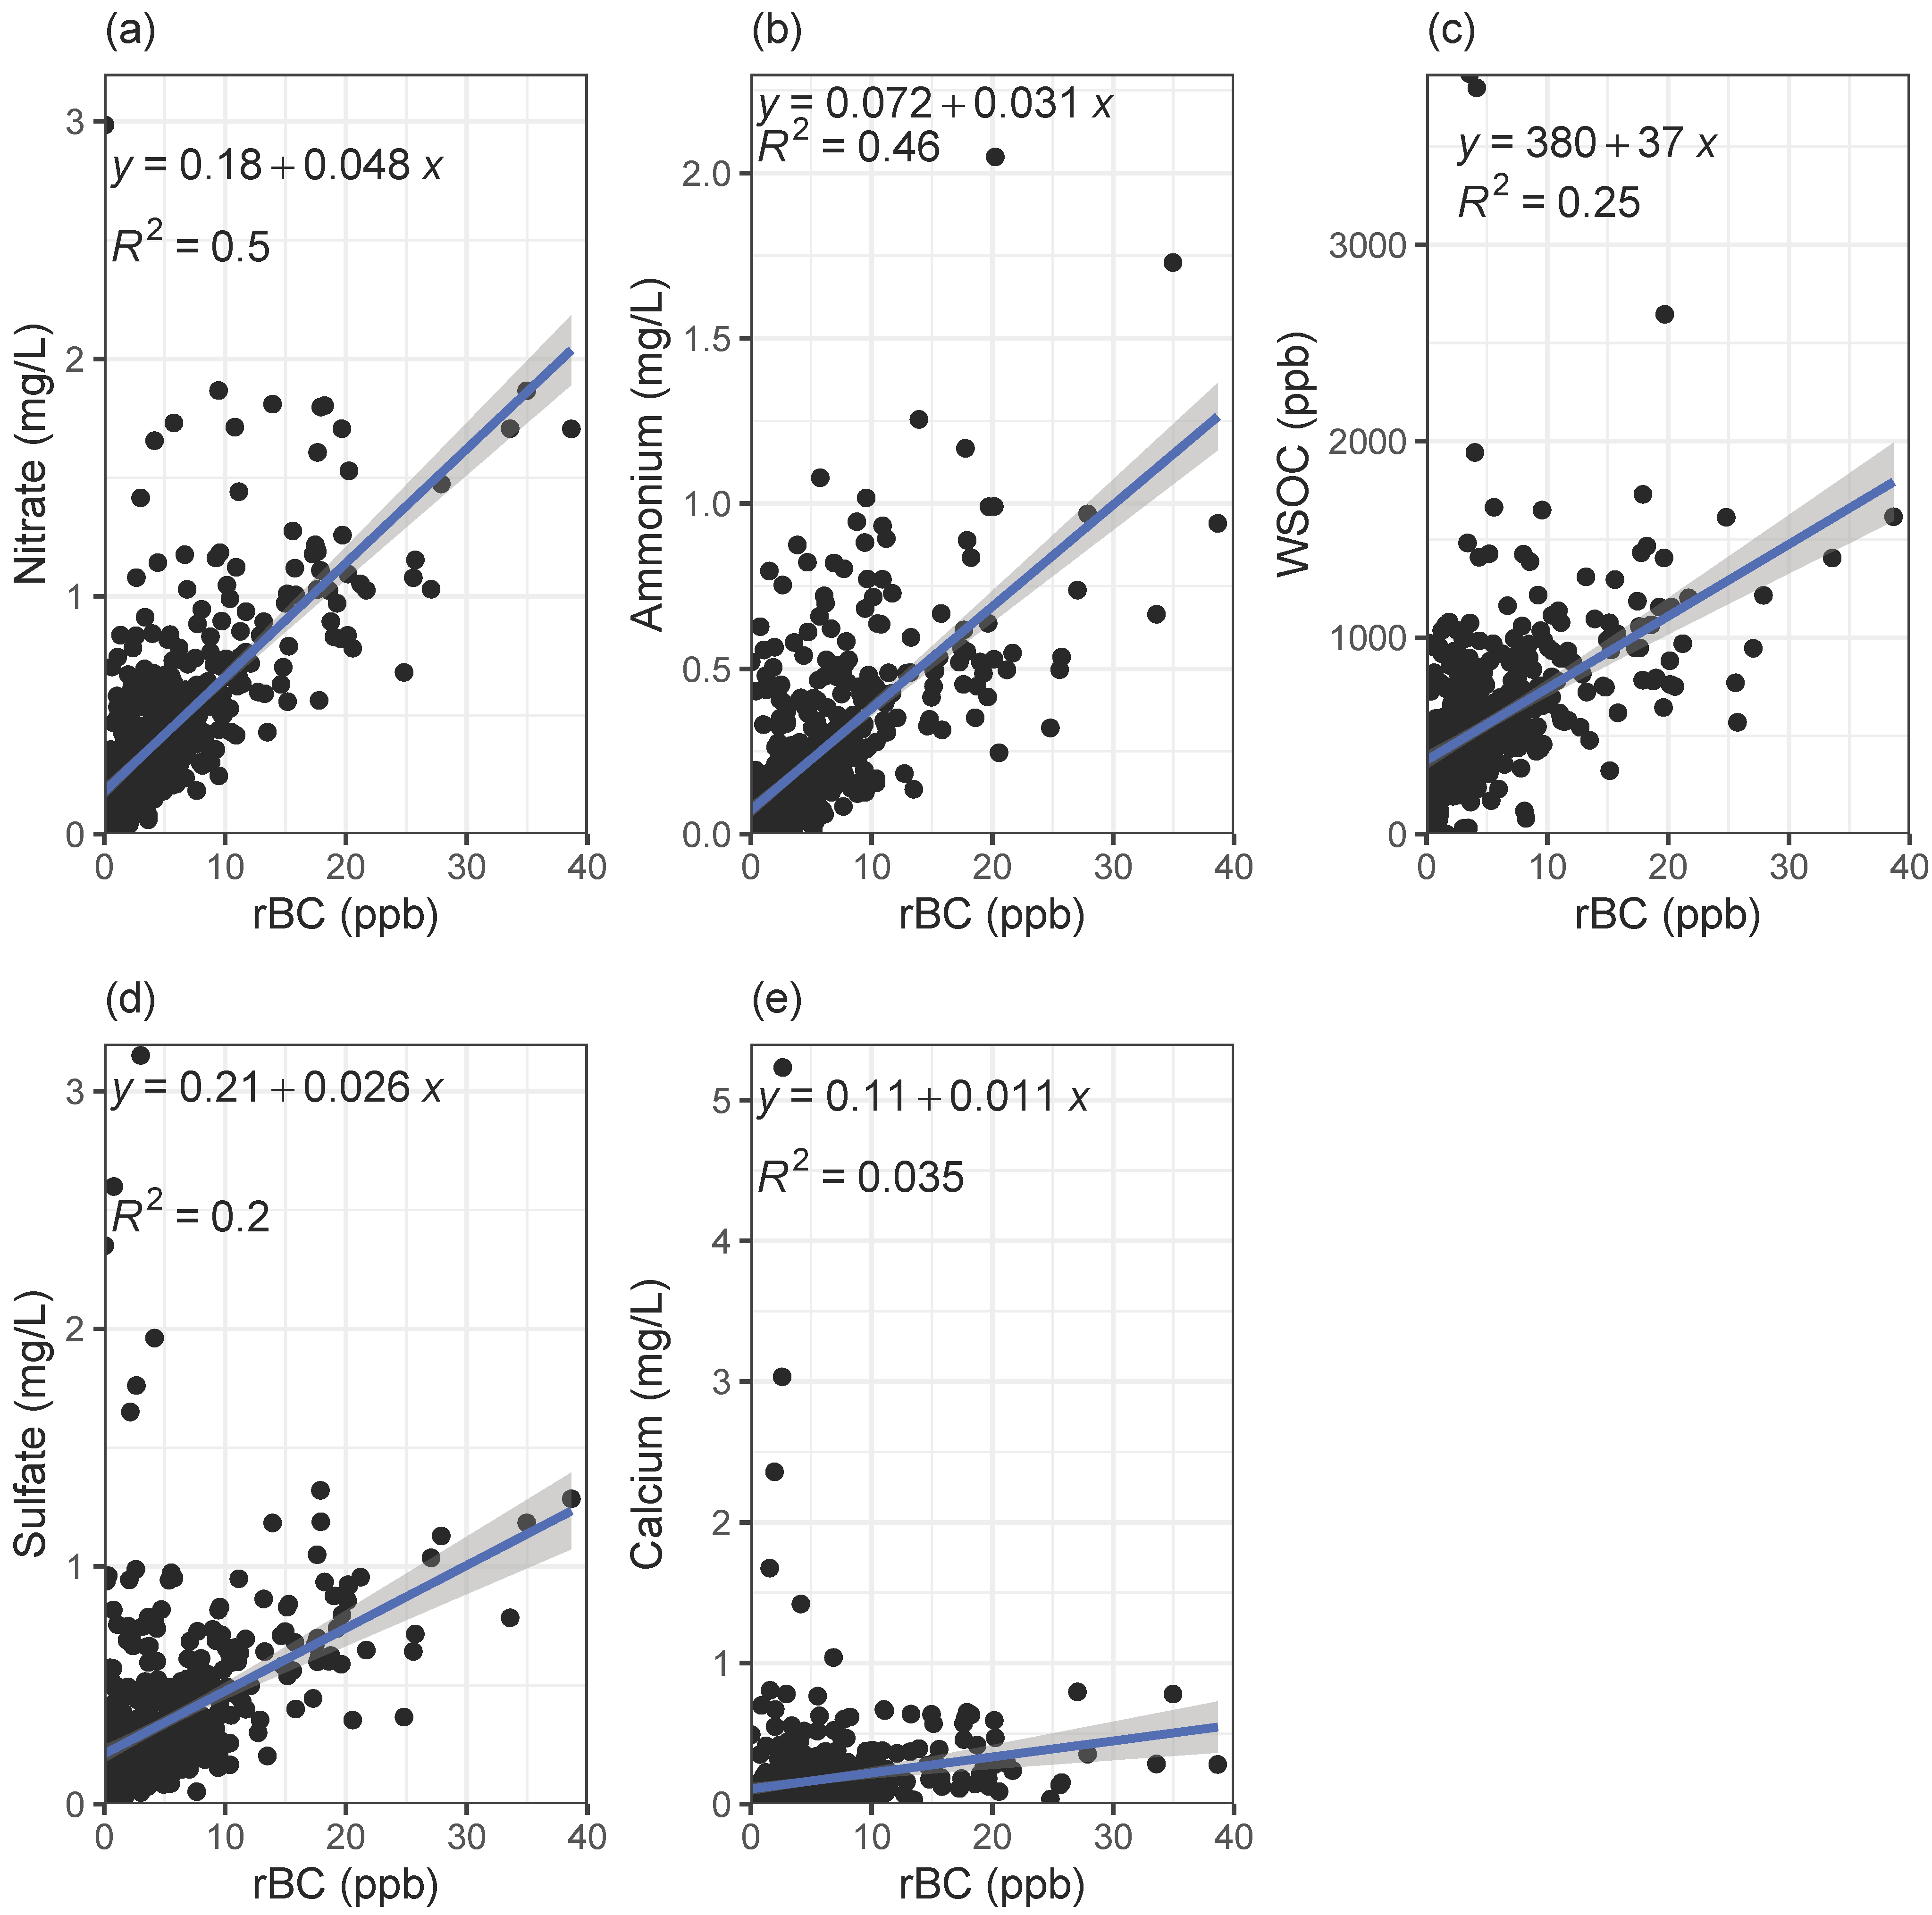
3.2. Correlations with Water-Soluble Ions and WSOC

A Shapiro–Wilk test was performed to investigate the normality in rBC, acidity (H+), conductivity, water-soluble ions (Na+, K+, NH4+, Mg2+, Ca2+, Cl, NO3, SO42−, PO43−), and WSOC data. A p-value smaller than 0.05 indicates that a variable is not normally distributed. For all parameters, no normality existed (p-value < 1.6 × 10⁻⁹ for acidity and p-value < 2.2 × 10⁻¹⁶ for others). Under the assumption that rBC does not have linear relationships with water-soluble ions (Na+, K+, NH4+, Mg2+, Ca2+, Cl, NO3, SO42−, PO43−) and WSOC, Spearman’s rank correlation coefficients (ρ) were used to determine the strength and direction of the association between these parameters.
Prior to the investigation of the relationships of rBC with water-soluble ions and WSOC, the precipitation data were plotted against the concentrations of Na+, K+, NH4+, Mg2+, Ca2+, Cl, NO3, SO42−, PO43−, and WSOC to examine the effect of dilution in all samples. Figure 3 shows that the concentrations of most constituents decreased as the sites received more precipitation. The results here indicate that the correlations between rBC and NTN concentrations may be affected by different precipitation amounts received between sampling sites. Therefore, only samples with moderate (40–60th percentile) rainfall (n = 95) were used for the correlation analysis to eliminate potential bias.
The correlations between rBC, WSOC, and water-soluble ions are shown in Figure 4 (and Table S2). Upon performing a concentration-based correlation analysis, the strongest correlation to BC was found with nitrate, followed by WSOC, sulfate, ammonium, and Ca2+ (ρ = 0.83, 0.78, 0.74, 0.74, and 0.67, respectively). In addition, we also performed a concentration-based correlation analysis using all samples (n = 478) and a flux-based correlation analysis, where we received similar results (see Tables S3–S5). Considering that 5740 fires had burned approximately 1 million acres in November 2020 [30], we anticipated that these strong correlations between rBC and nitrate, WSOC, sulfate, ammonium, and Ca2+ could be associated with wildfire emissions in the US during that time.
Nitrate and ammonium aerosols are secondary aerosols emitted from fossil fuel and biomass combustion. Nitrate aerosol is primarily generated through the oxidation of its precursors: NOx (NO, NO2). NOx precursors are released from natural (e.g., wildfires and lightning) and anthropogenic activities (high-temperature combustion of fossil fuel and biomass) and transformed into nitrate via NOx photochemical cycling and post-NO2 oxidation reactions [31,32]. Meanwhile, ammonium aerosols are inorganic products of the transformation of ammonia (NH3) emitted from the partial combustion of N-containing compounds (e.g., fossil fuels, biomass) and agricultural practices [33,34]. In addition, the transformation of NOx under urban conditions could also result in the formation of ammonium nitrate (NH4NO3) [31,35]. Once converted to nitrate and ammonium aerosols, they may be removed from the troposphere through either rainout (by acting as CCN) or washout (through dissolution, collision, and coalescence) [20,36]. These aerosols may also partake in the aging processes of BC aerosols by partially coating or internally mixing with the BC aerosols, promoting favorable conditions for BC to be removed via wet deposition [37]. As massive wildfire outbreaks occurred in many US states during November 2020 [30], the strong correlations between BC and nitrate (ρ = 0.83) or ammonium (ρ = 0.74) could be associated with forest fires. Therefore, these strong correlations with rBC could indicate that rBC in the wet deposition samples was most likely to be generated by the wildfires, long-range transported through other regions where these particles “aged”, and were most likely to be removed by wet deposition.
Water-soluble organic carbon (WSOC) demonstrated a strong correlation with rBC (ρ = 0.78). WSOC is an aerosol with various origins that have multiple impacts on the solar radiation budget and climate [38]. Similarly to BC, WSOC aerosol is considered a primary aerosol released through the combustion of fossil fuels and biomass burning [39]. Yet, WSOC is also considered a secondary aerosol as a result of atmospheric chemical reactions (e.g., oxidation and photochemical reactions) between oxidants (e.g., O3 and OH radicals) and biogenic or biomass-burning volatile organic aerosols (VOCs) during the long-range transport process [39,40,41]. In addition, the removal pathways of WSOC are similar to those of rBC in that WSOC may act as CCN in rainout, and dissolve into rain droplets by washout or dry deposition with particulate-bound pollutants [38]. Wet removal could be responsible for up to 80% of water-soluble carbon flux globally [42]. This strong correlation observed with rBC implies that both rBC and WSOC are most likely to be associated with the same origins—wildfire outbreaks in the US in November 2020.
Likewise, a strong correlation between rBC and sulfate (ρ = 0.74) and Ca2+ (ρ = 0.67) may indicate some associations with wildfire outbreaks in the western US in November 2020. A study on wildfire smoke by Popovicheva et al. [43] reported that sulfate in gypsum (CaSO4) was one of the main attributions in suburban forest fire smoke in Moscow, Russia. The same study also revealed that fly ash from long-lasting ground fires that combusted biomass and soil could supply Ca to the atmosphere through Ca-rich fly ash, which may have originated from lime (CaO), limestone (CaCO3), and Ca-dominated aluminosilicates. Likewise, a study of wildfire’s chemical composition in the San Francisco Bay Area, CA, USA, by Sparks and Wagner [44] remarked on the presence of gypsum in forest fires. This study, too, provides links between rBC and both Ca2+ and SO42− that may be associated with wildfire emissions.
Though the correlations between rBC and ammonium or sulfate were strong, they were unexpectedly weaker than anticipated. The reason could be explained by the multiple sources of ammonium and sulfate aerosols in various settings. As repeatedly mentioned above, these nitrate, ammonium, and sulfate aerosols are common pollutants in the environment, especially in urban environments, that play significant parts in the aging process of BC particles. Other than forest fires, the precursors of nitrate and ammonium (NOx and NH3) are emitted from several sources (e.g., fossil fuel combustion, biomass burning, firewood burning, meat cooking, nitrification/denitrification in soils, lightning, and N2O oxidation in the stratosphere) [31]. Sulfate aerosols can also be generated through the oxidation of its precursor, SO2, which also has multiple origins (e.g., fossil fuel combustion, volcanic eruption, and smelting industries) [45,46]. The transformation processes of these aerosols require oxidants (e.g., O3, H2O2, OH radicals, and organic radicals) that are abundant in urban environments. Once these precursors are transformed into nitrate, ammonium, or sulfate aerosols, they can incorporate into rainout, washout, or the BC particle aging processes. Since BC in the wet deposition collected between 26 October and 1 December 2020 was speculated to primarily originated from wildfires in the US, wet scavenging might have removed some nitrate, ammonium, and sulfate aerosols that were not associated with the wildfires but most likely associated with urban emission and secondary aerosol formations in urban environments. Hence, we observed weaker correlations between BC and these secondary aerosols than we anticipated.
Overall, the strong correlations between BC and nitrate, ammonium, WSOC, sulfate, and Ca2+ were believed to be mainly associated with wildfires in multiple states in the US in November 2020. Wildfire smoke studies by Jalava et al. [47] and Popovicheva et al. [42] support our findings, as they found that nitrate, ammonium, and sulfate were the main attributes of wildfire smoke. However, we also observed unexpected correlations between BC and Ca2+ or K+.
In the case of Ca2+, we initially hypothesized a strong correlation with rBC, due to its multiple non-wildfire origins (e.g., mineral aerosol emission, sea salt, soil erosion, and industrial emissions) [48]. Ca-rich fly ash and particles from biomass burning tend to exist in the coarse mode (i.e., with an aerodynamic diameter between 2.5 and 10 μm) [44], making them unlikely to undergo long-range transport with rBC. Moreover, it is important to note that the method used for the determination of Ca2+ requires filtered precipitation samples, while the rBC analysis was conducted using unfiltered samples. As larger particles, Ca-rich fly ash in wet deposition might have been removed from the samples, resulting in lower Ca concentrations detected. Regardless of the limitations of the analysis methods used in this study, the results suggested that just local/regional wildfire emissions could influence the strong correlation with BC over a large area of coverage. This finding may also indicate the significance of wildfires on the ambient air quality, especially the local air quality, influenced by updrafts in convective storms.
Potassium (K+), on the other hand, unexpectedly demonstrated a moderate correlation with rBC (ρ = 0.38). K+ is commonly thought of as an inorganic tracer for particulate aerosols emitted from biomass burning [49,50]. Anticipating that rBC in wet deposition originated from wildfires (i.e., open biomass burning), we postulated that we would see a much stronger correlation between rBC and K+. A reason behind the weaker correlation could be because K existed in a different particle size mode from rBC. Like Ca-rich fly ash, K-rich biomass ash also usually exists in coarse mode particles, making them less likely to be transported over a long range from their wildfire sources [44]. Since the wet deposition samples were collected from several sites further away from the sources, K-rich aerosols could have settled before their interactions in rainout, washout, or the aging processes of rBC. Additionally, larger particles of K-rich biomass ash might have been removed during the sample preparation for water-soluble ion analysis using ICP-OES. Another reason could be the sources of K+ in wet deposition. K+ is known to have several natural and anthropogenic sources (e.g., sea salts, wood smoke, coal combustion, meat cooking, fertilizers) [49]. Since BC aerosols are believed to undergo long-range transport from wildfires, BC aerosols might have interacted with non-biomass-burning K+ aerosols in their aging processes. Consequently, with all the possible reasons above, we observed a weaker correlation between K+ and wildfire-originating BC in the wet deposition samples during the study period.

3.3. Source Identification of BC in Wet Deposition

Factor analysis (FA) was used to identify the potential sources of BC in North American wet deposition using 478 NADP NTN weekly samples collected between 26 October and 1 December 2020. Table 2 and Table S3 show that determining species in North American wet deposition samples might originate from five factors. These five sources accounted for approximately 91% of the total variance. Factor 1 is heavily loaded with BC, NO3, NH4+, SO42−, and WSOC, indicating the mixture of two origins: secondary aerosols and the incomplete combustion of biomass. Meanwhile, other factors explain different sources: Factor 2 represents sea spray, Factors 3 and 4 represent resuspended mineral/crustal dust, and Factor 5 represents biomass burning.
The FA results might give us information on the potential sources of rBC in wet deposition. However, other resources, such as smoke data and precipitation data, must be simultaneously utilized in order to better specify which sources rBC primarily originated from. Considering that our study period was during North America’s 2020 unusually dry season, we expected that these aerosol constituents stemmed from wildfire incidents where incomplete biomass combustion with a moderate burning temperature occurred. A study by Sillanpää et al. [51] on the chemical composition of wildfire smoke transported over a long distance in Helsinki, Finland, reported that the main components of PM2.5 in wildfire smoke were SO42−, NH4+, BC, and NO3. A study on wildfire smoke plumes in the same location by Saarinio et al. [52] also indicated that the concentrations of these water-soluble ions significantly increased during the plume episodes, especially in the ultrafine fraction of smoke particulates. However, these NO3, NH4+, SO42−, and WSOC aerosols could also be generated through other non-wildfire-related sources, such as automobile and coal combustion [53]. At this point, the FA results revealed no further information than that rBC was correlated at some levels with secondary aerosols that could originate from the incomplete combustion of biomass (Figure 5a–e). Therefore, concluding the sources of rBC in wet deposition based on the FA results alone is unwise.
Hazard Mapping System (HMS) fire and smoke data (https://www.ospo.noaa.gov/Products/land/hms.html#data, accessed 1 October 2024) (Figure 6) were then utilized and compared with the rBC hotspots, November 2020’s total precipitation, and the wet deposition pattern in North America [28] to confirm our suspicions. The HMS smoke map was rendered using smoke data between 25 October and 1 December 2020. Brown colors indicate areas affected and levels of smoke density; deeper colors represent denser smoke plumes. The HMS smoke map indicated that several parts of the US were impacted by fire smoke.
The current results provide strong evidence that biomass burning associated with wildfires can lead to high BC in wet deposition during precipitation events with meteorology that co-locates smoke plumes and precipitation. However, for cases with low precipitation rates, other sources of BC can lead to high rBC during low-precipitation events. Based on the rBC concentrations and the total precipitation data from our previous study [28], high rBC precipitation concentrations at hotspots in Nebraska and New Mexico seemed to be associated with low precipitation in November 2020 [28] and are likely not associated with wildfire emissions. In contrast, measurements of rBC in California were found to have lower concentrations even though there were wildfire emissions in this state during the study period. We attribute this observation to the limited intersection of the forest fires and precipitation that lead to lower rBC precipitation concentrations and rBC wet deposition [28]. Nonetheless, wildfire emissions seemed to be responsible in the majority of the high rBC precipitation concentrations and wet deposition observed in the central US. Central USA was impacted by smoke and had relatively higher rainfall than other regions, resulting in both high rBC concentrations in precipitation and rBC wet deposition.
Overall, our attempt to identify sources of rBC in wet deposition, coupled with the comparisons between smoke data and rBC concentrations, and wet deposition from our previous study [28], seemed to support wildfires being one of the primary sources of rBC in wet deposition. The results revealed that wildfire emissions in the US in November 2020 could be one of the important sources of rBC in wet deposition in the US, especially in the central US, where the region experienced fire smoke while receiving a high amount of precipitation. Additionally, secondary aerosol formation could be one of the major influences in promoting the hydrophilicity of rBC, which resulted in more rBC removed through precipitation, especially in regions with lower precipitation.

4. Conclusions

Black carbon (BC) aerosols are particulates concerning the Earth’s solar radiation energy imbalance and climate change. These aerosols can be removed primarily through the wet deposition process. In our previous study, we investigated rBC wet deposition in North America between 26 October and 1 December 2020, and obtained information indicating high rBC deposition in the central US that might have been associated with wildfire incidents in several states in the US. In this study, we used the same samples to investigate the correlations between rBC and other air pollution parameters, including acidity, conductivity, water-soluble cations (Na+, K+, NH4+, Mg2+, Ca2+), water-soluble anions (Cl, NO3, SO42−, PO43−), and water-soluble organic carbon (WSOC). We observed moderate-to-strong correlations between BC and nitrate, ammonium, WSOC, sulfate, and Ca2+ ions, which were likely to be associated with forest fires. Further utilization of FA and the HMS NOAA smoke maps suggested that wildfire incidents in November 2020 in North America could be a major contributor to high-BC wet deposition in the continents, along with secondary aerosol emissions, especially in the central US, which experienced fire smoke and received high rainfall. The work in our previous and current studies emphasizes the need for long-term and large-scale monitoring of rBC wet deposition to understand the sources and spatial/temporal information of rBC. The methods used in both studies serve as the starting point towards filling the missing gaps in the spatial information of rBC wet deposition, which may be beneficial for better understanding the environmental implications of rBC deposition.
While we gained more insights into BC dynamics, due to limitations in the sampling methods used, resources, and time constraints, much information remains to be explored. Future research could focus on improving spatial and temporal resolution by conducting regional or local long-term monitoring of precipitation BC and precipitation chemistry to collect hourly or daily data. Additionally, the limited number of sampling sites classified as urban/suburban prevented us from fully examining the effects of land use on precipitation BC. Future research focusing on factors influencing BC wet deposition (e.g., land use, population density, and climate) could be beneficial to fill in the missing gaps in BC dynamics and variability, which tend to be influenced by different BC sources and their activities.

Supplementary Materials

The following supporting information can be downloaded at: https://www.mdpi.com/article/10.3390/environments12020058/s1, Table S1. List of standard operational procedures (SOPs) and quality assurance documentation; Table S2. Concentration-based correlations between BC, WSOC, and NADP parameters in North American wet deposition in November 2020 using moderate rainfall samples (n = 95); Table S3. Concentration-based correlations between BC, WSOC, and NADP parameters in North American wet deposition in November 2020 using all precipitation samples (n = 478); Table S4. Flux-based correlations between BC, WSOC, and NADP parameters in North American wet deposition in November 2020 using moderate rainfall samples (n = 95); Table S5. Flux-based correlations between BC, WSOC, and NADP parameters in North American wet deposition in November 2020 using all precipitation samples (n = 478); Table S6. Summary of factor loadings from Factor Analysis with a varimax rotation; Table S7. List of samples included in the study; Table S8. Chemical analysis results of all samples included in the study; Figure S1. Concentrations of (a) rBC, (b) orthophosphate, and (c) chloride in wet deposition in contiguous US and Alaska in November 2020.

Author Contributions

Conceptualization, P.S., R.E., D.A.G. and J.S.; methodology, P.S. and R.E.; software, P.S., R.E. and M.Y.; validation, P.S., R.E., D.A.G. and J.S.; formal analysis, P.S. and R.E.; investigation, P.S., R.E. and M.Y.; resources, D.A.G. and J.S.; data curation, P.S. and R.E.; writing—original draft preparation, P.S.; writing—review and editing, P.S., R.E., D.A.G. and J.S.; visualization, P.S. and R.E.; supervision, J.S.; project administration, J.S.; funding acquisition, J.S. All authors have read and agreed to the published version of the manuscript.

Funding

P. Sricharoenvech was funded by the Royal Thai Government scholarship program.

Data Availability Statement

The original contributions presented in this study are included in the article/Supplementary Material. Further inquiries can be directed to the corresponding author.

Acknowledgments

We would like to thank the National Atmospheric Deposition Program (NADP) and Wisconsin State Laboratory of Hygiene (WSLH) personnel for providing the wet-deposition samples and precipitation data and conducting the chemical analysis. We would also like to show our appreciation to the following people for their laboratory instrument facilitation, technical support, laboratory work, and helpful advice: James Lazarcik, Michael Olson, and Steven Carpenter.

Conflicts of Interest

The authors declare no conflicts of interest.

References

  1. Bond, T.C.; Doherty, S.J.; Fahey, D.W.; Forster, P.M.; Berntsen, T.; DeAngelo, B.J.; Flanner, M.G.; Ghan, S.; Kärcher, B.; Koch, D.; et al. Bounding the Role of Black Carbon in the Climate System: A Scientific Assessment. J. Geophys. Res. Atmos. 2013, 118, 5380–5552. [Google Scholar] [CrossRef]
  2. Massling, A.; Nielsen, I.E.; Kristensen, D.; Christensen, J.H.; Sørensen, L.L.; Jensen, B.; Nguyen, Q.T.; Nøjgaard, J.K.; Glasius, M.; Skov, H. Atmospheric Black Carbon and Sulfate Concentrations in Northeast Greenland. Atmos. Chem. Phys. 2015, 15, 9681–9692. [Google Scholar] [CrossRef]
  3. Cui, M.; Zhang, W.; Fu, J.; Luo, X.; Hung, D.L.S.; Xu, M.; Li, X. Impact of Flash Boiling Spray on Soot Generation of a Rich Fuel–Air Mixture under Various Ambient Pressures. Combust. Flame 2024, 263, 113388. [Google Scholar] [CrossRef]
  4. Kong, Y.; Zhi, G.; Jin, W.; Zhang, Y.; Shen, Y.; Li, Z.; Sun, J.; Ren, Y. A Review of Quantification Methods for Light Absorption Enhancement of Black Carbon Aerosol. Sci. Total Environ. 2024, 924, 171539. [Google Scholar] [CrossRef] [PubMed]
  5. Hansen, J.; Nazarenko, L. Soot Climate Forcing via Snow and Ice Albedos. Proc. Natl. Acad. Sci. USA 2004, 101, 423–428. [Google Scholar] [CrossRef]
  6. Booth, B.; Bellouin, N. Black Carbon and Atmospheric Feedbacks. Nature 2015, 519, 167–168. [Google Scholar] [CrossRef]
  7. Ramanathan, V.; Chung, C.; Kim, D.; Bettge, T.; Buja, L.; Kiehl, J.T.; Washington, W.M.; Fu, Q.; Sikka, D.R.; Wild, M. Atmospheric Brown Clouds: Impacts on South Asian Climate and Hydrological Cycle. Proc. Natl. Acad. Sci. USA 2005, 102, 5326–5333. [Google Scholar] [CrossRef]
  8. Tiwari, S.; Dumka, U.C.; Hopke, P.K.; Tunved, P.; Srivastava, A.K.; Bisht, D.S.; Chakrabarty, R.K. Atmospheric Heating Due to Black Carbon Aerosol during the Summer Monsoon Period over Ballia: A Rural Environment over Indo-Gangetic Plain. Atmos. Res. 2016, 178–179, 393–400. [Google Scholar] [CrossRef]
  9. Wei, C.; Wang, M.H.; Fu, Q.Y.; Dai, C.; Huang, R.; Bao, Q. Temporal Characteristics and Potential Sources of Black Carbon in Megacity Shanghai, China. J. Geophys. Res. Atmos. 2020, 125, e2019JD031827. [Google Scholar] [CrossRef]
  10. Debnath, S.; Govardhan, G.; Jat, R.; Kalita, G.; Yadav, P.; Jena, C.; Kumar, R.; Ghude, S.D. Black Carbon Emissions and Its Impact on the Monsoon Rainfall Patterns over the Indian Subcontinent: Insights into Localized Warming Effects. Atmos. Environ. X 2024, 22, 100257. [Google Scholar] [CrossRef]
  11. Lee, Y.H.; Lamarque, J.-F.; Flanner, M.G.; Jiao, C.; Shindell, D.T.; Berntsen, T.; Bisiaux, M.M.; Cao, J.; Collins, W.J.; Curran, M.; et al. Evaluation of Preindustrial to Present-Day Black Carbon and Its Albedo Forcing from Atmospheric Chemistry and Climate Model Intercomparison Project (ACCMIP). Atmos. Chem. Phys. 2013, 13, 2607–2634. [Google Scholar] [CrossRef]
  12. Kumar, R.R.; Soni, V.K.; Jain, M.K. Evaluation of Spatial and Temporal Heterogeneity of Black Carbon Aerosol Mass Concentration over India Using Three Year Measurements from IMD BC Observation Network. Sci. Total Environ. 2020, 723, 138060. [Google Scholar] [CrossRef] [PubMed]
  13. Jacobson, M.Z. Short-Term Effects of Controlling Fossil-Fuel Soot, Biofuel Soot and Gases, and Methane on Climate, Arctic Ice, and Air Pollution Health. J. Geophys. Res. Atmos. 2010, 115, D14209. [Google Scholar] [CrossRef]
  14. Fierce, L.; Riemer, N.; Bond, T.C. Explaining Variance in Black Carbon’s Aging Timescale. Atmos. Chem. Phys. 2015, 15, 3173–3191. [Google Scholar] [CrossRef]
  15. Xu, J.; Zhang, J.; Liu, J.; Yi, K.; Xiang, S.; Hu, X.; Wang, Y.; Tao, S.; Ban-Weiss, G. Influence of Cloud Microphysical Processes on Black Carbon Wet Removal, Global Distributions, and Radiative Forcing. Atmos. Chem. Phys. 2019, 19, 1587–1603. [Google Scholar] [CrossRef]
  16. Zhang, J.; Yao, Y.; Xiao, C.; Gu, Y.; Jin, X.; Wang, P.; Zhao, L. The Pollution Characterization of Black Carbon Aerosols in the Southwest Suburb of Beijing from 2013 to 2019. Atmos. Pollut. Res. 2023, 14, 101669. [Google Scholar] [CrossRef]
  17. Zhang, Y.; Li, M.; Cheng, Y.; Geng, G.; Hong, C.; Li, H.; Li, X.; Tong, D.; Wu, N.; Zhang, X.; et al. Modeling the Aging Process of Black Carbon during Atmospheric Transport Using a New Approach: A Case Study in Beijing. Atmos. Chem. Phys. 2019, 19, 9663–9680. [Google Scholar] [CrossRef]
  18. Liu, J.; Fan, S.; Horowitz, L.W.; Levy II, H. Evaluation of Factors Controlling Long-Range Transport of Black Carbon to the Arctic. J. Geophys. Res. Atmos. 2011, 116, D04307. [Google Scholar] [CrossRef]
  19. Nazeer Hussain, S.; Chakradhar Rao, T.; Balakrishnaiah, G.; Rama Gopal, K.; Raja Obul Reddy, K.; Siva Kumar Reddy, N.; Lokeswara Reddy, T.; Pavan Kumari, S.; Ramanjaneya Reddy, P.; Ramakrishna Reddy, R. Investigation of Black Carbon Aerosols and Their Characteristics over Tropical Urban and Semi-Arid Rural Environments in Peninsular India. J. Atmos. Sol. Terr. Phys. 2018, 167, 48–57. [Google Scholar] [CrossRef]
  20. Kajino, M.; Aikawa, M. A Model Validation Study of the Washout/Rainout Contribution of Sulfate and Nitrate in Wet Deposition Compared with Precipitation Chemistry Data in Japan. Atmos. Environ. 2015, 117, 124–134. [Google Scholar] [CrossRef]
  21. Liu, D.; He, C.; Schwarz, J.P.; Wang, X. Lifecycle of Light-Absorbing Carbonaceous Aerosols in the Atmosphere. npj Clim. Atmos. Sci. 2020, 3, 40. [Google Scholar] [CrossRef]
  22. Williams, M.A.; Kumar, T.V.L.; Rao, D.N. Characterizing Black Carbon Aerosols in Relation to Atmospheric Boundary Layer Height during Wet Removal Processes over a Semi Urban Location. J. Atmos. Sol. Terr. Phys. 2019, 182, 165–176. [Google Scholar] [CrossRef]
  23. Lei, S.; Ge, B.; Liu, H.; Quan, J.; Xu, D.; Zhang, Y.; Yao, W.; Lei, L.; Tian, Y.; Liao, Q.; et al. Refractory Black Carbon Aerosols in Rainwater in the Summer of 2019 in Beijing: Mass Concentration, Size Distribution and Wet Scavenging Ratio. J. Environ. Sci. 2023, 132, 31–42. [Google Scholar] [CrossRef] [PubMed]
  24. Ohata, S.; Moteki, N.; Mori, T.; Koike, M.; Kondo, Y. A Key Process Controlling the Wet Removal of Aerosols: New Observational Evidence. Sci. Rep. 2016, 6, 34113. [Google Scholar] [CrossRef] [PubMed]
  25. Ekman, A.M.L.; Wang, C.; Wilson, J.; Ström, J. Explicit Simulations of Aerosol Physics in a Cloud-Resolving Model: A Sensitivity Study Based on an Observed Convective Cloud. Atmos. Chem. Phys. 2004, 4, 773–791. [Google Scholar] [CrossRef]
  26. Barrett, T.E.; Ponette-González, A.G.; Rindy, J.E.; Weathers, K.C. Wet Deposition of Black Carbon: A Synthesis. Atmos. Environ. 2019, 213, 558–567. [Google Scholar] [CrossRef]
  27. Gong, X.; Zhang, C.; Chen, H.; Nizkorodov, S.A.; Chen, J.; Yang, X. Size Distribution and Mixing State of Black Carbon Particles during a Heavy Air Pollution Episode in Shanghai. Atmos. Chem. Phys. 2016, 16, 5399–5411. [Google Scholar] [CrossRef]
  28. Sricharoenvech, P.; Edwards, R.; Yaşar, M.; Gay, D.; Schauer, J.J. Investigation of Black Carbon Wet Deposition to the United States from National Atmospheric Deposition Network Samples. Aerosol Air Qual. Res. 2024, 24, 230089. [Google Scholar] [CrossRef]
  29. Torres, A.; Bond, T.C.; Lehmann, C.M.B.; Subramanian, R.; Hadley, O.L. Measuring Organic Carbon and Black Carbon in Rainwater: Evaluation of Methods. Aerosol Sci. Technol. 2014, 48, 239–250. [Google Scholar] [CrossRef]
  30. National Centers for Environmental Information (NCEI). November 2020 Wildfires Report | National Centers for Environmental Information (NCEI). Available online: https://www.ncei.noaa.gov/access/monitoring/monthly-report/fire/202011 (accessed on 25 December 2022).
  31. Chang, Y.; Zhang, Y.; Tian, C.; Zhang, S.; Ma, X.; Cao, F.; Liu, X.; Zhang, W.; Kuhn, T.; Lehmann, M.F. Nitrogen Isotope Fractionation during Gas-to-Particle Conversion of NOx to NO3 in the Atmosphere—Implications for Isotope-Based NOx Source Apportionment. Atmos. Chem. Phys. 2018, 18, 11647–11661. [Google Scholar] [CrossRef]
  32. Li, Z.; Walters, W.W.; Hastings, M.G.; Song, L.; Huang, S.; Zhu, F.; Liu, D.; Shi, G.; Li, Y.; Fang, Y. Atmospheric Nitrate Formation Pathways in Urban and Rural Atmosphere of Northeast China: Implications for Complicated Anthropogenic Effects. Environ. Pollut. 2022, 296, 118752. [Google Scholar] [CrossRef] [PubMed]
  33. Piña, A.J.; Schumacher, R.S.; Denning, A.S.; Faulkner, W.B.; Baron, J.S.; Ham, J.; Ojima, D.S.; Collett, J.L. Reducing Wet Ammonium Deposition in Rocky Mountain National Park: The Development and Evaluation of A Pilot Early Warning System for Agricultural Operations in Eastern Colorado. Environ. Manag. 2019, 64, 626–639. [Google Scholar] [CrossRef] [PubMed]
  34. Sokolik, I.N.; Soja, A.J.; DeMott, P.J.; Winker, D. Progress and Challenges in Quantifying Wildfire Smoke Emissions, Their Properties, Transport, and Atmospheric Impacts. J. Geophys. Res. Atmos. 2019, 124, 13005–13025. [Google Scholar] [CrossRef]
  35. Yuan, C.; Zheng, J.; Ma, Y.; Jiang, Y.; Li, Y.; Wang, Z. Significant Restructuring and Light Absorption Enhancement of Black Carbon Particles by Ammonium Nitrate Coating. Environ. Pollut. 2020, 262, 114172. [Google Scholar] [CrossRef]
  36. Le Roy, E.; Walters, W.W.; Joyce, E.E.; Hastings, M.G. Sources of Ammonium in Seasonal Wet Deposition at a Coastal New England City. Atmos. Environ. 2021, 260, 118557. [Google Scholar] [CrossRef]
  37. Liu, D.; Allan, J.; Whitehead, J.; Young, D.; Flynn, M.; Coe, H.; McFiggans, G.; Fleming, Z.L.; Bandy, B. Ambient Black Carbon Particle Hygroscopic Properties Controlled by Mixing State and Composition. Atmos. Chem. Phys. 2013, 13, 2015–2029. [Google Scholar] [CrossRef]
  38. Niu, X.; Pu, W.; Fu, P.; Chen, Y.; Xing, Y.; Wu, D.; Chen, Z.; Shi, T.; Zhou, Y.; Wen, H.; et al. Fluorescence Characteristics, Absorption Properties, and Radiative Effects of Water-Soluble Organic Carbon in Seasonal Snow across Northeastern China. Atmos. Chem. Phys. 2022, 22, 14075–14094. [Google Scholar] [CrossRef]
  39. Sullivan, A.P.; Peltier, R.E.; Brock, C.A.; de Gouw, J.A.; Holloway, J.S.; Warneke, C.; Wollny, A.G.; Weber, R.J. Airborne Measurements of Carbonaceous Aerosol Soluble in Water over Northeastern United States: Method Development and an Investigation into Water-Soluble Organic Carbon Sources. J. Geophys. Res. Atmos. 2006, 111, D23S46. [Google Scholar] [CrossRef]
  40. Kirillova, E.N.; Andersson, A.; Sheesley, R.J.; Kruså, M.; Praveen, P.S.; Budhavant, K.; Safai, P.D.; Rao, P.S.P.; Gustafsson, Ö. 13C- and 14C-Based Study of Sources and Atmospheric Processing of Water-Soluble Organic Carbon (WSOC) in South Asian Aerosols. J. Geophys. Res. Atmos. 2013, 118, 614–626. [Google Scholar] [CrossRef]
  41. Wu, G.; Fu, P.; Ram, K.; Song, J.; Chen, Q.; Kawamura, K.; Wan, X.; Kang, S.; Wang, X.; Laskin, A.; et al. Fluorescence Characteristics of Water-Soluble Organic Carbon in Atmospheric Aerosol☆. Environ. Pollut. 2021, 268, 115906. [Google Scholar] [CrossRef]
  42. Willey, J.D.; Kieber, R.J.; Eyman, M.S.; Avery, G.B., Jr. Rainwater Dissolved Organic Carbon: Concentrations and Global Flux. Glob. Biogeochem. Cycles 2000, 14, 139–148. [Google Scholar] [CrossRef]
  43. Popovicheva, O.; Kistler, M.; Kireeva, E.; Persiantseva, N.; Timofeev, M.; Kopeikin, V.; Kasper-Giebl, A. Physicochemical Characterization of Smoke Aerosol during Large-Scale Wildfires: Extreme Event of August 2010 in Moscow. Atmos. Environ. 2014, 96, 405–414. [Google Scholar] [CrossRef]
  44. Sparks, T.L.; Wagner, J. Composition of Particulate Matter during a Wildfire Smoke Episode in an Urban Area. Aerosol Sci. Technol. 2021, 55, 734–747. [Google Scholar] [CrossRef]
  45. Yang, Y.; Wang, H.; Smith, S.J.; Easter, R.; Ma, P.-L.; Qian, Y.; Yu, H.; Li, C.; Rasch, P.J. Global Source Attribution of Sulfate Concentration and Direct and Indirect Radiative Forcing. Atmos. Chem. Phys. 2017, 17, 8903–8922. [Google Scholar] [CrossRef]
  46. Carboni, E.; Mather, T.A.; Schmidt, A.; Grainger, R.G.; Pfeffer, M.A.; Ialongo, I.; Theys, N. Satellite-Derived Sulfur Dioxide (SO2) Emissions from the 2014–2015 Holuhraun Eruption (Iceland). Atmos. Chem. Phys. 2019, 19, 4851–4862. [Google Scholar] [CrossRef]
  47. Jalava, P.I.; Salonen, R.O.; Hälinen, A.I.; Penttinen, P.; Pennanen, A.S.; Sillanpää, M.; Sandell, E.; Hillamo, R.; Hirvonen, M.-R. In Vitro Inflammatory and Cytotoxic Effects of Size-Segregated Particulate Samples Collected during Long-Range Transport of Wildfire Smoke to Helsinki. Toxicol. Appl. Pharmacol. 2006, 215, 341–353. [Google Scholar] [CrossRef]
  48. Brahney, J.; Ballantyne, A.P.; Sievers, C.; Neff, J.C. Increasing Ca2+ Deposition in the Western US: The Role of Mineral Aerosols. Aeolian Res. 2013, 10, 77–87. [Google Scholar] [CrossRef]
  49. Pachon, J.E.; Weber, R.J.; Zhang, X.; Mulholland, J.A.; Russell, A.G. Revising the Use of Potassium (K) in the Source Apportionment of PM2.5. Atmos. Pollut. Res. 2013, 4, 14–21. [Google Scholar] [CrossRef]
  50. Rincón-Riveros, J.M.; Rincón-Caro, M.A.; Sullivan, A.P.; Mendez-Espinosa, J.F.; Belalcazar, L.C.; Quirama Aguilar, M.; Morales Betancourt, R. Long-Term Brown Carbon and Smoke Tracer Observations in Bogotá, Colombia: Association with Medium-Range Transport of Biomass Burning Plumes. Atmos. Chem. Phys. 2020, 20, 7459–7472. [Google Scholar] [CrossRef]
  51. Sillanpää, M.; Saarikoski, S.; Hillamo, R.; Pennanen, A.; Makkonen, U.; Spolnik, Z.; Van Grieken, R.; Koskentalo, T.; Salonen, R.O. Chemical Composition, Mass Size Distribution and Source Analysis of Long-Range Transported Wildfire Smokes in Helsinki. Sci. Total Environ. 2005, 350, 119–135. [Google Scholar] [CrossRef]
  52. Saarnio, K.; Aurela, M.; Timonen, H.; Saarikoski, S.; Teinilä, K.; Mäkelä, T.; Sofiev, M.; Koskinen, J.; Aalto, P.P.; Kulmala, M.; et al. Chemical Composition of Fine Particles in Fresh Smoke Plumes from Boreal Wild-Land Fires in Europe. Sci. Total Environ. 2010, 408, 2527–2542. [Google Scholar] [CrossRef]
  53. Gao, J.; Dong, S.; Yu, H.; Peng, X.; Wang, W.; Shi, G.; Han, B.; Wei, Y.; Feng, Y. Source Apportionment for Online Dataset at a Megacity in China Using a New PTT-PMF Model. Atmos. Environ. 2020, 229, 117457. [Google Scholar] [CrossRef]
Figure 1. The locations of 209 North American sampling sites were included in the study from 26 October to 1 December 2020.
Environments 12 00058 g001
Figure 2. Concentrations of 6 main air pollution parameters in wet deposition in thecontiguous US and Alaska in November 2020: (a) rBC; (b) nitrate; (c) ammonium; (d) WSOC; (e) calcium; (f) sulfate. Gray circles indicate locations without WSOC data.
Environments 12 00058 g002
Figure 3. Comparisons between weekly precipitation and concentrations of (a) rBC, (b) WSOC, (c) sulfate, (d) nitrate, (e) ammonium, (f) chloride, (g) orthophosphate, (h) calcium ion, (i) magnesium ion, (j) sodium ion, and (k) potassium ion.
Environments 12 00058 g003
Figure 4. Spearman’s rank correlations between BC and air pollution parameters in wet deposition in North America in November 2020 using moderate-rainfall samples (n = 95).
Environments 12 00058 g004
Figure 5. Comparisons between the concentrations of rBC and (a) NO3, (b) NH4+, (c) WSOC, (d) SO42−, and (e) Ca2+.
Environments 12 00058 g005
Figure 6. HMS smoke map showing collective smoke data from 25 October to 1 December 2020. Blue dots indicate NADP NTN sites included in the study.
Environments 12 00058 g006
Table 1. Statistical summary of rBC, WSOC, and NADP measurements.
Parameter (Unit)Minimum25th
Percentile
MedianMean75th
Percentile
Maximum
rBC (ppb)0.000 *1.5833.4155.3027.04038.660
Sulfate (mg/L) 0.03740.14120.25310.35060.46253.1507
Nitrate (mg/L)0.0000 *0.16930.31620.43420.58442.9849
Chloride (mg/L)0.00750.03900.08630.39090.273015.4262
Ammonium (mg/L)0.00000 *0.005690.14470.23500.33172.0489
Orthophosphate (mg/L)0.00230.00380.00640.01090.00970.3581
Calcium (mg/L)0.00730.03480.07010.16660.18085.2310
Magnesium (mg/L)0.00080.00810.01970.03900.04080.9958
Sodium (mg/L)0.00280.02300.06120.22110.18628.7850
Potassium (mg/L)0.00190.00950.01720.02940.03180.3337
WSOC (ppb) **0.0 *314.8470.3569.7751.43869.3
Note: * Effective zero value; ** 29 WSOC samples were removed due to instrument error.
Table 2. Results of factor analysis (FA).
FactorVariance
Explained (%)
Determining
Species
Potential Sources
128.27NO3, rBC, NH4+,
SO42−, WSOC
Secondary aerosols;
incomplete combustion of biomass
227.86Na, Mg, ClSea salts
314.77PO43−, K+Mineral dust; fertilizers
411.39Ca2+Crustal derived
58.58WSOCBiomass burning;
secondary aerosols
Note: bold are variables with loadings ≥ 0.8.
Disclaimer/Publisher’s Note: The statements, opinions and data contained in all publications are solely those of the individual author(s) and contributor(s) and not of MDPI and/or the editor(s). MDPI and/or the editor(s) disclaim responsibility for any injury to people or property resulting from any ideas, methods, instructions or products referred to in the content.

