Article

Advancing Human Health Risk Assessment Through a Stochastic Methodology for Mobile Source Air Toxics

by
Mohammad Munshed
*,
Jesse Van Griensven Thé
and
Roydon Fraser
Department of Mechanical and Mechatronics Engineering, University of Waterloo, Waterloo, ON N2L 3G1, Canada
*
Author to whom correspondence should be addressed.
Environments 2025, 12(2), 54; https://doi.org/10.3390/environments12020054
Submission received: 24 December 2024 / Revised: 22 January 2025 / Accepted: 2 February 2025 / Published: 6 February 2025
(This article belongs to the Special Issue Air Pollution in Urban and Industrial Areas III)

Abstract

:
Mobile source air toxics (MSATs) are major contributors to urban air pollution, especially near high-traffic roadways, where populations face elevated pollutant exposures. Traditional human health risk assessments, based on deterministic methods, often overlook variability in exposure and the vulnerabilities of sensitive subpopulations. This study introduces and applies a new stochastic modeling approach, utilizing Monte Carlo simulations to evaluate cumulative cancer risks from MSATs exposure through inhalation and ingestion pathways. This method captures variability in exposure scenarios, providing detailed health risk assessments, particularly for vulnerable groups such as children and the elderly. This approach was demonstrated in a case study conducted in Saint Paul, Minnesota, using 2019 traffic data. Deterministic models estimated cumulative cancer risks for adults at 6.24E-02 (unitless lifetime cancer risk), while stochastic modeling revealed a broader range, with the 95th percentile reaching 4.98E-02. The 95th percentile, used in regulatory evaluations, identifies high-risk scenarios overlooked by deterministic methods. This research advances the understanding of MSATs exposure risks by integrating spatiotemporal dynamics, identifying high-risk zones and vulnerable subpopulations, and supporting resource allocation for targeted pollution control measures. Future applications of this methodology include expanding stochastic modeling to evaluate ecological risks from mobile emissions.

1. Introduction

Mobile source emissions from roadways near human populations often result in greater health impacts than emissions from industrial facilities in North America [1,2], primarily due to their proximity to densely populated areas and the high exposure to pollutants such as mobile source air toxics (MSATs).
There is a problem with the traditional use of worst-case or average exposure values in human health risk assessments for MSATs [2], which results in overlooking the considerable variability among individuals in a population, the specific vulnerabilities of sensitive subpopulations, and the inability to capture episodic high-exposure events that considerably impact risk assessment outcomes.
Stochastic methods address these challenges by capturing variability and uncertainty for a more comprehensive risk assessment. Deterministic methods provide baseline exposure–response relationships, while stochastic methods account for the range of possible exposures in different individuals, reflecting real-world complexities. A new stochastic method for MSATs is proposed to provide a more accurate and comprehensive assessment of health risks, paving the way for more effective and equitable risk management strategies.

1.1. Mobile Source Air Toxics (MSATs)

MSATs, a subset of hazardous air pollutants, are emitted from on-road mobile sources such as trucks, passenger cars, buses, and motorcycles, as well as from non-road sources, including marine vessels, airplanes, and agricultural equipment [2]. This research focuses on emissions from on-road mobile sources due to their proximity to human populations and their direct impact on urban air quality. The United States Environmental Protection Agency (EPA) has identified more than 1160 compounds in the exhaust and evaporative emissions from on-road and non-road mobile sources [3,4], including non-exhaust emissions like gasoline vapor, fluid leaks (including washer fluids and deicing chemicals), particulate matter from brake dust and tire wear, and re-entrained road dust. Key MSATs include benzene, 1,3-butadiene, formaldehyde, acetaldehyde, acrolein, polycyclic aromatic hydrocarbons (PAHs), naphthalene, hexavalent chromium, ethylbenzene, and diesel exhaust. These toxic emissions significantly contribute to urban air pollution, posing risks of cancer and noncancer health effects in humans, as summarized in Table 1. Additionally, they have been linked to health impacts in animals [5]. Table 1 includes examples of MSATs and their associated health impacts, showing the range of potential effects, though this selection is not comprehensive.
Despite the critical nature of MSATs, the regulatory practices for monitoring and controlling their full range are currently limited, with fewer than 70 of the 1160 identified MSATs actively monitored by regulatory agencies [11,12]. This shortfall in regulatory monitoring, combined with the proximity of mobile emission sources to human populations [13,14,15,16] and the increased exposure to elevated MSATs concentrations, such as benzene and PAHs near busy and congested roads [17], highlights the need for a detailed health risk assessment.

1.2. Deterministic Human Health Risk Assessments

Human health risk assessment estimates the probability and magnitude of adverse health effects resulting from exposure to environmental stressors. It involves four key steps: hazard identification, exposure assessment, dose–response assessment, and risk characterization. Risk characterization uses health risk estimates to determine the presence of risk, quantify outcomes, and identify contributing factors [2]. This information guides informed decisions on mitigation strategies and the design or improvement of pollution control systems, including those for vehicles.
Cancer risk is defined as the incremental probability (unitless) of an individual developing cancer over their lifetime, typically assumed to be 70 years [2], based on specific exposure and toxicity assumptions. For example, a risk of 5.0E-05 indicates that an individual has up to a 5 in 100,000 increased chance of developing cancer from the evaluated exposure. Noncancer hazard estimates the likelihood of experiencing health effects such as neurological, cardiovascular, reproductive, or respiratory issues due to MSATs exposure through various pathways and routes. Hazards are calculated as a ratio of exposure to reference doses or concentrations and are classified as acute or chronic [2].
Traditional risk assessments typically rely on deterministic methods, using worst-case or average exposure scenarios [2]. For example, deterministic models often assume an average adult body weight of 70 kg when calculating MSATs intake. This assumption overlooks individual variability, leading to oversimplifications that misrepresent actual risk levels across different population segments. To address these limitations, this research employs stochastic methods, which capture variability and uncertainty in real-world exposure scenarios, enabling a more accurate and equitable assessment of health risks.

1.3. Literature Review

Large-scale assessments like the Air Toxics Screening Assessment (AirToxScreen) [1], a successor to the National Air Toxics Assessment starting in 2017, and the Regional Air Impact Modeling Initiative (RAIMI) [18] have contributed to understanding MSATs’ impact. AirToxScreen is a deterministic model that focuses on direct inhalation risks but does not account for other exposure pathways like ingestion, nor does it address local-scale air toxics “hot spots” and individual risks from near-roadway exposures. RAIMI, while comprehensive in assessing cumulative air dispersion and human health risks, faced challenges in source parameterization. The RAIMI study in Harris County, Texas, identified risk hotspots but highlighted the need for improved emission source characterizations.
Furthermore, statewide screening assessments like the Minnesota Pollution Control Agency’s MNRISKs [19] study provided extensive inventories of emissions, including on-road and non-road sources. These studies, including AirToxScreen, RAIMI, and MNRISKs, though insightful, primarily used deterministic models based on average exposure assumptions, like a standard adult body weight of 70 kg and inhalation rates of 0.83 m3/h. This approach fails to capture the variability in cancer or noncancer health risks among different population segments. Additionally, the annual averages used in these models overlook significant exposure pathways and spatiotemporal dynamics, limiting the ability to predict health impacts for specific areas and times accurately. The literature consistently highlights the need for improved methodologies that account for variability and uncertainty, emphasizing the importance of employing stochastic methods in MSATs risk assessments. For an expanded review of the literature on deterministic evaluations of the human health risks of MSATs, readers are referred to the “Literature Review” section [2].
Table 2 summarizes previous probabilistic methods in risk assessment, including their scope, methodologies, and consideration of multiple pathways and cumulative risks.
No peer-reviewed studies have yet employed stochastic modeling to assess the health risks from air toxics emitted by on-road mobile sources. This significant gap in the literature underscores the limitations of deterministic methods, which fail to account for the variability inherent in population exposures. By incorporating randomness and variability through probabilistic frameworks, stochastic models offer an essential and advanced approach for evaluating complex and dynamic exposure scenarios, particularly in environments heavily influenced by on-road mobile sources.

1.4. Research Objectives and Contributions

The primary objective of this research is to make effective use of the benefits of stochastic risk modeling, which include the identification of high-risk groups, an enhanced understanding of uncertainty and variability, improved risk management, support for policy and regulatory decisions, and cost-effective resource allocation. These benefits are achieved by assessing human health risks from MSATs exposure through a newly tailored stochastic modeling method aimed at the following:
  • Evaluating the (i) cumulative and (ii) multi-pathway risks of MSATs exposure. This includes the combined effects of multiple pollutants and exposure routes, often overlooked in traditional assessments. The primary exposure pathways modeled in this study are inhalation and ingestion.
  • Accounting for the overall population risk while identifying vulnerable subpopulations, high-risk groups, and exposure hotspots.
  • Comparing the outcomes of stochastic and deterministic models to demonstrate the advantages of probabilistic methods for assessing MSATs health risks.
Towards these objectives, this paper contributes the following:
  • Introduces a stochastic model for environmental health risk assessments of MSATs. This approach helps identify and quantify risks for subpopulations that are more vulnerable due to higher exposure or increased susceptibility. Although it is primarily focused on MSATs, this research lays the groundwork for extending this methodology to other chemicals, such as per- and polyfluorinated substances, by incorporating new relevant exposure pathways. This promotes broader application and future research.
  • Performs a sensitivity analysis to identify dominant variables affecting the risk results, ensuring a focused and resource-efficient stochastic risk assessment.
  • Incorporates spatiotemporal dynamics to enhance emission characterization by integrating hourly data on wind speeds, traffic patterns, and emissions, addressing the limitations of annual averages and enabling dynamic exposure assessments for targeted interventions.
  • Identifies MSATs cancer risk drivers to inform targeted control measures to reduce public health risks.

2. Methodology

Succinct summary of methodology steps:
  • Utilize current U.S. regulatory models, such as the MOtor Vehicle Emission Simulator (MOVES) or the International Vehicle Emissions simulator, to estimate the emissions from on-road vehicles;
  • Employ air dispersion models like the American Meteorological Society/EPA Regulatory Model (AERMOD) to predict MSATs air concentrations and deposition;
  • Identify realistic exposure scenarios to estimate the types and magnitudes of human exposure to MSATs;
  • Conduct a multi-pathway fate-and-transport analysis to determine MSATs concentrations in various media, assessing both direct and indirect exposures at sensitive locations;
  • Quantify exposure levels to determine cumulative and multi-pathway cancer risks (deterministic MSATs risk characterization);
  • Identify dominant variables that affect MSATs exposure and risk outcomes and implement Monte Carlo simulations to explore variability in exposure and enhance the understanding of risk to the population as a whole (stochastic MSATs risk characterization);
  • Verify Monte Carlo simulations to ensure precision and reliability by analyzing and plotting outputs (e.g., exposure distributions) from realizations, comparing key statistical metrics to initial parameters, and conducting manual calculations to confirm cancer risk percentiles and their statistical consistency.
Highlights:
This methodology extends and adapts stochastic modeling techniques, specifically Monte Carlo simulations, to assess human health risks from MSATs. By tailoring these probabilistic methods to on-road mobile source emissions, it addresses a critical gap in human health risk assessment and enables a comprehensive evaluation of variability in MSATs exposures, which deterministic methods cannot achieve.
Using 100,000 realizations for each scenario (adult and child), this research examines complex exposure scenarios and captures a wide range of possible outcomes (including worst-case scenarios). This approach refines and improves cumulative and multi-pathway risk assessments by providing detailed quantification of probabilities for various risk outcomes, especially for MSATs exposures.
Detailed Methodology Sections

2.1. On-Road Vehicle Emissions Inventory (Step 1 in the Methodology)

In this study, the authors present a refined emissions inventory utilizing the EPA’s state-of-the-art MOVES [30]. MOVES calculates the emissions for pollutants including particulate matter (PM10 and PM2.5), nitrous oxide (N2O), sulfur dioxide (SO2), carbon monoxide (CO), greenhouse gases (GHGs), metals, and MSATs, which are the primary focus of this research. The simulator models releases of MSATs, covering over 50 exhaust and evaporative species, and supports different fuel types, such as diesel, gasoline, and E85 (a blend of 85% ethanol and 15% gasoline), for various mobile sources, including cars, buses, motorcycles, and trucks. MOVES requires data on several parameters to estimate emissions. These include road segments, vehicle classes, fuel types and usage, vehicle age distribution, traffic volume, and meteorological data. The integration of MOVES with the Transportation Air Quality System (TRAQS) [2] enables this methodology to achieve the following:
  • Address MOVES’s lack of spatial awareness by utilizing TRAQS to overlay the emissions outputs onto high-resolution geographic grids. This enhances the emissions data’s integration with air dispersion models and improves the spatial accuracy of the emissions inventory.
  • Incorporate hourly spatiotemporal data to improve emissions characterization and population exposure assessments. This approach models traffic patterns, weather conditions, and time-specific factors, enabling the identification of high-emission periods, such as peak traffic hours, and low-emission periods, such as nighttime. By capturing time-dependent exposures, this methodology surpasses traditional approaches that rely on annual averages, offering dynamic insights for refined risk assessments.
For further details on the vehicle emissions inventory, see [2], where this methodology was first introduced and applied.

2.2. Air Dispersion and Deposition Modeling (Step 2 in the Methodology)

Air dispersion modeling is defined as the mathematical description of pollutant transport in the atmosphere. This process is conducted to simulate the transport, diffusion, and deposition of MSATs once they are emitted from mobile sources. The goal is to determine air concentrations, deposition on various media, and pollutant distributions both near and far from urban roads. This modeling facilitates the following:
  • Determination of the relative impact of on-road mobile source emissions on ambient air quality compared to other sources, such as power plants or refineries;
  • Understanding the contributions of MSATs to overall air pollution;
  • Identification of roads with significant pollution impacts for targeted monitoring and mitigation efforts.
In this study, the EPA’s preferred regulatory model, AERMOD [31], is employed for air dispersion and deposition modeling. AERMOD is suited to this research due to its ability to accurately simulate pollutant behavior over various terrains and near-road environments. As a validated steady-state Gaussian plume model in urban settings and near roadways, AERMOD uses dispersion principles based on planetary boundary-layer turbulence and scaling concepts, including plume rise and a Gaussian distribution [32]. However, AERMOD does not account for atmospheric chemical reactions. The proposed method is flexible and can incorporate other air dispersion models, such as CALPUFF, which can handle atmospheric chemical reactions. In this study, AERMOD’s outputs include annual average air concentrations for vapor-phase, particle-phase, and particle-bound pollutants [33]. For more detailed information on the air dispersion model, see Section 3.1.1 in [2].
Meteorological Data for AERMOD
The Weather Research and Forecasting (WRF) model [34] was used to generate AERMOD meteorological files due to its advanced capabilities in simulating atmospheric conditions. WRF’s high-resolution data improve the precision of air quality predictions by providing a detailed representation of the atmospheric state. The WRF model outputs two meteorological data files: surface data (.SFC) and profile data (.PFL). The surface data file, which contains hourly boundary-layer parameter estimates, is important for understanding dispersion patterns at ground level. The profile data file, containing multi-level observations of wind speed, wind direction, temperature, and the standard deviation of fluctuating wind components, provides a vertical atmospheric profile that is essential for assessing pollutant transport and diffusion across different altitudes.

2.3. Exposure Scenario Identification (Step 3 in the Methodology)

This step identifies high-risk areas and vulnerable populations by characterizing exposure scenarios based on geographical and demographic factors. An exposure scenario involves various “exposure pathways” through which MSATs impact a “receptor”. An exposure “pathway” refers to the journey MSATs take from their source to the person being exposed, such as through the inhalation of vapors and particulates or the ingestion of contaminated fish. The “route” of exposure specifies how these substances enter the body.
Sensitive receptors, such as schools, hospitals, and places of worship, are prioritized due to the increased vulnerability of their occupants to the adverse effects of MSATs. The criteria for identifying high-exposure scenarios at sensitive receptors include the following:
  • Selecting grid nodes with the highest modeled air parameter values within a specific area;
  • Excluding grid nodes located in roadways, as intermittent exposure locations are not the focus of this study;
  • Evaluating scenarios relevant to the study area, such as urban residents, farmers, fishers, or nursing infants.
In human health risk assessments, a common-sense approach is important for analyzing scenarios within a project domain and evaluating their likelihood. If a scenario is not applicable to the study area, the corresponding pathways and risks do not exist. For example, a child playing in a park adjacent to heavy traffic is a realistic exposure scenario, unlike a less probable situation, such as a farmer working in a highly urbanized area devoid of agriculture.
The inclusion of all recommended exposure pathways, including water and soil ingestion, follows the U.S. EPA’s Human Health Risk Assessment Protocol (HHRAP) [35]. As the contribution of certain pathways may vary by location or study, their inclusion supports an adaptable risk assessment and minimizes the risk of overlooking pathways that could be significant under varying environmental or socio-economic conditions. In this study, the evaluated exposure scenarios include urban resident adults and children, with their associated exposure pathways shown in Table 3 and Figure 1.

2.4. Multi-Pathway Fate-and-Transport Analysis (Step 4 in the Methodology)

This analysis evaluates how MSATs move through the environment (“Transport”) and what happens to them after their release (“Fate”). The process estimates MSAT concentrations in air, soil, water, and food at points of human contact, which is critical for assessing both direct and indirect risks. Importantly, a lack of transport and fate data should not be interpreted as an absence of potential exposure and risk. In this research, the medium concentrations were estimated using mathematical equations published in the HHRAP [35]. The outputs from this analysis include estimates of MSAT concentrations in air for direct inhalation risk evaluations, concentrations in soil, and concentrations of MSATs in produce due to direct deposition. These are essential for a comprehensive human health risk assessment.

2.5. Deterministic MSATs Risk Characterization (Step 5 in the Methodology)

Previously, the authors developed a deterministic human health risk assessment methodology for MSATs [2], which extends the EPA methodologies originally designed for hazardous waste combustion facilities, as detailed in the HHRAP [35], to on-road mobile sources. This section revisits the key elements of this deterministic risk characterization approach for MSATs.
The authors’ deterministic methodology quantifies MSATs exposure by evaluating contact frequency, duration, receptor body weight, and exposure magnitude. Deterministic models were then applied to calculate cumulative and multi-pathway cancer risks from MSATs exposure. The outcomes of this risk characterization are presented numerically, with explanatory text to facilitate risk interpretation (see Section 1.2).
Inhalation and ingestion exposures were calculated using Equations (1) and (2) [35]:
E x p o s u r e i n h a l a t i o n = A D D ( i n h a l a t i o n ) = C a i r × E F × E D A T × 365
where ADD represents the average daily dose (µg/m3), C a i r is the concentration of MSATs in the air (µg/m3), E F is the exposure frequency (days/year), E D is the exposure duration (years), A T is the averaging time (year), and 365 is a conversion factor (days/year).
E x p o s u r e i n g e s t i o n = A D D ( i n g e s t i o n ) = C m e d i u m × I n g R × E F × E D B W × A T
where ADD represents the average daily dose (mg/kg-day), C m e d i u m is the concentration of MSATs in the medium (e.g., mg/L, mg/g), I n g R is the ingestion rate (e.g., L/day, g/day), E F is the exposure frequency (days/year), E D is the exposure duration (years), B W is the body weight (kg), and A T is the averaging time (days).
Table 4 [35] summarizes the variables used in the deterministic risk assessments conducted by the authors.
The deterministic risk characterization equations used are summarized below:
I n c r e m e n t a l   C a n c e r   R i s k   i n h a l a t i o n = E x p o s u r e   C o n c e n t r a t i o n × M S A T s   U n i t   R i s k   F a c t o r
I n c r e m e n t a l   C a n c e r   R i s k   i n g e s t i o n = Q u a n t i f i e d   E x p o s u r e × M S A T s   C a n c e r   S l o p e   F a c t o r
The cancer risk calculations in this study used peer-reviewed toxicity values, including unit risk factors (URFs) for inhalation exposure and cancer slope factors (CSFs) for ingestion pathways. The toxicity values for the MSATs modeled in this study are summarized in Table 5.
Next, the cumulative and multi-pathway risks from MSATs exposure represent the total risk from exposure to multiple MSATs through various pathways, including inhalation and ingestion, from different sources. This risk is quantified using Equation (5) [36]:
R t o t a l = R i , j + R i , i n h a l a t i o n
where R t o t a l represents the cumulative cancer risk estimate, considering both ingestion and inhalation pathways. R i , j represents the individual risk estimate for MSAT compound i and ingestion pathway j; and R i , i n h a l a t i o n is the individual risk estimate for MSAT compound i via the inhalation pathway. The index i refers to specific MSAT compounds (e.g., benzene, 1,3-butadiene, formaldehyde, etc.), and j denotes the various ingestion pathways (e.g., vegetable ingestion, fish ingestion, egg ingestion, beef ingestion, etc.).
Aligning the calculated risks with regulatory target levels is crucial for public health and compliance. Regulatory agencies typically establish cancer risk target levels between 1 × 10⁻⁴ and 1 × 10⁻⁶ [37], indicating minimal increases in risk. This study applies a stricter target level, adopting a maximum cancer risk value of 1 × 10⁻⁵. This stricter target level accounts for background exposure and area-specific risks, serving as reference points for evaluating whether the risks fall within acceptable boundaries. When the risks exceed these thresholds, an additional analysis is warranted, potentially involving refined exposure assessments or advanced traffic and emissions modeling (as proposed in this research) to better understand MSATs contributions and the associated health risks.

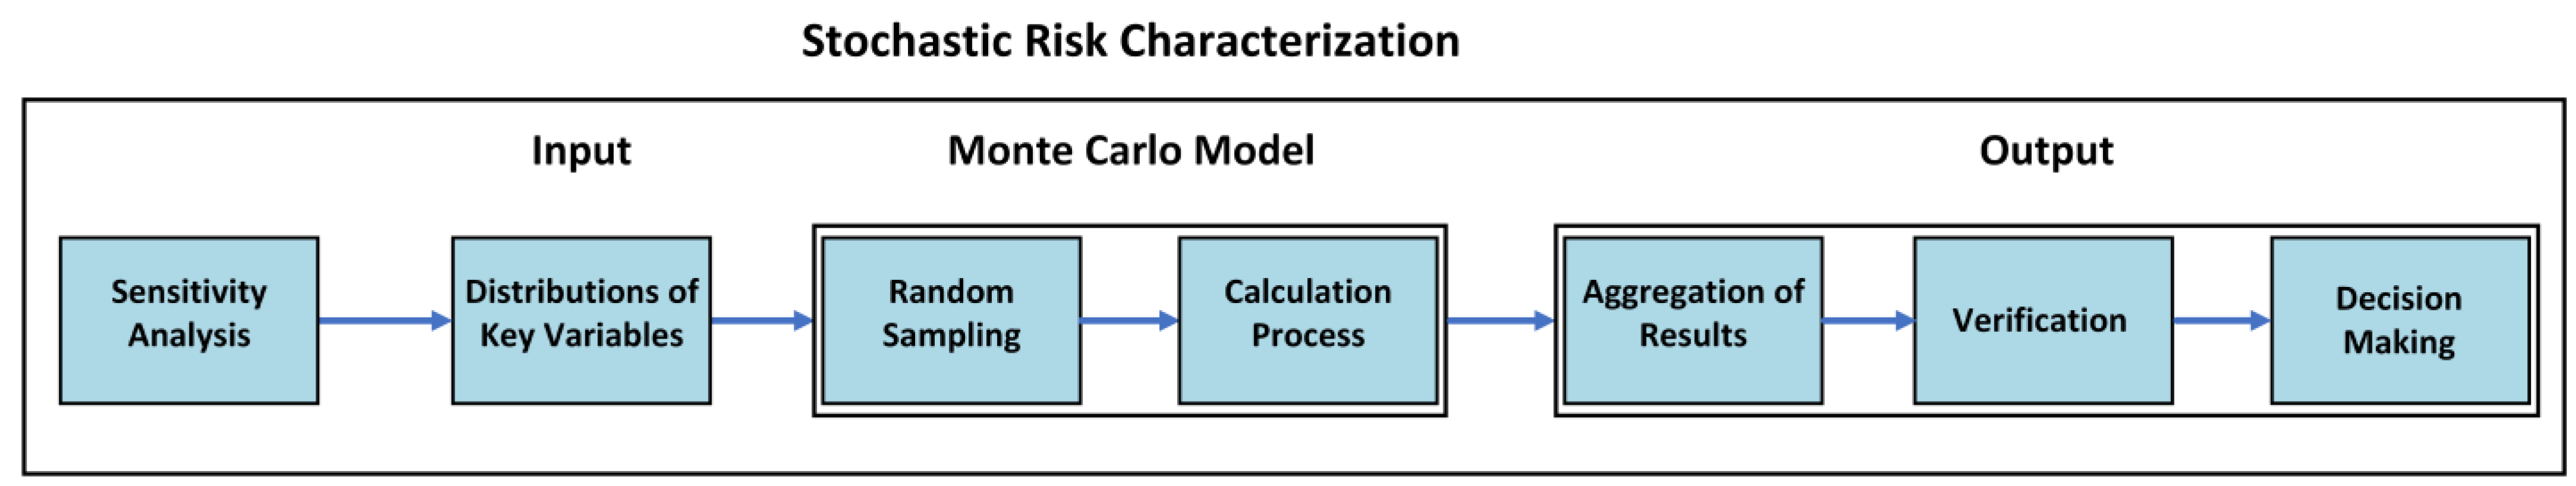
2.6. Stochastic MSATs Risk Characterization (Step 6 in the Methodology)

This step advances beyond deterministic methods to probabilistic approaches. Step 6 utilizes Monte Carlo simulations to capture the variability and uncertainty in environmental exposures to MSATs. Unlike traditional deterministic approaches that often oversimplify complex exposure scenarios, the use of stochastic methods introduces a higher level of precision in risk estimates by accounting for a broader range of possible outcomes. This approach employs probability distributions to describe the range and likelihood of possible risk values.
A key benefit of stochastic analysis is its ability to handle real-world variability and uncertainty, a common limitation of deterministic models. This methodology enhances decision-making by identifying risk hotspots and enabling sensitivity analyses, focusing efforts on significantly impactful areas and variables, which directly inform risk management strategies and interventions.
By integrating probability distributions for dominant variables into risk assessment models, this methodology captures a spectrum of potential health outcomes, reflecting the complexity of real-world MSAT exposures. The application of probability density functions (PDFs) and cumulative distribution functions within this framework provides a nuanced and detailed view of risk characterization for MSAT exposures.

2.6.1. Sensitivity Analysis

A sensitivity analysis (contribution 2 in Section 1.4) was conducted using a custom Python script to evaluate the impact of key exposure variables before full stochastic modeling. This analysis prioritized the most influential parameters to optimize resources (e.g., simulation times).
Steps in the Sensitivity Analysis:
  • Variable selection: Five key exposure variables were analyzed: body weight, exposure frequency, exposure duration, drinking water consumption rate, and soil consumption rate. These were chosen based on their relevance to risk calculations for both adult and child populations.
  • Variation application: The Python script systematically varied each variable by ±20%, a threshold determined through trial and error. Smaller and larger ranges were tested, and ±20% was found to effectively capture realistic variability while maintaining the interpretability of the results. Additionally, other studies have employed similar variation percentages in their sensitivity analyses [38,39].
  • Evaluation of results: The script compared risk outcomes for each variation, focusing on identifying variables with the greatest impact on calculated risks.
Key Observations:
  • Body weight: While showing lower sensitivity compared to other variables, body weight remains important, especially in the children scenario, due to its inverse relationship with exposure calculations.
  • Exposure frequency and duration: These variables emerged as the most influential factors, highlighting their importance in stochastic modeling and the need to accurately capture exposure patterns.
  • Drinking water consumption: Moderate sensitivity was observed, suggesting its relevance under certain scenarios.

2.6.2. Selecting Distributions for Key Exposure Variables

The sensitivity analysis results directly informed the prioritization and selection of key variables for Monte Carlo simulations by identifying parameters with the greatest influence on risk outcomes. For these prioritized variables, probability distributions were selected based on a review of peer-reviewed literature [20,25,40,41] to ensure they reflect the variability of each variable. Table 6 lists the key exposure variables employed in the probabilistic model, along with their selected distributions and parameters. These variables and their empirically supported distributions form the basis for the stochastic risk characterization in this study, enabling a detailed and realistic representation of variability in human exposure to MSATs.

2.6.3. Monte Carlo Simulations

All Monte Carlo simulations in this study use 100,000 realizations for each scenario. This number of realizations ensures statistical reliability of the risk estimates, minimizing the influence of random fluctuations and supporting the convergence of results. The simulations quantitatively characterize uncertainty and variability in risk estimates by sampling from the input probability distributions of key exposure variables.
Each simulation involves random sampling from the input distributions of exposure factors and constructing a composite uncertainty distribution by combining these sampled values with the model equations. This iterative process is repeated for 100,000 realizations, resulting in a distribution of cancer risk estimates. The results from these realizations are tallied to produce histograms, which illustrate the distribution of potential risk outcomes. The 95th percentile of the overall risk distribution is used as the benchmark for identifying high-risk scenarios, aligning with common regulatory standards [42].
The custom Python script used for these simulations will be distributed with the manuscript (see the Data Availability Statement) to support the reproducibility of the results.

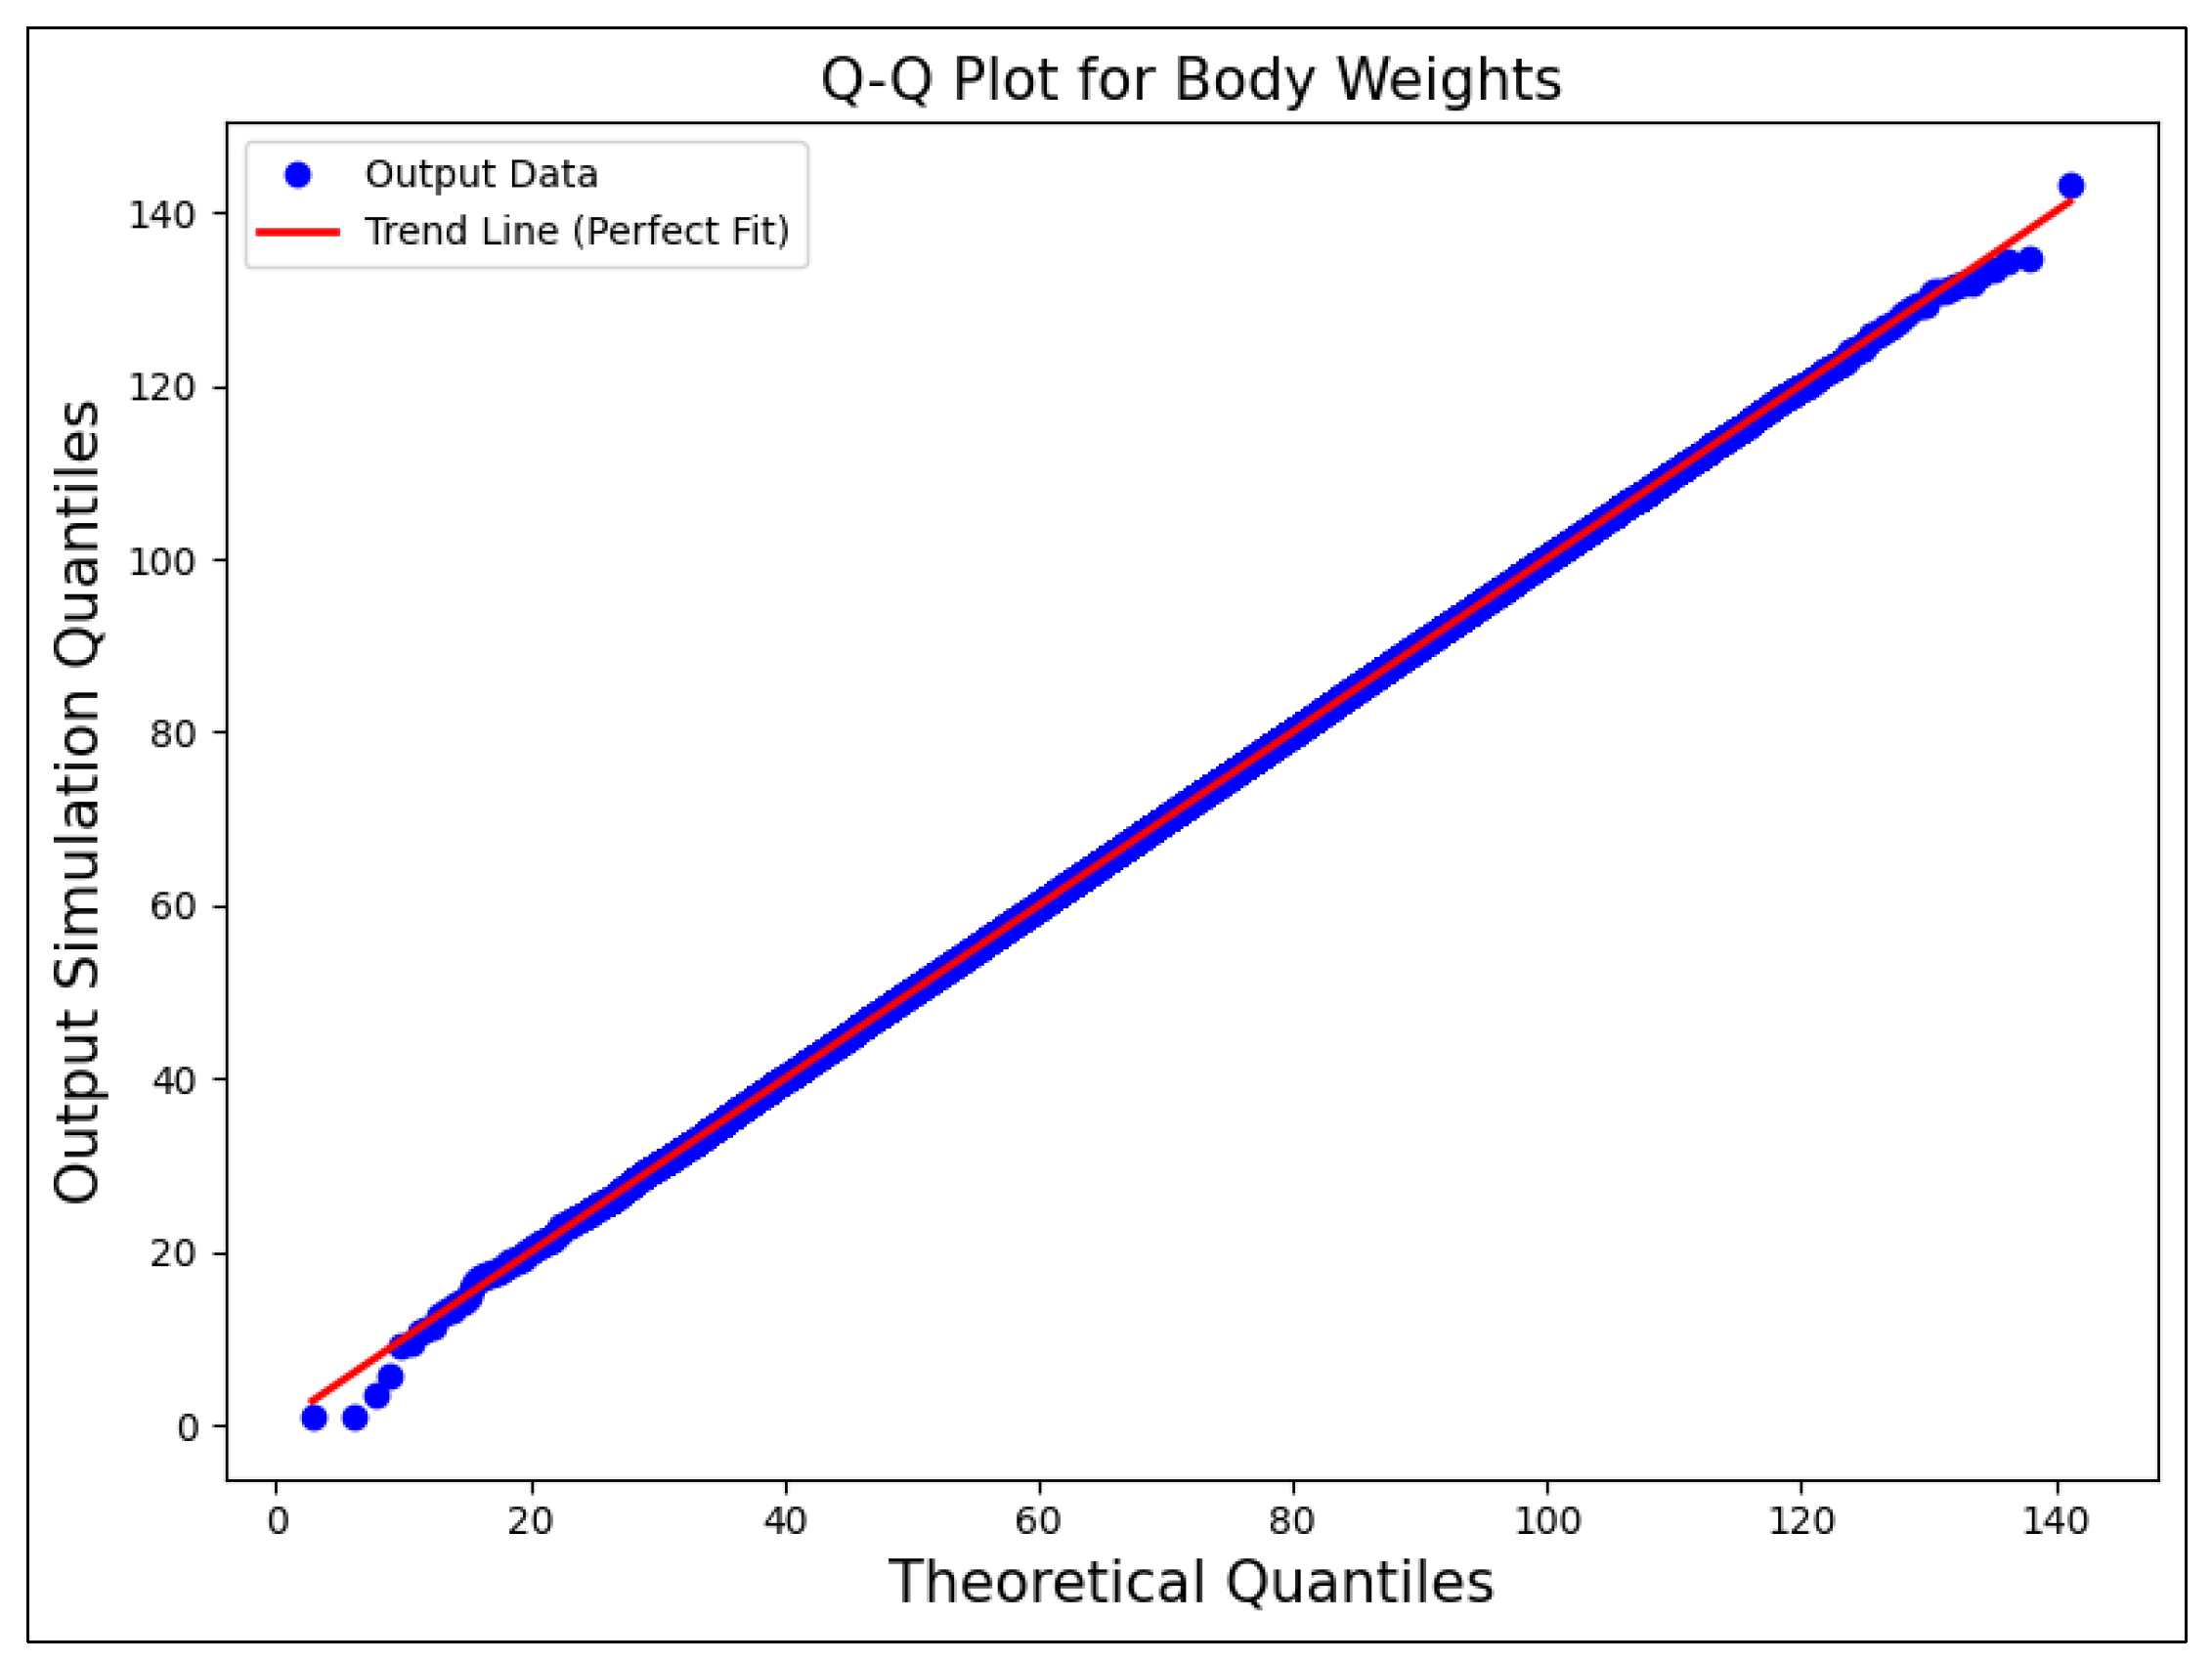
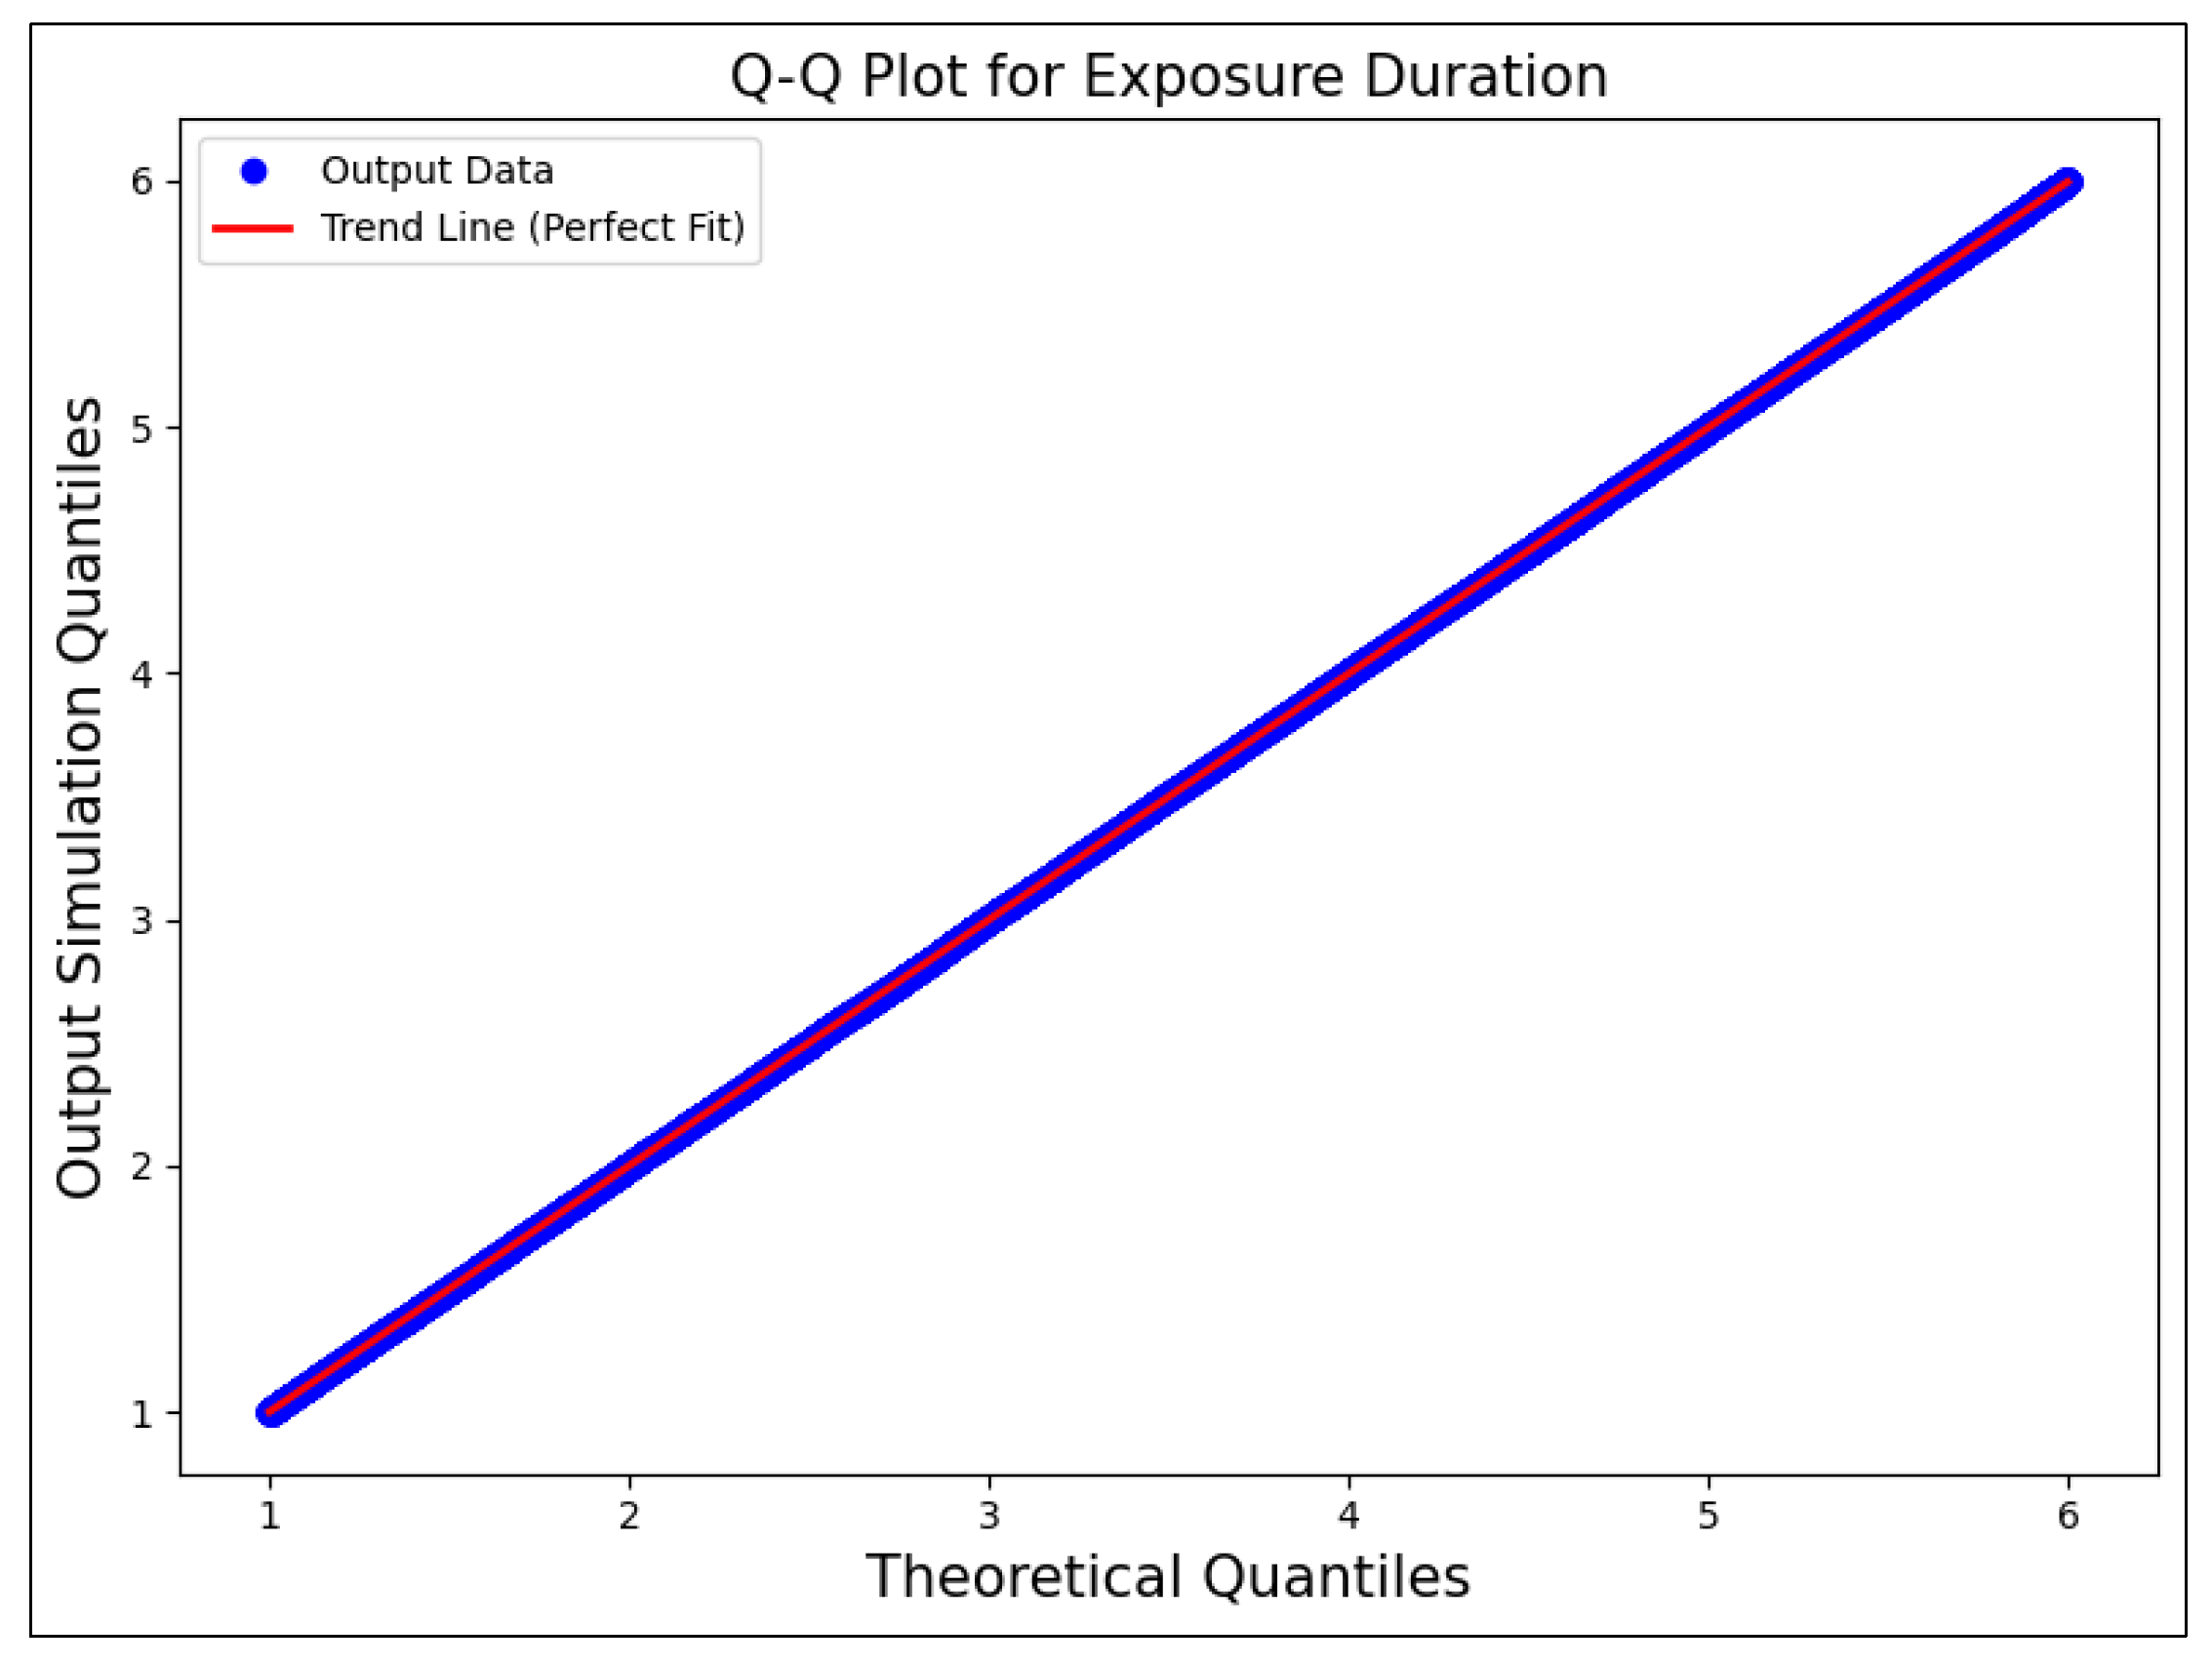
2.6.4. Verification of the Monte Carlo Simulation

The verification process for the Monte Carlo simulations employed in this study involved analyzing and plotting the outputs from the 100,000 realizations and comparing the resulting statistics for each distribution listed in Table 6 against the initial input parameters. This comparison demonstrated that the calculated values align closely with the input specifications, with discrepancies falling within acceptable limits for high-precision simulations. To quantify the precision of the sampling process, the Standard Errors of the Mean (SEMs) were calculated. For the adult scenario, the SEM for soil consumption was 6.51 × 10⁻⁸ kg/day, and for water consumption, it was 4.12 × 10⁻³ L/day. These low SEM values confirm that random fluctuations were minimized, highlighting the reliability of the Monte Carlo sampling process in reproducing the intended input characteristics with high precision.
An expanded example of the verification process is provided using the “Body Weight-Adult (kg)” variable. Figure 2 shows the output distribution, where the input mean (72 kg) aligns closely with the calculated mean (~72.02 kg). The calculated standard deviation (15.91 kg) also closely matches the input standard deviation (15.9 kg). The standard error of the mean, calculated as the standard deviation of the sample divided by the square root of the number of realizations, is minimal at 0.050 kg. These statistics, alongside the low SEM, reinforce the accuracy of the sampling process for this parameter.
In addition to Figure 2, Figure 3 shows a quantile–quantile (Q-Q) plot for body weights, demonstrating the alignment of the simulation data with the theoretical quantiles. This visual confirmation supports the goodness-of-fit for the assumed normal distribution of the “Body Weight-Adult (kg)” variable and further verifies the accuracy of the Monte Carlo sampling process for this input parameter.
Another example of verification is provided for the “Exposure Duration (years)” parameter in the child scenario. Figure 4 shows the output distribution, where the input minimum (1 year) and maximum (6 years) match the calculated values. Figure 5 presents a Q-Q plot, demonstrating a strong linear alignment between the simulated data and theoretical quantiles. Together, these figures confirm that the Monte Carlo simulation reliably reproduces the characteristics of the uniform distribution.
The Monte Carlo simulations were also verified by comparing the model outputs with independent calculations performed in a spreadsheet. Intermediate results for specific percentiles, such as the maximum cumulative risk, were printed from the Monte Carlo simulation code and cross-validated with manually derived results in the spreadsheet. For example, the maximum cumulative risk calculated using the simulation matched the manual calculation down to a negligible difference (Δ = −1.11 × 10¹⁴), which is consistent with round-off errors inherent in numerical computations. Each calculated risk, whether from benzene, formaldehyde, or benzo(a)pyrene exposure via different pathways (air, water, soil), showed no difference between the simulated and manually calculated risks, highlighting the exactness of the simulation’s algorithm in processing and integrating complex exposure data.
This verification process establishes the reliability and precision of the Monte Carlo simulations, demonstrating their suitability for academic research and practical applications in environmental health risk assessments. By confirming alignment with input parameters and manual calculations, the model provides a robust foundation for conducting comprehensive risk analyses. This ensures that the simulation outputs can reliably inform public health policy and intervention strategies, supporting efforts to mitigate exposure risks and prioritize vulnerable populations.
Figure 6 provides a visual breakdown of the stochastic risk characterization process, illustrating the progression from sensitivity analysis and variable distributions through random sampling, iterative calculations, and results aggregation, leading to verification and final decision-making.

3. Results

3.1. Case Study

This case study demonstrates the application of the stochastic risk modeling method in assessing the health risks from MSATs near a high-traffic roadway.
This case study was conducted on the high-traffic roadway segments located at the junction of Interstate-35E, Interstate-94, and US-10 in Saint Paul, MN, USA. This location was selected due to the availability of data and past work [2]. These segments, identified by sequence number 11508 in the Traffic Mapping Application [43], provided 2019 traffic data for this analysis. The study area, centered at coordinates 44°57′2.50″ N, 93°5′54.60″ W, is known for having annual average daily traffic (AADT) volumes among the top 5% in Ramsey County, indicating a high traffic flow that may impact local air quality.
Figure 7 and Figure 8 display the location of these roadways and the AADT data, respectively. Figure 8 shows the AADT data from 1998 to 2022 [43], with a 3-year moving average applied to capture the long-term trends while minimizing short-term fluctuations. The Traffic Mapping Application, which integrates geographic information systems with traffic volume records, was utilized to identify the high-traffic roadway segments and provided all the traffic data for this analysis.
These traffic levels, which rank among the top 5% of AADT volumes in Ramsey County, lead to increased emissions of MSATs such as benzene, formaldehyde, and benzo(a)pyrene, all of which have been linked to serious health risks, including leukemia and cardiovascular diseases, as summarized in Table 1. These three MSATs were selected for modeling in this study due to their severe health impacts, their prevalence in the study area, and their notable contribution to air pollution near high-traffic roadways [2,6,7,9,10]. While these pollutants represent only a fraction of the total MSATs, they pose substantial health risks, making them critical targets for risk assessment and regulatory actions.
Increased concentrations of these MSATs in urban environments result in measurable public health burdens [6,7,9,10], particularly for vulnerable populations, including children, the elderly, and individuals with pre-existing health conditions, who are more susceptible to the adverse effects of air pollutants. This case study provides a foundation for stochastic investigations into environmental exposures to MSATs, enabling a more precise quantification of the health risks and the identification of high-risk groups. Additionally, it enhances the understanding of the variability and uncertainty in exposure data, which can inform risk management strategies in public health interventions and policy decisions. These efforts are important in high-traffic urban areas, where the cumulative impacts of air pollution are most pronounced and require targeted mitigation efforts.

3.2. Deterministic Risk Results

The deterministic cumulative and multi-pathway cancer risk estimates for MSATs exposure in both adults and children are presented in this section. These results, calculated from the deterministic model described in the Methodology section, focus on benzene, formaldehyde, and benzo(a)pyrene due to their significant health impacts and prevalence in the study area. Table 7 and Table 8 provide a breakdown of the cancer risk by exposure pathway (inhalation, water ingestion, and soil ingestion) for each MSAT. Any cases where the risk values exceed the regulatory thresholds, as discussed in Section 2.5, are indicated with “Yes” (exceeds) or “No” (does not exceed) in the respective tables.
Both the cumulative and multi-pathway cancer risks, 6.24E-02 for adults and 2.30E-02 for children, exceed the established regulatory thresholds at the study site in Saint Paul, Minnesota, based on the 2019 data.
To further contextualize these cancer risk estimates, the adult cancer risk of 6.24E-02 (approximately 1 in 16) is elevated relative to regulatory thresholds but remains lower than the lifetime odds of dying from heart disease, which is 1 in 6. For children, the cancer risk estimate of 2.30E-02 (roughly 1 in 43) is comparable to the odds of dying from an accidental opioid overdose (1 in 55). These comparisons are based on the lifetime odds of death from selected causes in the United States [44].

3.3. Stochastic Risk Results

This section presents the stochastic cumulative and multi-pathway cancer risk estimates for MSAT exposure in both adults and children, derived from Monte Carlo simulations. Unlike the deterministic approach, which provides a single-point estimate, the stochastic analysis captures the variability and uncertainty inherent in the risk assessment process. The results include probabilistic ranges for individual MSATs and cumulative multi-pathway risks for adults and children, offering a more comprehensive characterization of key drivers and risk distributions.
Table 9 shows the multi-pathway stochastic cancer risk estimates for individual MSATs (benzene, formaldehyde, and benzo(a)pyrene) in adults and children. The table displays key percentiles (p5, p50, p95) from the cumulative and multi-pathway cancer risk distributions. The fifth percentile (p5) represents the lower bound, indicating where only 5% of the simulated risk values fall below this level. The median (p50) denotes the central tendency of the distribution, while the 95th percentile (p95) reflects the upper bound, often used as a conservative estimate of high-risk scenarios.
Based on the individual MSAT estimates, Table 10 presents the cumulative and multi-pathway stochastic cancer risk estimates for adults and children, showing the combined impact of MSAT exposure. Cumulative risk is the total cancer risk from exposure to multiple MSATs and emission sources, whereas multi-pathway risk accounts for contributions from different exposure routes, such as inhalation and ingestion.
The stochastic risk estimates provide a range of potential risk outcomes, in contrast to the point estimates from the deterministic approach. For adults, the 95th percentile cumulative risk is 4.98E-02, suggesting a potential upper bound of risk that is substantial and close to the deterministic estimate of 6.24E-02. Similarly, for children, the 95th percentile risk is 2.28E-02, reflecting variability while confirming the high-risk level indicated by the deterministic estimate of 2.30E-02. Notably, the median (p50) stochastic estimates are lower than the deterministic values for both adults and children, reflecting the conservative nature of deterministic methods, which rely on upper-bound assumptions [35].
To represent the spread and variability in the cumulative risk estimates, Figure 9 and Figure 10 show the relative frequency density (as an empirical approximation of the PDF) alongside the cumulative probability distribution for both adult and child scenarios. These figures demonstrate how the stochastic risk distributions extend beyond deterministic estimates, providing a more comprehensive view of the potential health impacts of exposures to MSATs.
The relative frequency density plots for both the adult and child scenarios in Figure 9 and Figure 10 show the spread and variability in the cumulative cancer risk estimates. The shaded regions between the dashed 5th and 95th percentile lines visually emphasize the range where the majority of the simulated risks fall, while the dashed lines themselves mark precise thresholds. Together, these elements illustrate both the variability and provide key reference points critical for interpreting the stochastic risk estimates. The inclusion of the percentile lines (5th, 50th, and 95th) aligns with the risk estimates in Table 9 and Table 10. The 95th percentiles are emphasized as they represent the upper bound of the risk scenarios, which are critical for regulatory benchmarks and health risk assessments, especially in identifying high-risk subpopulations.
The cumulative probability plots complement the relative frequency density plots by showing the likelihood of the risk estimates falling below various thresholds, with the cancer threshold line marking the key decision-making points. The log scale used in both plots accommodates the broad range of simulated risk values, allowing for clearer distinctions between the lower and higher-risk levels that might otherwise be compressed on a linear scale. The drop-off at the upper end of the cumulative probability plots occurs because the probability becomes low for higher risk values, even with 100,000 realizations. This drop-off behavior reflects the reduced likelihood of extreme outcomes in stochastic modeling while capturing the full range of variability.

4. Discussion

4.1. Cancer Risk Drivers

The cancer risk estimates reveal that benzo(a)pyrene is the dominant risk driver (contribution 4 in Section 1.4) for both adults and children. Its significantly higher CSF of 7.3 (mg/kg-day)−1 (see Table 5 for the pollutants’ CSF and URF values), along with its environmental persistence and bioaccumulation potential [45], leads to elevated multi-pathway risks, particularly from the water ingestion pathway.
Water ingestion is the dominant contributor to risk for both benzo(a)pyrene and benzene. Inhalation serves as a secondary contributor to risk for these compounds. For formaldehyde, inhalation remains the major risk contributor. Its contribution through ingestion pathways is minimal due to its lower CSF of 1.3 × 10⁵ (mg/kg-day)−1. Soil ingestion contributes minimally to the overall cancer risk for all of the modeled compounds. However, in children, its contribution is slightly higher due to behaviors such as hand-to-mouth activity and their lower body weight, which increases the relative dose.

4.2. Comparison of Adults to Children

The adult cancer risk is notably higher than the child cancer risk, primarily due to the longer exposure duration assumed for adults (30 years versus 6 years for children). Despite this, benzo(a)pyrene remains the primary contributor to elevated risks in both populations, driven by its potent carcinogenicity and contributions from both inhalation and water ingestion pathways.

4.3. Necessity of a Cumulative Risk Assessment

A cumulative risk assessment is essential to understanding the combined exposure burden from multiple MSATs across various pathways. While the cancer risk from individual MSATs like benzene, formaldehyde, and benzo(a)pyrene may fall below the regulatory thresholds when they are evaluated separately, their combined exposure often exceed these thresholds, as demonstrated by the cumulative risk estimates in Table 10. For example, the 50th percentile stochastic risk for formaldehyde (children scenario) is 2.11E-06, below the regulatory threshold of 1E-05, but the cumulative risks for both adults and children exceed these limits, highlighting the additive burden of combined exposures.
Children are particularly vulnerable due to their developing physiology, increased exposure rates, and behaviors such as outdoor play, which elevate their contact with pollutants. As shown in Table 10, the cumulative cancer risks for children exceed the regulatory thresholds, emphasizing the need to address health disparities among subgroups with heightened susceptibility.
By capturing the additive impacts of exposures across pollutants and pathways, cumulative risk assessments provide a more realistic representation of health risks. Traditional assessments focusing on individual pollutants fail to account for these combined effects, potentially underestimating the true public health burden. This study demonstrates that stochastic modeling enhances the cumulative risk characterization by incorporating variability, providing actionable insights for targeted interventions, particularly for high-risk groups like children and the elderly in high-traffic urban areas.

4.4. Evaluation of Realistic and Unrealistic Exposure Pathways

The water ingestion pathway significantly contributes to the calculated cancer risks but does not reflect the realistic conditions in the urban, commercially zoned case study area. Its intentional inclusion demonstrates the methodology’s flexibility and adaptability in evaluating diverse exposure pathways, as recommended by the HHRAP.
Despite influencing the overall calculated cancer risk estimates derived from the model, the water ingestion pathway serves as a methodological example rather than a real-world impact. If the pathway does not exist in the study area, the associated risk does not occur, emphasizing the need to interpret risks within the context of realistic exposure scenarios and localized environmental conditions for accurate and actionable conclusions.

4.5. Comparing Stochastic and Deterministic Models: Outcomes, Pros, and Cons

This section compares deterministic and stochastic models, highlighting their key differences, advantages, and limitations in risk assessment, as summarized in Table 11.
Stochastic modeling for MSATs addresses the limitations of the deterministic methods by generating probabilistic outputs that reflect the variability across populations and exposure scenarios. These outputs, such as cumulative distribution functions, facilitate the identification of high-risk scenarios and support effective interventions, including emission control strategies, urban zoning policies, and tailored public health initiatives for vulnerable populations.
Though stochastic modeling requires more computational resources, advances in parallel computing and cloud-based platforms mitigate this challenge, making it a viable option for comprehensive risk assessments. By providing a detailed characterization of variability and uncertainty, this approach equips practitioners with actionable insights to develop data-driven strategies for mitigating MSATs exposure risks.

5. Conclusions

This research addresses critical limitations of deterministic methods in human health risk assessments for MSATs by developing a stochastic method tailored to on-road mobile sources. Deterministic methods, reliant on point estimates, often overlook the variability among individuals and the vulnerabilities of sensitive subpopulations. In contrast, stochastic modeling provides a probabilistic framework that captures variability, enabling a comprehensive evaluation of health risks.
The key findings from this case study demonstrate that the stochastic modeling approach provides actionable insights. The deterministic method estimated cumulative cancer risks of 6.24E-02 for adults and 2.30E-02 for children. In contrast, the stochastic method provided a range of risk estimates, with the 95th percentile equal to 4.98E-02 for adults and 2.28E-02 for children. These findings demonstrate that the stochastic method for MSATs captures variability by simulating a distribution of cancer risk estimates, enabling consideration of worst-case scenarios and providing a realistic depiction of the variability.
The key contributions of this research are as follows:
  • Development of a Stochastic Method for Mobile Sources: This research introduces the first stochastic method extended and adapted to on-road mobile source emissions, which fills a critical gap in environmental health risk assessment by accounting for the variability in the MSAT exposures across population groups.
  • Incorporation of Spatiotemporal Dynamics for Enhanced Emission Characterization: This research incorporates hourly data on wind speeds, traffic patterns, and emissions to address the episodic and localized nature of mobile source exposures, improving upon the limitations of annual averages with dynamic and refined risk assessments.
  • Advancement of Public Health Strategies for Vulnerable Populations: This work provides actionable insights for public health policies, facilitating the identification of high-risk zones and enabling targeted interventions to reduce MSAT exposure risks in urban environments.
In conclusion, the stochastic method for MSATs advances human health risk assessment by addressing variability and offering a refined framework, as detailed in this section.

6. Future Work and Applications

Building on this research, several avenues for future studies and practical applications are recommended to improve public health outcomes and enhance air quality:
  • Development of health index metrics: Create composite health indices to integrate the impacts of multiple MSATs and exposure pathways, providing a holistic measure of risk.
  • Exploration of indoor–outdoor air interactions: Investigate how outdoor air quality influences the indoor pollutant levels in sensitive environments such as homes, schools, and workplaces. Understanding the interaction between outdoor infiltration and indoor emissions is essential for addressing complex exposure patterns and refining risk assessments.
  • Characterization of indoor pollutant sources: Use stochastic methods to analyze indoor emissions and evaluate cumulative exposures. Understanding these is vital for total health risk assessment, as individuals spend most of their time indoors.
  • Ecological applications: Expand stochastic modeling to evaluate the ecological risks from mobile emissions, improving predictions of environmental outcomes and supporting ecosystem management strategies.

Author Contributions

Conceptualization: M.M., J.V.G.T. and R.F. Data curation: M.M. Formal analysis: M.M. Funding acquisition: J.V.G.T. Investigation: M.M. Methodology: M.M. Project administration: J.V.G.T. and R.F. Resources: J.V.G.T. and R.F. Software: M.M. and J.V.G.T. Supervision: J.V.G.T. and R.F. Validation: M.M., J.V.G.T. and R.F. Visualization: M.M. Writing—original draft: M.M. Writing—review and editing: M.M., J.V.G.T. and R.F. All authors have read and agreed to the published version of the manuscript.

Funding

This research was funded by Lakes Environmental Research Inc., Canada.

Institutional Review Board Statement

Not applicable.

Informed Consent Statement

Not applicable.

Data Availability Statement

The data used in this study were sourced from open access repositories and are cited in this paper. The Monte Carlo simulation code is available for download via Microsoft OneDrive: https://1drv.ms/f/c/a99b5aaf821596ba/Eq23T5SuofJHpw1FLskFhRoBH5askBXImKymgE8brKDeWA (created on 24 December 2024).

Conflicts of Interest

The authors declare no conflicts of interest.

Abbreviations

The following abbreviations are used in this manuscript:
MSATsMobile Source Air Toxics (the focus of this study)
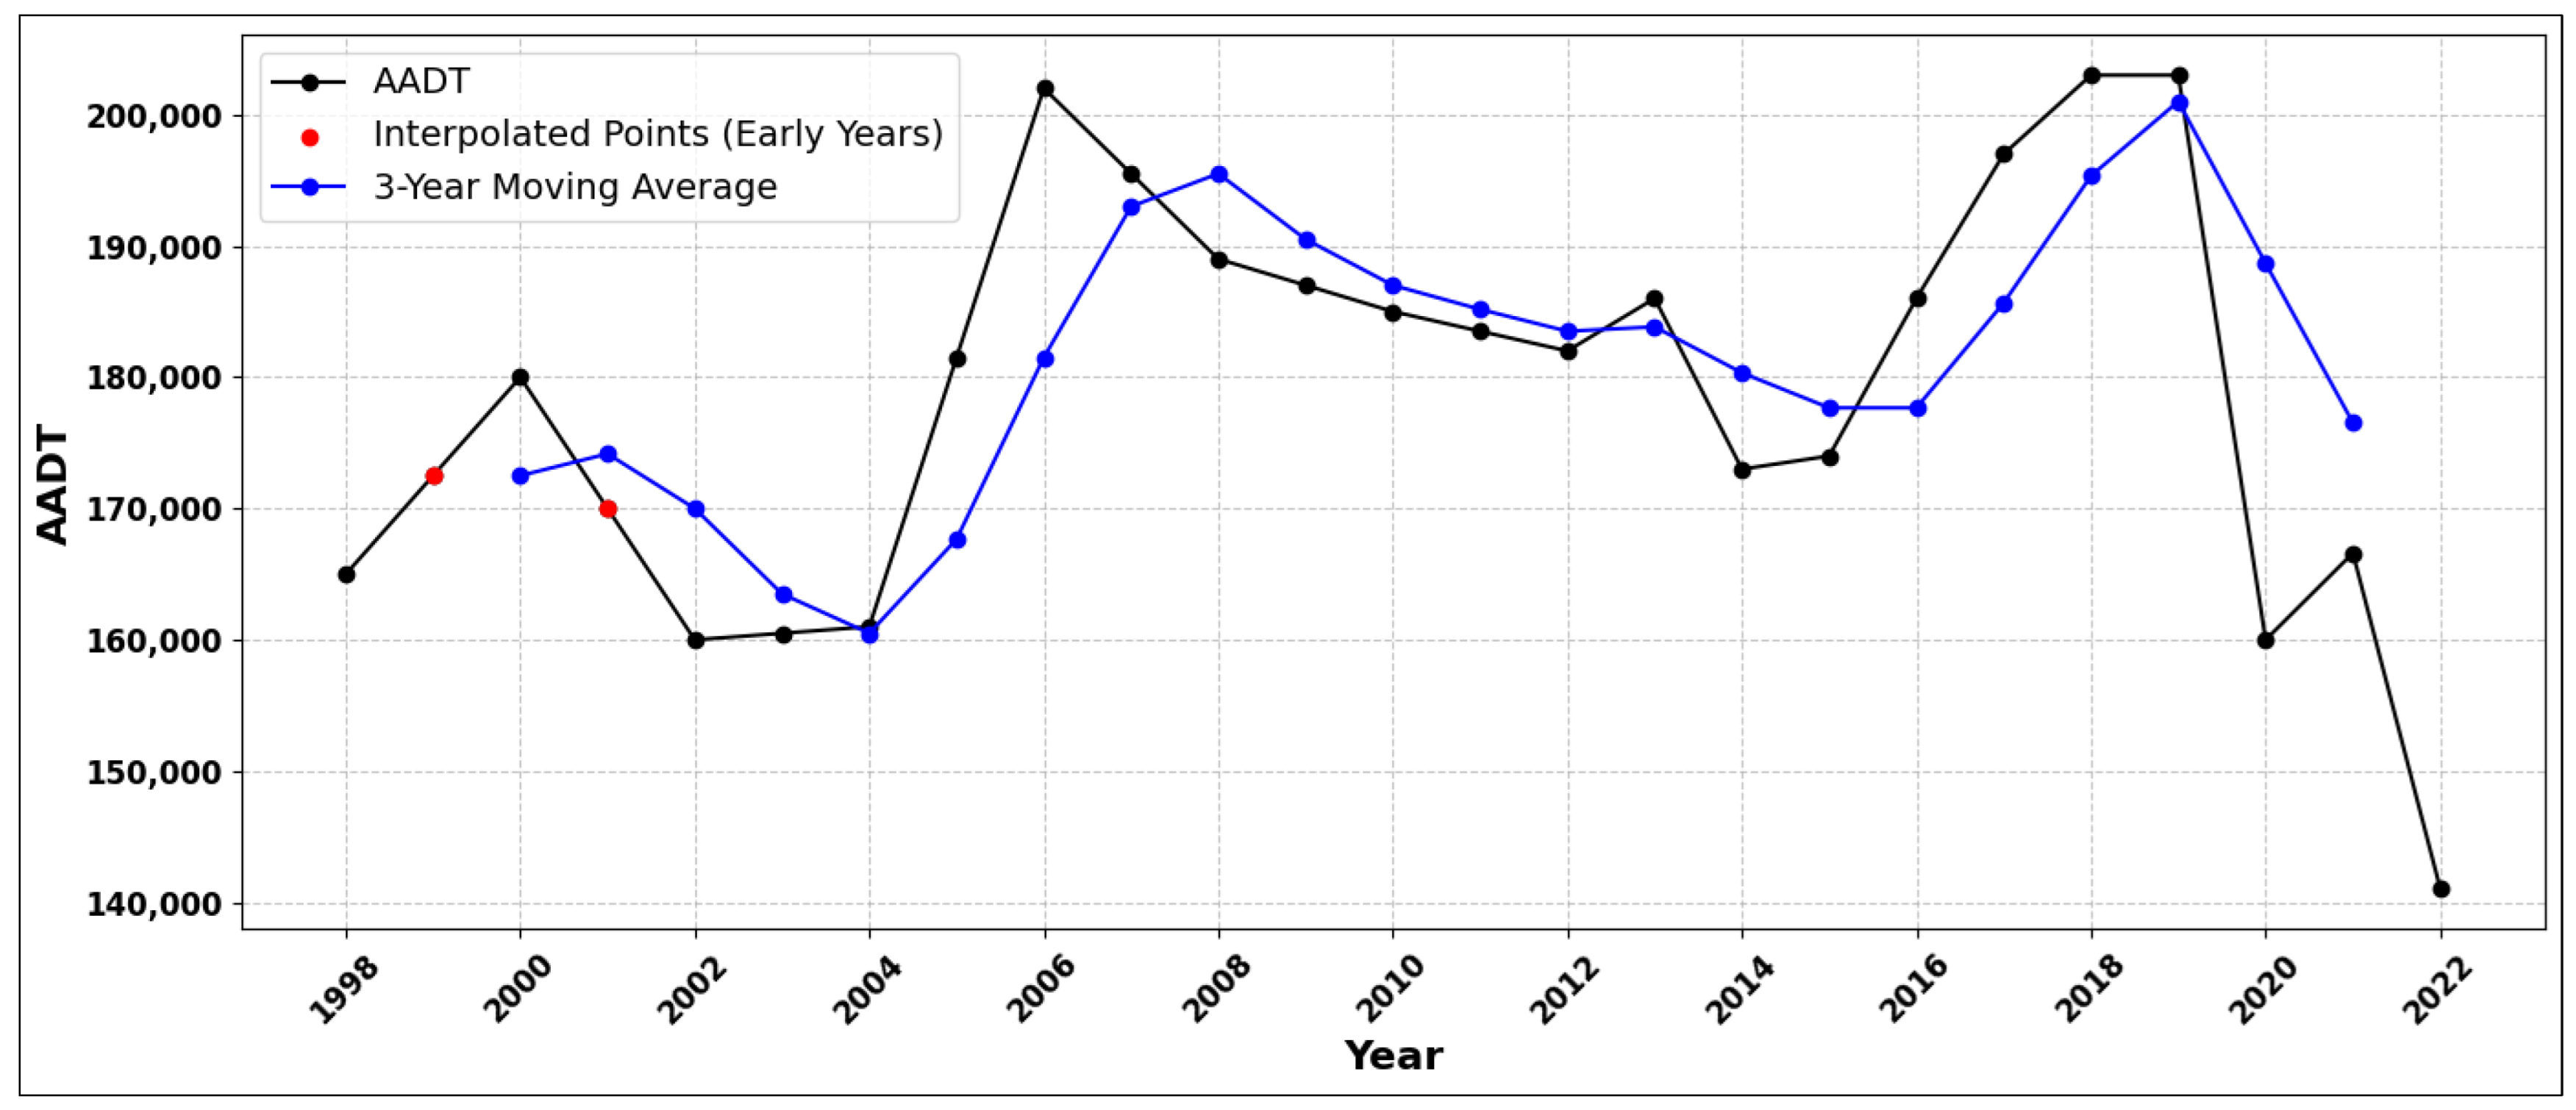
AADTAnnual Average Daily Traffic
ADDAverage Daily Dose
AirToxScreenAir Toxics Screening Assessment
CSFCancer Slope Factor
EPAUnited States Environmental Protection Agency
HHRAPHuman Health Risk Assessment Protocol
kgKilograms
L/dayLiters per Day
MOVESMOtor Vehicle Emission Simulator
PAHsPolycyclic Aromatic Hydrocarbons
PDFsProbability Density Functions
p5, p50, p95Percentiles 5th, 50th (median), and 95th
Q-Q plotQuantile–Quantile Plot
RAIMIRegional Air Impact Modeling Initiative
SDStandard Deviation
SEMStandard Error of the Mean
TRAQSTransportation Air Quality System
µg/m3Micrograms per Cubic Meter
URFUnit Risk Factor
WRFWeather Research and Forecasting

References

  1. U.S. Environmental Protection Agency. 2019 Air Toxics Screening Assessment. Available online: https://www.epa.gov/AirToxScreen/2019-airtoxscreen (accessed on 10 February 2024).
  2. Munshed, M.; Van Griensven Thé, J.; Fraser, R. Methodology for Mobile Toxics Deterministic Human Health Risk Assessment and Case Study. Atmosphere 2023, 14, 506. [Google Scholar] [CrossRef]
  3. Health Effects Institute. Mobile-Source Air Toxics: A Critical Review of the Literature on Exposure and Health Effects; Health Effects Institute: Boston, MA, USA, 2007. [Google Scholar]
  4. U.S. Environmental Protection Agency. The Master List of Compounds Emitted by Mobile Sources—2006; U.S. Environmental Protection Agency: Washington, DC, USA, 2006.
  5. Munshed, M.; Van, J.; Fraser, R.; Matthews, B.; Elkamel, A. Country-Wide Ecological Health Assessment Methodology for Air Toxics: Bridging Gaps in Ecosystem Impact Understanding and Policy Foundations. Toxics 2024, 12, 42. [Google Scholar] [CrossRef]
  6. Zhou, Y.; Li, C.; Huijbregts, M.A.J.; Mumtaz, M.M. Carcinogenic Air Toxics Exposure and Their Cancer-Related Health Impacts in the United States. PLoS ONE 2015, 10, e0140013. [Google Scholar] [CrossRef] [PubMed]
  7. Pearson, R.L.; Wachtel, H.; Ebi, K.L. Distance-Weighted Traffic Density in Proximity to a Home Is a Risk Factor for Leukemia and Other Childhood Cancers. J. Air Waste Manag. Assoc. 2000, 50, 175–180. [Google Scholar] [CrossRef]
  8. Silverman, D.T. Diesel Exhaust Causes Lung Cancer: Now What? Occup. Environ. Med. 2017, 74, 233–234. [Google Scholar] [CrossRef] [PubMed]
  9. Kang, D.S.; Kim, H.S.; Jung, J.-H.; Lee, C.M.; Ahn, Y.-S.; Seo, Y.R. Formaldehyde Exposure and Leukemia Risk: A Comprehensive Review and Network-Based Toxicogenomic Approach. Genes Environ. 2021, 43, 13. [Google Scholar] [CrossRef] [PubMed]
  10. Mallah, M.A.; Mallah, M.A.; Liu, Y.; Xi, H.; Wang, W.; Feng, F.; Zhang, Q. Relationship between Polycyclic Aromatic Hydrocarbons and Cardiovascular Diseases: A Systematic Review. Front. Public Health 2021, 9, 763706. [Google Scholar] [CrossRef] [PubMed]
  11. Strum, M.; Scheffe, R. National Review of Ambient Air Toxics Observations. J. Air Waste Manag. Assoc. 2015, 66, 120–133. [Google Scholar] [CrossRef]
  12. Galarneau, E.; Wang, D.; Dabek-Zlotorzynska, E.; Siu, M.; Celo, V.; Tardif, M.; Harnish, D.; Jiang, Y. Air Toxics in Canada Measured by the National Air Pollution Surveillance (NAPS) Program and Their Relation to Ambient Air Quality Guidelines. J. Air Waste Manag. Assoc. 2015, 66, 184–200. [Google Scholar] [CrossRef]
  13. Cook, R.; Isakov, V.; Touma, J.S.; Benjey, W.; Thurman, J.; Kinnee, E.; Ensley, D. Resolving Local-Scale Emissions for Modeling Air Quality near Roadways. J. Air Waste Manag. Assoc. 2008, 58, 451–461. [Google Scholar] [CrossRef]
  14. Kingsley, S.L.; Eliot, M.N.; Carlson, L.; Finn, J.; MacIntosh, D.L.; Suh, H.H.; Wellenius, G.A. Proximity of US Schools to Major Roadways: A Nationwide Assessment. J. Expo. Sci. Environ. Epidemiol. 2014, 24, 253–259. [Google Scholar] [CrossRef]
  15. Karner, A.A.; Eisinger, D.S.; Niemeier, D.A. Near-Roadway Air Quality: Synthesizing the Findings from Real-World Data. Environ. Sci. Technol. 2010, 44, 5334–5344. [Google Scholar] [CrossRef]
  16. Brugge, D.; Durant, J.L.; Rioux, C. Near-Highway Pollutants in Motor Vehicle Exhaust: A Review of Epidemiologic Evidence of Cardiac and Pulmonary Health Risks. Environ. Health 2007, 6, 23. [Google Scholar] [CrossRef] [PubMed]
  17. Whaley, C.H.; Galarneau, E.; Makar, P.A.; Moran, M.D.; Zhang, J. How Much Does Traffic Contribute to Benzene and Polycyclic Aromatic Hydrocarbon Air Pollution? Results from a High-Resolution North American Air Quality Model Centred on Toronto, Canada. Atmos. Chem. Phys. 2020, 20, 2911–2925. [Google Scholar] [CrossRef]
  18. Office of Air Quality Planning and Standards. Air Toxics Risk Assessment Reference Library: Volume 3—Community-Scale Assessment; U.S. Environmental Protection Agency: Durham, NC, USA, 2006.
  19. Minnesota Pollution Control Agency. MNRISKS: Minnesota Statewide Screening of Health Risks from Air Pollution; Minnesota Pollution Control Agency: Saint Paul, MN, USA, 2023. [Google Scholar]
  20. Bruce, E.D.; Abusalih, A.A.; McDonald, T.J.; Autenrieth, R.L. Comparing Deterministic and Probabilistic Risk Assessments for Sites Contaminated by Polycyclic Aromatic Hydrocarbons (PAHs). J. Environ. Sci. Health Part A 2007, 42, 697–706. [Google Scholar] [CrossRef]
  21. Iqbal, A.; Afroze, S.; Rahman, M.M. Probabilistic Health Risk Assessment of Vehicular Emissions as an Urban Health Indicator in Dhaka City. Sustainability 2019, 11, 6427. [Google Scholar] [CrossRef]
  22. Widiana, D.R.; Wang, Y.C.; You, S.J.; Wang, Y.F. Source Apportionment and Health Risk Assessment of Ambient Volatile Organic Compounds in Primary Schools in Northern Taiwan. Int. J. Environ. Sci. Technol. 2018, 16, 6175–6188. [Google Scholar] [CrossRef]
  23. Jiménez-Oyola, S.; Chavez, E.; García-Martínez, M.-J.; Ortega, M.F.; Bolonio, D.; Guzmán-Martínez, F.; García-Garizabal, I.; Romero, P. Probabilistic Multi-Pathway Human Health Risk Assessment due to Heavy Metal(Loid)S in a Traditional Gold Mining Area in Ecuador. Ecotoxicol. Environ. Saf. 2021, 224, 112629. [Google Scholar] [CrossRef] [PubMed]
  24. Ramesh, R.; Subramanian, M.; Lakshmanan, E.; Subramaniyan, A.; Ganesan, G. Human Health Risk Assessment Using Monte Carlo Simulations for Groundwater with Uranium in Southern India. Ecotoxicol. Environ. Saf. 2021, 226, 112781. [Google Scholar] [CrossRef]
  25. Jiménez-Oyola, S.; Escobar Segovia, K.; García-Martínez, M.-J.; Ortega, M.; Bolonio, D.; García-Garizabal, I.; Salgado, B. Human Health Risk Assessment for Exposure to Potentially Toxic Elements in Polluted Rivers in the Ecuadorian Amazon. Water 2021, 13, 613. [Google Scholar] [CrossRef]
  26. Redmon, J.H.; Kondash, A.J.; Womack, D.; Lillys, T.; Feinstein, L.; Cabrales, L.; Weinthal, E.; Vengosh, A. Is Food Irrigated with Oilfield-Produced Water in the California Central Valley Safe to Eat? A Probabilistic Human Health Risk Assessment Evaluating Trace Metals Exposure. Risk Anal. 2020, 41, 1463–1477. [Google Scholar] [CrossRef]
  27. Zhang, X.; Wang, X.; Zhao, X.; Tang, Z.; Zhao, T.; Teng, M.; Liang, W.; Wang, J.; Niu, L. Using Deterministic and Probabilistic Approaches to Assess the Human Health Risk Assessment of 7 Polycyclic Aromatic Hydrocarbons. J. Clean. Prod. 2022, 331, 129811. [Google Scholar] [CrossRef]
  28. Khoshakhlagh, A.H.; Gruszecka-Kosowska, A.; Adeniji, A.O.; Tran, L. Probabilistic Human Health Risk Assessment of 1,3-Butadiene and Styrene Exposure Using Monte Carlo Simulation Technique in the Carpet Production Industry. Sci. Rep. 2022, 12, 22103. [Google Scholar] [CrossRef] [PubMed]
  29. Panqing, Y.; Abliz, A.; Xiaoli, S.; Aisaiduli, H. Human Health-Risk Assessment of Heavy Metal–Contaminated Soil Based on Monte Carlo Simulation. Sci. Rep. 2023, 13, 7033. [Google Scholar] [CrossRef]
  30. Office of Transportation and Air Quality. MOVES4 Technical Guidance: Using MOVES to Prepare Emission Inventories for State Implementation Plans and Transportation Conformity; U.S. Environmental Protection Agency: Ann Arbor, MI, USA, 2023.
  31. U.S. Environmental Protection Agency. Air Quality Dispersion Modeling-Preferred and Recommended Models. Available online: https://www.epa.gov/scram/air-quality-dispersion-modeling-preferred-and-recommended-models (accessed on 3 March 2024).
  32. Cooper, C.D.; Alley, F.C. Air Pollution Control: A Design Approach; Waveland Press: Long Grove, IL, USA, 2011. [Google Scholar]
  33. Munshed, M. Mobile Toxics Human Health Risk Assessment Framework. Master’s Thesis, University of Waterloo, Waterloo, ON, Canada, 2018. Available online: https://uwspace.uwaterloo.ca/handle/10012/13293 (accessed on 15 January 2025).
  34. Skamarock, W.; Klemp, J.; Dudhia, J.; Gill, D.; Barker, D.; Duda, M.; Huang, X.; Wang, W.; Powers, J. A Description of the Advanced Research WRF Version 3; University Corporation for Atmospheric Research: Boulder, CO, USA, 2008. [Google Scholar]
  35. U.S. Environmental Protection Agency. Human Health Risk Assessment Protocol (HHRAP) for Hazardous Waste Combustion Facilities, Final; U.S. Environmental Protection Agency: Washington, DC, USA, 2005.
  36. Munshed, M.; Thé, J.; Fraser, R.; Matthews, B.; Ramadan, A. Extending Multi-Pathway Human Health Risk Assessment from Regional to Country-Wide—A Case Study on Kuwait. Atmosphere 2023, 14, 1247. [Google Scholar] [CrossRef]
  37. Region 6, U.S. EPA Multimedia Planning and Permitting Division. Region 6 Risk Management Addendum—Draft Human Health Risk Assessment Protocol for Hazardous Waste Combustion Facilities; U.S. Environmental Protection Agency: Dallas, TX, USA, 1998.
  38. Montshiwa, A. Optimizing Diamond Structured Automobile Supply Chain Network Towards a Robust Business Continuity Management. Int. J. Supply Oper. Manag. 2016, 2, 947–981. [Google Scholar] [CrossRef]
  39. Hamby, D.M. A Comparison of Sensitivity Analysis Techniques. Health Phys. 1995, 68, 195–204. [Google Scholar] [CrossRef] [PubMed]
  40. U.S. Environmental Protection Agency. Update for Chapter 5 of the Exposure Factors Handbook; U.S. Environmental Protection Agency: Washington, DC, USA, 2017. Available online: https://cfpub.epa.gov/ncea/risk/recordisplay.cfm?deid=337521 (accessed on 17 March 2024).
  41. U.S. Environmental Protection Agency. Update for Chapter 3 of the Exposure Factors Handbook; U.S. Environmental Protection Agency: Washington, DC, USA, 2019. Available online: https://cfpub.epa.gov/ncea/risk/recordisplay.cfm?deid=343661 (accessed on 17 March 2024).
  42. Rajasekhar, B.; Nambi, I.M.; Govindarajan, S.K. Human Health Risk Assessment of Ground Water Contaminated with Petroleum PAHs Using Monte Carlo Simulations: A Case Study of an Indian Metropolitan City. J. Environ. Manag. 2018, 205, 183–191. [Google Scholar] [CrossRef] [PubMed]
  43. Minnesota Department of Transportation. Traffic Forecasting & Analysis. Available online: https://www.dot.state.mn.us/traffic/data/tma.html (accessed on 23 April 2024).
  44. National Safety Council. Odds of Dying. Injury Facts. Available online: https://injuryfacts.nsc.org/all-injuries/preventable-death-overview/odds-of-dying/ (accessed on 7 September 2024).
  45. Bharathi, D.; Lee, J.; Vinayagam, Y.; Banerjee, M.; Ramanathan, G.; Al-Ansari, M.M.; Venkatraman, G. Benzopyrene Elimination from the Environment Using Graphitic Carbon Nitride-SnS Nanocomposites. Chemosphere 2024, 352, 141352. [Google Scholar] [CrossRef]
Figure 1. Urban resident exposure scenarios and associated exposure pathways.
Environments 12 00054 g001
Figure 2. Distribution of body weights, showing close alignment between the input mean (72 kg) and the calculated mean (~72.02 kg), along with their respective standard deviations (±1 standard deviation, SD).
Environments 12 00054 g002
Figure 3. Q-Q plot for body weights, showing the alignment of the simulation data with the theoretical quantiles. The red trend line represents the ideal fit for a theoretical normal distribution.
Environments 12 00054 g003
Figure 4. Distribution of exposure duration (years) for the child scenario, showing alignment between the input minimum (1 year) and maximum (6 years) and their respective calculated values.
Environments 12 00054 g004
Figure 5. Q-Q plot for exposure duration (years) for the child scenario, showing the alignment of the simulation data with theoretical quantiles. The red trend line represents the ideal fit for a uniform distribution.
Environments 12 00054 g005
Figure 6. Visual breakdown of the stochastic risk characterization process.
Environments 12 00054 g006
Figure 7. Map of the study area showing high-traffic roadways in Saint Paul, Minnesota. Red circles indicate traffic count points, with the blue marker identifying sequence number 11508 and the red box highlighting its location. Map data sourced from Esri Community Maps contributors, County of Ramsey, Metropolitan Council, MetroGIS, © OpenStreetMap, Microsoft, Esri, TomTom, Garmin, SafeGraph, GeoTechnologies, Inc., METI/NASA, USGS, EPA, NPS, US Census Bureau, USDA, and USFWS.
Environments 12 00054 g007
Figure 8. AADT at the study site with 3-year moving average. The 3-year moving average excludes the data points at the beginning (1998) and end (2022) due to insufficient data for a complete 3-year window. Linear interpolation was applied to estimate the missing data points in the early years (e.g., 1999 and 2001) to enable the calculation of a valid 3-year moving average.
Environments 12 00054 g008
Figure 9. Relative frequency density plot (a) and cumulative probability plot (b) for adult cumulative cancer risk estimates, showing a positively skewed distribution, distributional spread, and risk thresholds.
Environments 12 00054 g009
Figure 10. Relative frequency density plot (a) and cumulative probability plot (b) for child cumulative cancer risk estimates, showing a positively skewed distribution, distributional spread, and risk thresholds.
Environments 12 00054 g010
Table 1. Summary of health effects associated with MSATs exposure.
Mobile Source Air ToxicsHealth Effect(s)Reference
AcetaldehydeNose cancer[6]
BenzeneLeukemia[6]
Childhood leukemia *[7]
1,3-ButadieneLeukemia[6]
Diesel ExhaustLung cancer[8]
FormaldehydeNose and throat cancer[9]
Hexavalent Chromium (VI)Lung cancer[6]
NaphthaleneNose cancer[6]
PAHsCardiovascular diseases[10]
* Research indicates that even acute exposure to certain MSATs in high-traffic areas (≥20,000 vehicles per day) can increase the odds of childhood leukemia, with an odds ratio for leukemia of 8.28 (95% Confidence Interval [CI]: 2.09–32.80) [7].
Table 2. Examples of probabilistic methods in risk assessment literature.
StudyPollutant/
Emissions Source
MethodologyMulti-Pathway 1Cumulative 2Ref.
Comparing deterministic and probabilistic risk assessments for sites contaminated by polycyclic aromatic hydrocarbons (PAHs) (2007)PAHs from industrial contaminated sitesComparative analysis of deterministic and probabilistic risk assessment approaches for PAHs, incorporating Monte Carlo simulations to account for variability in exposure factors and sample heterogeneityNoYes[20]
Probabilistic Health Risk Assessment of Vehicular Emissions as an Urban Health Indicator in Dhaka City (2019)Nitrogen Oxides (NOx) from vehiclesProbabilistic emissions modeling using Monte Carlo simulation for NOx emissionsNoNo[21]
Source apportionment and health risk assessment of ambient volatile organic compounds in primary schools in Northern Taiwan (2019)Ambient volatile organic compounds (VOCs) in primary schoolsSource apportionment of VOCs via a principal component analysis and health risk assessment, enhanced by Monte Carlo simulations for uncertainty and sensitivity analysesNoYes[22]
Probabilistic multi-pathway human health risk assessment due to heavy metal(loid)s in a traditional gold mining area in Ecuador (2021)Heavy metal(loid)s (As, Cd, Cr, Cu, Ni, Pb, and Zn) from gold mining activitiesBayesian probabilistic approach to multi-pathway human health risk assessmentNoYes[23]
Human health risk assessment using Monte Carlo simulations for groundwater with uranium in southern India (2021)Uranium in groundwaterEvaluation of human health risks from uranium-contaminated groundwater via deterministic and probabilistic approaches (Monte Carlo simulations) with sensitivity analysisNoNo[24]
Human Health Risk Assessment for Exposure to Potentially Toxic Elements in Polluted Rivers in the Ecuadorian Amazon (2021)Potentially toxic elements in polluted rivers/Ecuadorian AmazonEvaluating multi-pathway human exposure to potentially toxic elements through deterministic and probabilistic methods, incorporating Monte Carlo simulation and sensitivity analysis for hazard index and total cancer risk assessmentNo 3Yes[25]
Is Food Irrigated with Oilfield-Produced Water in the California Central Valley Safe to Eat? A Probabilistic Human Health Risk Assessment Evaluating Trace Metals Exposure (2021)Trace metals in oilfield-produced water used for irrigating crops in California’s Central ValleyProbabilistic assessment of health risks from consuming crops irrigated with oilfield-produced water via Monte Carlo simulation of metal concentrations, crop uptake, and human exposureNoYes[26]
Using deterministic and probabilistic approaches to assess the human health risk assessment of 7 polycyclic aromatic hydrocarbons (2022)Seven carcinogenic PAHs from fossil fuel usageEvaluation of carcinogenic risks from seven polycyclic aromatic hydrocarbons using deterministic and probabilistic approaches with Monte Carlo simulations and a multimedia multi-pathway modelYesYes[27]
Probabilistic human health risk assessment of 1,3-butadiene and styrene exposure using Monte Carlo simulation technique in the carpet production industry (2022)Inhalational exposure to 1,3-butadiene and styrene among workers in carpet factoriesHuman health risk assessment based on inhalational exposure to 1,3-butadiene and styrene using Monte Carlo simulation for calculating carcinogenic risk and non-carcinogenic riskNoYes[28]
Human health-risk assessment of heavy metal–contaminated soil based on Monte Carlo simulation (2023)Heavy metals contamination in soil, focusing on Zn, Cu, Cr, Pb, and Hg from traffic, natural sources, coal, and industrial sourcesQuantitative health risk assessment of soil heavy metals for different populations using the Unmix model and Monte Carlo simulation for source apportionment and risk evaluationNoYes[29]
This work (2025)Air toxics from on-road mobile sourcesStochastic risk assessment method for MSATs, incorporating spatiotemporal dynamics and variability analysisYesYes
1 Multi-Pathway: Indicates if multiple exposure pathways (e.g., inhalation, ingestion, dermal contact) were considered in the study. 2 Cumulative: Denotes whether the study conducted a cumulative risk assessment of multiple pollutants or sources. 3 The inhalation exposure pathway was not evaluated in this study.
Table 3. Evaluated exposure pathways associated with urban resident adult and urban resident child scenarios.
Exposure Pathways
Inhalation of vapors and particles
Incidental ingestion of soil
Ingestion of drinking water from treated surface water sources
Table 4. Exposure variables used in deterministic risk characterization [35].
Variable (Unit)Point Estimate *
Exposure Frequency,
Adult and Child (day/year)
350
Body Weight,
Adult (kg)
70
Body Weight,
Child (kg)
15
Exposure Duration,
Adult (year)
30
Exposure Duration,
Child (year)
6
Consumption Rate of Soil,
Adult (kg/day)
1 × 10⁻⁴
Consumption Rate of Soil,
Child (kg/day)
2 × 10⁻⁴
Drinking Water Consumption Rate,
Adult (L/day)
1.4
Drinking Water Consumption Rate,
Child (L/day)
0.67
* All variable values in this table were adopted from the EPA’s HHRAP, “Appendix C: Risk Characterization Equations”, which provides recommended defaults for use in risk assessments when site-specific data are unavailable.
Table 5. URFs and CSFs used for cancer risk calculations of MSATs modeled in this study.
MSATsURF (µg/m3)−1CSF
(mg/kg-day)−1
Reference
Benzene7.8 × 105.5 × 10²EPA’s HHRAP Companion Database [35]
Formaldehyde1.3 × 101.3 × 10
Benzo(a)pyrene1.1 × 10³7.3
Table 6. Distributions and parameters for key exposure variables in stochastic risk assessment (based on peer-reviewed literature [20,25,40,41]).
VariableDistributionParameters
Exposure Frequency,
Adult and Child (day/year)
TriangularMinimum = 180, Maximum = 365,
Likeliest = 345
Body Weight,
Adult (kg)
NormalMean = 72, Standard Deviation = 15.9
Body Weight,
Child (kg)
NormalMean = 15.6, Standard Deviation = 3.7
Exposure Duration,
Adult (year)
LognormalMean = 11.36, Standard Deviation = 13.72
Exposure Duration,
Child (year)
UniformMinimum = 1, Maximum = 6
Consumption Rate of Soil,
Adult (kg/day)
LognormalCentral Tendency * = 1 × 10⁻⁵, Upper Percentile * = 5 × 10⁻⁵
Consumption Rate of Soil,
Child (kg/day)
LognormalCentral Tendency = 3 × 10⁻⁵, Upper Percentile = 9 × 10⁻⁵
Drinking Water Consumption Rate,
Adult (L/day)
LognormalMedian = 0.5020, Upper Percentile = 2.906
Drinking Water Consumption Rate,
Child (L/day)
LognormalMedian = 0.1110, Upper Percentile = 1.069
* Note: “Central Tendency” refers to the 50th percentile, and “Upper Percentile” refers to the 95th percentile.
Table 7. Cancer risk estimates for adults at the study site in Saint Paul, Minnesota, based on 2019 model results, with regulatory threshold exceedance (values represent unitless lifetime cancer risk).
Risk from Exposure Pathways
MSATsInhalationWater IngestionSoil IngestionMulti-Pathway
Risk
Exceeds Regulatory
Threshold
Benzene1.30E-054.53E-043.23E-084.66E-04Yes
Formaldehyde2.18E-051.07E-077.64E-122.19E-05Yes
Benzo(a)pyrene1.81E-036.01E-024.29E-066.19E-02Yes
Cumulative Risk---6.24E-02Yes
Table 8. Cancer risk estimates for children at the study site in Saint Paul, Minnesota, based on 2019 model results, with regulatory threshold exceedance (values represent unitless lifetime cancer risk).
Risk from Exposure Pathways
MSATsInhalationWater IngestionSoil IngestionMulti-Pathway
Risk
Exceeds Regulatory
Threshold
Benzene2.63E-061.69E-047.77E-081.72E-04Yes
Formaldehyde4.35E-063.99E-081.83E-114.39E-06Yes
Benzo(a)pyrene3.63E-042.24E-021.03E-052.28E-02Yes
Cumulative Risk---2.30E-02Yes
Table 9. Multi-pathway stochastic cancer risk estimates (unitless) for adults and children from individual MSATs at the study site in Saint Paul, Minnesota, based on 2019 model results and 100,000 realizations.
MSATs/Scenario Adults Children
Percentile (p5) Median (p50) Percentile (p95) Percentile (p5) Median (p50) Percentile (p95)
Benzene4.04E-063.60E-053.72E-042.16E-061.60E-051.70E-04
Formaldehyde9.04E-074.44E-062.13E-057.55E-072.11E-063.78E-06
Benzo(a)pyrene5.41E-044.79E-034.94E-022.92E-042.13E-032.26E-02
Table 10. Stochastic cancer risk estimates (unitless) for adults and children at the study site in Saint Paul, Minnesota, based on 2019 model results. All values represent estimates of cumulative and multi-pathway cancer risk from MSAT exposure.
Scenario Percentile (p5) Median (p50) Percentile (p95)
Adults5.47E-044.84E-034.98E-02
Children2.95E-042.14E-032.28E-02
Table 11. Differences between stochastic and deterministic risk models.
CriterionDeterministic ModelStochastic Model
OutputSingle-point risk estimateProbabilistic range of risk estimates
Variability CapturedNo, uses fixed parameter valuesYes, reflects real-world variability
Analytical ScopeWorst-case or average exposure scenariosExplores the full range of variability and identifies high-risk scenarios (e.g., 95th percentile)
Ease of InterpretationSimple to interpret for practitionersAccessible to practitioners (e.g., air quality engineers, risk analysts, regulators, and policymakers) through visualizations like cumulative distribution functions
Computational NeedsLimited computational resources
required
Requires considerable computational resources
Decision-MakingLimited insights for vulnerable populations or worst-case scenariosSupports targeted interventions and effective decision-making
Disclaimer/Publisher’s Note: The statements, opinions and data contained in all publications are solely those of the individual author(s) and contributor(s) and not of MDPI and/or the editor(s). MDPI and/or the editor(s) disclaim responsibility for any injury to people or property resulting from any ideas, methods, instructions or products referred to in the content.

