
Microbial Contamination and Sterilization Methods in an Air Circulation-Type Geothermal Ventilation System

Abstract
:1. Introduction
2. Materials and Methods
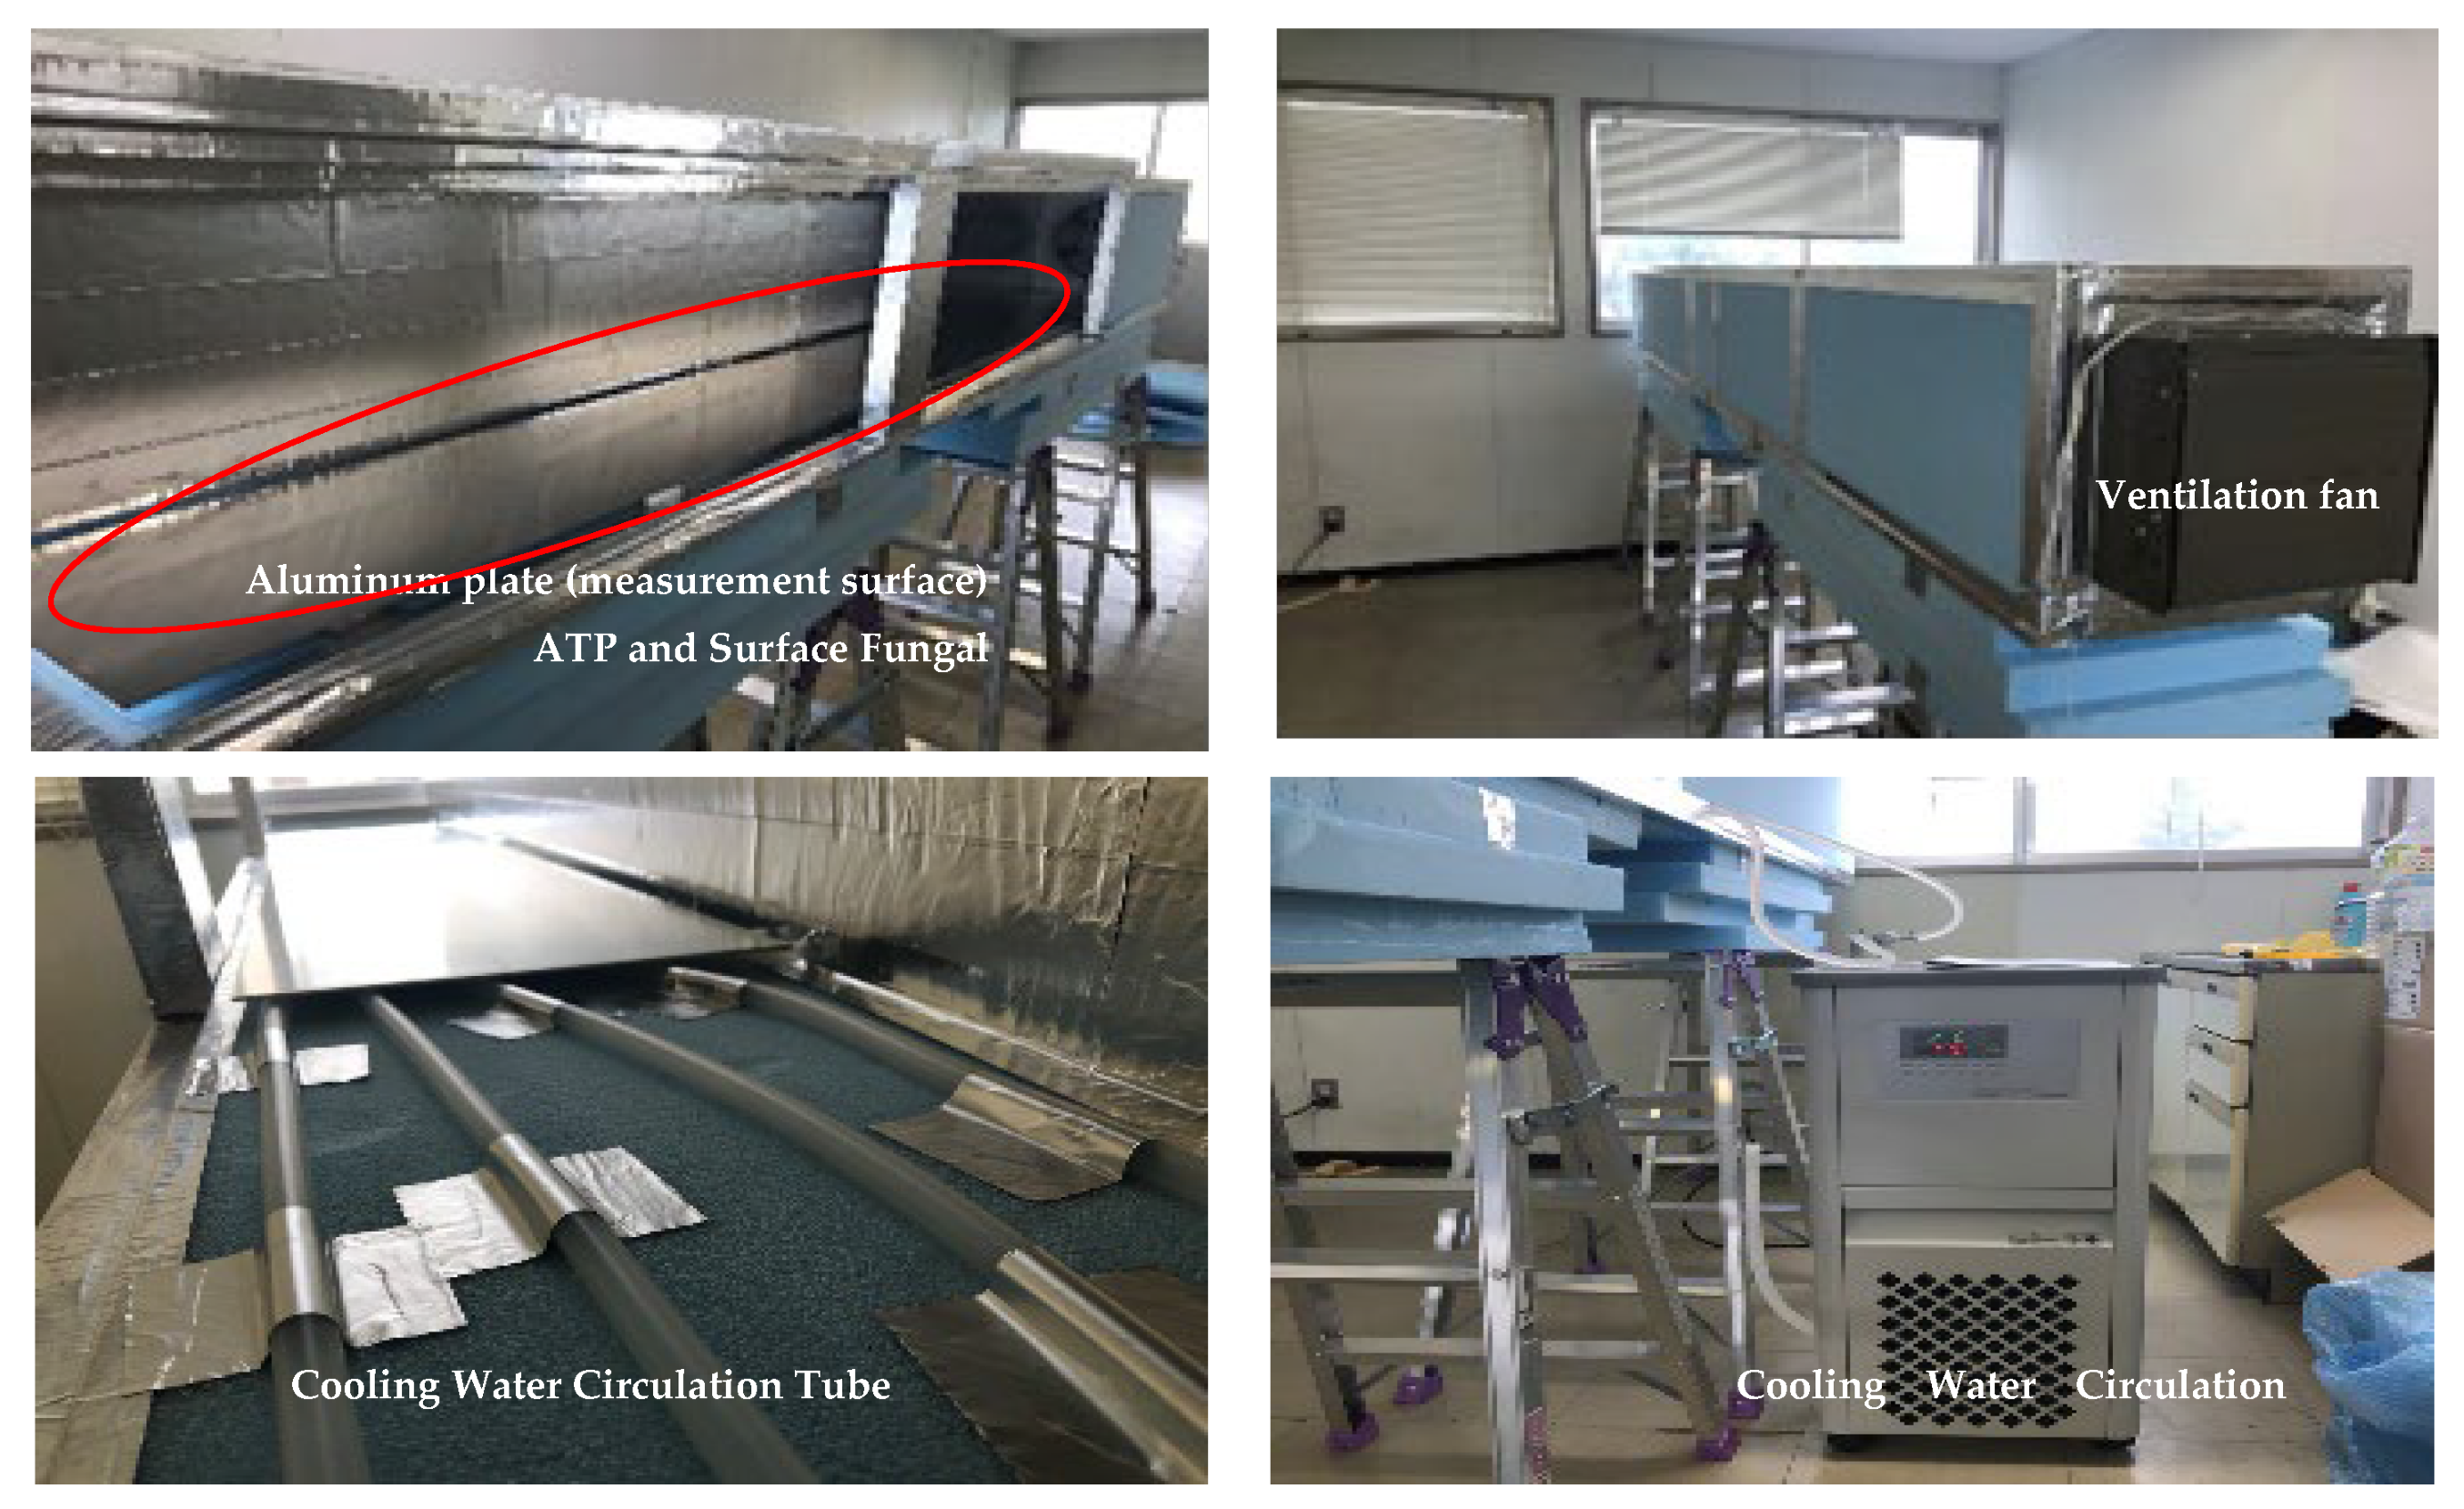
3. Measurement Overview
3.1. Measurement Conditions
3.2. Measurement Methods
- (1)
- Airborne Fungal Concentration
- (2)
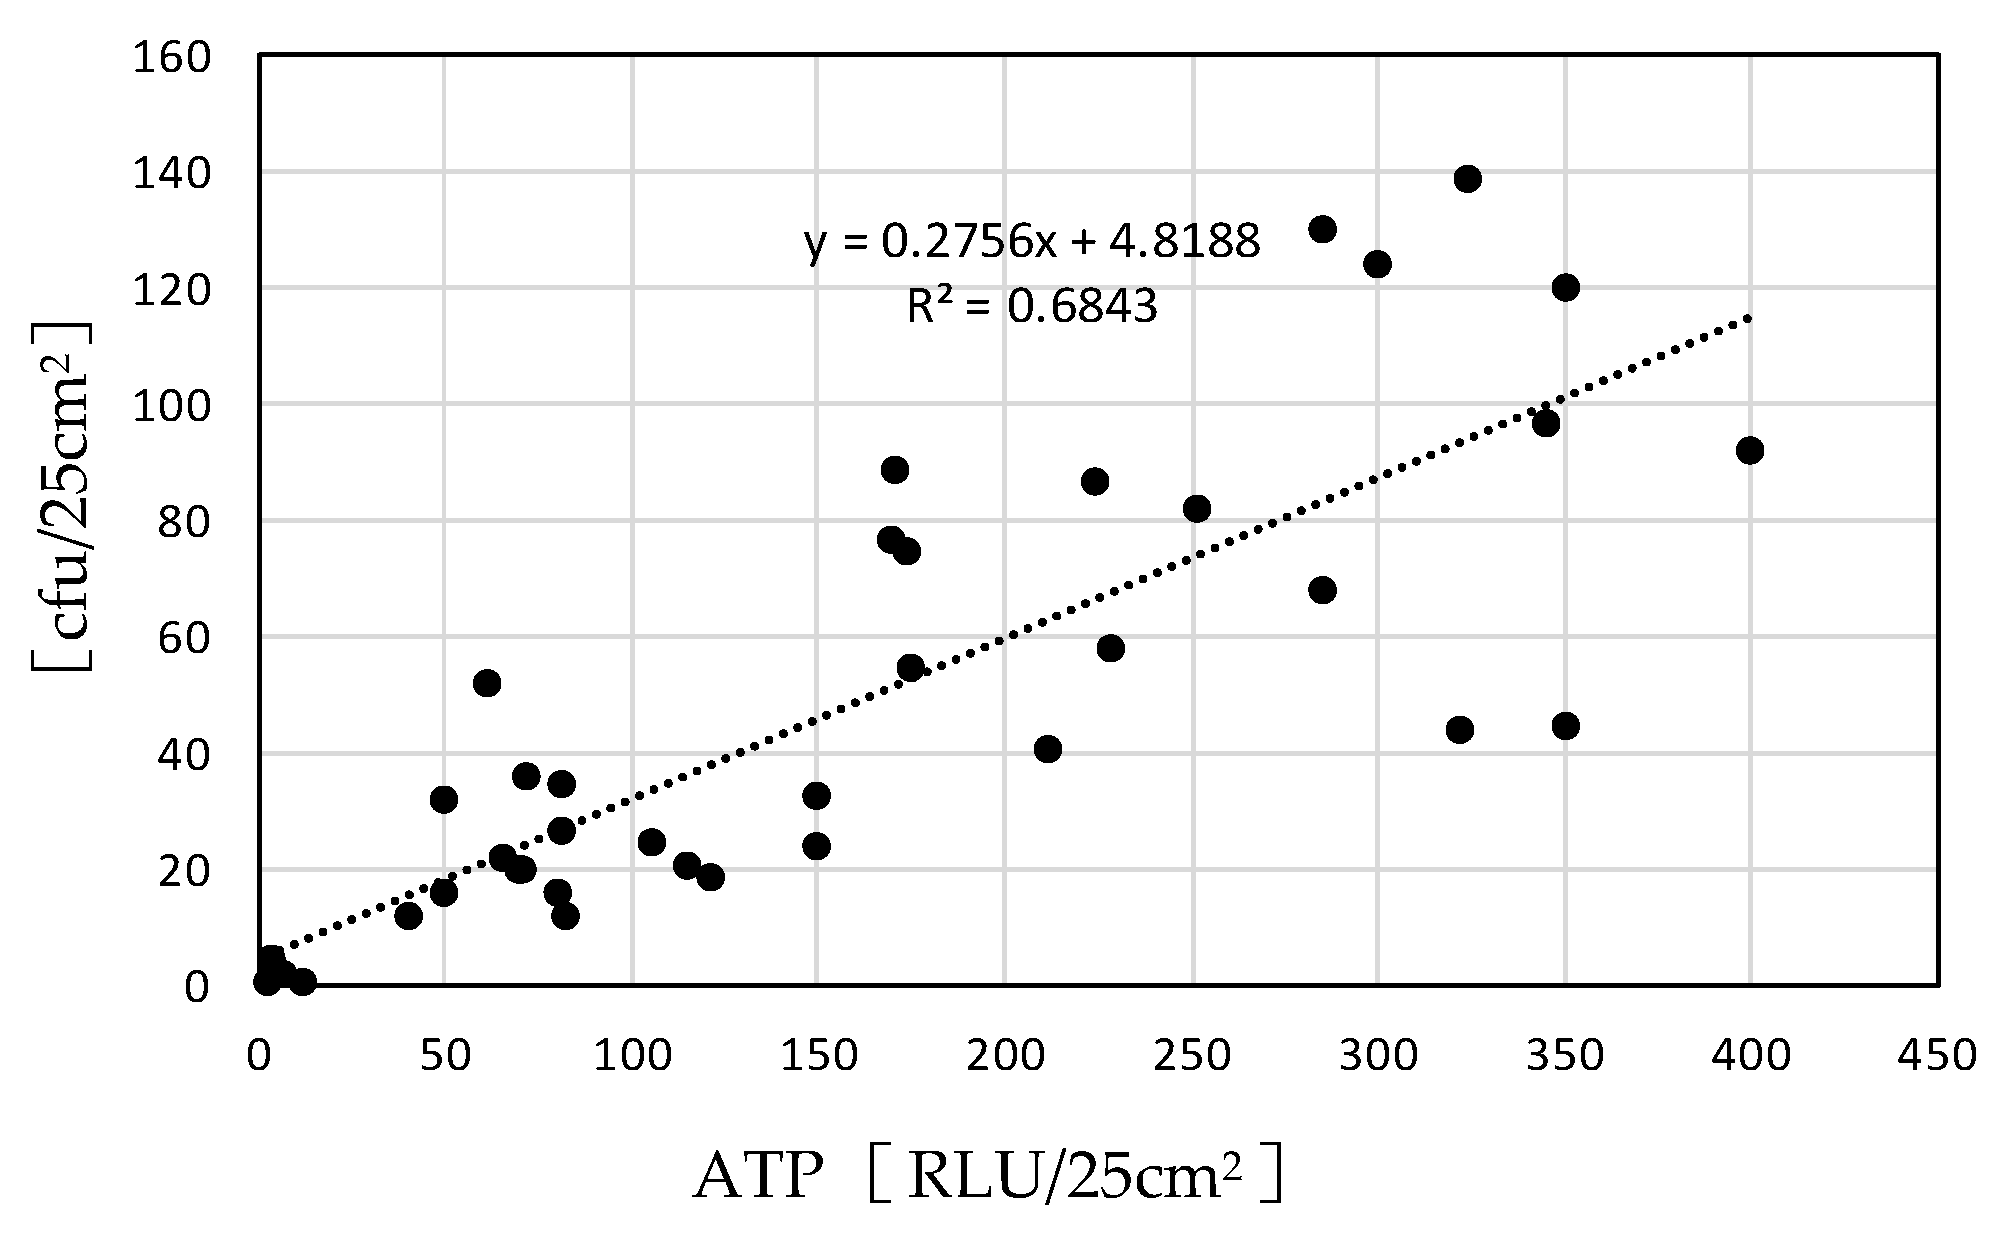
- Surface ATP Amount
- (3)
- Surface Fungal Concentration
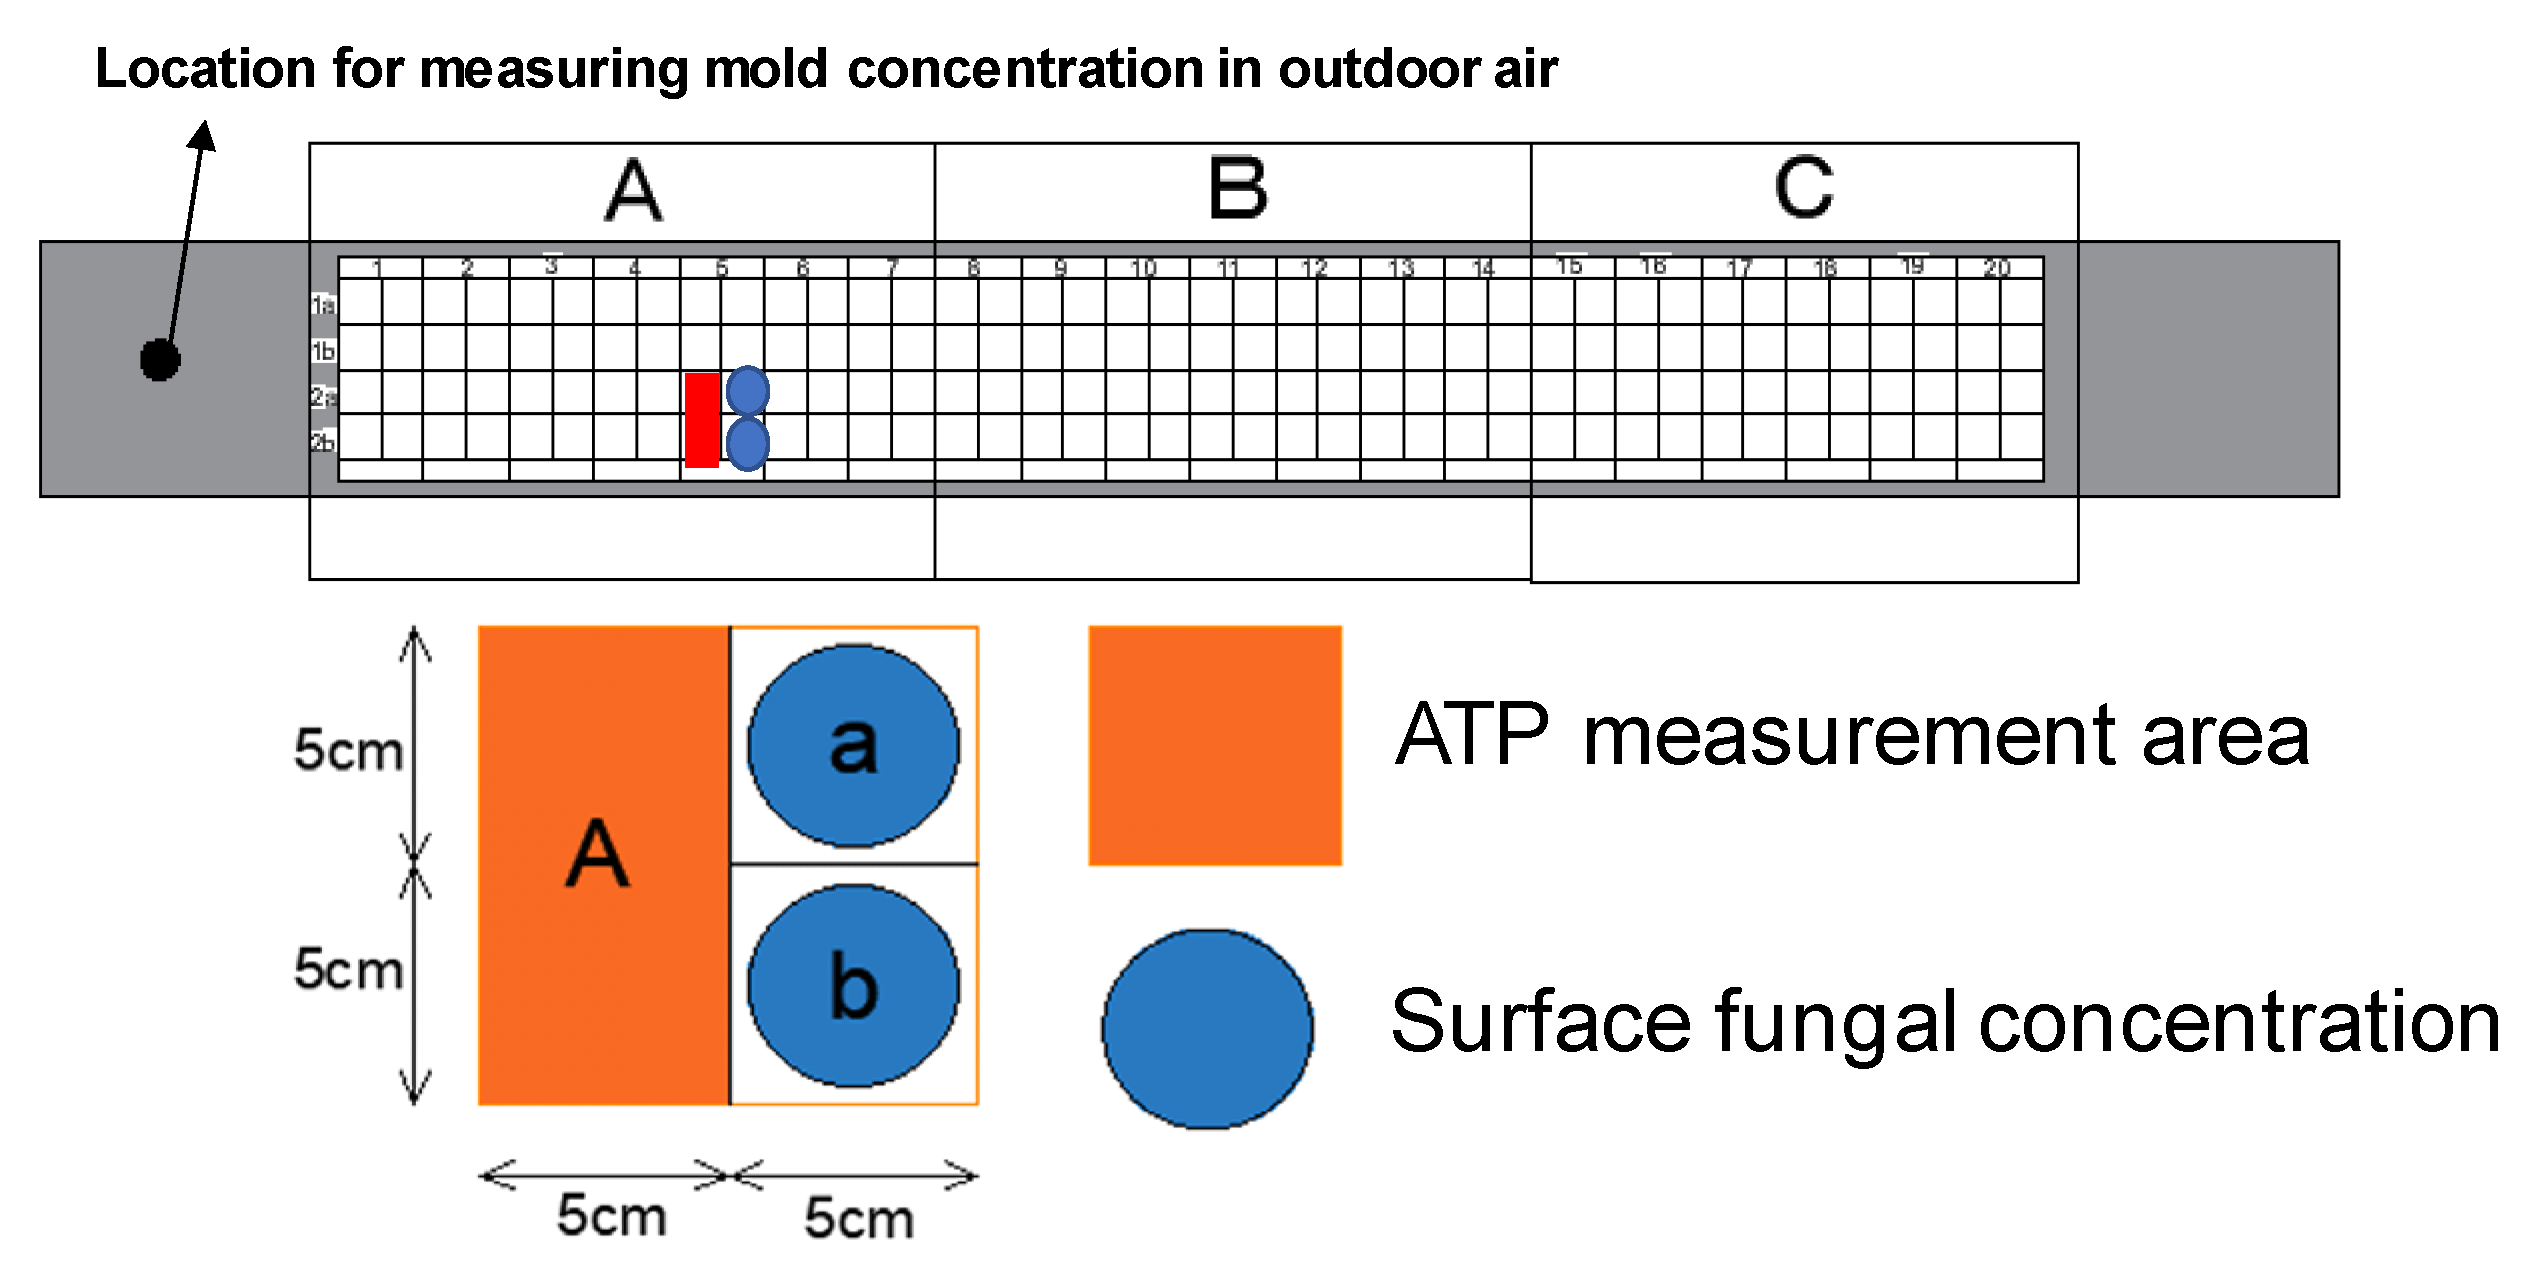
3.3. Measurement Points and Schedule
3.4. Results and Discussion
3.4.1. Fungal Concentration in Outdoor Air
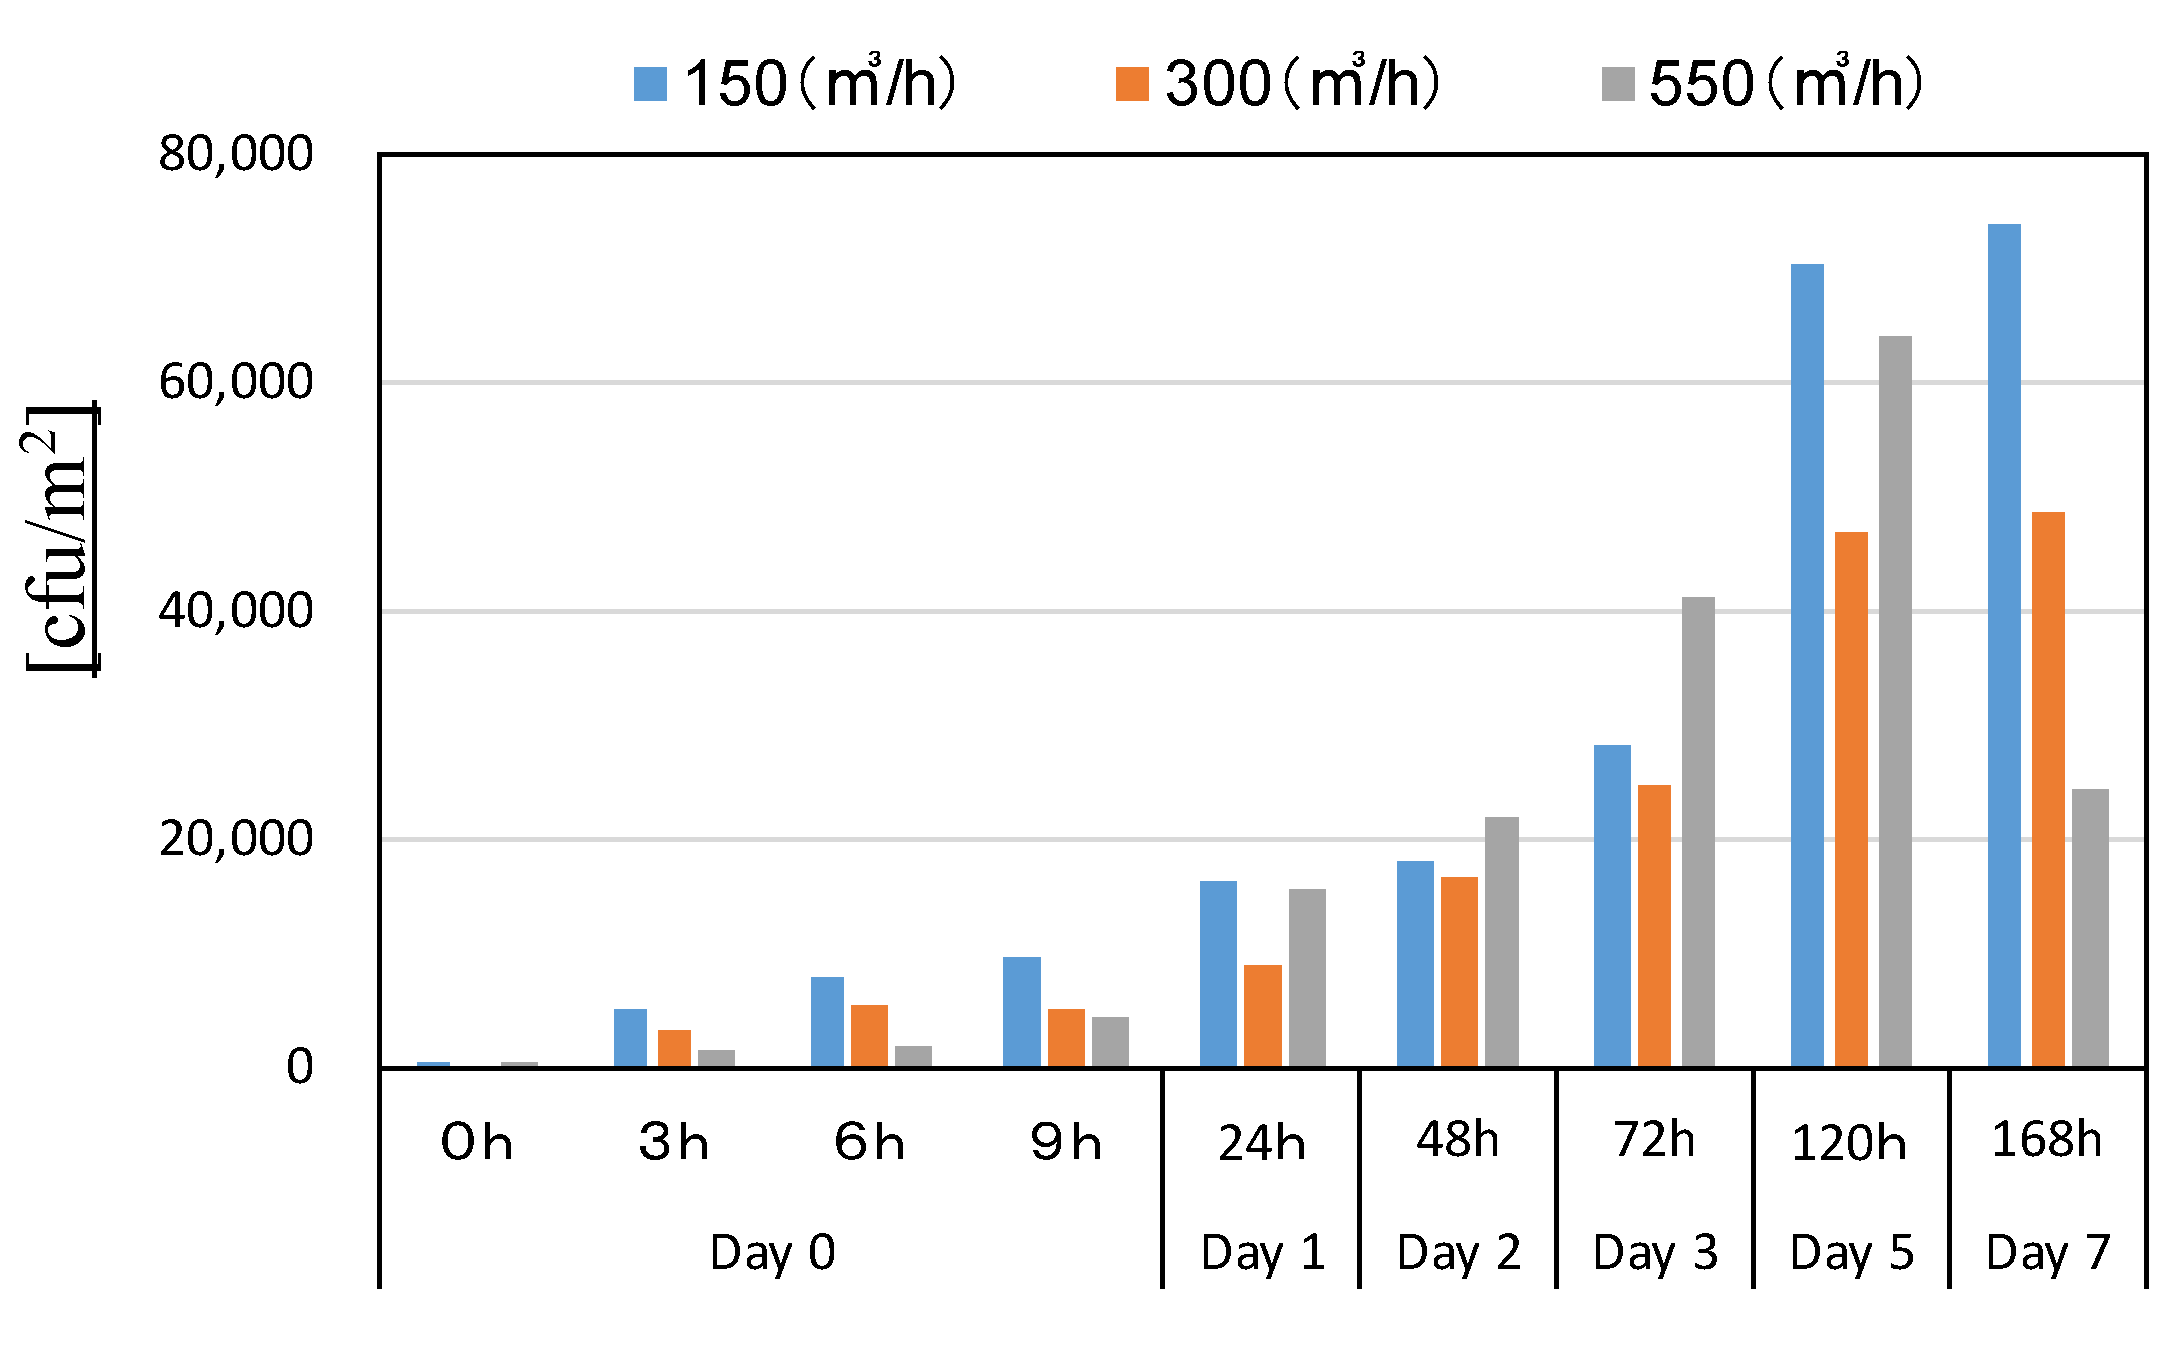
3.4.2. Surface Fungal Concentration
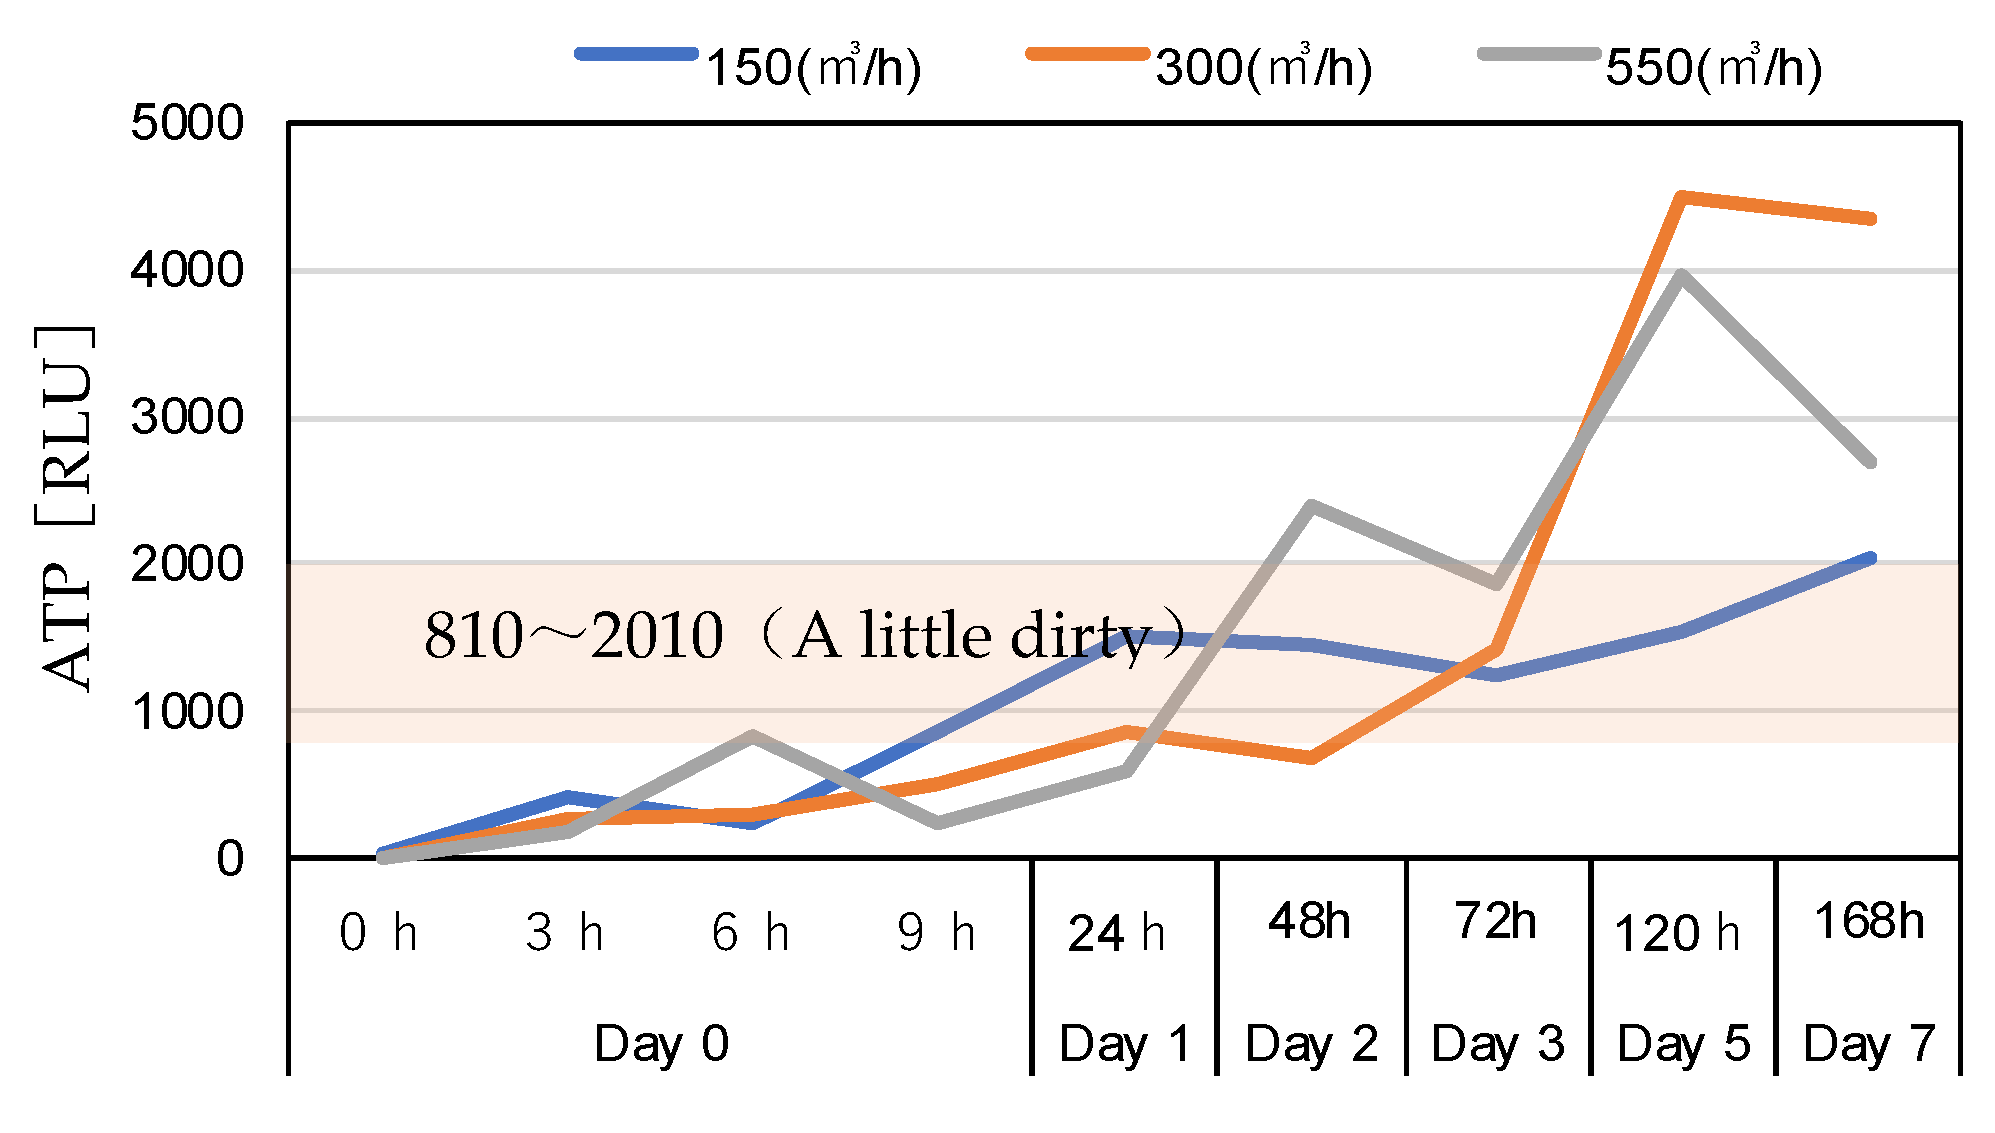
3.4.3. Surface ATP Levels
4. Sterilization Effect of UV Lamps
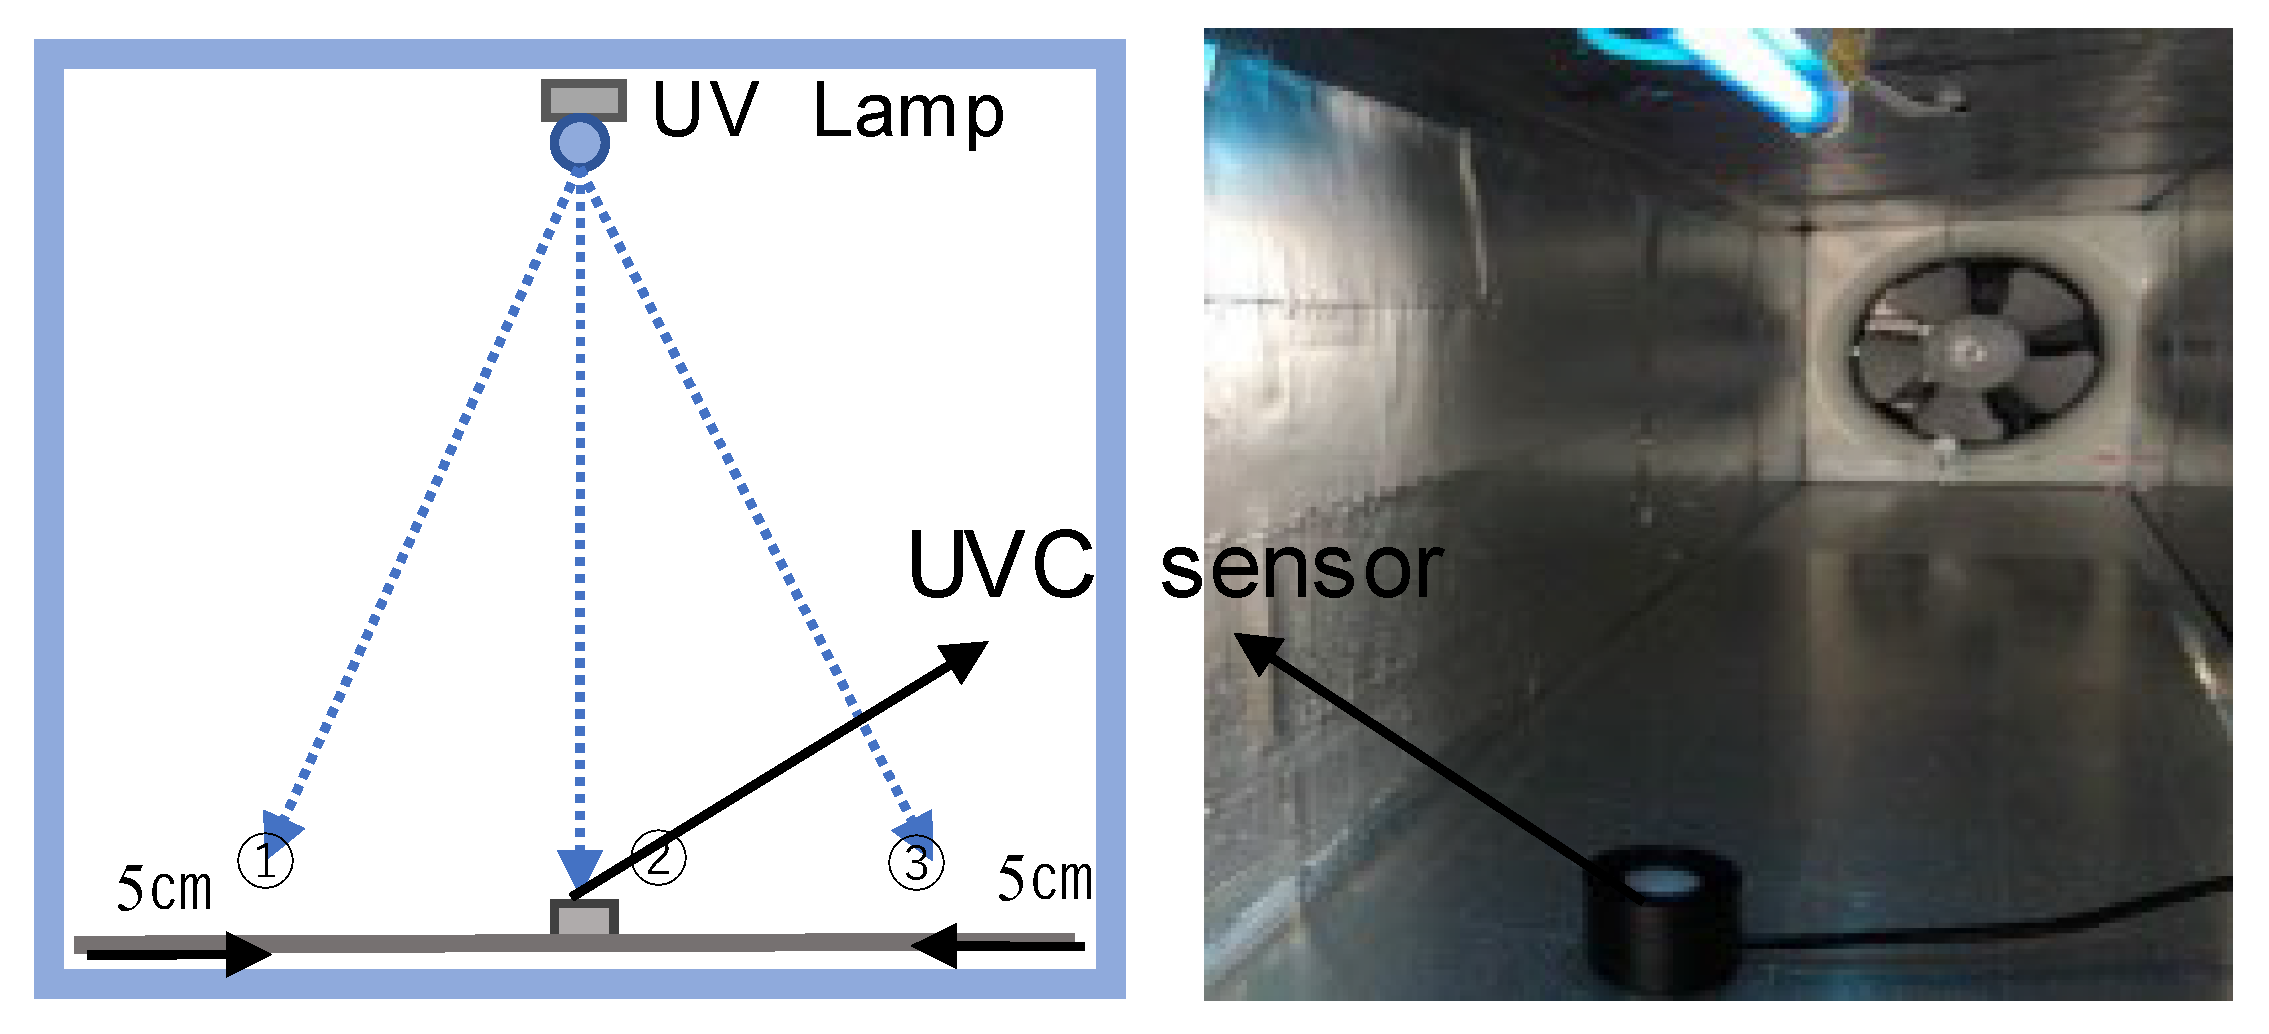
4.1. Confirmation of Ultraviolet Intensity
4.2. Experimental Overview
4.3. Measurement Methods
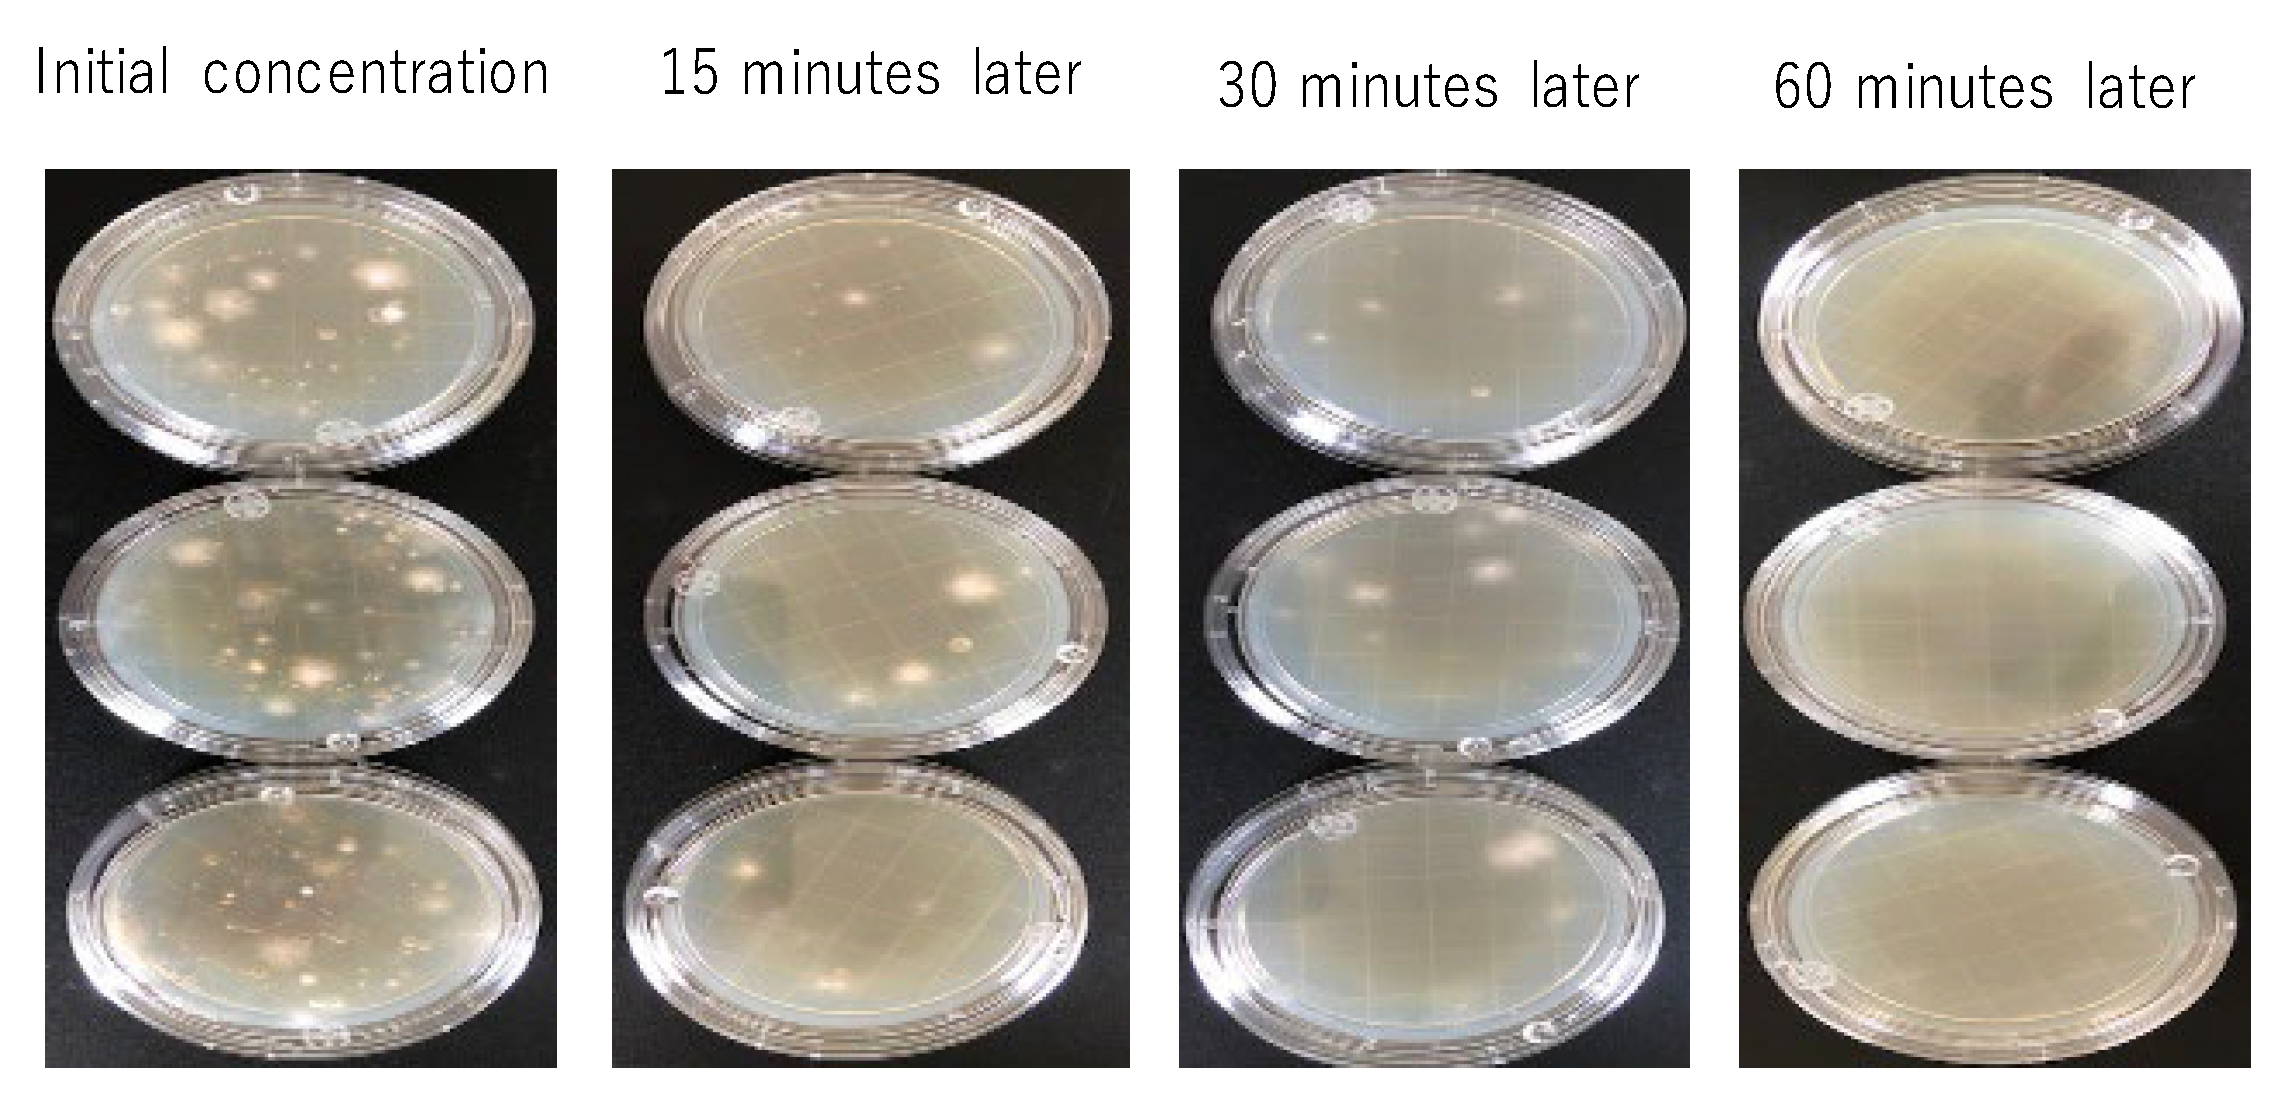
4.4. Results and Discussion
5. Conclusions
Funding
Data Availability Statement
Conflicts of Interest
References
- Main Roles of the Cabinet Office, Japan. Available online: https://www8.cao.go.jp/cstp/moonshot/sub4.html (accessed on 20 June 2021).
- Japan Center for Climate Change Actions. Available online: http://www.jccca.org/chart/chart04_04.html (accessed on 17 April 2018).
- Ministry of the Environment Website, Japan—Geothermal Energy Utilization Brochure. Available online: http://www.env.go.jp/water/jiban/pamph_gh/index.html (accessed on 11 March 2017).
- Hasegawa, F. Chapter 7: Unsteady Heat Transfer. In Principles of Architectural Planning II; Watanabe, K., Ed.; Maruzen: Tokyo, Japan, 1965. [Google Scholar]
- Tarumi, H.; Minohara, Y. Surveillance study on the subterranean thermal use effect of a heat & cool tube residence—About the detached model house which locate in Hokuriku region. J. Environ. Eng. (Trans. AIJ) 2010, 75, 423–429. [Google Scholar]
- Hasegawa, F.; Yoshino, H.; Ishikawa, Y.; Sora, T. Experimental study on cooling performance of the earth tube connected to passive solar test house (Part 2. Terformance of the tube with the lenghth of 45 meters which was embedded in the earth around the test house). Jpn. Sol. Energy Soc. 1991, 17, 26–36. [Google Scholar]
- Sasaki, M.; Ishikawa, Y.; Yoshino, H. Long-Term Measurement Results of Indoor Thermal Environment and Thermal Performance of Cool Tubes in Naturally Energized Houses Constructed in Sendai City; Transactions of the Architectural Institute of Japan, Tohoku Branch: Tohoku, Japan, 1995; pp. 145–148. [Google Scholar]
- Zhang, Q.; Ishihara, O. Discussion on the exit temperature and cooling energy of cooling tubes for design study on effects of cooling tubes on indoor thermal environment Part 2. J. Archit. Plan. Environ. Eng. 1995, 11–18. [Google Scholar]
- Hokoi, S.; Ueda, S.; Yoshida, T. Study on the cooling Effect of cool tube. In Summaries of Technical Paper of Annual Meeting; Architectural Institute of Japan: Tokyo, Japan, 1995; pp. 495–496. [Google Scholar]
- Azumi, H.; Sakurai, Y. Thermal behavior in a cooking tube system with natural ventilation. J. Archit. Plan. Environ. Eng. 2001, 547, 33–39. [Google Scholar]
- Ueda, S.; Hokoi, S.; Yoshida, T. Cooling Effect of cool tube—In the case of the wet tube surface. In Summaries of Technical Paper of Annual Meeting; Architectural Institute of Japan: Tokyo, Japan, 1996; pp. 505–506. [Google Scholar]
- Yoon, G.-Y.; Tanaka, H.; Okumiya, M. Exchanged heat charecteristics of the multi-cool/heat tube with close arrangement—Performance perdiction and desing method for the multi-cool/heat tube with close arrangement Part 1. J. Environ. 2004, 579, 45–52. [Google Scholar]
- Ueda, S.; Hokoi, S. Cooling Effect of Cool Tube—In the case of simultaneous heat and moisture transfer in the ground. In Summaries of Technical Paper of Annual Meeting; CD recording; Architectural Institute of Japan: Tokyo, Japan, 1997; pp. 411–412. [Google Scholar]
- Ishida, M.; Koganei, M.; Kuwahara, R.; Kim, H.; Kohno, H.; Shoda, N.; Yamashita, T. Evaluation of cooling performance and mold removal effectiveness in geothermal ventilation system. In Proceedings of the Annual Research Meeting; Chugoku Chapter; CD recording. Architectural Institute of Japan: Tokyo, Japan, 2018; pp. 421–424. [Google Scholar]
- Kishida, S.; Yoshihara, M.; Kim, H.; Koganei, M.; Hashimoto, M.; Hatano, M.; Hasegawa, M.; Ueda, K.; Hamai, R. Study on Particulate Removal Efficiency in the Geothermal Ventilation System. In Proceedings of the Annual Research Meeting; Chugoku Chapter. Architectural Institute of Japan: Tokyo, Japan, 2021; pp. 365–368. [Google Scholar]
- AIJES-A0008; Standards and Commentary for Sampling Methods of Airborne Microorganisms. Architectural Institute of Japan: Tokyo, Japan, 2013.
- Adenosine Triphosphate Measurement Method. Available online: https://ja.wikipedia.org/wiki/ATP (accessed on 22 July 2020).
- NITTA Corporation (ATP Swab Test Kit) Luminometer (Japanese User Manual), SystemSURE Operation Manual V3.0 (2013). Available online: https://nitta-monitoring.com/sanitary/food/atp-ruminometer/ (accessed on 22 July 2020).
- Matsumura, M.; Fujiwara, M.; Ogata, M.; Tsutsumi, H.; Hori, S.; Tanabe, S.-i. Environmental surface contamination measured by ATP assay and attitube surve of medical and cleaning staff in the examination room. J. Environ. Eng. 2016, 81, 893–899. [Google Scholar] [CrossRef]
- Ogata, M.; Iigima, M.; Matsumura, M.; Tsutsumi, H.; Hori, S.; Tanabe, S.-i. Environmental surface contamination examined by ATP assay before and after terminal room cleaning in patient rooms. J. Environ. Eng. 2016, 81, 723–729. [Google Scholar] [CrossRef]
- Yanagi, U. Microbiol contamination in an air-conditioning system and countermeasure against mould smell. J. Jpn. Assoc. Odor Environ. 2012, 43, 191–198. [Google Scholar]
- Sung, M.; Kato, S.; Yanagi, U. Evaluation of surface and air disinfection effects using UV radition simulation. J. Environ. Eng. 2009, 74, 1137–1143. [Google Scholar] [CrossRef]
- Capetillo, A.J. Computational Fluid Dynamic Modeling of In-Duct UV Air Sterilisation Systems. 2015. Available online: http://etheses.whiterose.ac.uk/9591/ (accessed on 25 October 2024).
- Philips, U.V. Purification—Application Information. Volume 39. 2005. Available online: https://www.assets.signify.com/is/content/Signify/Assets/philips-lighting/global/20230816-uv-c-disinfection-application-guide-dec21.pdf (accessed on 25 October 2024).
- Lau, J.; Bahnfleth, W.; Freihaut, J. Estimating the effects of ambient conditions on the performance of UVGI air cleaners. Build. Environ. 2009, 44, 1362–1370. [Google Scholar] [CrossRef]
- Zhang, H.; Jin, X.; Nunayon, S.S.; Lai, A.C.K. Disinfection by in-duct ultraviolet lamps under different environmental conditions in turbulent airflows. Indoor Air 2020, 30, 500–511. [Google Scholar] [CrossRef] [PubMed]
- Wang, Y.; Sekhar, C.; Bahnfleth, W.P.; Cheong, K.W.; Firrantello, J. Effectiveness of an ultraviolet germicidal irradiation system in enhancing cooling coil energy performance in a hot and humid climate. Energy Build. 2016, 130, 321–329. [Google Scholar] [CrossRef]
- Luongo, J.C.; Miller, S.L. Ultraviolet germicidal coil cleaning: Decreased surface microbial loading and resuspension of cell clusters. Build. Environ. 2016, 105, 50–55. [Google Scholar] [CrossRef]
- Yang, Y.; Zhang, H.; Nunayon, S.S.; Chan, V.; Lai, A.C.K. Disinfection efficacy of ultraviolet germicidal irradiation on airborne bacteria in ventilation ducts. Indoor Air 2018, 28, 806–817. [Google Scholar] [CrossRef] [PubMed]
- Luo, H.; Zhong, L. Ultraviolet germicidal irradiation (UVGI) for in-duct airborne bioaerosol disinfection: Review and analysis of design factors. Build. Environ. 2021, 197, 107852. [Google Scholar] [CrossRef] [PubMed]


| Measurement Item | Measuring Device Model Number |
|---|---|
| Fungal concentration in outdoor air | Mold Sampler (IDC-500B) |
| Surface ATP concentration | Highly sensitive luminometer (EnSURE) ATP swab test reagent (Supersnap) |
| Surface fungal concentration | Stamp-type agar medium (PDA) |
| Level | Evaluation Criteria | |
|---|---|---|
| Ⅰ | Extremely clean | 0~100 |
| Ⅱ | Very clean | 110~300 |
| Ⅲ | Usually clean | 310~800 |
| Ⅳ | A little dirty | 810~2000 |
| Ⅴ | Dirty | 2010~5000 |
| Ⅵ | Very dirty | 5010~10,000 |
| Ⅶ | Extremely dirty | 10,010~ |
| Schedule | Time | Surface ATP Concentration | Surface Fungal Concentration | Fungal Concentration in Outdoor Air |
|---|---|---|---|---|
| Day 0 | 0 h | Measure one place each in areas I, II, and III | Measure two places each in areas I, II, and III | The fungal concentration in the outside air was measured twice |
| 3 h | ||||
| 6 h | ||||
| 9 h | ||||
| Day 1 | 24 h | |||
| Day 2 | 48 h | |||
| Day 3 | 72 h | |||
| Day 5 | 72 h | |||
| Day 7 | 168 h |
| Exposure time | 15 min | 30 min * | 60 min |
| Dosage (mW·s/cm2) ** | 140.4 | 280.8 | 561.6 |
Disclaimer/Publisher’s Note: The statements, opinions and data contained in all publications are solely those of the individual author(s) and contributor(s) and not of MDPI and/or the editor(s). MDPI and/or the editor(s) disclaim responsibility for any injury to people or property resulting from any ideas, methods, instructions or products referred to in the content. |
© 2024 by the author. Licensee MDPI, Basel, Switzerland. This article is an open access article distributed under the terms and conditions of the Creative Commons Attribution (CC BY) license (https://creativecommons.org/licenses/by/4.0/).
Share and Cite
Kim, H. Microbial Contamination and Sterilization Methods in an Air Circulation-Type Geothermal Ventilation System. Environments 2024, 11, 254. https://doi.org/10.3390/environments11110254
Kim H. Microbial Contamination and Sterilization Methods in an Air Circulation-Type Geothermal Ventilation System. Environments. 2024; 11(11):254. https://doi.org/10.3390/environments11110254
Chicago/Turabian StyleKim, Hyuntae. 2024. "Microbial Contamination and Sterilization Methods in an Air Circulation-Type Geothermal Ventilation System" Environments 11, no. 11: 254. https://doi.org/10.3390/environments11110254
APA StyleKim, H. (2024). Microbial Contamination and Sterilization Methods in an Air Circulation-Type Geothermal Ventilation System. Environments, 11(11), 254. https://doi.org/10.3390/environments11110254