

Using Aquatic Mesocosms to Assess the Effects of Soil and Vegetation for Informing Environmental Research


Abstract
1. Introduction
2. Materials and Methods
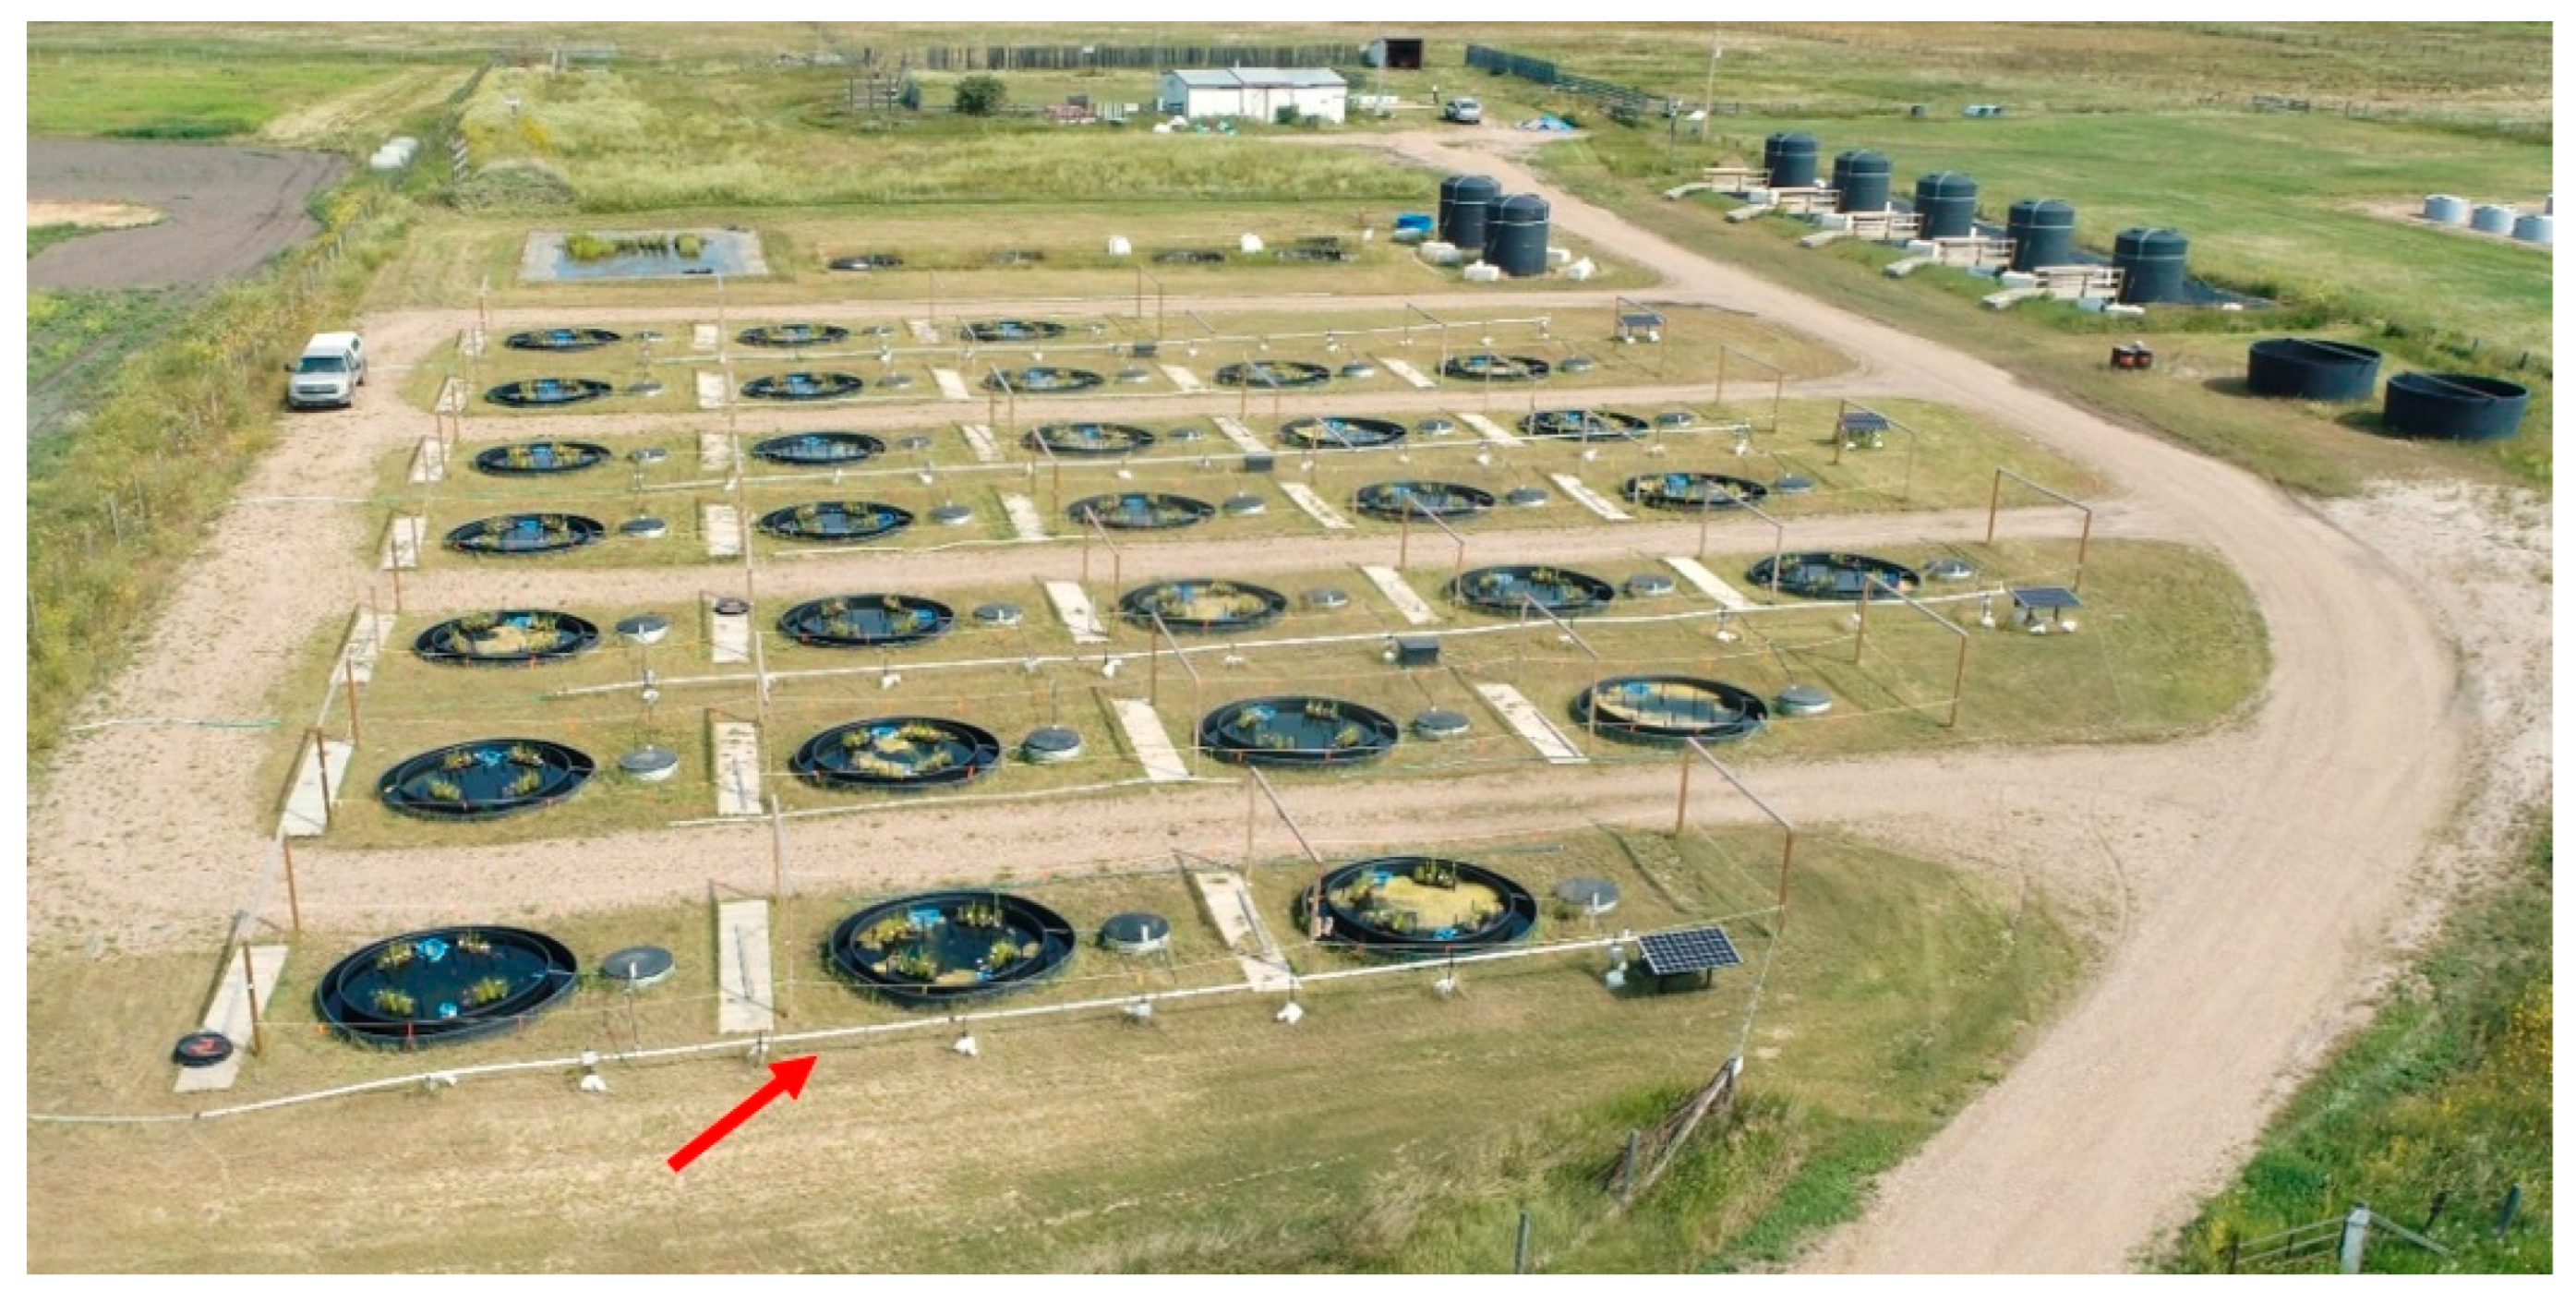
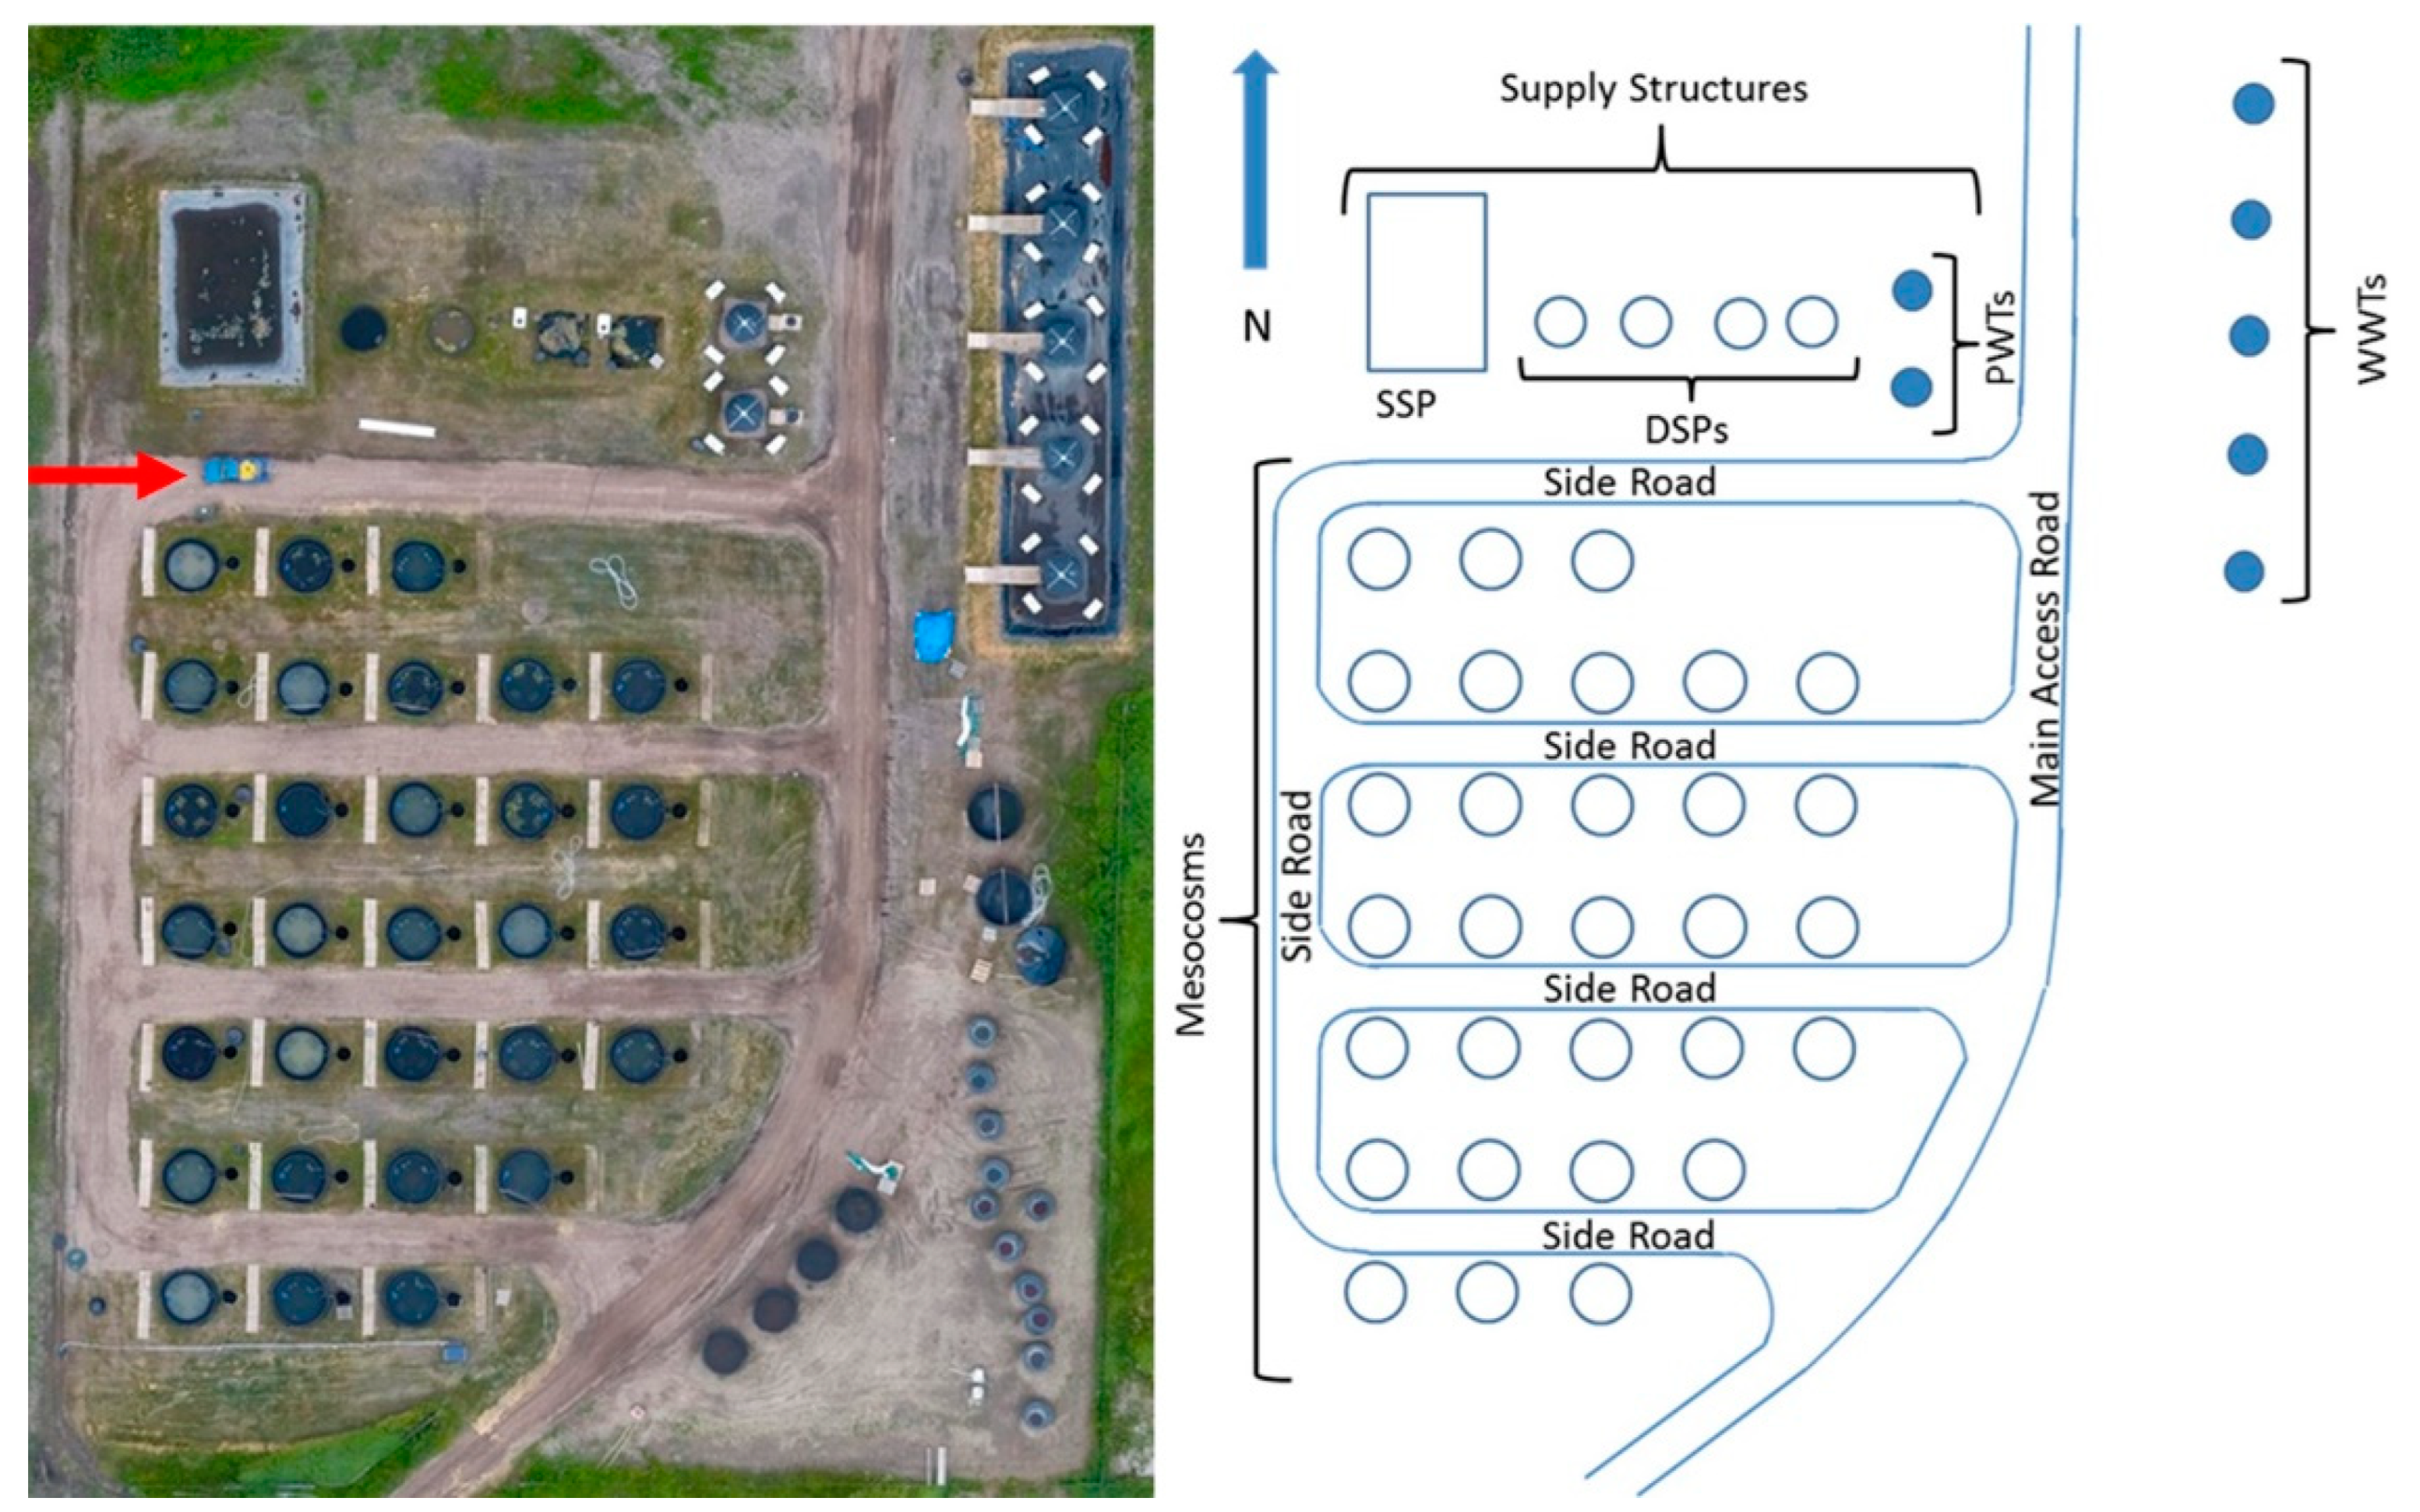
2.1. Mesocosm Facility
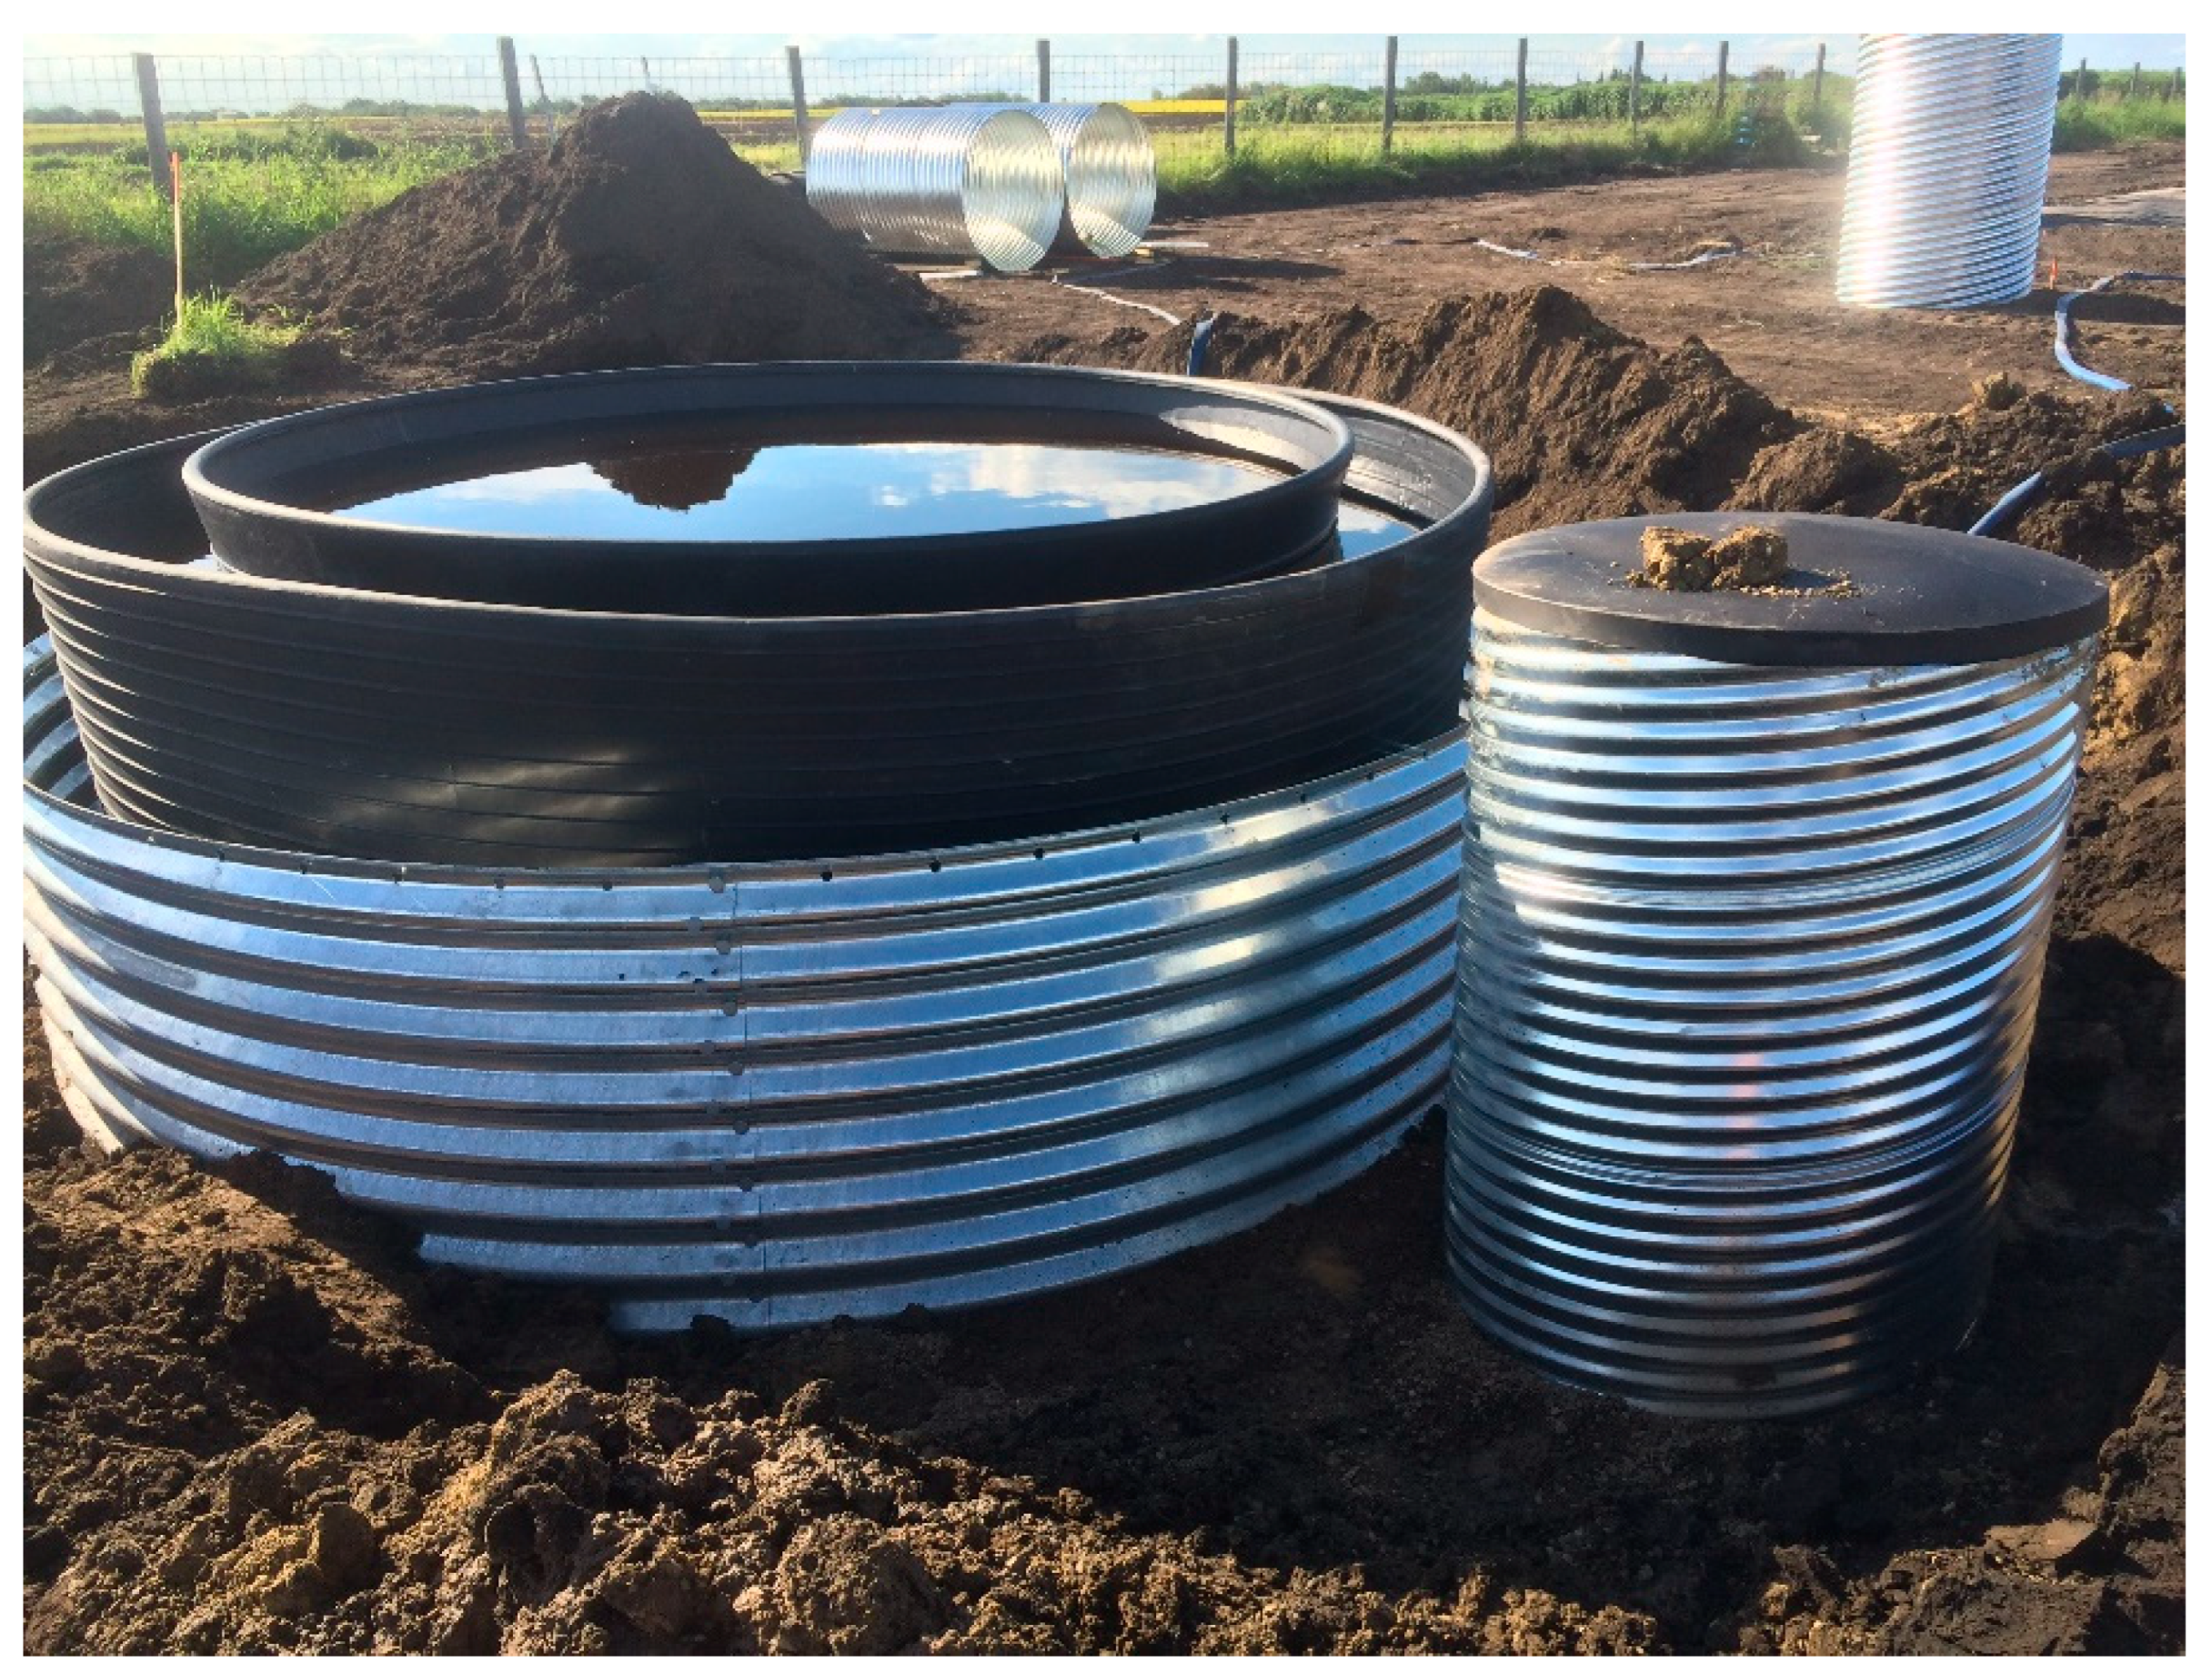
2.2. Mesocosm Design
2.3. Experimental Setup
2.3.1. Mesocosm Commissioning and Establishment
2.3.2. Decommissioning
2.4. Water Chemistry Analyses
2.5. Biological Measurement
2.5.1. Emergent Plants
2.5.2. Submerged Plants
2.5.3. Phytoplankton/Metaphyton
2.5.4. Aquatic Macroinvertebrates
2.6. Data Analyses
3. Results
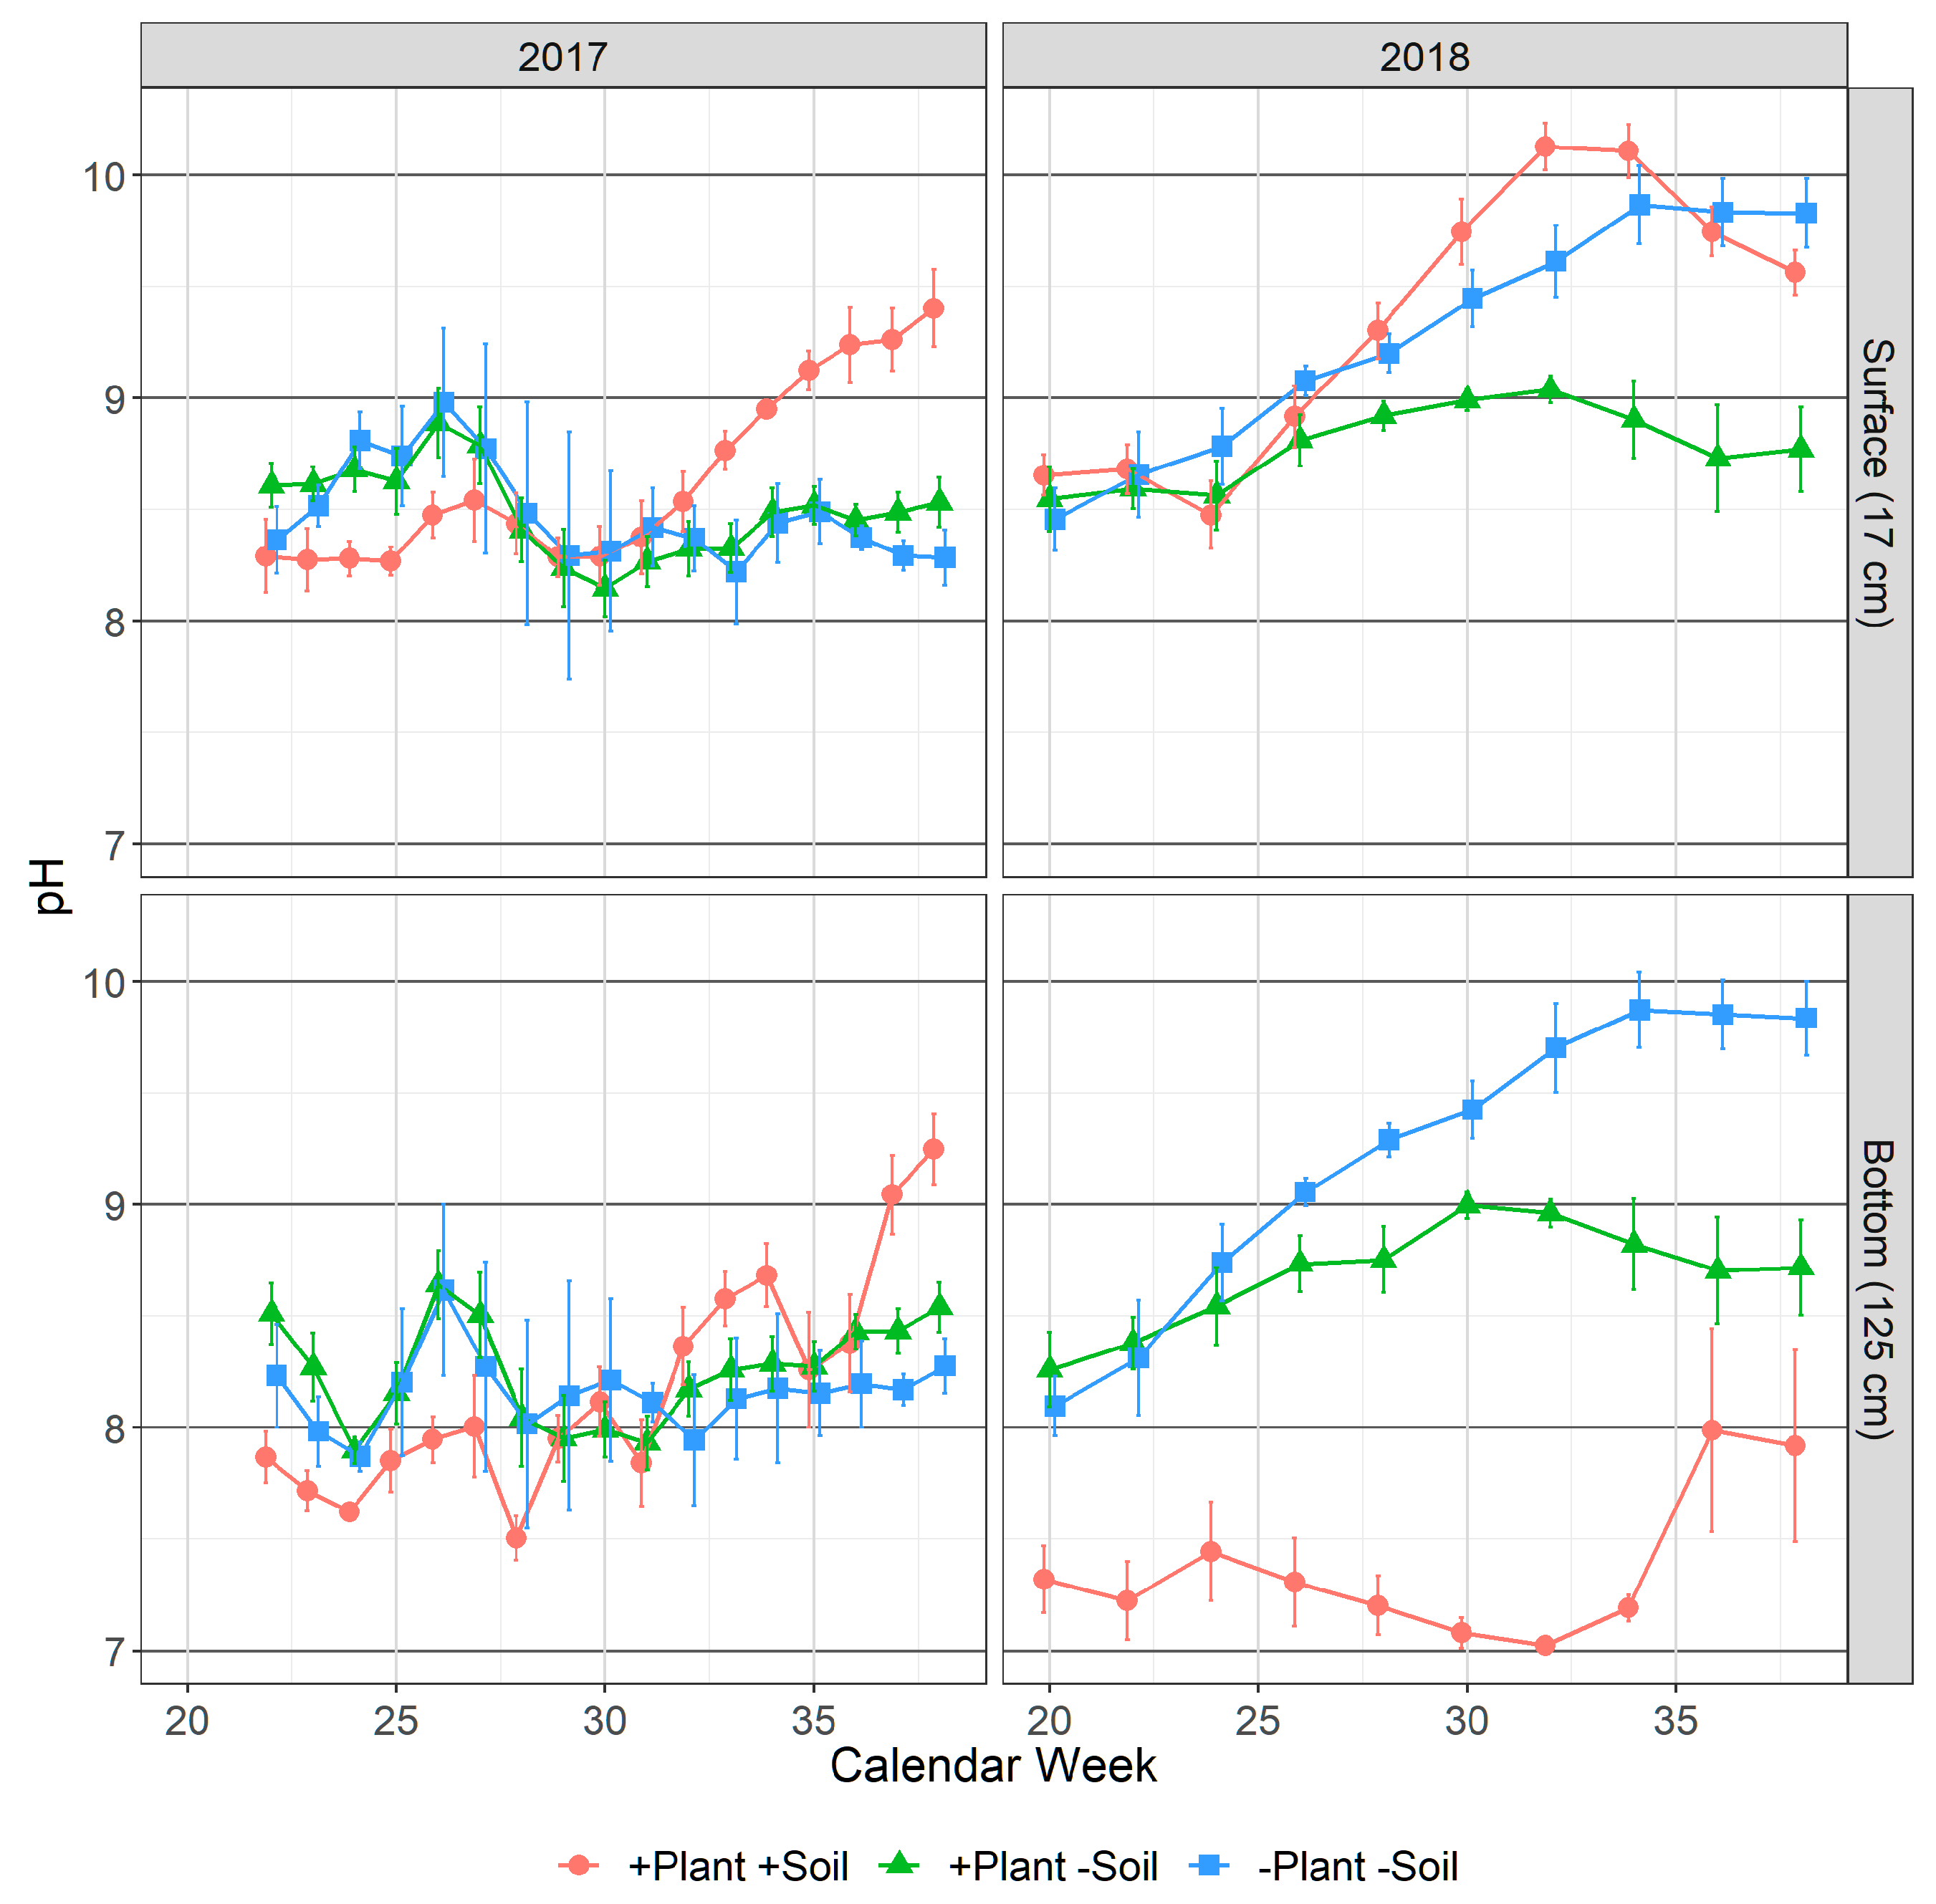
3.1. Water Quality
3.1.1. pH
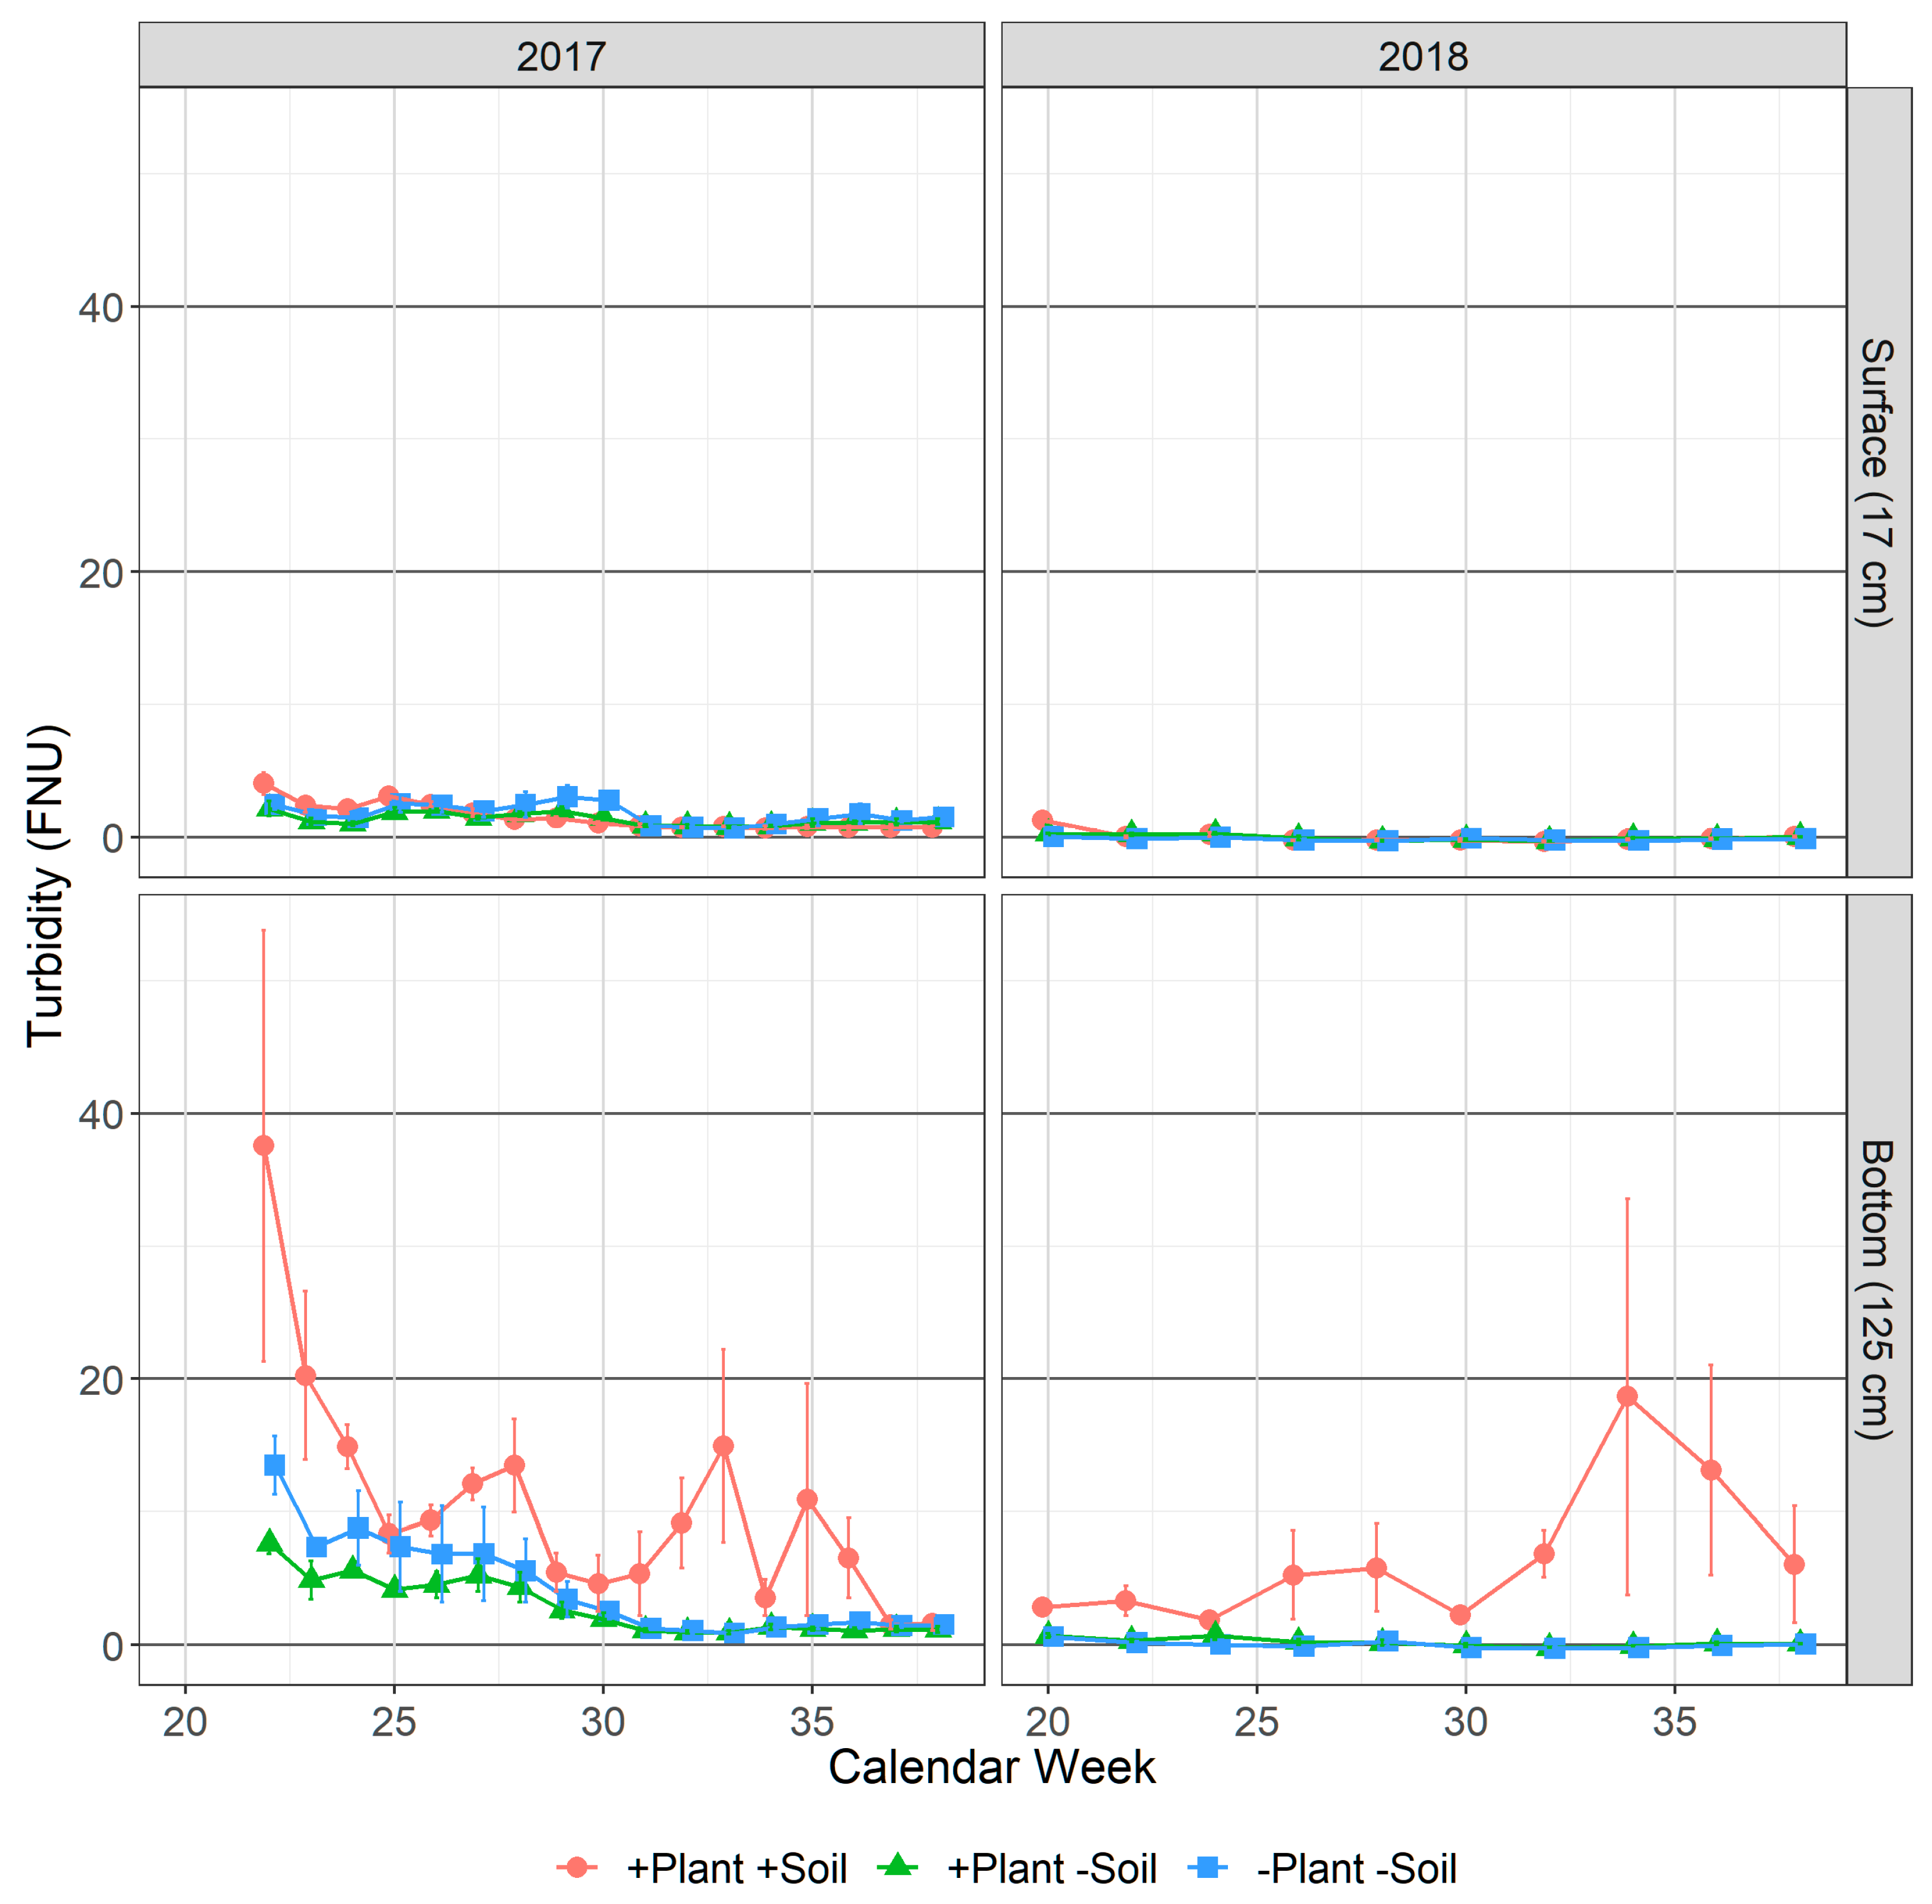
3.1.2. Turbidity
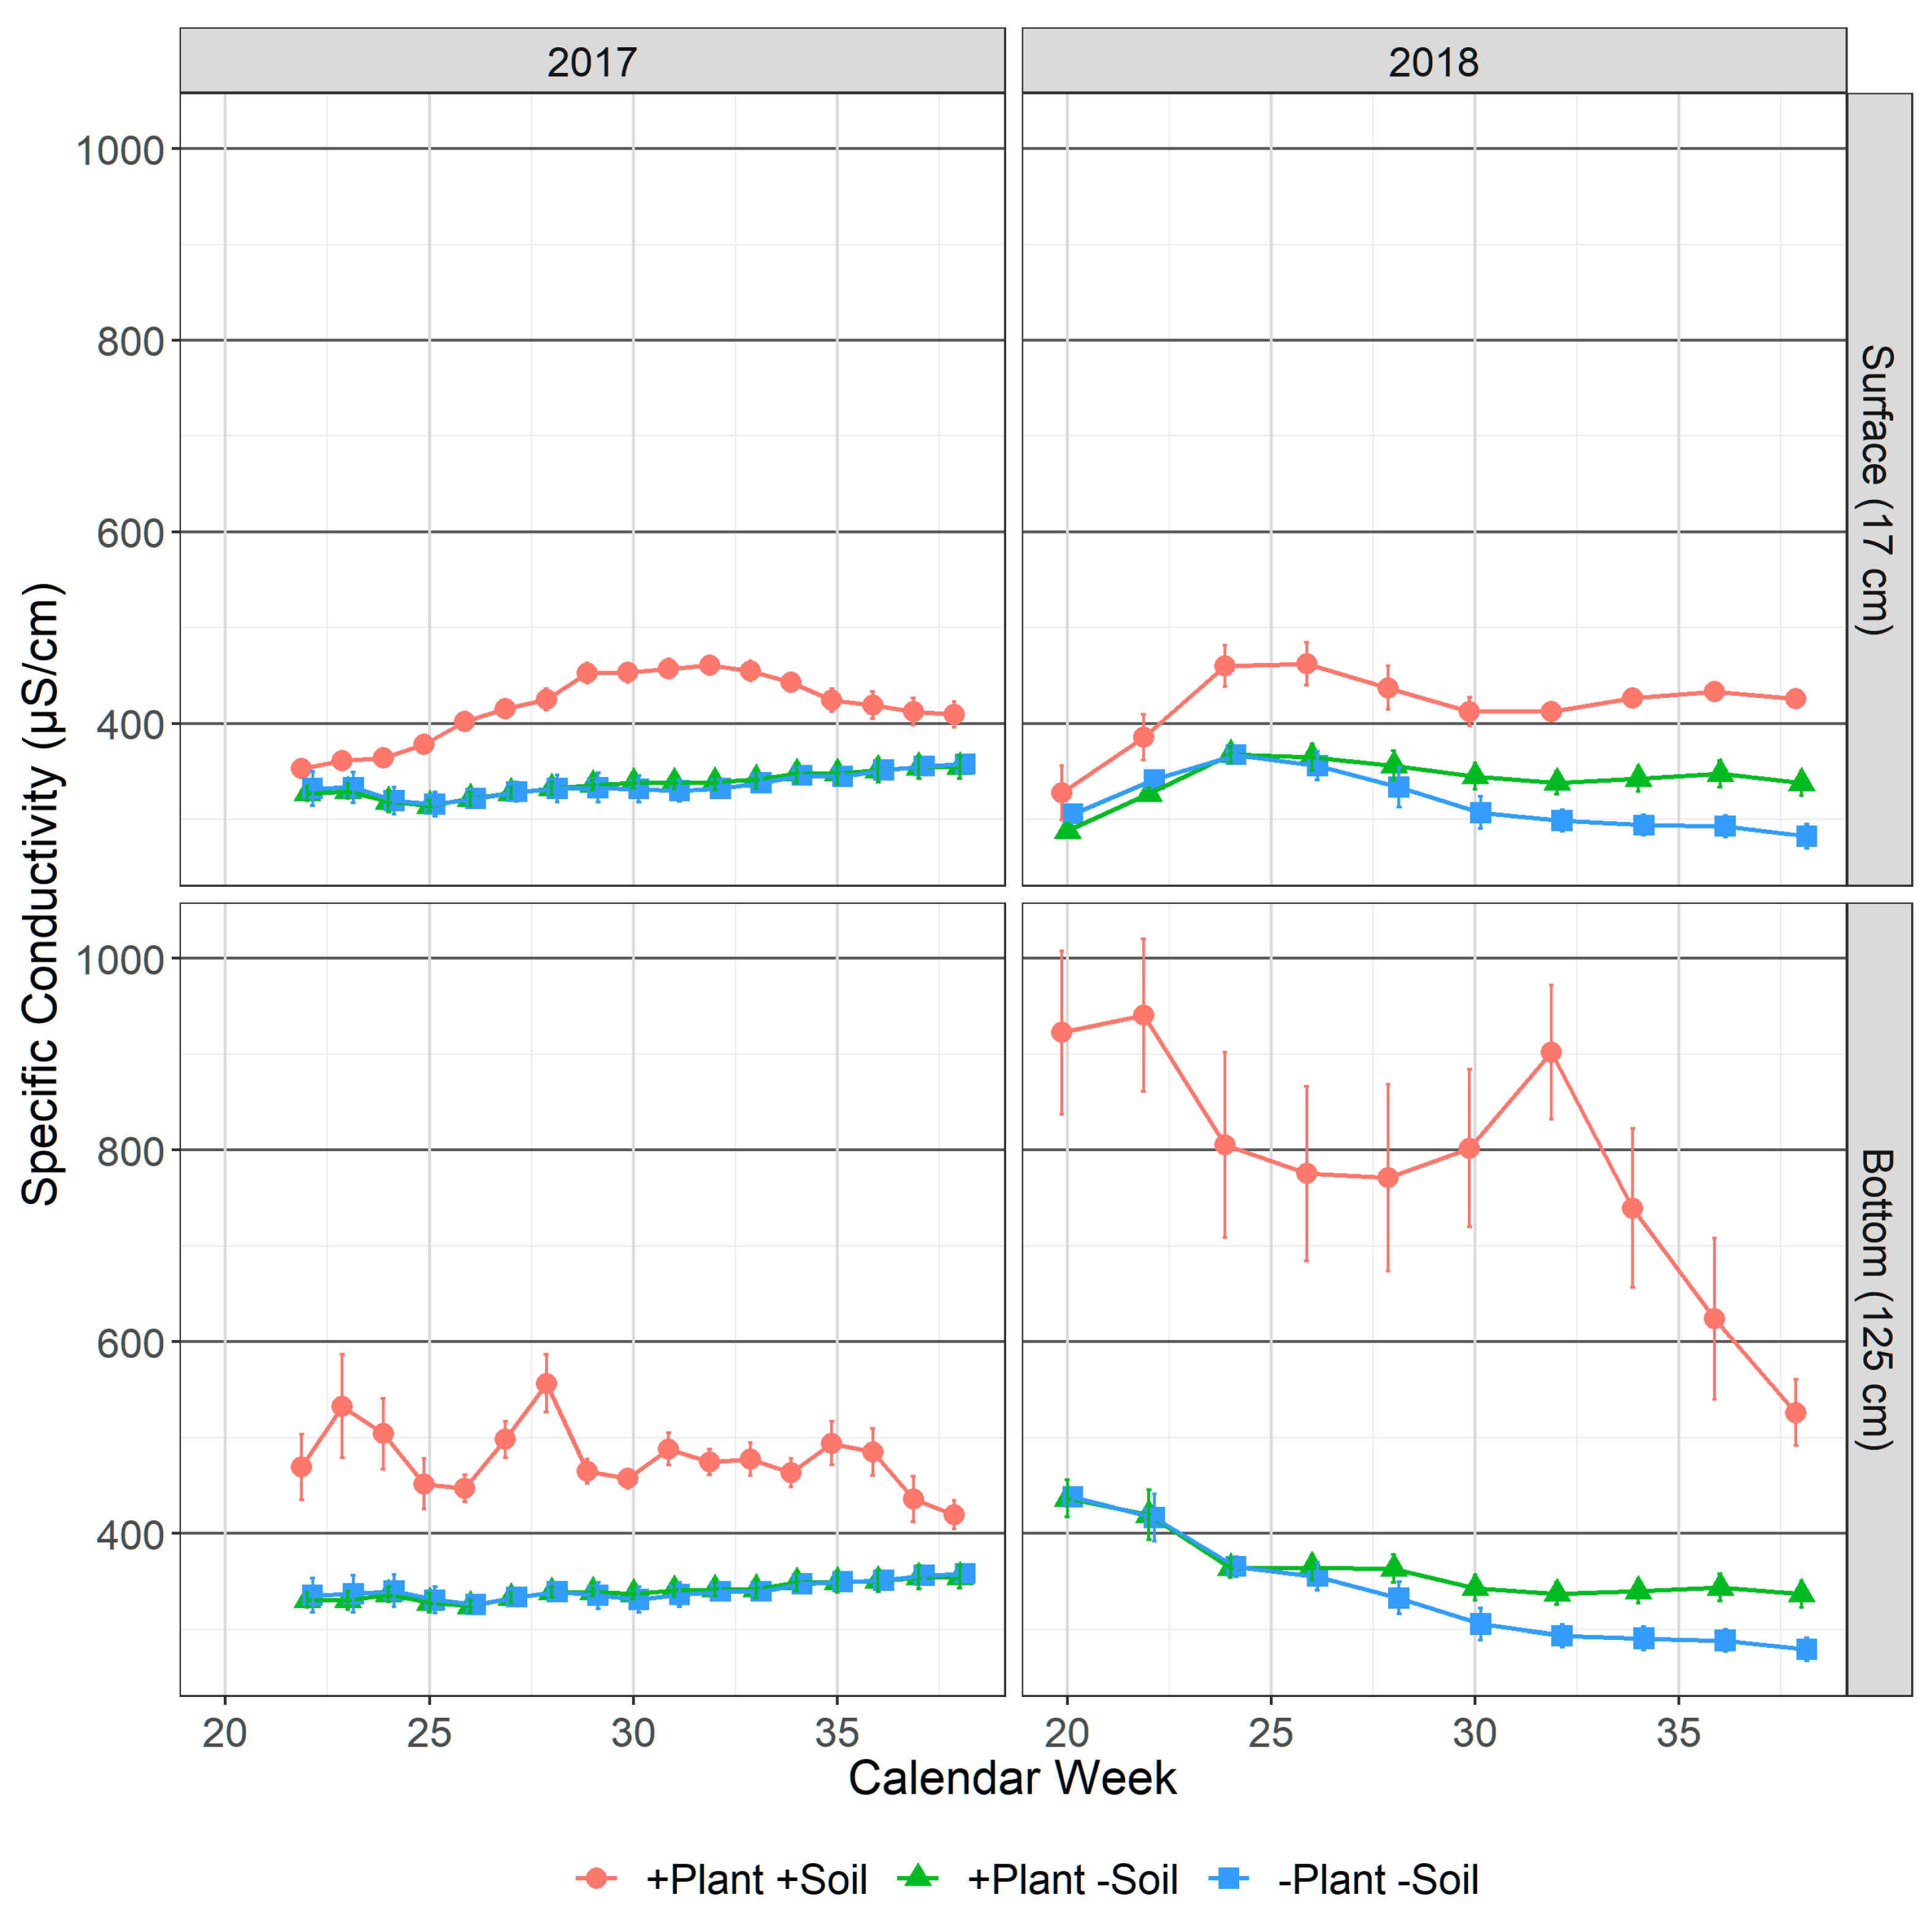
3.1.3. Specific Conductivity
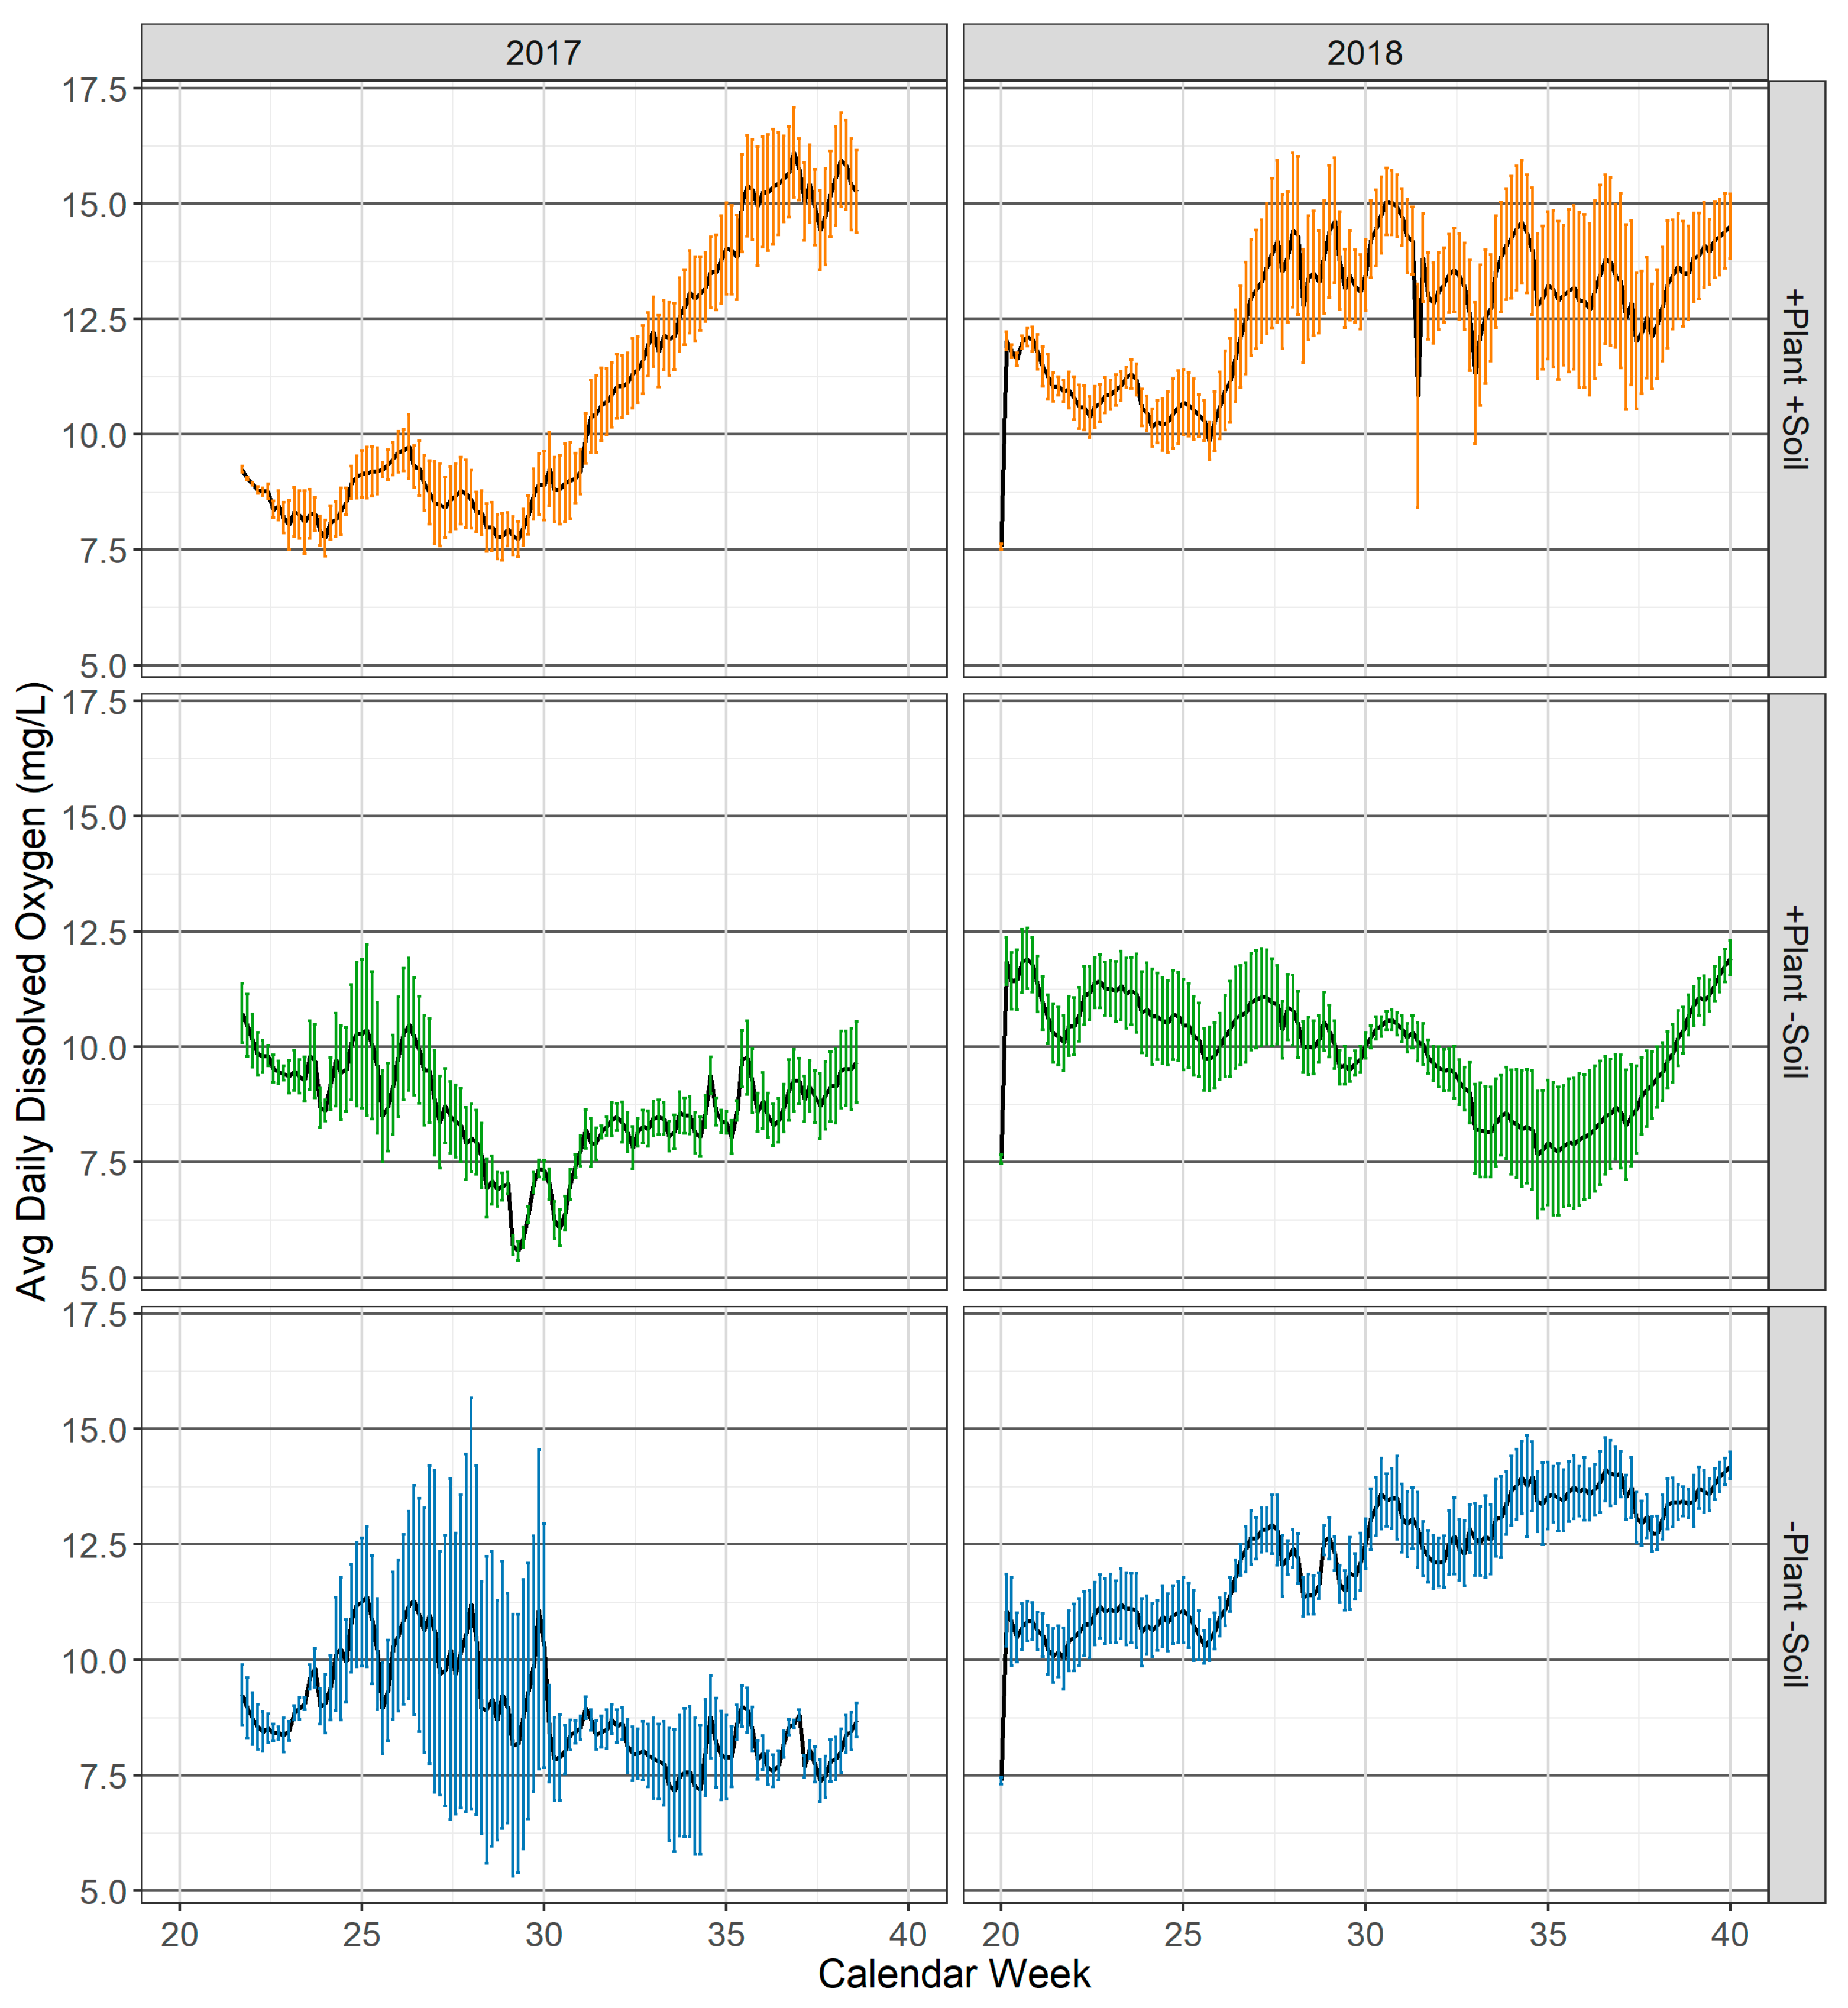
3.1.4. Dissolved Oxygen
3.2. Plant Growth
3.2.1. Typha latifolia
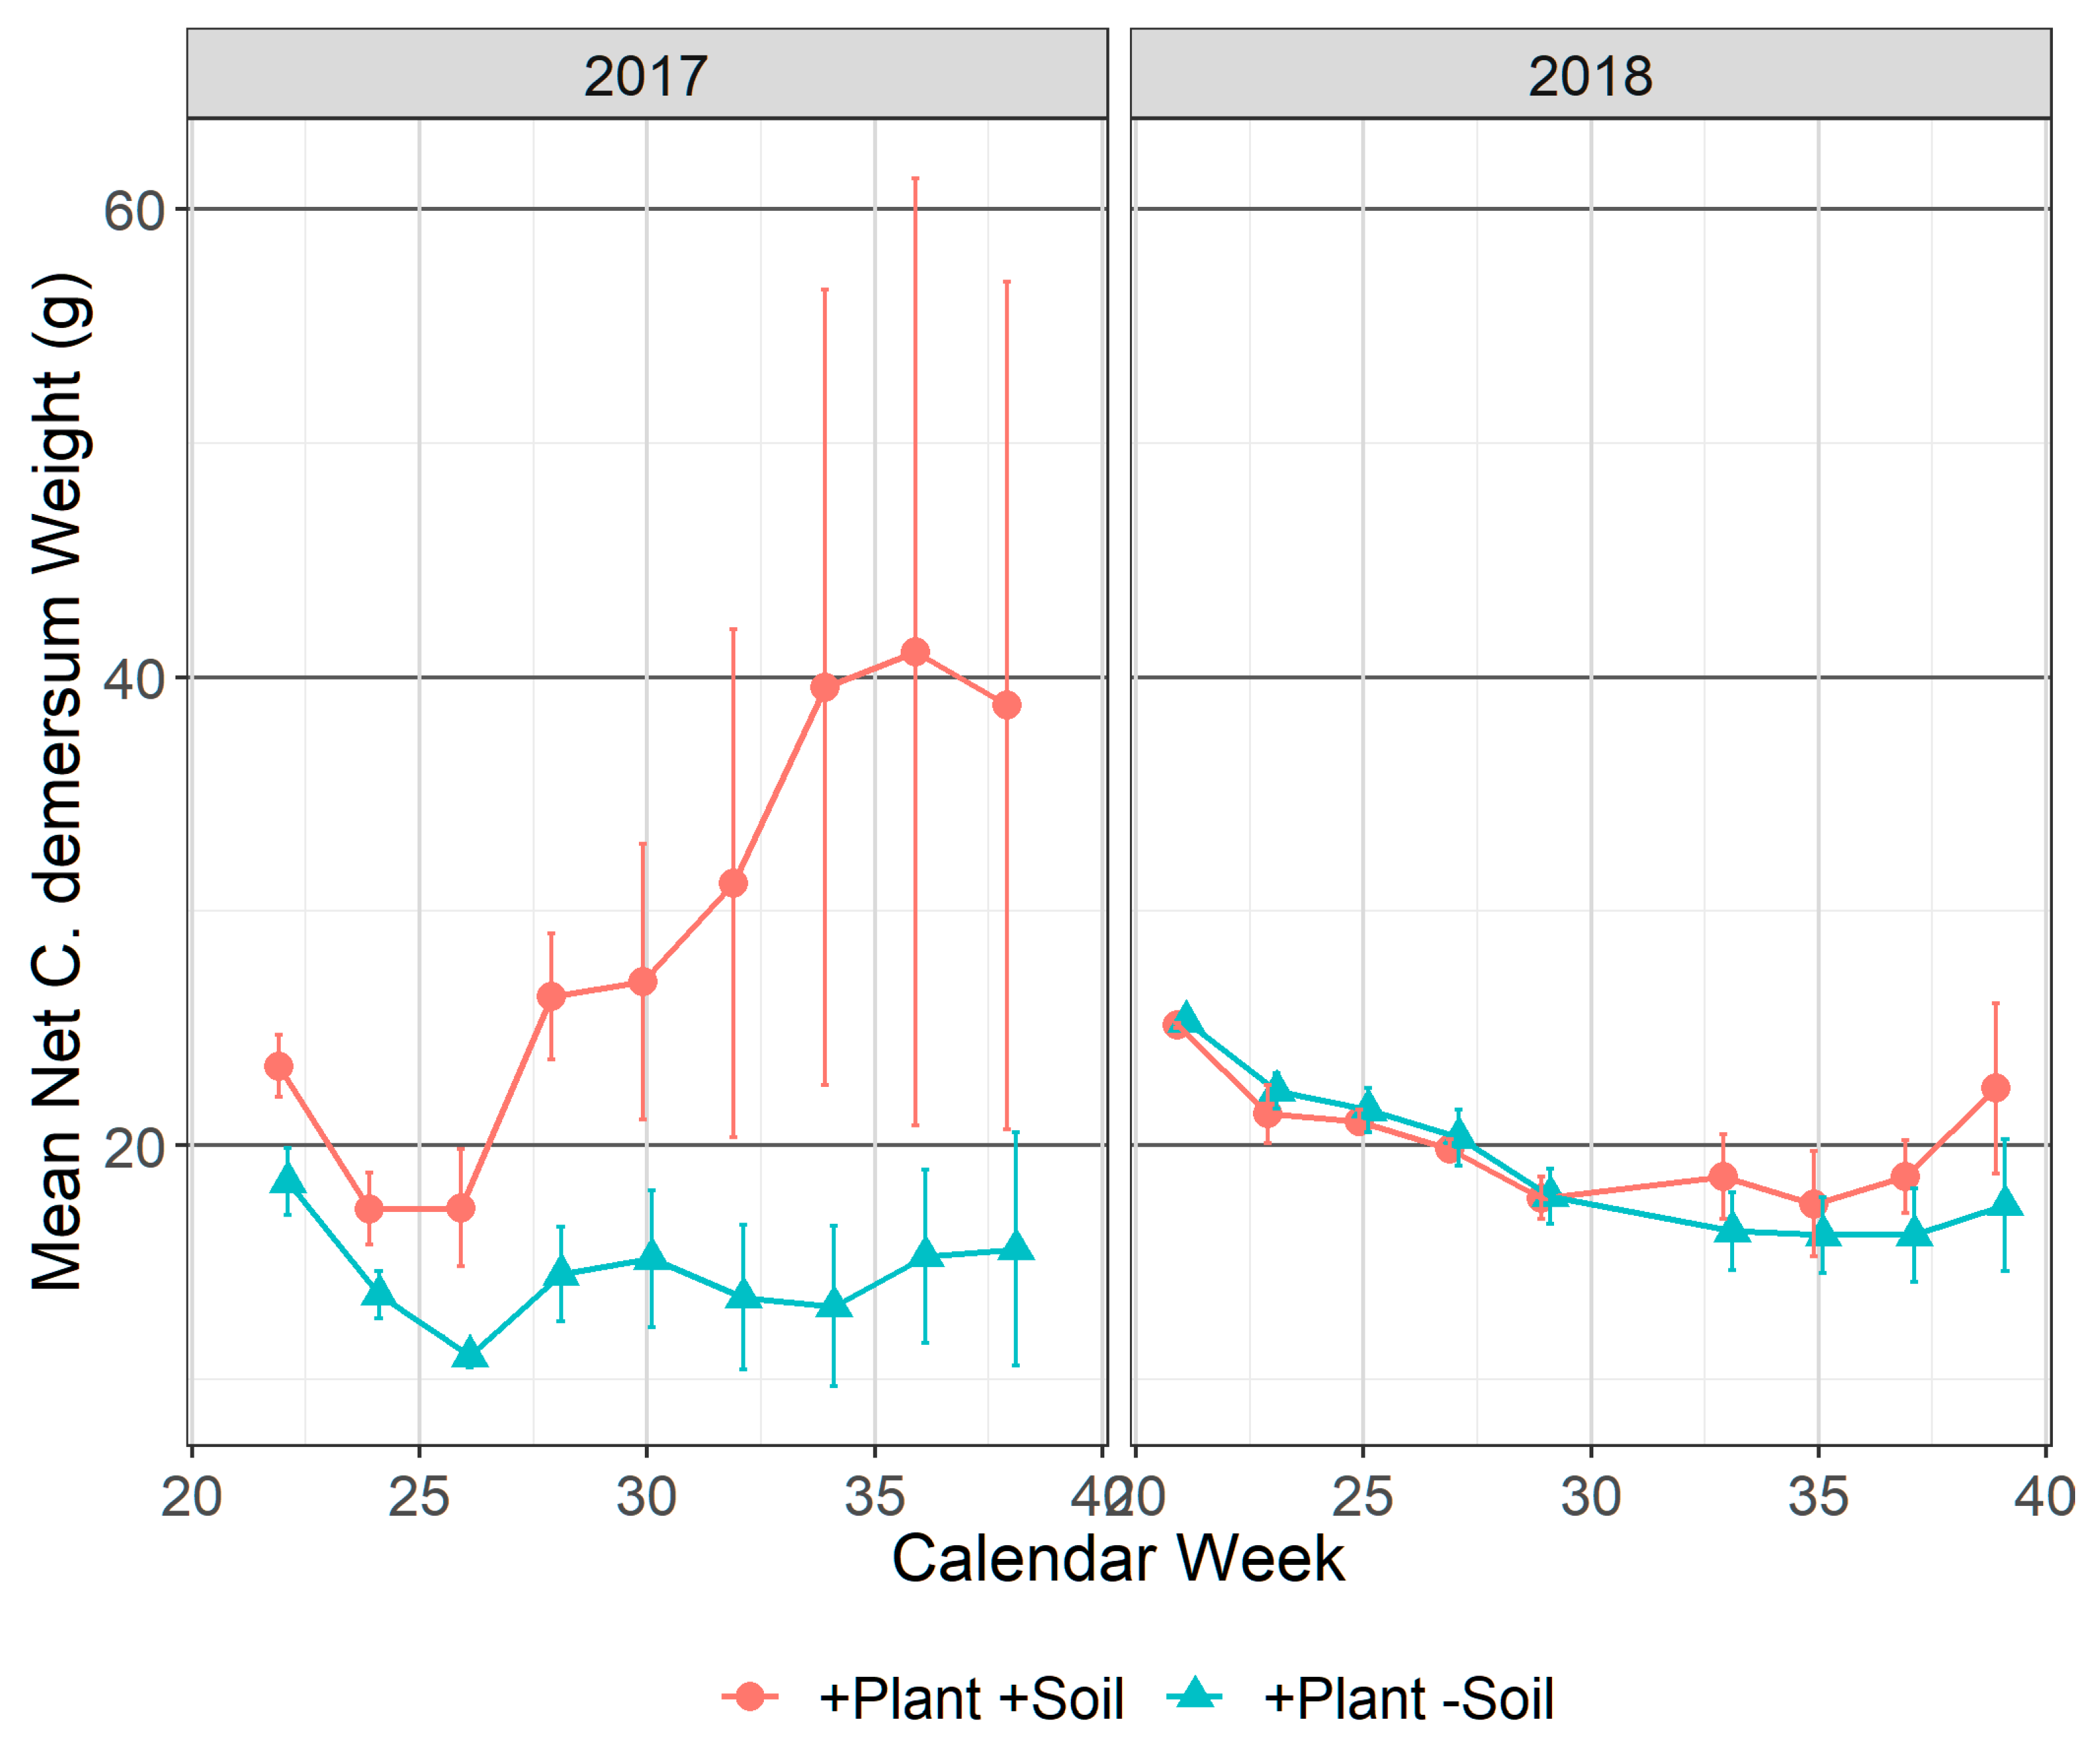
3.2.2. Ceratophyllum demersum
3.2.3. Adventitious Vegetation
3.3. Phytoplankton/Metaphyton Coverage
3.4. Macroinvertebrate Functional Groups
4. Discussion
4.1. The Effect of Overwintering (Brine Rejection)
4.2. Effect of Time
4.3. Installation of Soil
4.4. Effect of Soil
4.5. Effects of Vegetation
4.6. Extrapolation of Results from Mesocosms Studies
5. Conclusions
Supplementary Materials
Author Contributions
Funding
Data Availability Statement
Acknowledgments
Conflicts of Interest
References
- Bloesch, J. Mesocosm studies. Hydrobiologia 1988, 159, 221–222. [Google Scholar] [CrossRef]
- Schuijt, L.M.; Peng, F.-J.; van den Berg, S.J.P.; Dingemans, M.M.L.; Van den Brink, P.J. (Eco)toxicological tests for assessing impacts of chemical stress to aquatic ecosystems: Facts, challenges, and future. Sci. Total Environ. 2021, 795, 148776. [Google Scholar] [CrossRef]
- Odum, E.P. The Mesocosm. Bioscience 1984, 34, 558–562. [Google Scholar] [CrossRef]
- Caquet, T. Use of aquatic mesocosms in ecotoxicology: State of the art and perspectives. Radioprot.-Colloq. 2002, 37, 173–177. [Google Scholar] [CrossRef]
- McCullough, C.D.; Vandenberg, J. Studying Mine Pit Lake Systems Across Multiple Scales. Mine Water Environ. 2020, 39, 173–194. [Google Scholar] [CrossRef]
- Cappello, S.; Yakimov, M.M. Mesocosms for oil spill simulation. In Handbook of Hydrocarbon and Lipid Microbiology; Springer: Berlin/Heidelberg, Germany; Messina, Italy, 2010; pp. 3514–3521. ISBN 9783540775874. [Google Scholar]
- Gall, A.; Uebel, U.; Ebensen, U.; Hillebrand, H.; Meier, S.; Singer, G.; Wacker, A.; Striebel, M. Planktotrons: A novel indoor mesocosm facility for aquatic biodiversity and food web research. Limnol. Oceanogr. Methods 2017, 15, 663–677. [Google Scholar] [CrossRef]
- Arnold, D. Guidance Document on Testing Procedures for Pesticides in Freshwater Mesocosms: From the Workshop “A Meeting of Experts on Guidelines for Static Field Mesocosm Tests”; Abbots Ripton: Huntington, UK, 1991. [Google Scholar]
- Spivak, A.C.; Vanni, M.J.; Mette, E.M. Moving on up: Can results from simple aquatic mesocosm experiments be applied across broad spatial scales? Freshw. Biol. 2011, 56, 279–291. [Google Scholar] [CrossRef]
- Perceval, O.; Caquet, T.; Lagadic, L.; Bass, A.; Azam, D. Mesocosms Their Value as Tools for Managing the Quality of Aquatic Environments. In Recap of the Ecotoxicology Symposium, Proceedings of the Ecotoxicology Symposium, Le Croisic, France, 14–16 October 2009; Onema, INRA, Eds.; Onema: Vincennes, France, 2009. Available online: https://professionnels.ofb.fr/en/node/804 (accessed on 25 May 2023).
- Davies, J. Densified Fluid Fine Tails and Oil Sands Process Water: A Screening Study; COSIA: Vegreville, AB, Canada, 2018; Available online: https://cosia.ca/sites/default/files/attachments/2017%20Mesocosm%20Research%20Report.pdf (accessed on 10 March 2023).
- Melnichuk, R. Densified Fluid Fine Tails and Oil Sands Process Water—An Extension of the 2017 Study; COSIA: Vegreville, AB, Canada, 2020; Available online: https://cosia.ca/sites/default/files/attachments/2018%20Mesocosm%20Research%20Report.pdf (accessed on 10 March 2023).
- Trites, M.; Bayley, S.E. Vegetation communities in continental boreal wetlands along a salinity gradient: Implications for oil sands mining reclamation. Aquat. Bot. 2009, 91, 27–39. [Google Scholar] [CrossRef]
- OECD. Guidance Document on Simulated Freshwater Lentic Field Tests (Outdoor Microcosms and Mesocosms); Organization for Economic Co-operation and Development (OECD): Paris, France, 2006; Volume 33, Available online: https://one.oecd.org/document/env/jm/mono(2006)17/en/pdf (accessed on 10 March 2023).
- The SETAC Foundation for Environmental Education Workshop on Aquatic Microcosms for Ecological Assessment of Pesticides; Society of Environmental Toxicology and Chemistry (SETAC): Wintergreen, VA, USA, 1992; Available online: https://archive.org/details/workshoponaquati0000unse/mode/2up (accessed on 10 March 2023).
- Cowan, C.D. Using Carex Aquatilis as a Biological Assessment Tool in Monitoring Salt-Impacted Boreal Peatlands; Royal Roads University: Victoria, BC, Canada, 2017; Available online: https://viurrspace.ca/handle/10613/5309 (accessed on 25 May 2023).
- Sesin, V.; Davy, C.M.; Freeland, J.R. Review of Typha spp. (cattails) as toxicity test species for the risk assessment of environmental contaminants on emergent macrophytes. Environ. Pollut. 2021, 284, 117105. [Google Scholar] [CrossRef]
- Rooney, R.C.R. Wetland Assessment in Alberta’s Oil Sands Mining Area; University of Alberta: Edmonton, AB, Canada, 2011; Available online: https://era.library.ualberta.ca/items/f9791db5-824f-42d8-8f16-f846f9fcb729 (accessed on 25 May 2023).
- Lacoul, P.; Freedman, B. Environmental influences on aquatic plants in freshwater ecosystems. Environ. Rev. 2006, 14, 89–136. [Google Scholar] [CrossRef]
- Meese, R.J.; Tomich, P.A. Dots on the rocks: A comparison of percent cover estimation methods. J. Exp. Mar. Biol. Ecol. 1992, 165, 59–73. [Google Scholar] [CrossRef]
- Leonard, G.H.; Clark, R.P. Point quadrat versus video transect estimates of the cover of benthic red algae. Mar. Ecol. Prog. Ser. 1993, 101, 203. [Google Scholar] [CrossRef]
- Griggs, A.N.; Selckmann, G.M.; Cummins, J.; Buchanan, C. Methods for Estimating Filamentous Algae Cover in Streams and Rivers of the Shenandoah River Basin; Interstate Commission on the Potomac River Basin: Rockville, MD, USA, 2015. Available online: https://www.potomacriver.org/wp-content/uploads/2015/05/ICP15-01a_Griggs.pdf (accessed on 10 March 2023).
- Kilroy, C.; Booker, D.J.; Drummond, L.; Wech, J.A.; Snelder, T.H. Estimating periphyton standing crop in streams: A comparison of chlorophyll a sampling and visual assessments. N. Z. J. Mar. Freshw. Res. 2013, 47, 208–224. [Google Scholar] [CrossRef]
- Wildlife Supply Company Hester-Dendy Substrate Samplers 2009. Available online: https://wildco.com/wp-content/uploads/2017/05/150-A-Series-Hester-Dendy.pdf (accessed on 10 March 2023).
- Klemm, D.J.; Lewis, P.A.; Fulk, F.; Lazorchak, J.M. Macroinvertebrate Field and Laboratory Methods for Evaluating the Biological Intergrity of Surface Waters; Cincinnati, Office of Modeling, Monitoring Systems, and Quality Assurance, Office of Research and Development: Cincinnati, OH, USA, 1990. Available online: https://catalogue.nla.gov.au/Record/4040618 (accessed on 10 March 2020).
- Bloomfield, V.A. Using R for Numerical Analysis in Science and Engineering; Chambers, J.M., Hothorn, T., Lang, D.T., Wickham, H., Eds.; CRC Press: Minneapolis, MN, USA, 2014; ISBN 978-1-4398-8448-5. Available online: http://students.aiu.edu/submissions/profiles/resources/onlineBook/j3E6s8_Using_R_for_Numerical_Analysis_in_Science_and_Engineering.pdf (accessed on 25 May 2023).
- Pieters, R.; Lawrence, G.A. Physical processes and meromixis in pit lakes subject to ice cover. Can. J. Civ. Eng. 2014, 41, 569–578. [Google Scholar] [CrossRef]
- Pieters, R.; Lawrence, G.A. Effect of salt exclusion from lake ice on seasonal circulation. Limnol. Oceanogr. 2009, 54, 401–412. [Google Scholar] [CrossRef]
- Chen, Z.; Melnichuk, R. A Mesocosm—Scale Study of Chemical and Ecological Response to Different Types of Oil Sands Tailings and Process Water (2019–2021); COSIA: Vegreville, AB, Canada, 2022. [Google Scholar]
- Shiraiwa, Y.; Goyal, A.; Tolbert, N.E. Alkalization of the medium by unicellular green algae during uptake dissolved inorganic carbon. Plant Cell Physiol. 1993, 34, 649–657. [Google Scholar] [CrossRef]
- Shaw, J. Alberta Water Quality Guideline for the Protection of Freshwater Aquatic Life: Dissolved Oxygen; Alberta Environmental Protection: Edmonton, AB, Canada, 1997; Available online: https://open.alberta.ca/dataset/82793404-d376-4b9e-a399-94da6e279b0a/resource/f223f816-1268-4f4e-9698-78824bb8a5fe/download/7254.pdf (accessed on 10 March 2023).
- Dings-Avery, C.V. Effects of Gamma Irradiation Treatment of Oil Sands Process Material on Zooplankton Accrual and Early Community Development in Field Based Mesocosms; University of Windsor: Windsor, ON, Canada, 2019; Available online: https://scholar.uwindsor.ca/etd/7697/ (accessed on 25 May 2023).
- Jasser, I. The influence of macrophytes on a phytoplankton community in experimental conditions. Hydrobiologia 1995, 306, 21–32. [Google Scholar] [CrossRef]
- Sharp, J.L. Managing Cattail (Typha latifolia) Growth in Wetland Systems; University of North Texas: Denton, TX, USA, 2002; Available online: https://digital.library.unt.edu/ark:/67531/metadc3210/m2/1/high_res_d/thesis.pdf (accessed on 25 May 2023).
- Cañedo-Argüelles, M.; Rieradevall, M. Early succession of the macroinvertebrate community in a shallow lake: Response to changes in the habitat condition. Limnologica 2011, 41, 363–370. [Google Scholar] [CrossRef]
- Macanowicz, N.; Boeing, W.J.; Gould, W.R. Evaluation of methods to assess benthic biodiversity of desert sinkholes. Freshw. Sci. 2013, 32, 1101–1110. [Google Scholar] [CrossRef]
- Kersting, K. Freshwater Field Tests for Hazard Assessment of Chemicals; Hill, I.R., Heimbach, F., Leeuwangh, P., Matthiessen, P., Eds.; Lewis Publishers: Boca Raton, FL, USA, 1994; Available online: https://books.google.ca/books?id=3Oi7jipNOuMC&printsec=frontcover&source=gbs_ge_summary_r&cad=0#v=onepage&q&f=false (accessed on 25 May 2023).
- Carfagna, S.; Bottone, C.; Cataletto, P.R.; Petriccione, M.; Pinto, G.; Salbitani, G.; Vona, V.; Pollio, A.; Ciniglia, C. Impact of Sulfur Starvation in Autotrophic and Heterotrophic Cultures of the Extremophilic Microalga Galdieria phlegrea (Cyanidiophyceae). Plant Cell Physiol. 2016, 57, 1890–1898. [Google Scholar] [CrossRef]
- Gregor, J.; Maršálek, B. Freshwater phytoplankton quantification by chlorophyll a: A comparative study of in vitro, in vivo and in situ methods. Water Res. 2004, 38, 517–522. [Google Scholar] [CrossRef] [PubMed]
- Daam, M.A.; Cerejeira, M.J.; van den Brink, P.J.; Brock, T.C.M. Is it possible to extrapolate results of aquatic microcosm and mesocosm experiments with pesticides between climate zones in Europe? Environ. Sci. Pollut. Res. 2011, 18, 123–126. [Google Scholar] [CrossRef] [PubMed]


| Functional Groups (%) | 2017 | 2018 | ||||
|---|---|---|---|---|---|---|
| +Plant | +Plant | −Plant | +Plant | +Plant | −Plant | |
| +Soil | −Soil | −Soil | +Soil | −Soil | −Soil | |
| Predators | 7.6% | 22.7% | 3.5% | 21.6% | 25.3% | 10.6% |
| Shredder-Herbivores | 0.3% | 0.6% | 0.5% | 1.1% | 0.0% | 0.0% |
| Collector-Gatherers | 60.2% | 58.7% | 75.5% | 33.3% | 49.3% | 26.6% |
| Scrapers | 3.6% | 6.7% | 1.0% | 41.2% | 24.3% | 62.1% |
| Macrophyte-Herbivore | 0.0% | 0.0% | 0.0% | 1.4% | 0.0% | 0.0% |
| Collector-Filterer | 27.6% | 10.5% | 18.9% | 0.3% | 0.0% | 0.4% |
| Omnivore | 0.0% | 0.1% | 0.0% | 0.3% | 0.0% | 0.0% |
| Unclassified | 0.7% | 0.8% | 0.5% | 0.7% | 1.1% | 0.4% |
| Abundance 1 | 351 ± 133 | 291 ± 239 | 347 ± 56 | 58 ± 23 | 63 ± 55 | 51 ± 42 |
Disclaimer/Publisher’s Note: The statements, opinions and data contained in all publications are solely those of the individual author(s) and contributor(s) and not of MDPI and/or the editor(s). MDPI and/or the editor(s) disclaim responsibility for any injury to people or property resulting from any ideas, methods, instructions or products referred to in the content. |
© 2023 by the authors. Licensee MDPI, Basel, Switzerland. This article is an open access article distributed under the terms and conditions of the Creative Commons Attribution (CC BY) license (https://creativecommons.org/licenses/by/4.0/).
Share and Cite
Davies, J.; Melnichuk, R.; Aumann, C.; Chen, Z.; Eaton, B. Using Aquatic Mesocosms to Assess the Effects of Soil and Vegetation for Informing Environmental Research. Environments 2023, 10, 129. https://doi.org/10.3390/environments10070129
Davies J, Melnichuk R, Aumann C, Chen Z, Eaton B. Using Aquatic Mesocosms to Assess the Effects of Soil and Vegetation for Informing Environmental Research. Environments. 2023; 10(7):129. https://doi.org/10.3390/environments10070129
Chicago/Turabian StyleDavies, Jim, Ryan Melnichuk, Craig Aumann, Zhongzhi Chen, and Brian Eaton. 2023. "Using Aquatic Mesocosms to Assess the Effects of Soil and Vegetation for Informing Environmental Research" Environments 10, no. 7: 129. https://doi.org/10.3390/environments10070129
APA StyleDavies, J., Melnichuk, R., Aumann, C., Chen, Z., & Eaton, B. (2023). Using Aquatic Mesocosms to Assess the Effects of Soil and Vegetation for Informing Environmental Research. Environments, 10(7), 129. https://doi.org/10.3390/environments10070129