
A Survey on Fluorinated Greenhouse Gases in Taiwan: Emission Trends, Regulatory Strategies, and Abatement Technologies


Abstract
1. Introduction
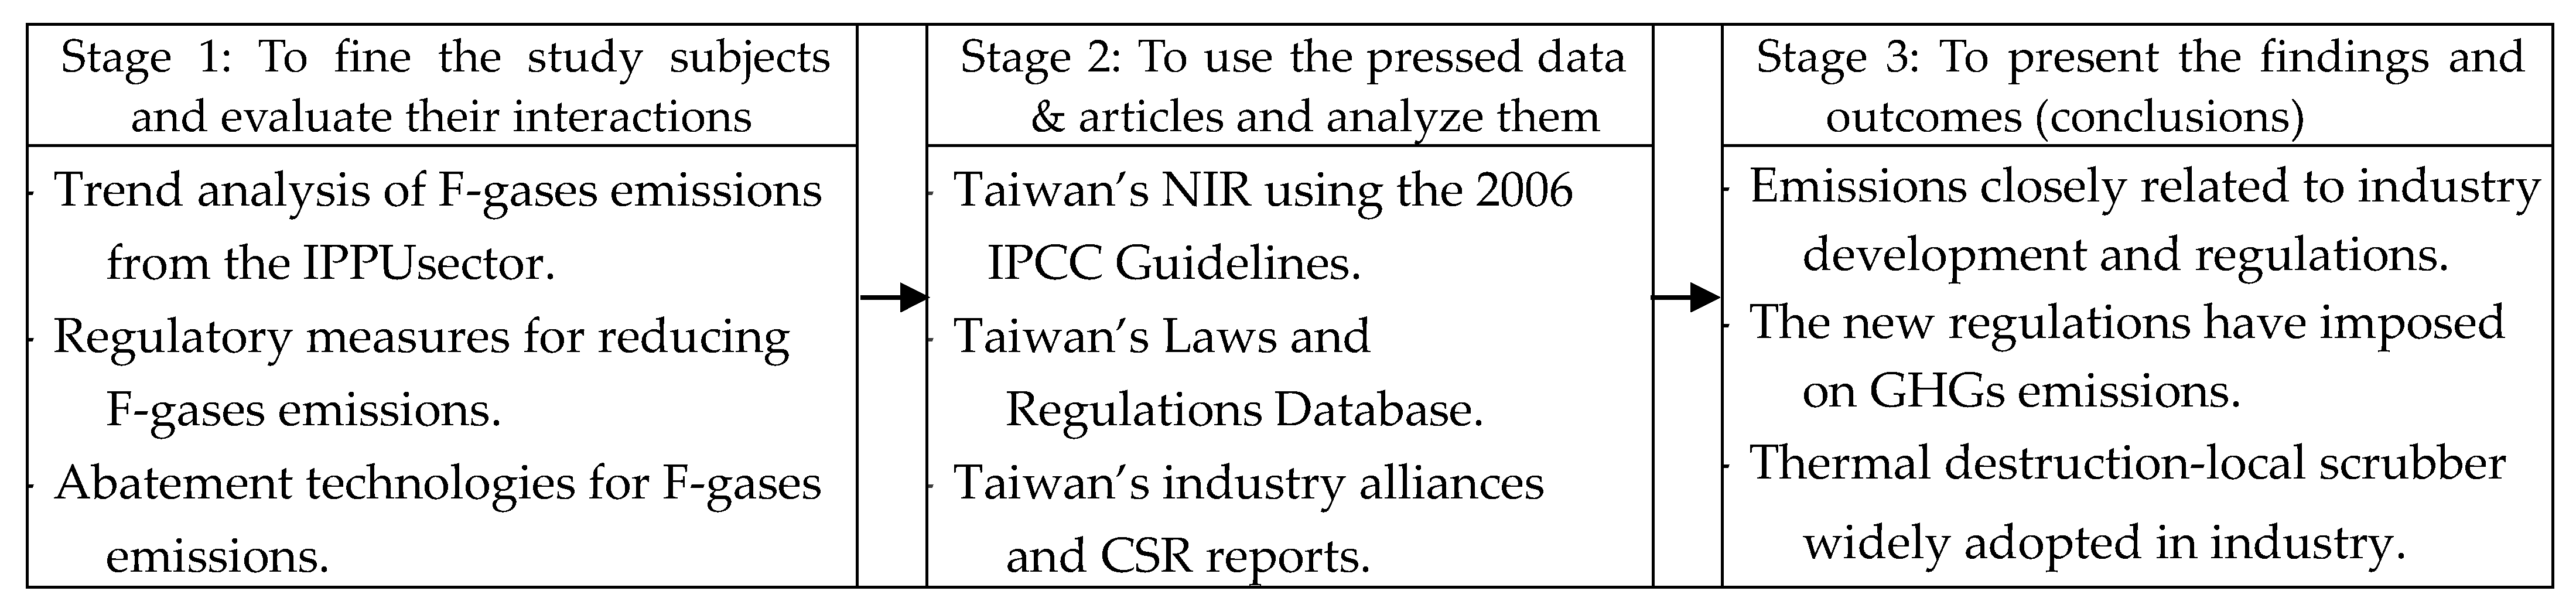
2. Data Mining Methods
3. Results and Discussion
3.1. Analysis of Fluorinated Greenhouse Gases Emissions in Taiwan
3.1.1. Hydrofluorocarbons (HFCs)
3.1.2. Perfluorocarbons (PFCs)
3.1.3. Sulfur Hexafluoride (SF6)
3.1.4. Nitrogen Trifluoride (NF3)
3.2. Regulatory Strategies for Controlling the Emissions of Fluorinated Greenhouse Gases
3.2.1. Air Pollution Control Act
- -
- The stationary sources (e.g., vents or pipelines) in the process industries shall comply with the emission standards of designated air pollutants by installing a closed vent/collection system and an air pollution control system;
- -
- According to the specially designated industry categories, facilities, pollutant items, or areas, the EPA, in consultation with relevant agencies (i.e., the Ministry of Economic Affairs), shall determine the emission standards.
3.2.2. Climate Change Response Act
- -
- Process modification: Equipment renewal by phase-out, fluorinated gases (F-gases) reduction by environment-friendly substitutes, and recovery/recycling/destruction systems installed in the industrial sector;
- -
- Circular economy: Recovery/recycling/storage systems installed in the waste (waste electronic appliances like air conditioners and refrigerators, and waste vehicles) management sector.
3.2.3. Waste Management Act
3.3. Survey of Current Abatement Technologies for Controlling the Emissions of Fluorinated GHGs
4. Conclusions
Author Contributions
Funding
Institutional Review Board Statement
Informed Consent Statement
Data Availability Statement
Conflicts of Interest
References
- World Meteorological Organization. Greenhouse Gases. Available online: https://public.wmo.int/en/our-mandate/focus-areas/environment/greenhouse-gases (accessed on 21 May 2023).
- United Nations Environment Programme. The Montreal Protocol on Substances That Deplete the Ozone Layer. Available online: https://ozone.unep.org/treaties/montreal-protocol (accessed on 21 May 2023).
- Intergovernmental Panel on Climate Change. Climate Change 2021: The Physical Science Basis. Available online: https://www.ipcc.ch/report/sixth-assessment-report-working-group-i/ (accessed on 21 May 2023).
- Velders, G.J.M.; Daniel, J.S.; Montzka, S.A.; Vimont, I.; Rigby, M.; Krummel, P.B.; Muhle, J.; O’Doherty, S.; Prinn, R.G.; Weiss, R.F.; et al. Projections of hydrofluorocarbon (HFC) emissions and the resulting global warming based on recent trends in observed abundances and current policies. Atmos. Chem. Phys. 2022, 22, 6087–6101. [Google Scholar] [CrossRef]
- Chen, A.; Chen, D.; Hu, X.; Harth, C.M.; Young, D.; Mühle, J.; Krummel, P.B.; O’Doherty, S.; Weiss, R.F.; Prinn, R.G.; et al. Historical trend of ozone-depleting substances and hydrofluorocarbon concentrations during 2004–2020 derived from satellite observations and estimates for global emissions. Environ. Pollut. 2023, 316 Pt 1, 120570. [Google Scholar] [CrossRef] [PubMed]
- Rošková, Z.; Schneider, J.; Štengel, M. Predicted hydrofluorocarbon (HFC) and perfluorocarbon (PFC) emissions for the years 2010–2050 in the Czech Republic. Atmosphere 2023, 14, 111. [Google Scholar] [CrossRef]
- Intergovernmental Panel on Climate Change. Global Warming of 1.5 °C. Available online: https://www.ipcc.ch/sr15/ (accessed on 21 May 2023).
- Sovacool, B.K.; Griffiths, S.; Kim, J.; Bazilian, M. Climate change and industrial F-gases: A critical and systematic review of developments, sociotechnical systems and policy options for reducing synthetic greenhouse gas emissions. Renew. Sustain. Energy Rev. 2021, 141, 110759. [Google Scholar] [CrossRef]
- Lindley, A.A.; McCulloch, A. Regulating to reduce emissions of fluorinated greenhouse gases. J. Fluor. Chem. 2005, 126, 1457–1462. [Google Scholar] [CrossRef]
- Müllerová, M.; Krtková, E.; Rošková, Z. F-gases: Trends, applications and newly applied gases in the Czech Republic. Atmosphere 2020, 11, 455. [Google Scholar] [CrossRef]
- Sheldon, D.J.; Crimmin, M.R. Repurposing of F-gases: Challenges and opportunities in fluorine chemistry. Chem. Soc. Rev. 2022, 51, 4977–4995. [Google Scholar] [CrossRef]
- Heath, E. Amendment to the Montreal Protocol on Substances that Deplete the Ozone Layer (Kigali Amendment). Int. Leg. Mater. 2017, 56, 193–205. [Google Scholar] [CrossRef]
- Höglund-Isaksson, L.; Purohit, P.; Amann, M.; Bertok, I.; Rafaj, P.; Schöpp, W.; Borken-Kleefeld, J. Cost estimates of the Kigali Amendment to phase-down hydrofluorocarbons. Environ. Sci. Policy 2017, 75, 138–147. [Google Scholar] [CrossRef]
- Castro, P.J.; Aráujo, J.M.M.; Martinho, G.; Pereiro, A.B. Waste management strategies to mitigate the effects of fluorinated greenhouse gases on climate change. Appl. Sci. 2021, 11, 4367. [Google Scholar] [CrossRef]
- Environmental Protection Administration (EPA). Taiwan Greenhouse Gases Inventory; EPA: Taipei, Taiwan, 2022. [Google Scholar]
- Customs Administration, Ministry of Finance, Taiwan. Trade Statistics. Available online: https://portal.sw.nat.gov.tw/APGA/GA30 (accessed on 12 May 2023).
- Tsai, W.T.; Lin, Y.Q. Trend Analysis of air quality index (AQI) and greenhouse gas (GHG) emissions in Taiwan and their regulatory countermeasures. Environments 2021, 8, 29. [Google Scholar] [CrossRef]
- Miller, B.R.; Rigby, M.; Kuijpers, L.J.M.; Krummel, P.B.; Steele, L.P.; Leist, M.; Fraser, P.J.; McCulloch, A.; Harth, C.; Salameh, P.; et al. HFC-23 (CHF3) emission trend response to HCFC-22 (CHClF2) production and recent HFC-23 emission abatement measures. Atmos. Chem. Phys. 2010, 10, 7875–7890. [Google Scholar] [CrossRef]
- National Development Council, Taiwan. Taiwan’s Pathway to Net-Zero Emissions in 2050. Available online: https://www.ndc.gov.tw/en/Content_List.aspx?n=B927D0EDB57A7A3A&upn=A2B386E427ED5689 (accessed on 20 May 2023).
- Tsai, W.T.; Chen, H.P.; Hsieh, W.Y. A review of uses, environmental hazards and recovery/recycle technologies of perfluorocarbons (PFCs) emissions from the semiconductor manufacturing processes. J. Loss. Prev. Process Ind. 2002, 15, 65–75. [Google Scholar] [CrossRef]
- Tsai, W.T. An overview of environmental hazards and exposure risk of hydrofluorocarbons (HFCs). Chemosphere 2005, 61, 1539–1547. [Google Scholar] [CrossRef]
- Tsai, W.T. The decomposition products of sulfur hexafluoride (SF6): Reviews of environmental and health risk analysis. J. Fluor. Chem. 2007, 128, 1345–1352. [Google Scholar] [CrossRef]
- Tsai, W.T. Environmental and health risk analysis of nitrogen trifluoride (NF3), a toxic and potent greenhouse gas. J. Hazard. Mater. 2008, 159, 257–263. [Google Scholar] [CrossRef]
- Tsai, W.T. Environmental hazards and health risk of common liquid perfluoro-n-alkanes, potent greenhouse gases. Environ. Int. 2009, 35, 418–424. [Google Scholar] [CrossRef]
- Chen, L.T.; Hu, A.H. Voluntary GHG reduction of industrial sectors in Taiwan. Chemosphere 2012, 88, 1074–1082. [Google Scholar] [CrossRef]
- Cheng, J.H.; Bartos, S.C.; Lee, W.M.; Li, S.N.; Lu, J. SF6 usage and emission trends in the TFT-LCD industry. Int. J. Greenh. Gas Control 2013, 17, 106–110. [Google Scholar] [CrossRef]
- Williams, C. Research methods. J. Bus. Econ. Res. 2007, 5, 65–71. [Google Scholar] [CrossRef]
- Intergovernmental Panel on Climate Change. 2006 IPCC Guidelines for National Greenhouse Gas Inventories. Available online: https://www.ipcc-nggip.iges.or.jp/public/2006gl/ (accessed on 2 May 2023).
- Ministry of Justice, Taiwan. Laws and Regulations Database. Available online: https://law.moj.gov.tw/Eng/index.aspx (accessed on 3 May 2023).
- Taiwan Semiconductor Industry Association. Available online: https://www.tsia.org.tw/EN/index (accessed on 2 May 2023).
- Taiwan Panel & Solution Association. Available online: http://www.tpasa.org.tw/ (accessed on 2 May 2023).
- Taiwan Semiconductor Manufacturing Company (TSMC) 2021 Sustainability Report. Available online: https://esg.tsmc.com/download/file/2021_sustainabilityReport/english/e-all.pdf (accessed on 12 May 2023).
- Borowski, P.F. Mitigating climate change and the development of green energy versus a return to fossil fuels due to the energy crisis in 2022. Energies 2022, 15, 9289. [Google Scholar] [CrossRef]
- Borowski, P.F. Water and hydropower—Challenges for the economy and enterprises in times of climate change in Africa and Europe. Water 2022, 14, 3631. [Google Scholar] [CrossRef]
- Weiss, R.F.; Mühle, J.; Salameh, P.K.; Harth, C.M. Nitrogen trifluoride in the global atmosphere. Geophys. Res. Lett. 2008, 35, L20821. [Google Scholar] [CrossRef]
- Yasaka, Y.; Karkour, S.; Shobatake, K.; Itsubo, N.; Yakushiji, F. Life-cycle assessment of refrigerants for air conditioners considering reclamation and destruction. Sustainability 2023, 15, 473. [Google Scholar] [CrossRef]
- Wei, M.S.; Huang, K.H. Recycling and reuse of industrial wastes in Taiwan. Waste Manag. 2001, 21, 93–97. [Google Scholar] [CrossRef]
- Tsai, W.T.; Chou, Y.H.; Lin, C.M.; Hsu, H.C.; Lin, K.Y.; Chiu, C.S. Perspectives on resource recycling from municipal solid waste in Taiwan. Resour. Policy 2007, 32, 69–79. [Google Scholar] [CrossRef]
- Tsai, W.T. Current practice and policy for transforming E-waste into urban mining: Case study in Taiwan. Int. J. Environ. Waste Manag. 2019, 23, 1–15. [Google Scholar] [CrossRef]
- Tsai, W.T. Recycling of waste electrical & electronic equipment (WEEE) and its toxics-containing management in Taiwan—A case study. Toxics 2020, 8, 48. [Google Scholar]
- Chang, B.L.; Tsai, C.J. Greenhouses gases surveillance and reduction research: A case study in a TFT-LED factory. Ind. Pollut. Prev. Control 2006, 25, 1–20. (In Chinese) [Google Scholar]
- US Environmental Protection Agency. Significant New Alternatives Policy (SNAP) Program. Available online: https://www.epa.gov/snap (accessed on 18 May 2023).
- Mota-Babiloni, A.; Makhnatch, P. Predictions of European refrigerants place on the market following F-gas regulation restrictions. Int. J. Refrig. 2021, 127, 101–110. [Google Scholar] [CrossRef]
- Martinho, G.; Castro, P.J.; Santos, P.; Alves, A.; Araújo, J.M.M.; Pereiro, A.B. A social study of the technicians dealing with refrigerant gases: Diagnosis of the behaviours, knowledge and importance attributed to the F-gases. Int. J. Refrig. 2023, 146, 341–348. [Google Scholar] [CrossRef]
- Lee, S.J.; Ryu, I.S.; Jeon, S.G.; Moon, S.-H. Emission sources and mitigation of fluorinated Non-CO2 greenhouse gas in registered CDM projects. Greenh. Gases Sci. Technol. 2017, 7, 589–601. [Google Scholar] [CrossRef]


| F-Gases 2 | Formula | Atmospheric Lifetime (Year) | Radiative Efficiency (W/(m2-ppb)) | GWP 3 | Main Applications |
|---|---|---|---|---|---|
| HFCs | |||||
| HFC-23 | CHF3 | 228 | 0.191 | 14,600 | Etching gas |
| HFC-32 | CH2F2 | 5.4 | 0.111 | 771 | Refrigerant, Etching gas |
| HFC-41 | CH3F | 2.8 | 0.025 | 135 | Etching gas |
| HFC-125 | CHF2CF3 | 30 | 0.234 | 3740 | Refrigerant |
| HFC-134 | CHF2CHF2 | 10 | 0.194 | 1.260 | Refrigerant |
| HFC-134a | CH2FCF3 | 14 | 0.167 | 1530 | Refrigerant, aerosol propellant |
| HFC-143 | CH2FCHF2 | 3.6 | 0.128 | 364 | Refrigerant |
| HFC-143a | CH3CF3 | 51 | 0.168 | 5810 | Refrigerant |
| HFC-152a | CH3CHF2 | 1.6 | 0.102 | 164 | Blowing agent, aerosol propellant |
| HFC-227ea | CF3CHFCF3 | 36 | 0.273 | 3600 | Extinguishing agent |
| HFC-236fa | CF3CH2CF3 | 213 | 0.251 | 8690 | Extinguishing agent |
| HFC-245fa | CHF2CH2CF3 | 7.9 | 0.245 | 962 | Refrigerant |
| HFC-365mfc | CH3CF2CH2CF3 | 8.9 | 0.228 | 914 | Cleaning solvent, Blowing agent |
| HFC-43-10mee | CF3CHFCHFCF2CF3 | 17 | 0.357 | 1600 | Cleaning solvent |
| PFCs | |||||
| PFC-14 | CF4 | 50,000 | 0.099 | 7380 | Etching gas |
| PFC-116 | C2F6 | 10,000 | 0.261 | 12,400 | Etching gas |
| PFC-218 | C3F8 | 2600 | 0.27 | 9290 | Etching gas |
| PFC-c-318 | cyc (-CF2CF2CF2CF2-) | 3200 | 0.314 | 10,200 | Etching gas |
| PFC-31-10 | n-C4F10 | 2600 | 0.369 | 10,000 | Etching gas |
| PFC-51-14 | n-C6F14 | 3100 | 0.449 | 8620 | Coolant fluid |
| Sulfur hexafluoride | SF6 | 1000 | 0.567 | 24,300 | Insulating gas, Etching gas |
| Nitrogen trifluoride | NF3 | 569 | 0.204 | 17,400 | Etching gas |
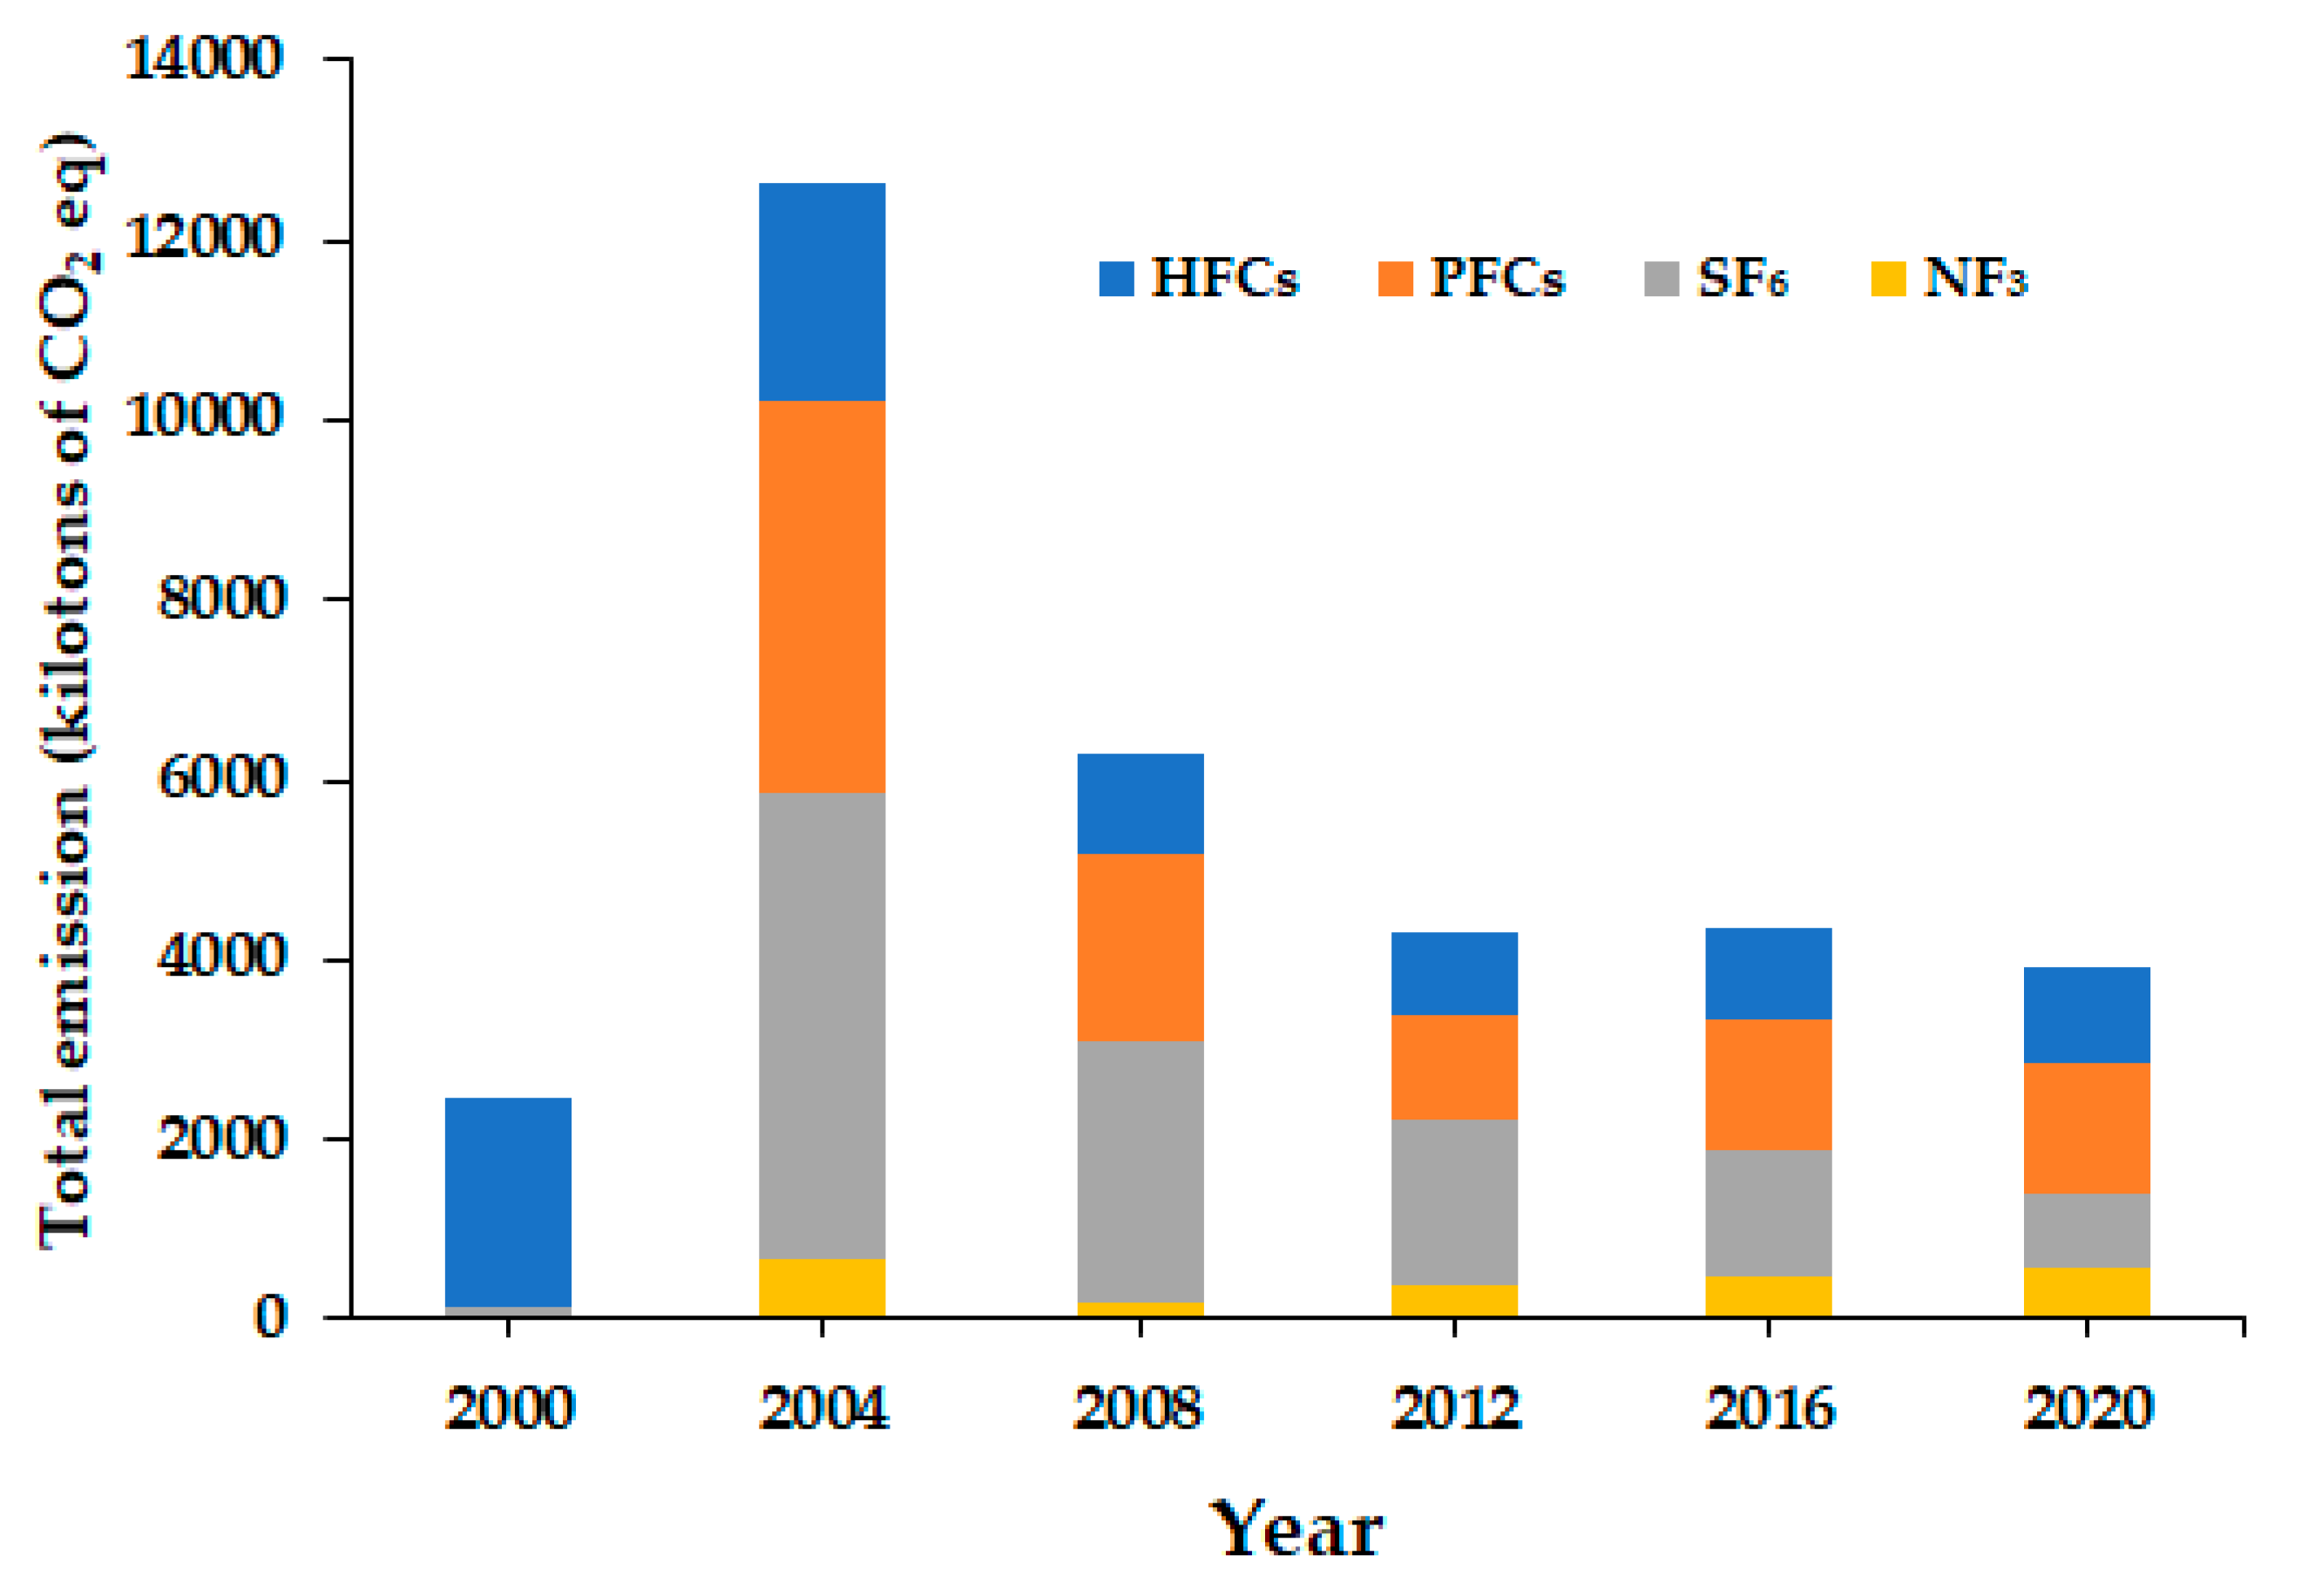
| Year | HFCs | PFCs | SF6 | NF3 | Total |
|---|---|---|---|---|---|
| 2000 | 2319 | 13 | 120 | 10 | 2462 |
| 2001 | 2619 | 2939 | 746 | 235 | 6538 |
| 2002 | 2216 | 4143 | 3914 | 398 | 10,671 |
| 2003 | 2397 | 4198 | 4385 | 540 | 11,520 |
| 2004 | 2451 | 4341 | 5193 | 659 | 12,643 |
| 2005 | 1098 | 3470 | 4951 | 765 | 10,284 |
| 2006 | 1015 | 3664 | 3858 | 688 | 9225 |
| 2007 | 1122 | 3372 | 3381 | 798 | 8673 |
| 2008 | 1074 | 2082 | 2912 | 204 | 6273 |
| 2009 | 1081 | 1560 | 2452 | 577 | 5607 |
| 2010 | 971 | 1770 | 2218 | 258 | 5217 |
| 2011 | 1053 | 1781 | 1918 | 420 | 5172 |
| 2012 | 907 | 1141 | 1852 | 388 | 4288 |
| 2013 | 1019 | 1345 | 1997 | 773 | 5134 |
| 2014 | 1048 | 1556 | 1730 | 667 | 5001 |
| 2015 | 1020 | 1347 | 1523 | 662 | 4552 |
| 2016 | 1026 | 1441 | 1418 | 472 | 4356 |
| 2017 | 1023 | 1409 | 1416 | 440 | 4298 |
| 2018 | 1013 | 1536 | 1302 | 509 | 4360 |
| 2019 | 1027 | 1420 | 935 | 473 | 3855 |
| 2020 | 1053 | 1447 | 842 | 564 | 3906 |
| Year | Emission Source 2 | Total | ||||
|---|---|---|---|---|---|---|
| 2B | 2C | 2E | 2F | 2G | ||
| 2000 | 2319 | 0 | 143 | 0 | 0 | 2462 |
| 2001 | 2567 | 0 | 3971 | 0 | 0 | 6538 |
| 2002 | 2157 | 1027 | 5544 | 0 | 1943 | 10,671 |
| 2003 | 1937 | 1027 | 6212 | 401 | 1943 | 11,520 |
| 2004 | 1710 | 1357 | 6841 | 682 | 2053 | 12,643 |
| 2005 | 0 | 1063 | 6722 | 996 | 1503 | 10,284 |
| 2006 | 0 | 770 | 6789 | 896 | 770 | 9225 |
| 2007 | 0 | 440 | 6358 | 922 | 953 | 8673 |
| 2008 | 0 | 144 | 4305 | 929 | 895 | 6273 |
| 2009 | 0 | 235 | 3857 | 812 | 703 | 5607 |
| 2010 | 0 | 57 | 4152 | 770 | 238 | 5217 |
| 2011 | 0 | 50 | 3989 | 881 | 252 | 5172 |
| 2012 | 0 | 30 | 3280 | 783 | 195 | 4288 |
| 2013 | 0 | 38 | 4124 | 812 | 160 | 5134 |
| 2014 | 0 | 33 | 3995 | 828 | 146 | 5001 |
| 2015 | 0 | 43 | 3530 | 851 | 128 | 4552 |
| 2016 | 0 | 41 | 3398 | 835 | 82 | 4356 |
| 2017 | 0 | 59 | 3329 | 821 | 79 | 4298 |
| 2018 | 0 | 81 | 3319 | 811 | 149 | 4360 |
| 2019 | 0 | 43 | 2856 | 846 | 110 | 3855 |
| 2020 | 0 | 36 | 2876 | 861 | 133 | 3906 |
Disclaimer/Publisher’s Note: The statements, opinions and data contained in all publications are solely those of the individual author(s) and contributor(s) and not of MDPI and/or the editor(s). MDPI and/or the editor(s) disclaim responsibility for any injury to people or property resulting from any ideas, methods, instructions or products referred to in the content. |
© 2023 by the authors. Licensee MDPI, Basel, Switzerland. This article is an open access article distributed under the terms and conditions of the Creative Commons Attribution (CC BY) license (https://creativecommons.org/licenses/by/4.0/).
Share and Cite
Tsai, W.-T.; Tsai, C.-H. A Survey on Fluorinated Greenhouse Gases in Taiwan: Emission Trends, Regulatory Strategies, and Abatement Technologies. Environments 2023, 10, 113. https://doi.org/10.3390/environments10070113
Tsai W-T, Tsai C-H. A Survey on Fluorinated Greenhouse Gases in Taiwan: Emission Trends, Regulatory Strategies, and Abatement Technologies. Environments. 2023; 10(7):113. https://doi.org/10.3390/environments10070113
Chicago/Turabian StyleTsai, Wen-Tien, and Chi-Hung Tsai. 2023. "A Survey on Fluorinated Greenhouse Gases in Taiwan: Emission Trends, Regulatory Strategies, and Abatement Technologies" Environments 10, no. 7: 113. https://doi.org/10.3390/environments10070113
APA StyleTsai, W.-T., & Tsai, C.-H. (2023). A Survey on Fluorinated Greenhouse Gases in Taiwan: Emission Trends, Regulatory Strategies, and Abatement Technologies. Environments, 10(7), 113. https://doi.org/10.3390/environments10070113