Article

Assessment of the Impact of a New Industrial Discharge on an Urban Wastewater Treatment Plant: Proposal for an Experimental Protocol

by
Maria Cristina Collivignarelli
1,2,
Francesca Maria Caccamo
1,*,
Stefano Bellazzi
1,
Alessandro Abbà
3 and
Giorgio Bertanza
3
1
Department of Civil Engineering and Architecture, University of Pavia, Via Ferrata 3, 27100 Pavia, Italy
2
Interdepartmental Centre for Water Research, University of Pavia, Via Ferrata 3, 27100 Pavia, Italy
3
Department of Civil, Environmental, Architectural Engineering and Mathematics, University of Brescia, Via Branze 43, 25123 Brescia, Italy
*
Author to whom correspondence should be addressed.
Environments 2023, 10(7), 108; https://doi.org/10.3390/environments10070108
Submission received: 25 May 2023 / Revised: 16 June 2023 / Accepted: 20 June 2023 / Published: 22 June 2023
(This article belongs to the Topic Sustainable Environmental Technologies)

Abstract

:
Assessing the compatibility of industrial discharges with the biological process of a municipal wastewater treatment plant (WWTP) may represent a critical task. Indeed, either focusing only on chemical characterization or ecotoxicity tests designed to assess the impact on surface waters may lead to questionable or misleading conclusions. The feasibility of an industrial connection to the sewer should better take into account the features of the downstream WWTP, in particular by studying the potential effects on the biomass of that specific plant. With this aim, a multi-step experimental protocol applicable by water utilities has been proposed: (step 1) calculation of the flow rate/load ratio between industrial discharge (ID) and urban wastewater (WW); (step 2) analysis of the modified operating conditions of the biological stage; (step 3) experimental assessment of the impact of the ID on the WWTP biomass by means of respirometric tests. An application of this protocol is presented in this work as a case study, namely a new ID (average flowrate 200 m3 d−1) coming from an aqueous waste treatment plant (AWTP) to be connected to the public sewer. The integrated evaluation of results showed that no negative impacts could be expected on the downstream urban activated sludge WWTP (treating a flow rate of around 45,000 m3 d−1).

1. Introduction

Both domestic wastewater (WW) from residential settlements and services, and industrial WW, deriving mainly from commercial activities and generated by production processes, are discharged into the public sewers to be treated by a wastewater treatment plant (WWTP) [1,2,3]. National regulations have imposed emission limits for WW discharge into sewers, as in Italy with the Legislative Decree No. 152 of 2006 (Third part, Annex 5, Ref. [4]). Considering the industrial WW, attention is therefore placed on the quantitative and qualitative characteristics of the industrial discharge (ID) which mixes with the other WW conveyed by the sewer. For example, according to the Italian legislation, the emission limits in sewer per product unit referred to specific production cycles are reported (Third part, Annex 5, Ref. [4]).
In addition to necessitating various limits to be respected by several parameters, the Italian law requires the same toxicity test to be applied for discharges both into surface water and into the sewer. The acute toxicity test is mandatory and must be performed on Daphnia magna, and, in addition, on Ceriodaphnia dubia, Selenastrum capricornutum, bioluminescent bacteria, or organisms such as Artemia salina, for saltwater discharges, or other organisms. For discharges into sewer, the sample is considered toxic when, after 24 h, the number of immobile organisms is equal to or greater than 80% of the total. If more than one toxicity test is performed, the worst result should be considered (Third part, Annex 5, Ref. [4]).
The toxicity tests thus imposed appear appropriate for assessing the suitability of a final discharge into a surface water body. Conversely, for a more suitable and reliable evaluation of the compatibility of a discharge into the sewer, the experimental assessment using the biomass present in the downstream WWTP (such as respirometry tests) could be suggested. Furthermore, a non-negligible operational aspect is that the respirometric does not require complex and expensive equipment [5]. In this way, attention is paid to the urban WWTP and the biological treatment that must purify the WW that is discharged into the sewer.
The scientific literature reports that respirometry could be effectively applied, in biological treatments of real WWTP, for (i) daily management and/or operational control to evaluate a possible plant upgrade [6,7,8], (ii) performance diagnosis [2,9], (iii) detection of toxicity caused by influent WW [1,10,11,12] and (iv) WW characterisation/COD fractionation [2,3,13]. Arias-Navarro et al. [9] applied respirometric tests to a real WWTP serving an equivalent population of 730,000 and the results revealed that the WWTP was operated at low efficiency and under overload. With a similar aim, in the work of Vitanza et al. [14], an activated sludge model was calibrated using respirometric results obtained from three WWTPs. After the calibration, the simulation of the operation of one of the plants was performed and the goodness of the simulation demonstrated that the model was able to predict WWTP performance. Respirometry techniques were used by Aguilar et al. [12] to evaluate the toxic and inhibitory effect of several heavy metals on the activated sludge collected from a WWTP which also treated industrial WW. The results showed that toxicity caused by heavy metals studied follows the order: Hg ≫ Zn > Cr > Pb > Ni [12].
This work proposes an experimental protocol to be used to assess the compatibility of a new ID to be discharged in a sewer system served by an activated sludge WWTP. The study of the quantitative and qualitative characteristics of ID is proposed to examine and predict any possible impact on the WWTP. The focus is placed on the biological sector, through the control of compliance with the operating conditions and the measurement, through respirometry, of the influent WW biodegradability/toxicity towards autotrophic and heterotrophic biomass.
This study is aimed at responding to some needs of the WW treatment world, such as those expressed by Mainardis et al. [15]:
(i)
the proposal and development of a technical-scientific experimental methodology, shared and universally applicable by all water utilities, also to guarantee homogeneous and unambiguous comparisons between different realities;
(ii)
the promotion of greater integration and application of respirometry into WWTP management as a diagnostic tool, in particular for ecotoxicity assessments of new industrial sewerage connections.
As a case study, in this work, the application of the proposed procedure is presented for the assessment of the ID of an aqueous waste treatment plant (AWTP) to be discharged into a public sewer served by an activated sludge WWTP.

2. Materials and Methods

2.1. Case Study and ID Characteristics

The studied ID was produced in a new AWTP which encompassed both chemical-physical and thermophilic biological treatments. The aqueous waste treated came mainly from pharmaceutical and galvanic processes. The new ID of the AWTP had to be discharged, with an average flowrate of 200 m3 d−1, through an authorized pipeline, into the public sewer. In Table 1, the main characteristics of ID are reported. According to the permission, the ID had to be stopped (i) in case of rain, with the aim to not overload the sewage system, (ii) in the case of maintenance to sewage sections of interest and (iii) under specific circumstances upon request by the urban WWTP manager.
The public sewer, as usual, reached the urban WWTP, located downstream of the AWTP, as shown in Figure 1a. The urban WWTP treated an average WW flow rate of about 45,000 m3 d−1 in a water-line typical of a conventional activated sludge (CAS) plant, consisting of primary sedimentation, pre-denitrification, oxidation and nitrification in a single compartment, and finally secondary sedimentation.

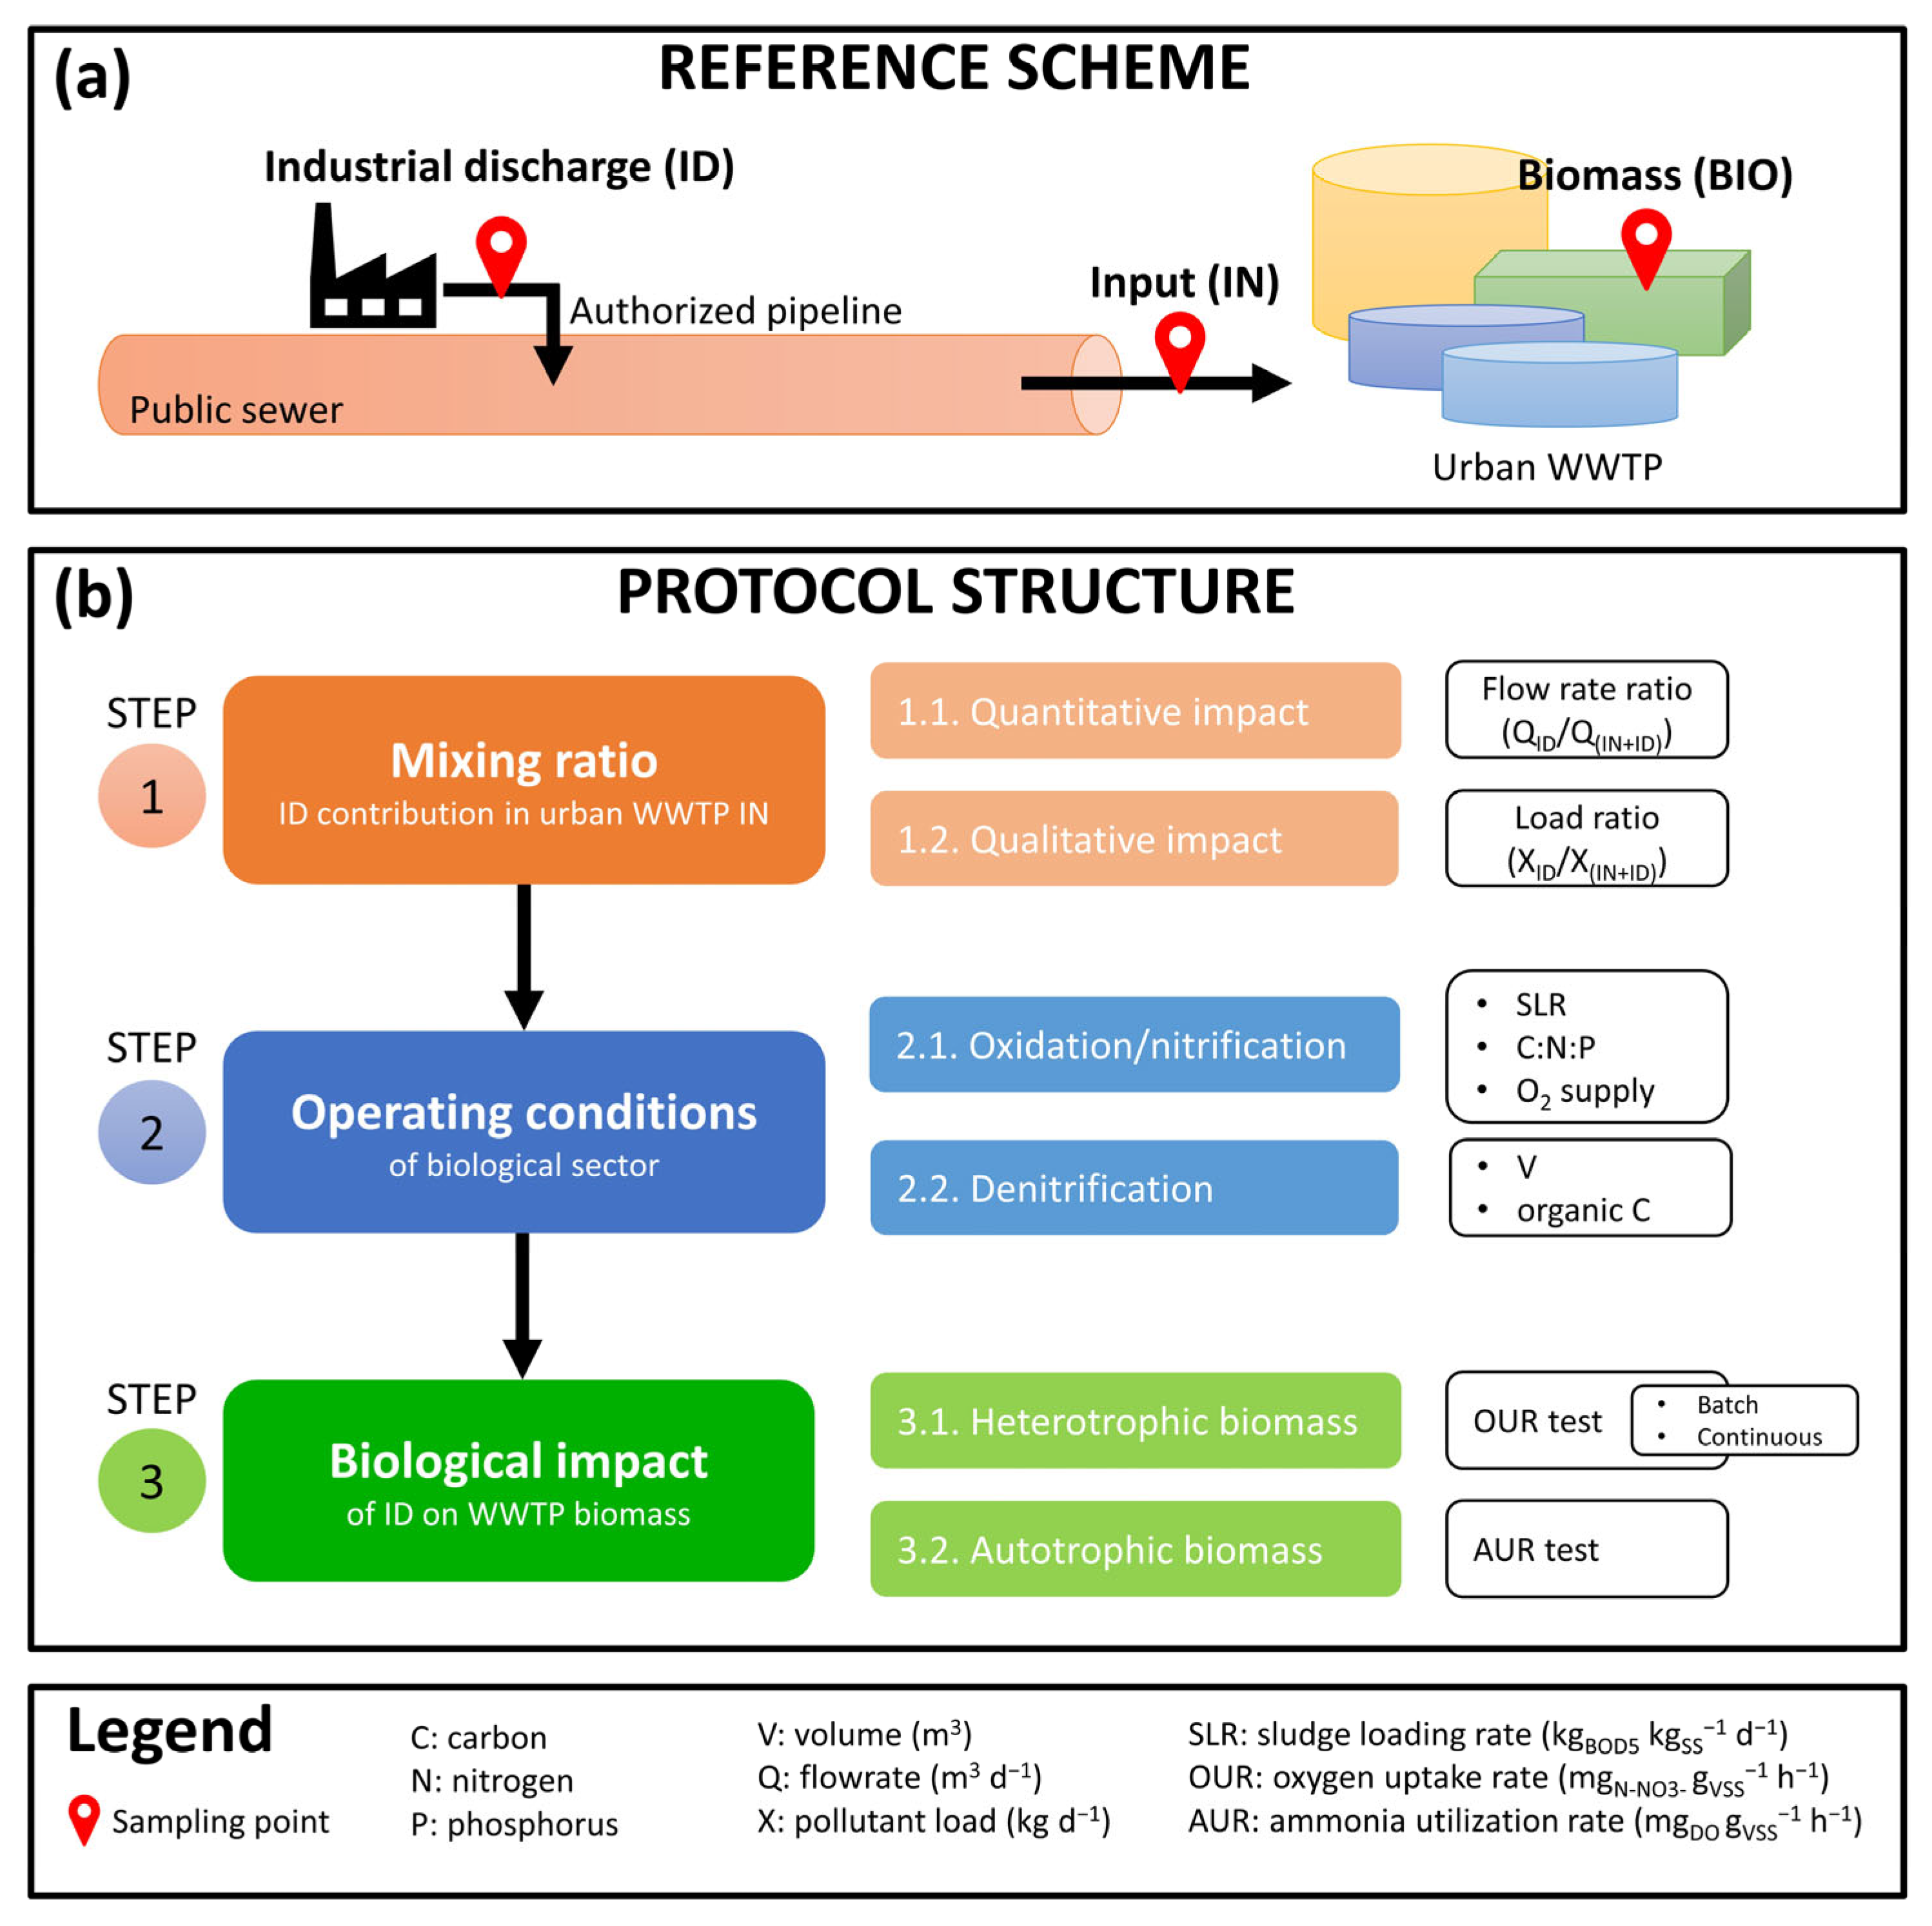
2.2. Experimental Protocol Structure

The purpose of the experimental protocol is to evaluate the quantitative and qualitative impact of a new ID on a CAS WWTP. First, the sampling points must be carefully identified:
(i)
ID: industrial water which must be discharged into the public sewer.
(ii)
IN: WW entering the WWTP (without ID).
(iii)
BIO: biomass in the oxidation-nitrification tank.
In the case of a WWTP equipped with primary sedimentation, the IN sample should coincide with the entrance to the biological compartment (primary sedimentation exit), for greater precision in the evaluation of the polluting loads (BOD5, COD, etc.) that really impact on the biological activity. In this study, the IN sample was taken upstream of the primary sedimentation, considering slightly higher pollutant loads in favour of safety. The purification efficiency of primary sedimentation has therefore been neglected.
If the WWTP had separate oxidation and nitrification compartments, with dedicated biomass separation units, two biomass samples from both reactors would have been required. In this WWTP, a single biomass sample was taken due to the configuration of the process in a single tank.
A further possibility, without considering the sampling point ID, could be to study only the sampling point IN during two different conditions: (i) in the presence of ID and (ii) in the absence of ID. To make the first condition possible, it was necessary (i) to interface with the AWTP staff for the request to the competent authority for a temporary ID permit, (ii) to wait sufficient time to find the ID at the sampling point IN. The minimum time interval needed was calculated starting from the length of the sewer section between the ID and the WWTP.
Figure 1b shows the structure of the experimental protocol.
  • Step 1 concerns the estimation of the weight of the ID on the WW to be treated in the WWTP. We assessed (i) the quantitative impact of the ID on the WWTP through the ratio between the ID flowrate QID and the mixed WW flowrate Q(IN+ID) (or QINNEW), and (ii) the qualitative impact of the ID on the WWTP through the ratio between the mass load of selected pollutants in the ID (XID) and the mixed WW (X(IN+ID) or XINNEW). The pollutants of concern should be identified as the most significant and critical for the WWTP.
  • Step 2 includes a check of the operating conditions in which the oxidation/nitrification and denitrification reactors should work with the addition of the new ID into the sewer. First, it is necessary to check the volumes available, in order to verify any possible under-sizing caused by the ID. Subsequently, for the oxidation/nitrification stage, the following checks should be carried out: (i) the new sludge loading rate (SLR) has to guarantee the correct performance of the nitrification process; (ii) the new BOD:N:P ratio should not deviate too much from the optimal one for aerobic systems equal to 100:5:1 (BOD/N = 20, BOD/P = 100) [16,17,18,19]; (iii) the capacity of the present air supply system has to cover the increase in the oxygen demand for the oxidation processes. For denitrification, the availability of organic carbon with respect to the new load of N-NO3 must be envisaged.
  • Step 3 involves the study of the ID biological impact on the biomass grown in the urban WWTP and represents a crucial assessment. For a CAS system, the biological activities of heterotrophic and autotrophic biomass can be evaluated through oxygen uptake rate (OUR) and ammonia utilization rate (AUR) tests, respectively. In case potential criticalities arose from Step 1 and Step 2, a more in-depth analysis through the application of continuous respirometry is strictly recommended. In effect, thanks mainly to the longer duration of the test, it is possible to obtain more detailed information on the biological activity, compared to the more immediate and easier to apply batch OUR tests (described below in Section 2.5.2). Indeed, the authors advise to include continuous OUR tests, regardless of the result of point 1.
The step-by-step application of the assessment protocol to the case study is described in the following paragraphs.

2.3. Mixing Ratio Estimate (Step 1)

For the estimation of the future ID contribution on the WW entering the urban WWTP, (i) WWTP monitoring data of the year 2021 and (ii) an estimate of the ID flow rate provided by the AWTP company were considered. The ID quantitative contribution was calculated as follow:
ID   quantitative   impact   ( % ) = Q ID m 3 d 1 Q IN + ID m 3 d 1
where:
-
QID (m3 d−1): estimated ID flow rate.
-
Q(ID+IN) (or QINNEW) (m3 d−1): sum of IN point flow rate, from WWTP monitoring data, and estimated ID flow rate. This represents the overall WW arriving from the sewer and treated by WWTP, if ID is authorised.
As regards the IN-flow rates, the monthly average values were considered.
To study the ID qualitative impact on the urban WWTP, the loads of the most critical polluting parameters for this case study were calculated, namely: chemical oxygen demand (COD), total nitrogen (TN), nitric nitrogen (N-NO3) and ammoniacal nitrogen (N-NH4+). The authors recommend evaluating the polluting parameters to be taken into consideration on a case-by-case basis, including 5-day biological oxygen demand (BOD5), total suspended solids, total phosphorus, and other specific pollutants of concern such as heavy metals, surfactants, persistent organic pollutants, etc. The loads were calculated starting from daily concentrations of COD, TN, N-NO3, N-NH4+ (measured on 24-h composite samples), multiplied by the flow rates. The data of the flow rates and concentrations of the chemical parameters were provided by the management staff of the AWTP and the WWTP. For WWTP data, a public online database is also available from which to download the necessary information. The qualitative contribution of ID was defined by the following equation:
ID   qualitative   impact   ( % ) = X ID kg   d 1 X IN + ID kg   d 1
where:
-
XID (kg d−1): load of generic ID polluting parameter.
-
X(ID+IN) (or XINNEW) (kg d−1): sum of IN pollutant load, from WWTP monitoring data, and ID pollutant load for the generic parameter. This represents the overall load of WW arriving from the sewer and treated by the WWTP, if ID is authorised.

2.4. Operating Conditions (Step 2)

For the oxidation/nitrification compartment, the following parameters, both for IN and INNEW (IN + ID) condition, were calculated:
1 .   Sludge   loading   rate   ( SLR )   ( kg BOD 5 kg SS 1 d 1 ) = X BOD 5 , IN   BIO SS   V ox
where:
-
XBOD5,IN BIO (kg d−1): BOD5 daily load entering the biological oxidation/nitrification compartment.
-
SS (kg m−3): total suspended solids concentration in the oxidation/nitrification tank (hp: equal in both IN and INNEW phases).
-
Vox (m3): volume of the existing oxidation/nitrification tank.
2 .   Oxygen   supply   kg 02 d 1 = k α X BOD 5 , IN   BIO + β V ox SS + k γ X nit
where:
-
k (-): safety factor to consider for the oscillations of the influent load to the WWTP, assumed equal to 1.5.
-
α (kgO2 kgBOD5removed): amount of oxygen required to oxidize 1 kg of organic substance (BOD5) in the oxidation tank, assumed equal to 0.5 [20].
-
XBOD5,IN BIO (kg d−1): BOD5 average daily load entering the biological oxidation/nitrification compartment;
-
β (kgO2 kgSS−1 d−1): amount of oxygen consumed in 1 day by 1 kg of biomass, assumed equal to 0.1 [20].
-
Vox (m3): volume of the existing oxidation/nitrification tank.
-
SS (kg m−3): total suspended solids concentration in oxidation/nitrification tank (hp: equal in both IN and INNEW phases).
-
γ (kgO2 kgN): amount of oxygen required to nitrify 1 kg of ammonia nitrogen, assumed equal to 4.57 [20].
-
Xnit (kg d−1): nitrogen daily load which must be nitrified, determined by a balance on total Kjeldahl nitrogen (TKN) (Equation (5)):
X nit = TKN IN   TKN ass TKN out
where:
  • TKNIN (kg d−1): TKN of WW entering the WWTP (if possible, better entering the biological reactor).
  • TKNass (kg d−1): TKN assimilated by the biomass for vital functions, calculated as 5% of BOD5 removed [21].
  • TKNout (kg d−1): TKN limit load in the WWTP effluent and calculated from a concentration limit equal to 2 mg L−1, assumed based on the emission limits of the Italian regulation (Table 2, Annex 5, Part III, Legislative Decree n° 152 of 2006 [4]).
For the pre-denitrification tank the following parameters were determined:
1 .   R e q u i r e d   d e n i t r i f i c a t i o n   t a n k   v o l u m e   ( V D E N ) ( m 3 ) = X d e n v d e n , s V S S
where:
-
Xden (kg d−1): nitrogen daily load which must be denitrified, determined by a balance on TN (Equation (7)):
X den = TN IN   TN ass TN out
where:
  • TNIN (kg d−1): TN of WW entering the WWTP.
  • TNass (kg d−1): TN assimilated by biomass for vital functions, calculated as 5% of BOD5 removed in the oxidation tank [19].
  • TNout (kg d−1): TN limit load in the WWTP effluent and calculated from a concentration limit equal to 8 mg L−1, assumed based on the emission limits of the Italian regulation (Annex 5, Part III, Legislative Decree n° 152 of 2006 [4]).
-
vden,s (kgN-NO3 kgVSS-1 d−1): denitrification specific rate, determined with the following equation [22,23]:
v den , s k g N - N O 3 k g VSS   d = v den , s   [ 20   ° C ] θ T 20
where:
  • T (°C): temperature of water in denitrification tank.
  • vden,s [20 °C] (kgN-NO3 kgVSS−1 d−1): denitrification rate at 20 °C (standard values: 2.9–3.0 gN-NO3 kgVSS−1 h−1 [24]), assumed equal to 0.07 kgN-NO3 kgVSS−1 d−1.
  • θ (-): van’t Hoff-Arrhenius coefficient, assumed equal to 1.10 [20].
-
VSS (kg m−3): volatile suspended solids concentration in denitrification tank (hp: equal in both IN and INNEW phases).
2 .   Required   organic   carbon   OC kg   d 1 = BOD 5 N - NO 3   ratio   X DEN
where:
-
BOD5/N-NO3 ratio (-) necessary to ensure efficient denitrification, assumed equal to 5 [20].
-
Xden (kg d−1): nitrogen daily load which must be denitrified, determined with Equation (7).

2.5. OUR and AUR Tests (Step 3)

OUR and AUR tests, whose important applicability has been demonstrated in many previous studies [2,25,26,27,28,29], were inevitably included in the protocol structure to study the impact of different substrates on the autotrophic and heterotrophic mesophilic biomass of the urban WWTP. In particular, the aim was to evaluate the effect of the ID on the biological activity of the CAS system.
For all tests, the heterotrophic/autotrophic biomass was sampled directly from the urban WWTP (BIO-sampling point, Figure 1a) and was used shortly after sampling, and after 1 h of re-aeration. The substrates used were sampled only at the IN-sampling point (24-h composite samples), at the urban WWTP, but at two different times: (i) with the presence of ID in WW from the sewer (INNEW), and (ii) without ID into WW arriving from the sewage system (IN). This approach was possible thanks to collaboration agreements between the AWTP company and the personnel of the WWTP. If this approach was not possible, the authors would have maintained two sampling points IN and ID (as explained in Section 2.2) and recreated the INNEW substrate in the chemical laboratory by mixing IN and ID. The mixing ratio (quantitative contribution of ID) had been estimated in step 1 of the proposed protocol (Section 3.1). All tests were conducted at room temperature, maintaining continuous stirring of the mixture at about 300–400 rpm, with a magnetic stirrer.

2.5.1. Analytical Methods
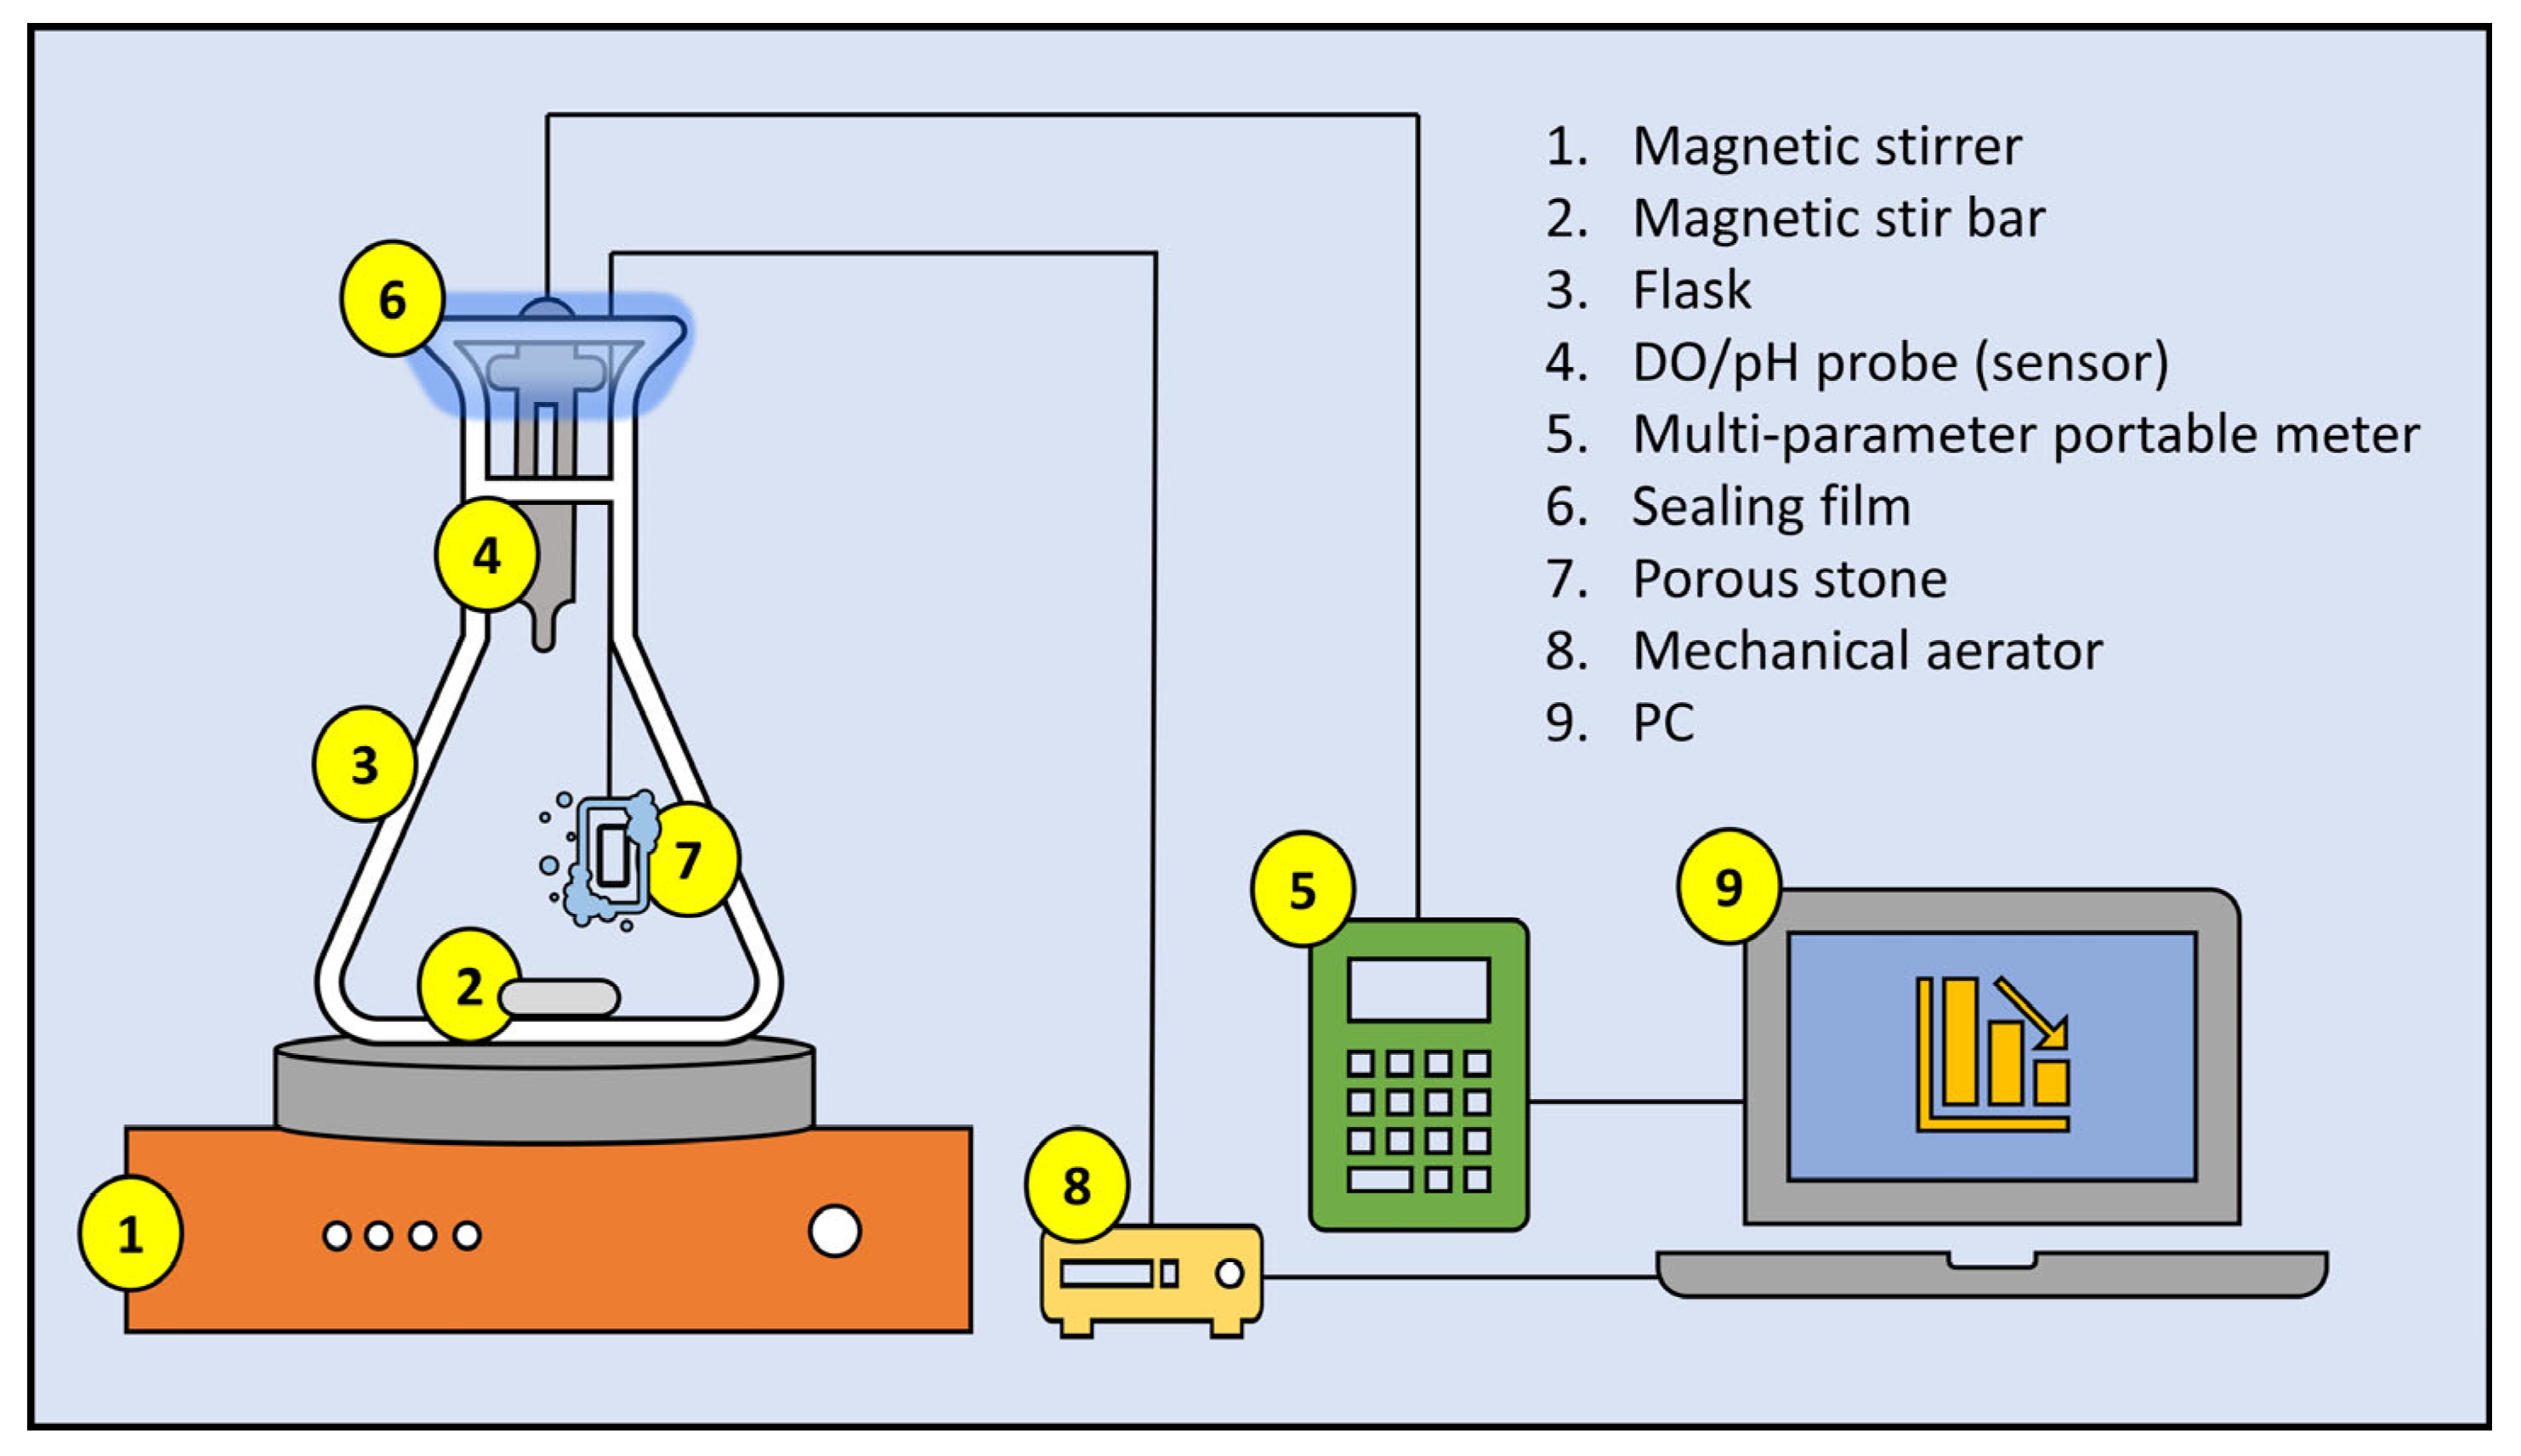
COD was measured according to ISPRA 5135 method [30]. For ammoniacal nitrogen (N-NH4+) and TKN, the methods of APAT IRSA-CNR 4030 [31] and APAT IRSA-CNR 5030 [32] were used, respectively. N-NO3 concentrations were studied according to UNI EN ISO 10304-1:2009 [33]. UNI 11658:2016 [34] was applied for TN. Volatile suspended solids (VSS) were determined following the APAT-IRSA-CNR 2090 method [35]. pH was measured using the probe WTW-IDS, Model SenTix® 940 (Xylem Analytics Germany Sales GmbH & Co, Mainz, Germany). Dissolved oxygen (DO) concentration was measured by WTW Multi-parameter portable meter MultiLine® Multi 3510 IDS thanks to WTW Optical IDS dissolved oxygen sensors FDO® 925 (Xylem Analytics Germany Sales GmbH & Co, Mainz, Germany) (called DO probe in the next sections). The measured DO concentration was transferred to a portable PC via USB connection and the MultiLab® Importer for data acquisition via Excel® software was used.

2.5.2. OUR Test

Respirometry deals with the measurement and interpretation of dissolved oxygen consumption by a biological system to degrade a substrate [36]. The application of respirometry to WWTP can provide information on the characterization of the influential WW biodegradability, therefore, on any inhibitory effect of WW on the WWTP biomass. Both endogenous and exogenous OUR were evaluated in this study. The endogenous OUR represents the oxygen consumed only for biomass respiration, while the exogenous OUR consists in the consumption of oxygen necessary for (i) the oxidation of the organic substance or of the nitrogenous compounds present in the WW and (ii) the cellular respiration of the biomass [15,37].

Batch Test

The great advantage of OUR tests in batch mode is the immediate performance both for the modest instrumentation required (Figure 2) and for the immediacy of execution [2,38]. The experimental set-up was similar to that employed by Borzooei et al. [13] and Capodici et al. [39].
Endogenous OUR tests were first conducted with 500 mL of heterotrophic biomass to study endogenous respiration alone. In exogenous OUR tests, 500 mL of oxidizing biomass was aerated up to a DO concentration of 7.5–8.0 mg L−1, and then mixed with 500 mL of substrate. At this point the aeration was stopped and the laboratory scale batch reactor with a 1 L mixture was hermetically isolated to avoid oxygen exchange with the external environment. During the test, the DO concentration (mg L−1) was measured every 5 s. Each batch OUR test, stopped when the dissolved oxidation concentration was below 2 mg L−1, lasted approximately 10–20 min. Due to the limited duration, the batch OUR was allowed to evaluate “only” (i) the rapidly biodegradable fraction of organic substance and (ii) any acute, therefore immediate, toxic-inhibiting effect of the WW against the biomass.
At the end of the test, the OUR value (mgDO gVSS−1 h−1) was calculated according to the following equation:
OUR   ( mg DO   g VSS 1 h 1 ) = Slope   of   the   DO   utilization   curve   ( mg DO   L 1 h 1 ) VSS   concentration   in   batch   reactor   ( g VSS L 1 )

Continuous Test

Continuous OUR tests were carried out with a laboratory scale reactor (2 L), containing 1 L of heterotrophic biomass and 200 mL of substrate. This option was set to maintain a low S/X ratio (biomass/substrate) in the range 0.01–0.2 gCOD gVSS−1, thus considering (i) biomass growth negligible and (ii) endogenous respiration remained approximately constant [40]. Similarly, Mainardis et al. [15] recommended a narrower range equal to 0.01–0.05 gCOD gVSS−1.
The reactor was isolated to avoid oxygen exchanges with the surrounding atmosphere and loss of volume by evaporation (Figure 2). The aeration was always kept in the 2–5 mg L−1 range thanks to the connection of the aeration system to an electric mechanism that guaranteed the connection-detachment of the aeration itself. The electrical mechanism was regulated by software installed on a PC and through the DO concentration measured by the DO probe. The latter was in turn connected to the laptop. Of extreme importance was the data acquisition system, which allowed the DO data, measured in the reactor, to be acquired on the PC. In some cases, these tests lasted up to 48 h.
At the end of the test, a succession of decreasing curves (DO consumption curves) was obtained, alternating phases of non-aeration and phases of aeration in the reactor. With the same process described for batch OUR, more final OUR values (mgDO gVSS−1 h−1) were calculated. A curve, called respirogram, with the OUR trend over time was drawn [15].
Continuous tests can provide additional information compared to batch tests: (i) possible medium-long term toxic effects caused by the substrate towards the biomass, (ii) evaluation of the different fractions of COD present in the substrate (quickly and slowly biodegradable). Batch tests are quicker to perform, but continuous tests, lasting for several hours, have the great strength of monitoring toxicity over a period as long as the hydraulic retention time of the WWTP [38].

2.5.3. AUR Test

Thanks to the AUR test, it is possible to easily measure the activity of the nitrifying bacteria present in the biomass of CAS plants. The AUR test can be applied to: (i) measure the nitrification kinetics [41], and (ii) evaluate the degree of inhibition (via determination of any inhibitory effect on nitrifying bacteria by sewage containing potentially toxic substances) [42,43].
First, 500 mL of biomass, after aeration, was mixed with 500 mL of substrate to obtain a total volume of 1 L in a batch reactor (Figure 2). Continuous aeration up to DO saturation conditions were maintained in the mixture. The pH was maintained approximately equal to that (7.5–8.5) measured in the mesophilic biomass at the time of sampling in the oxidation tank. Tests were conducted for about 5–6 h and 25 mL of mixture was sampled every hour or half hour. The samples were filtered with 0.45-micron filter paper to separate the biomass. AUR value was determined considering the VSS concentration in the batch reactor and the positive slope of N-NO3 production curve (negligible concentrations for N-NO2) as reported in Equation (2):
AUR   ( mg N - NO 3 g VSS 1 h 1 ) = Slope   of   N - NO 3   production   curve   ( mg N - NO 3 L 1 h 1 ) VSS   concentration   in   batch   reactor   ( g VSS L 1 )

3. Results and Discussion

3.1. Step 1: Mixing Ratio

Table 2 shows flow rates and loads of polluting parameters in terms of (i) average annual values for WWTP input and (ii) available values (either assumed or measured) for ID. The quantitative contribution of ID was defined based on the flow rates. Assuming that the ID was authorized by the competent authority, ID represented 0.45% of all WW arriving at the WWTP (QINNEW = QIN + QID), identifying a low mixing ratio of 1/250. At least from a quantitative point of view, it was possible to state that the ID considered did not represent a problem for the urban WWTP.
The qualitative contribution was obtained from COD and different nitrogenous forms. ID had an almost negligible contribution in terms of TN, N-NH4+, and COD on the WW treated by WWTP, showing no critical issues. Instead, the load of nitrates brought by the industrial WW was significant, on average above 27%. An important load of N-NO3 could possibly represent a problem for the denitrification compartment, in terms of the insufficient volume available. The subsequent steps envisaged by the protocol had the aim, among others, of further investigating these aspects.

3.2. Step 2: Operating Conditions of the Biological Stage

Table 3 reports the comparison between geometric and process parameters during the two different conditions studied at the urban WWTP, first in the absence and then with the addition of the new ID in the incoming WW. For the oxidation/nitrification process, no significant changes were observed with the addition of the ID. The main operating conditions have remained unchanged; therefore, the nitrification process should not undergo critical issues, at least due to the aspects just investigated. Only the daily oxygen supply saw a slight increase of 0.8% compared to the starting situation without ID. This increase should not undermine the air supply systems in any way, nor create any problems to be addressed.
More marked variations resulted in denitrification, in particular in the tank volume. Even in the situation without ID, the denitrification volume was undersized for the autumn/winter water temperatures (<15 °C). This criticality has been expanded with the INNEW condition: at a water temperature of 14 °C, a volume deficit of about 1000 m3 was estimated. Compared to the previous situation (IN), there was a need for an additional volume of 300 m3. Despite the under-sizing of the denitrification tank, if the process did not previously present functioning issues, the authors excluded the occurrence of a denitrification crisis with the addition of ID.
As widely known, denitrification by heterotrophic bacteria requires organic carbon (OC) [44,45,46]. Demand for OC in the INNEW condition increased by about 4%. Despite this, the BOD5 entering the biological compartment, therefore the pre-denitrification, has always been more than sufficient to guarantee complete denitrification.

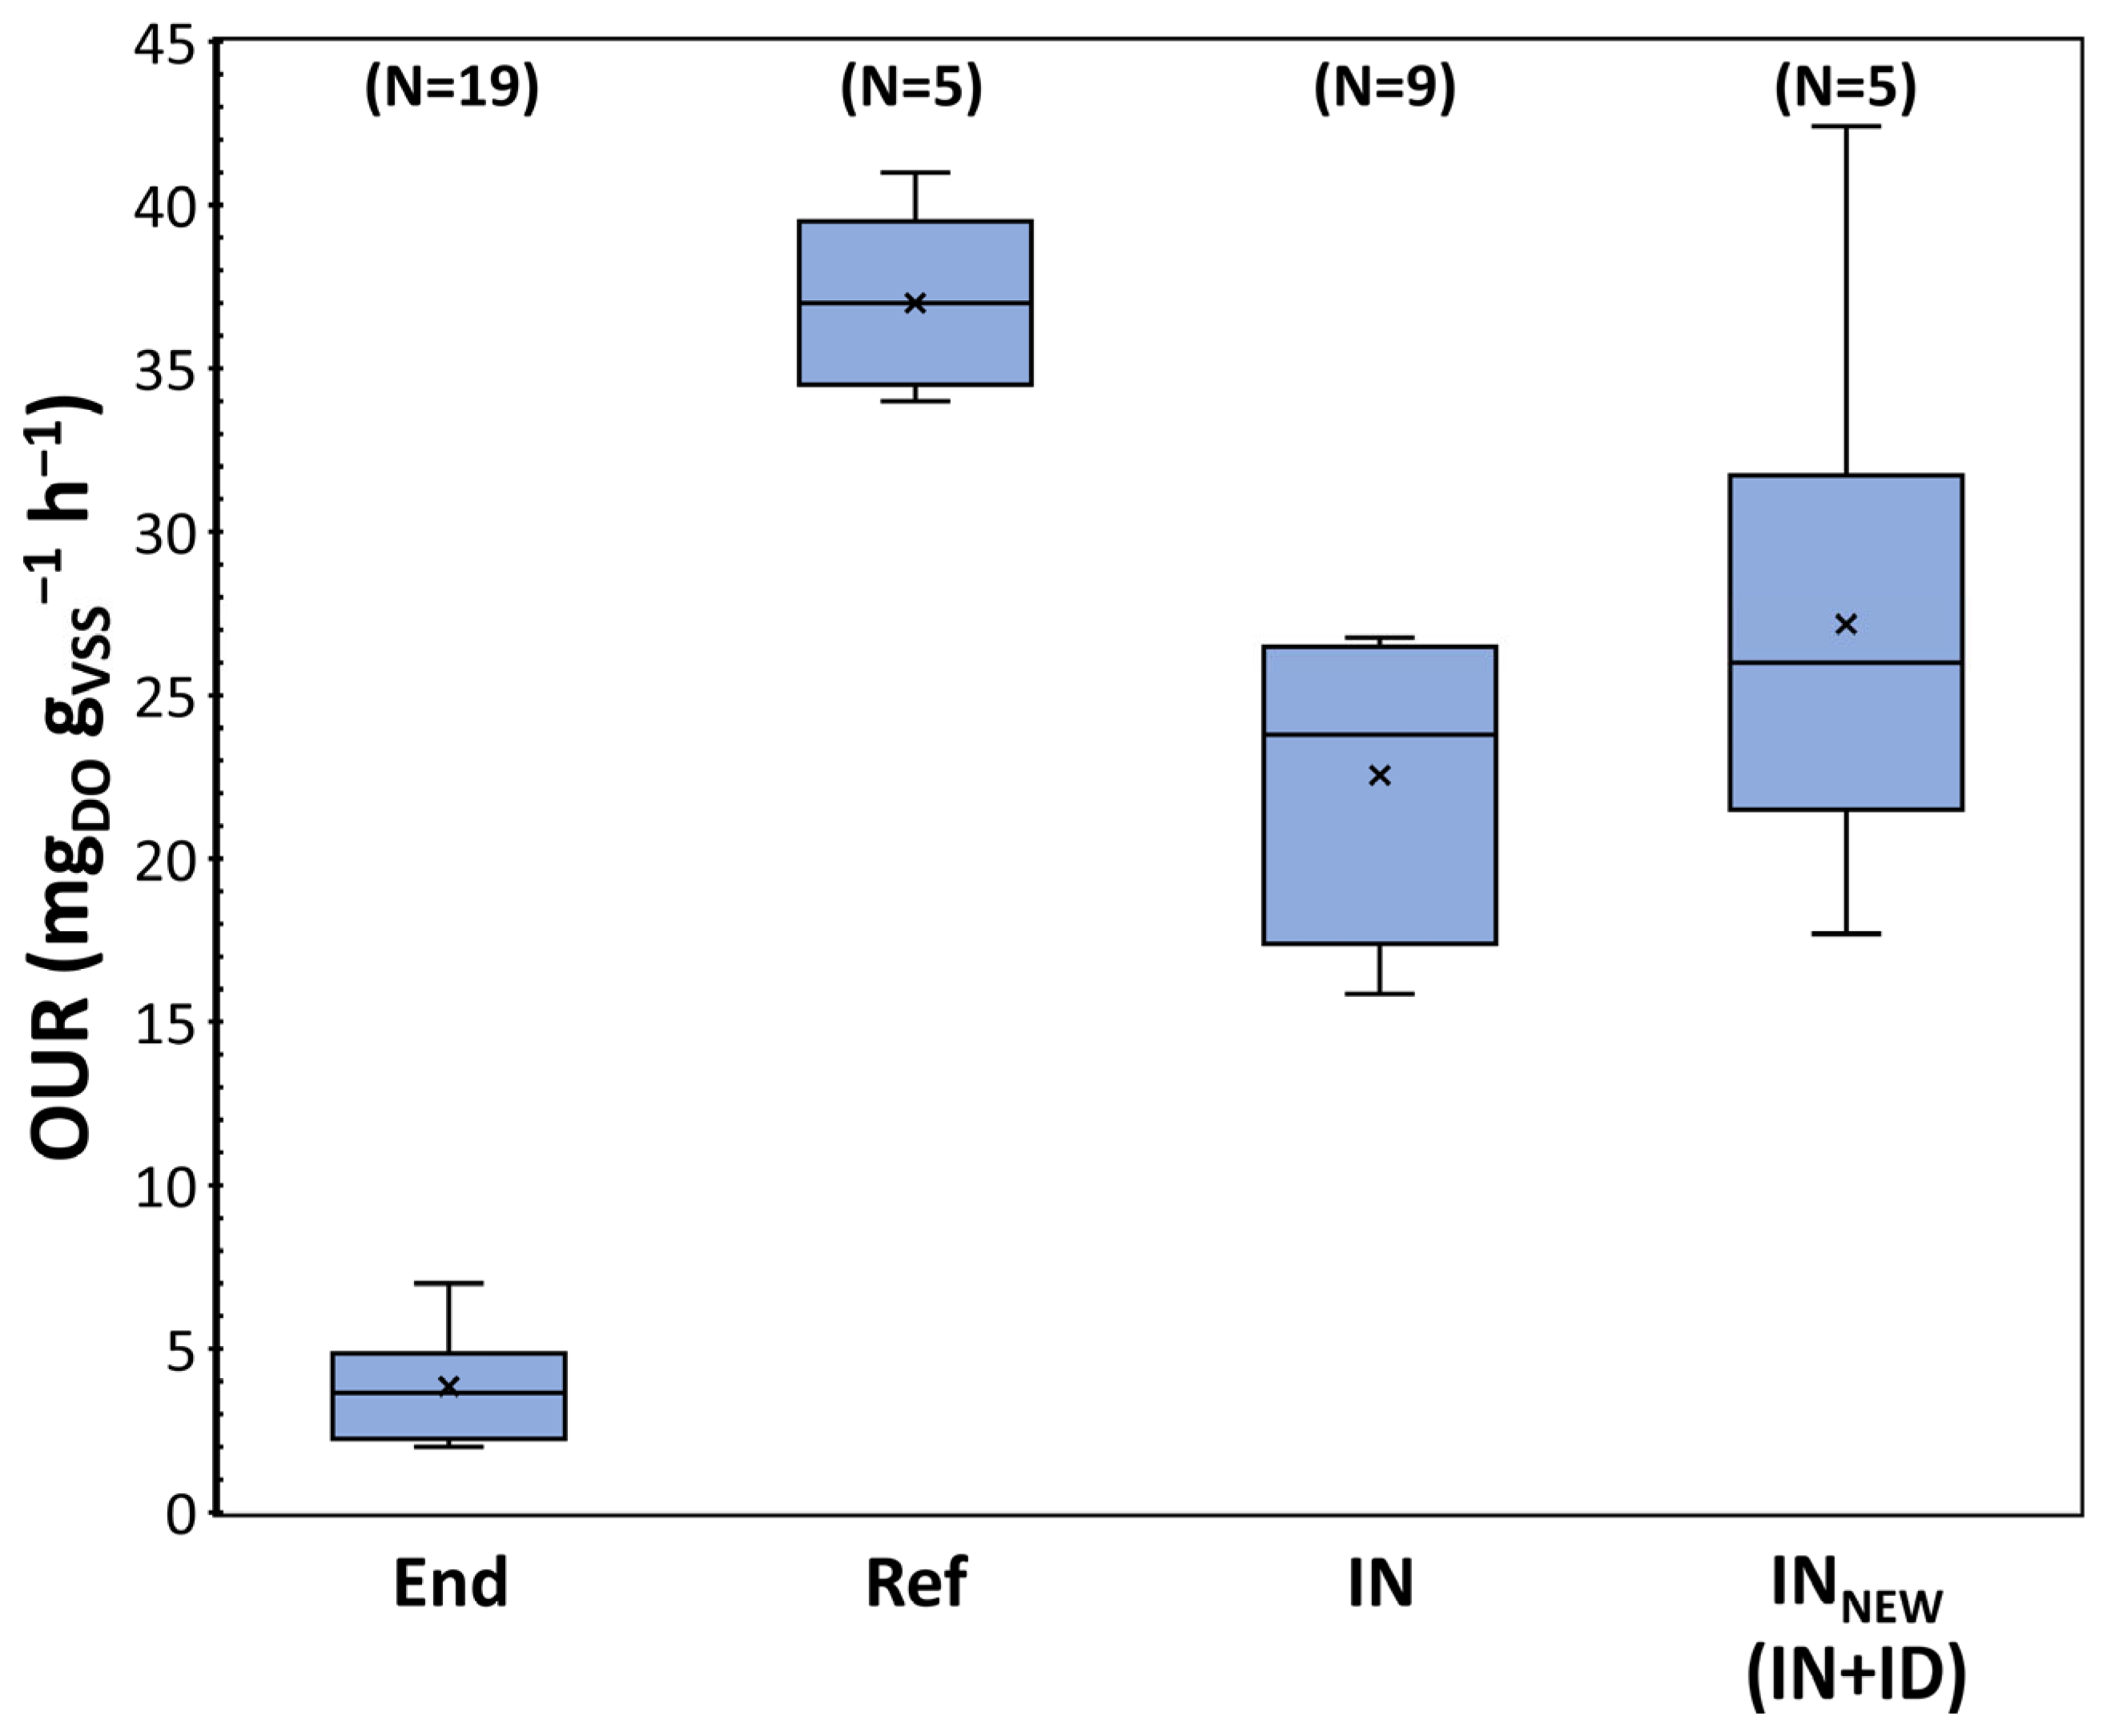
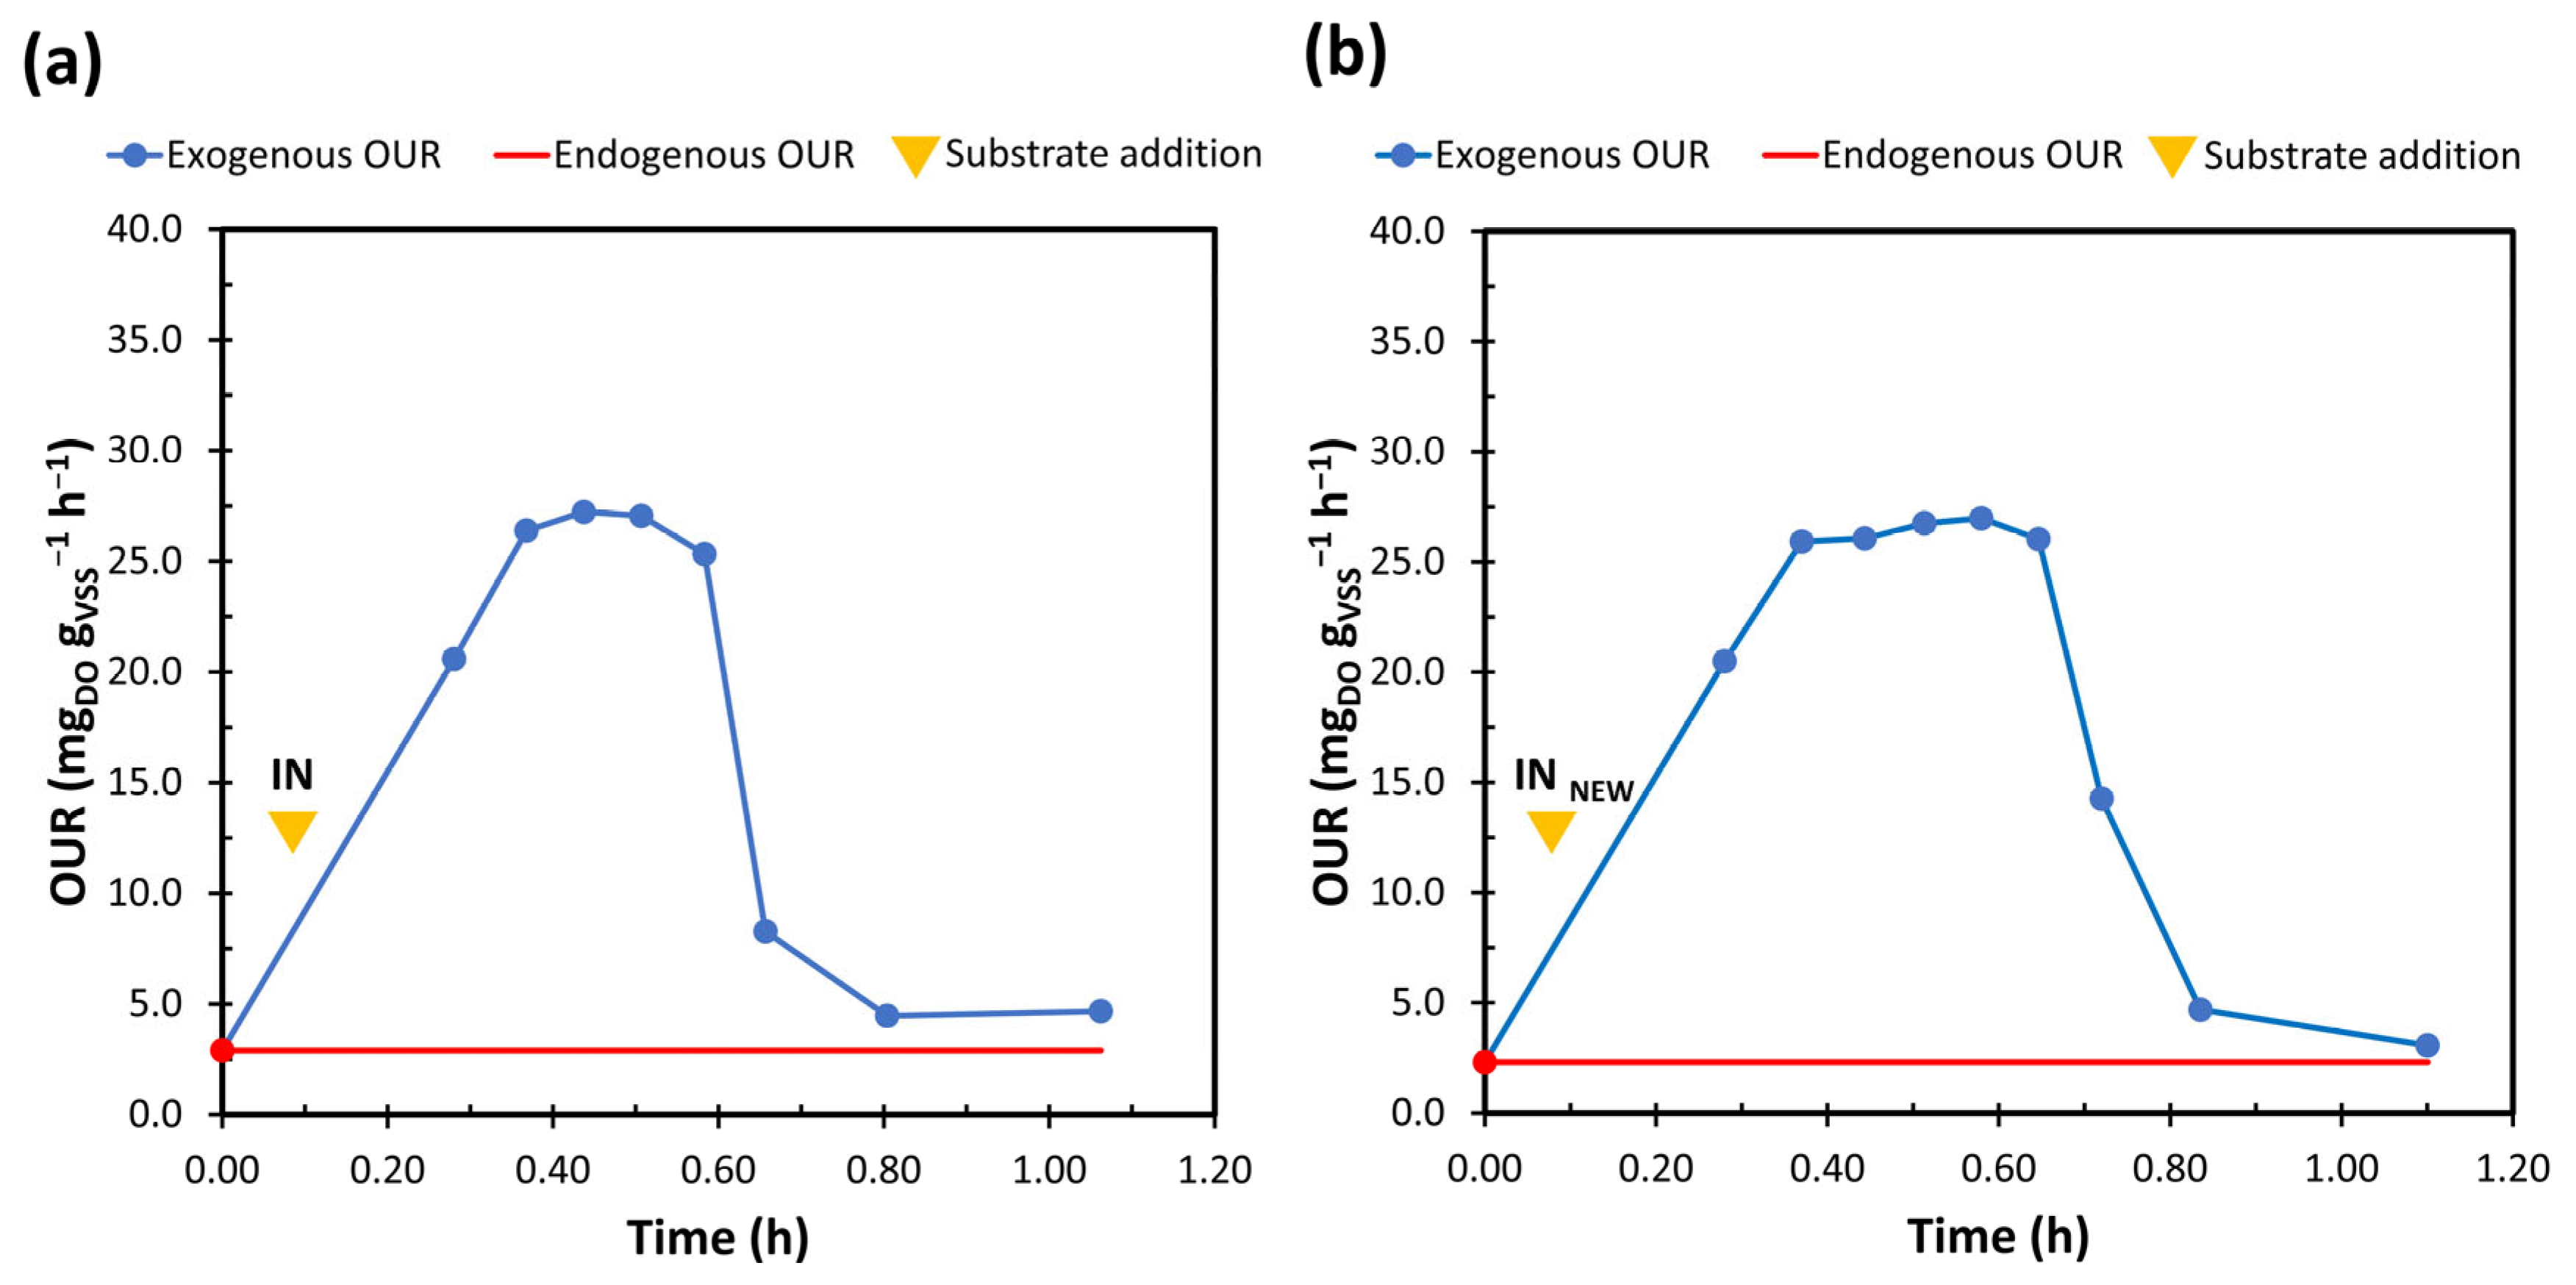
3.3. Step 3: Biological Impact on Biomass

3.3.1. Heterotrophic Biomass

The effect of ID of AWTP on heterotrophic biomass of urban WWTP was first evaluated with respirometric tests. Figure 3 shows the results of batch OUR tests. First, to understand the health status of biomass, endogenous OUR, before each exogenous test, was carried out. An average value of 3.8 mgDO gVSS−1 h−1 showed a regular respiration of the WWTP mesophilic biomass, according to our previous research [47,48]. VSS in the BIO-sample (Figure 1) were about 1.8–2 g L−1, as adopted in other experimental studies [40].
A domestic WW without industrial aqueous waste was used as the reference substrate (COD: 300–400 mg L−1, in line with domestic sewage COD reported in the literature [49]). The present WW, which includes different industrial discharges, showed lower biodegradability (23 mgDO gVSS−1 h−1) than domestic WW (37 mgDO gVSS−1 h−1), as expected. Contrarily, the studied ID improved the biodegradability of WW entering the urban WWTP (from 23 mgDO gVSS−1 h−1 to 27 mgDO gVSS−1 h−1). In general, despite the reduction of OUR values, in respect to the reference, no acute inhibition effects were observed, especially from the ID under study. The reduction in biodegradability between the reference and the IN substrate was due to the integrated and synergistic effect of multiple industrial WWs discharged into the sewer. Nevertheless, in all cases, the mean OUR values were more than acceptable, above 20 mgDO gVSS−1 h−1.
Figure 4 reports the results of OUR tests, performed in parallel and continuous modes, with biomass sampled in the oxidation/nitrification tank of the WWTP (BIO-sampling point, Figure 1a). The addition of IN (Figure 4a) and INNEW (Figure 4b) substrate were tested under the same boundary experimental conditions. Respirograms in Figure 4 show, before the substrate dosage, the endogenous OUR (first point of the discretized respirogram). Time by time, the regular respiration of the biomass must be evaluated, otherwise the test should be invalidated. The values acquired around 2.5–3.5 mgDO gVSS−1 h−1 (5–7 mgDO L−1 h−1 with VSS in BIO-sample of about 1.8–2 g L−1) indicated, as reported in other literature studies [50], a regular endogenous respiration for activated sludge in urban WWTP. After endogenous evaluation, the substrates (COD: 300–350 mg L−1, low S/X ratio guaranteed: 0.03–0.04 gCOD gVSS−1) were dosed and their degradation over time was studied (exogenous OUR—endogenous OUR). The peak values of exogenous OUR, reached after 0.35 h, were similar and equal to 27.2 and 27.0 mgDO gVSS−1 h−1, respectively for IN and INNEW. These were comparable with the results of batch OUR and remained approximately constant from 0.35 h to 0.6–0.65 h for both IN and INNEW, indicating an immediate and continuous degradation of the easily biodegradable organic substance. After 0.6–0.65 h, exogenous OUR began to decrease, indicating a final phase of degradation of the residual and more slowly biodegradable organic matter. The experimental tests were considered completed once the exogenous OUR reached values close to the endogenous ones.
In general, exogenous OUR always maintained values above the endogenous, thus indicating the absence of toxic-inhibitory effects towards the biomass. The areas of the exogenous respirograms were about 14.5 mgDO gVSS−1 and 16.2 mgDO gVSS−1 for IN and INNEW, respectively. However, the oxygen used by biomass only for the substrate degradation was 11.4 mgDO gVSS−1 for IN and 13.6 mgDO gVSS−1 for INNEW. Hence, a slightly higher oxygen consumption was observed for INNEW substrate degradation. This result was expected, as INNEW contained an aliquot of ID, which, although reduced, brought with it a series of “more difficult” and slower biodegradable molecules.
For the degradation of substrates, an oxygen consumption in the range of 21–27 mgDO has been observed (area of the degradation “bell” equal to 11–14 mgDO gVSS−1, multiplied by VSS concentration of about 1.8–2 g L−1). Considering (i) COD dosed with substrates equal to 60–70 mgCOD, (ii) BOD5/COD ratio of about 50% for both IN and INNEW, 30–35 mgBOD5 were dosed at the beginning of the tests. A BOD5 removal of 70–80% was observed in just over 1 h. This result was conceptually correct, as BOD5 is a measurement corresponding to a contact time of 5 days, and a complete degradation of the substrates in terms of biodegradable organic matter would not have been visible in 1 h. For a simpler and more immediate performance of the continuous test, an approximation was assumed: the tests were stopped at exogenous OUR values close to the endogenous.

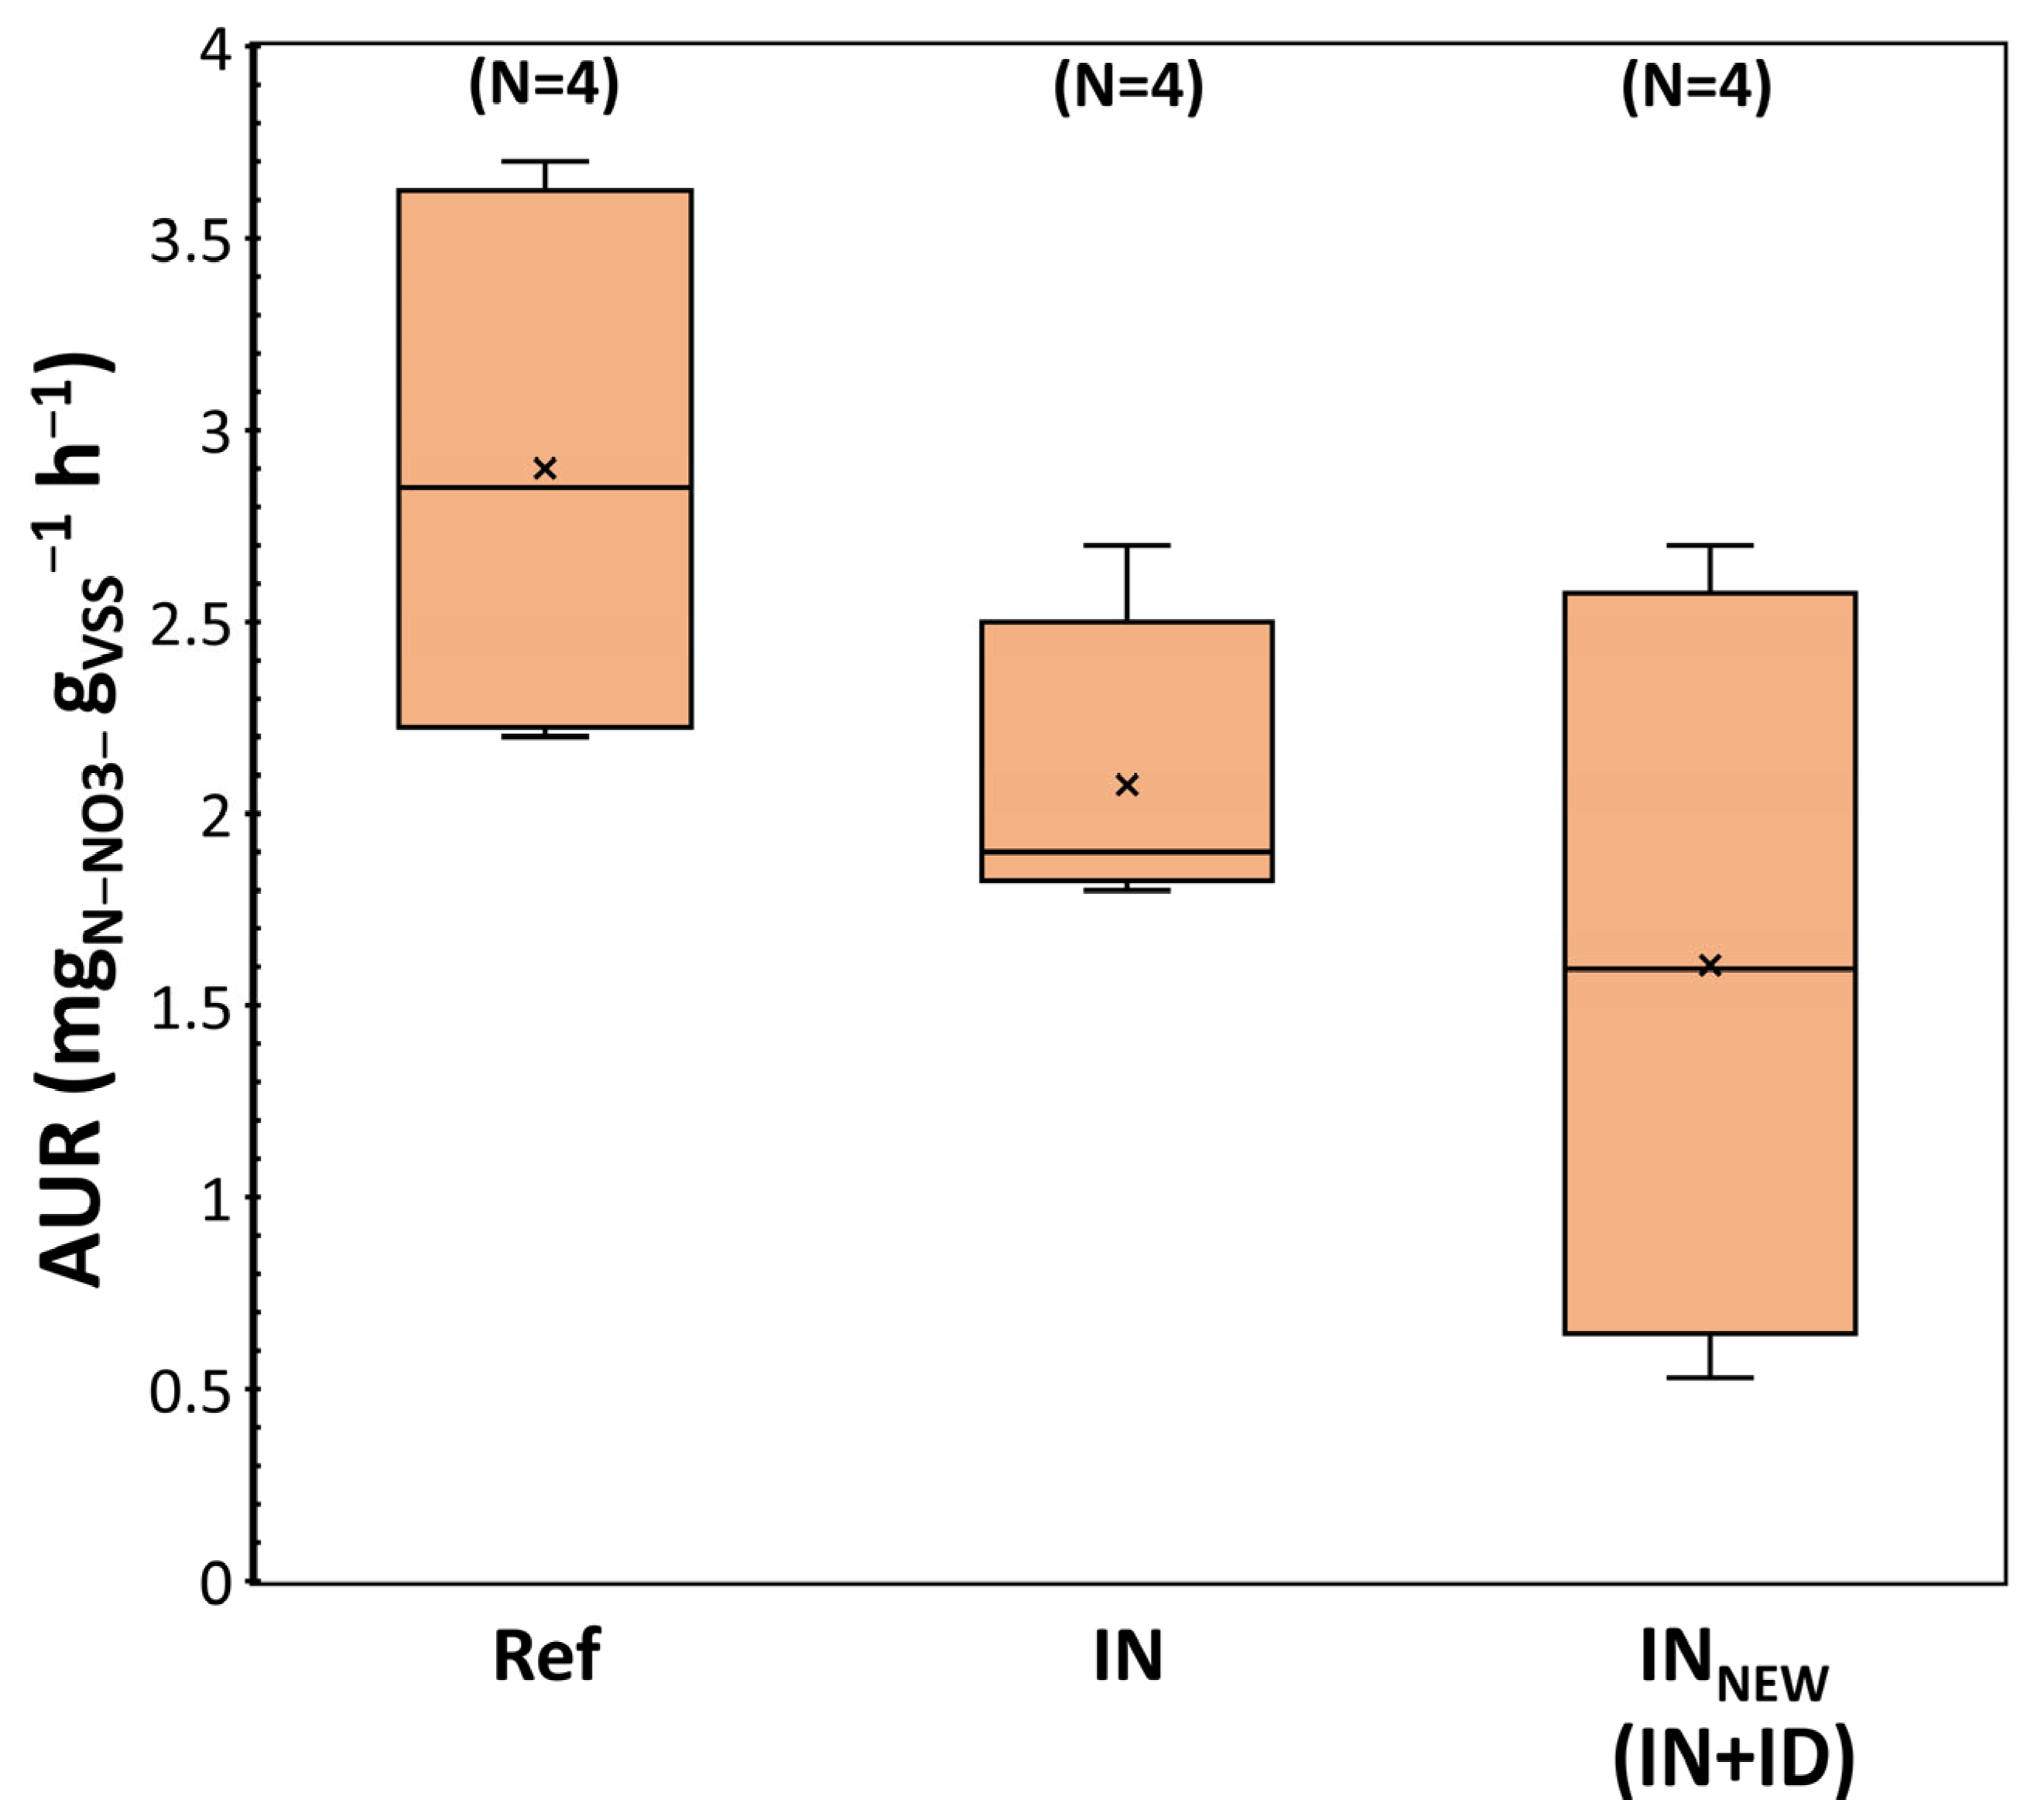
3.3.2. Autotrophic Biomass

The impact of ID on the nitrification activity of case study biomass was also investigated (Figure 5). A sample of civil sewage, with domestic WW only, was used as the reference substrate. The WW entering the oxidation/nitrification reactor (IN) showed a visible acute inhibition effect (2.1 mgN-NO3 gVSS−1 h−1) compared to the reference substrate (2.9 mgN-NO3 gVSS−1 h−1). As for OUR tests, this could be due to various toxic-inhibiting substances for autotrophic biomass present in many industrial wastes that reach the sewage system. With the addition of the studied ID, a further reduction of the nitrifying kinetics was observed, down to 1.6 mgN-NO3 gVSS−1 h−1. This result could be linked to (i) new inhibitory pollutants for the autotrophic biomass or (ii) excessive increase in loads of substances already present in WW entering the WWTP. In any case, the nitrifying biomass was put in contact with a new substrate (ID contained in INNEW) to which it had not yet acclimatised. After an initial period of instability and transition, thanks to a better acclimatization of the autotrophic biomass, better nitrification kinetics cannot be excluded. However, INNEW-AUR values did not seem to be excessively alarming, since some literature studies have shown a nitrification kinetic with WW (and properly enriched with N-NH4+), usually treated by the nitrifying biomass, equal to 1.8 mgN-NOx gVSS−1 h−1 [26]. In any case, despite these results, the conditions for prohibiting the company from discharging into the public sewer did not seem to exist; however, further insights should not be excluded, for example a more in-depth AUR test campaign.

4. Future Outlooks

This study represented the first approach and first version of an experimental protocol to evaluate the impact of new industrial waste on the urban WWTP. The authors are aware and hope that further steps will be taken in future research, to make this protocol even more complete, reliable, and easily applicable by both the urban WWTP receiving the ID, and by the company responsible for the discharge into the sewer.
The proposed methodology is valid if the industrial WW is discharged with a constant flow rate/pollutant load throughout the day, further investigation is required if significant variations in flow rate and/or load are found. Most urban WWTPs are made up of traditional biological treatments which generally cannot tolerate significant variations in the influent sewage. With the occurrence of a negative impact on the WWTP, the company responsible for the discontinuous effluent could be suggested/requested to insert a homogenization tank before discharge into the sewer.
The adaptation of step 1 to the specific case is of fundamental importance. The choice of pollutants for the assessment of the ID qualitative impact on the WWTP (load ratio) is essential. The most critical pollutants in the ID (such as heavy metals, surfactants, persistent organic pollutants, aromatic and nitrogenous organic solvents, chlorinated solvents, etc.) can only be identified through a case-by-case analysis based on company production processes. The authors recommend not considering in practice only the parameters of this case study, as they refer to the specific situation. A further step could be envisaged, to study the impact of some target pollutants, carried by ID, on the removal efficiencies of the urban WWTP. In this case, the WWTP effluent should also be monitored.
The integrated approach of this experimental protocol aims to make all the realities gravitating around the world of WW treatment more attentive. Greater awareness of companies translates into better management of industrial waste and better care and protection of the environment. Greater safeguarding of urban WWTPs guarantees efficient and optimized treatment, more controlled effluents, and therefore a reduced environmental impact.

5. Conclusions

The possibility to connect to the public sewer a new discharge coming from an AWTP, with an average flowrate of 200 m3 d−1, was studied in this work by adopting an integrated assessment protocol, based on operating data processing as well as experimental tests. The sewage is treated in an urban WWTP, with a conventional activated sludge process; the average incoming flow rate is 45,000 m3 d−1. In Italy, for getting the permission to discharge into sewers, an acute toxicity test is mandatory, but the prescribed method is the same used for assessing the toxicity of discharge into natural water bodies. This may lead to wrong evaluations. Contrarily, an effective and reliable evaluation of the compatibility of new discharge with the centralized WWTP should be carried out by considering the site-specific features of the plant and the biological prosses. In this work, the dimensional characteristics of the WWTP (flow rate/load mixing ratio, volumes), the operating conditions (SLR, C:N:P, OC, oxygen supply), and the response and activity of the biomass (both heterotrophic and autotrophic) have been pointed out as fundamental issues to consider. To meet this need, a multi-step experimental protocol for WW utilities has been proposed, where respirometry (OUR and AUR tests) plays a relevant role.

Author Contributions

Conceptualization, F.M.C. and M.C.C.; Methodology, F.M.C. and G.B.; Software, F.M.C. and S.B.; Validation, M.C.C., G.B. and A.A.; Formal Analysis, G.B.; Investigation, F.M.C.; Resources, M.C.C.; Data Curation, F.M.C.; Writing—Original Draft Preparation, F.M.C.; Writing—Review & Editing, F.M.C., G.B., S.B. and A.A.; Visualization, F.M.C.; Supervision, M.C.C.; Project Administration, M.C.C. All authors have read and agreed to the published version of the manuscript.

Funding

This research received no external funding.

Data Availability Statement

All data generated or analysed during this study are included in this published article.

Conflicts of Interest

The authors declare no conflict of interest.

Abbreviations

AURAmmonia utilization rate
AWTPAqueous waste treatment plant
BIOOxidation/nitrification biomass
CASConventional activated sludge
CODChemical oxygen demand
DODissolved oxygen
IDIndustrial discharge
INInput to the WWTP
N-NH4+Ammoniacal nitrogen
N-NO3Nitric nitrogen
OCOrganic carbon
OUROxygen uptake rate
TNTotal nitrogen
TKNTotal Kjeldahl nitrogen
SLRSludge loading rate
SSTotal suspended solids
VSSVolatile suspended solids
WWWastewater
WWTPWastewater treatment plant

References

  1. Ren, S. Assessing wastewater toxicity to activated sludge: Recent research and developments. Environ. Int. 2004, 30, 1151–1164. [Google Scholar] [CrossRef]
  2. Hagman, M.; La, J.; Jansen, C. Oxygen uptake rate measurements for application at wastewater treatment plants. Vatten 2007, 63, 131–138. [Google Scholar]
  3. Mhlanga, F.T.; Brouckaert, C.J. Characterisation of wastewater for modelling of wastewater treatment plants receiving industrial effluent. Water SA 2012, 39, 403–408. [Google Scholar] [CrossRef] [Green Version]
  4. Government of Italy Legislative Decree 3 April 2006, n. 152. Environmental Regulations. Available online: https://www.gazzettaufficiale.it/dettaglio/codici/materiaAmbientale (accessed on 17 January 2023). (In Italian)
  5. Rahman, M.S.; Mousumi, M.Z.; Sakib, M.A.A.; Chy, T.J.; Fahad, M.S.A.; Author, C. Development of a respirometry and cod based rapid experimental protocol for analyzing wastewater. In Proceedings of the 4th International Conference on Advances in Civil Engineering 2018 (ICACE 2018), CUET, Chittagong, Bangladesh, 19–21 December 2018; pp. 19–21. [Google Scholar]
  6. Li, Z.H.; Zhu, Y.M.; Yang, C.J.; Zhang, T.Y.; Yu, H.Q. A simple respirogram-based approach for the management of effluent from an activated sludge system. Bioresour. Technol. 2018, 261, 412–419. [Google Scholar] [CrossRef] [PubMed] [Green Version]
  7. Torretta, V.; Ragazzi, M.; Trulli, E.; De Feo, G.; Urbini, G.; Raboni, M.; Rada, E.C. Assessment of biological kinetics in a conventional municipal WWTP by means of the oxygen uptake rate method. Sustainability 2014, 6, 1833–1847. [Google Scholar] [CrossRef] [Green Version]
  8. Collivignarelli, M.C.; Bertanza, G.; Abbà, A.; Torretta, V.; Katsoyiannis, I.A. Wastewater treatment by means of thermophilic aerobic membrane reactors: Respirometric tests and numerical models for the determination of stoichiometric/kinetic parameters. Environ. Technol. 2019, 40, 182–191. [Google Scholar] [CrossRef] [Green Version]
  9. Arias-Navarro, M.; Villen-Guzman, M.; Perez-Recuerda, R.; Rodriguez-Maroto, J.M. The use of respirometry as a tool for the diagnosis of waste water treatment plants. A real case study in Southern Spain. J. Water Process Eng. 2019, 29, 100791. [Google Scholar] [CrossRef]
  10. Vasiliadou, I.A.; Molina, R.; Martinez, F.; Melero, J.A.; Stathopoulou, P.M.; Tsiamis, G. Science of the Total Environment Toxicity assessment of pharmaceutical compounds on mixed culture from activated sludge using respirometric technique: The role of microbial community structure. Sci. Total Environ. 2018, 630, 809–819. [Google Scholar] [CrossRef]
  11. Oviedo, M.D.C.; Sánchez, J.B.; Cruz, C.A.; Alonso, J.M.Q. A new approach to toxicity determination by respirometry. Environ. Technol. 2009, 30, 1601–1605. [Google Scholar] [CrossRef]
  12. Aguilar, M.I.; Lloréns, M.; Fernández-Garrido, J.M.; Pérez-Marín, A.B.; Ortuño, J.F.; Meseguer, V.F. Heavy metals effect on the heterotrophic activity of activated sludge. Int. J. Environ. Sci. Technol. 2020, 17, 3111–3118. [Google Scholar] [CrossRef]
  13. Borzooei, S.; Simonetti, M.; Scibilia, G.; Chiara, M. Journal of Environmental Chemical Engineering Critical evaluation of respirometric and physicochemical methods for characterization of municipal wastewater during wet-weather events. J. Environ. Chem. Eng. 2021, 9, 105238. [Google Scholar] [CrossRef]
  14. Vitanza, R.; Colussi, I.; Cortesi, A.; Gallo, V. Implementing a respirometry-based model into BioWin software to simulate wastewater treatment plant operations. J. Water Process Eng. 2016, 9, 267–275. [Google Scholar] [CrossRef]
  15. Mainardis, M.; Buttazzoni, M.; Cottes, M.; Moretti, A.; Goi, D. Science of the Total Environment Respirometry tests in wastewater treatment: Why and how? A critical review. Sci. Total Environ. 2021, 793, 148607. [Google Scholar] [CrossRef]
  16. Bashaar, Y.A. Nutrients requirements in biological industrial wastewater treatment. Afr. J. Biotechnol. 2004, 3, 236–238. [Google Scholar] [CrossRef] [Green Version]
  17. Permatasari, R.; Rinanti, A.; Ratnaningsih, R. Treating domestic effluent wastewater treatment by aerobic biofilter with bioballs medium. IOP Conf. Ser. Earth Environ. Sci. 2018, 106, 012048. [Google Scholar] [CrossRef]
  18. Hamza, R.A.; Zaghloul, M.S.; Iorhemen, O.T.; Sheng, Z.; Tay, J.H. Optimization of organics to nutrients (COD:N:P) ratio for aerobic granular sludge treating high-strength organic wastewater. Sci. Total Environ. 2019, 650, 3168–3179. [Google Scholar] [CrossRef]
  19. Metcalf & Eddy Inc.; Tchobanoglous, G.; David Stensel, H.; Tsuchihashi, R.; Burton, F.L. Wastewater Engineering: Treatment and Resource Recovery, 5th ed.; McGraw-Hill: London, UK, 2013; ISBN 9780073401188. [Google Scholar]
  20. Masotti, L. Depurazione delle Acque. Tecniche ed Impianti per il Trattamento delle Acque di Rifiuto; Calderini: Milan, Italy, 2011. (In Italian) [Google Scholar]
  21. Metcalf & Eddy Inc.; Tchobanoglous, G.; Burton, F.L.; Stensel, H.D. Wastewater Engineering: Treatment and Reuse, 4th ed.; McGraw-Hill: New York, NY, USA, 2003. [Google Scholar]
  22. Raboni, M.; Torretta, V.; Viotti, P.; Urbini, G. Calculating specific denitrification rates in pre-denitrification by assessing the influence of dissolved oxygen, sludge loading and mixed-liquor recycle. Environ. Technol. 2014, 35, 2582–2588. [Google Scholar] [CrossRef]
  23. Raboni, M.; Viotti, P.; Rada, E.C.; Conti, F.; Boni, M.R. The sensitivity of a specific denitrification rate under the dissolved oxygen pressure. Int. J. Environ. Res. Public Health 2020, 17, 9366. [Google Scholar] [CrossRef]
  24. US EPA Process Design Manual for Nitrogen Control. Available online: https://nepis.epa.gov/Exe/ZyNET.exe/9100PUPQ.TXT?ZyActionD=ZyDocument&Client=EPA&Index=Prior+to+1976&Docs=&Query=&Time=&EndTime=&SearchMethod=1&TocRestrict=n&Toc=&TocEntry=&QField=&QFieldYear=&QFieldMonth=&QFieldDay=&IntQFieldOp=0&ExtQFieldOp=0&XmlQuery=& (accessed on 10 March 2023).
  25. Collivignarelli, M.C.; Abbà, A.; Caccamo, F.M.; Miino, M.C.; Durante, A.; Bellazzi, S.; Baldi, M.; Bertanza, G. How to Produce an Alternative Carbon Source for Denitrification by Treating and Drastically Reducing Biological Sewage Sludge. Membranes 2021, 11, 977. [Google Scholar] [CrossRef]
  26. Collivignarelli, M.C.; Carnevale Miino, M.; Caccamo, F.M.; Baldi, M.; Abbà, A. Performance of full-scale thermophilic membrane bioreactor and assessment of the effect of the aqueous residue on mesophilic biological activity. Water 2021, 13, 1754. [Google Scholar] [CrossRef]
  27. Kristensen, G.H.; Jorgensen, P.E.; Henze, M. Characterization of functional microorganism groups and substrate in activated sludge and wastewater by AUR, NUR and OUR. Water Sci. Technol. 1992, 25, 43–57. [Google Scholar] [CrossRef]
  28. Collivignarelli, M.C.; Pedrazzani, R.; Bellazzi, S.; Carnevale Miino, M.; Caccamo, F.M.; Baldi, M.; Abbà, A.; Bertanza, G. Numerical Analysis of a Full-Scale Thermophilic Biological System and Investigation of Nitrate and Ammonia Fates. Appl. Sci. 2022, 12, 6952. [Google Scholar] [CrossRef]
  29. Surmacz-Gorska, J.; Gernaey, K.; Demuynck, C.; Vanrolleghem, P.; Verstraete, W. Nitrification monitoring in activated sludge by oxygen uptake rate (OUR) measurements. Water Res. 1996, 30, 1228–1236. [Google Scholar] [CrossRef]
  30. ISPRA Measurement Procedure for the Determination of the Chemical Oxygen Demand (COD) by Cuvette Test: Method 5135. Available online: https://www.isprambiente.gov.it/it/pubblicazioni/manuali-e-linee-guida/procedura-di-misurazione-per-la-determinazione-della-richiesta-chimica-di-ossigeno-cod-mediante-test-in-cuvetta-metodo-5135 (accessed on 25 May 2023). (In Italian)
  31. APAT-IRSA-CNR 4030 Analytical Methods for Water. Section 4000—Non-Metallic Inorganics. Ammonia Nitrogen. Non-Metallic Inorganic Constituents. METHOD A1—Spectrophotometric Determination of Indophenol. Available online: https://www.irsa.cnr.it/wp/wp-content/uploads/2022/04/Vol2_Sez_4000_InorganiciNonMetallici.pdf (accessed on 12 May 2023). (In Italian).
  32. APAT-IRSA-CNR 5030 Analytical Methods for Water. Section 5000—Organic Constituents. Organic Nitrogen. Available online: https://www.irsa.cnr.it/wp/wp-content/uploads/2022/04/Vol2_Sez_5000_Organici.pdf (accessed on 25 May 2023). (In Italian).
  33. UNI EN ISO 10304-1:2009 Water Quality—Determination of Dissolved Anions by Ion Liquid Chromatography—Part 1: Determination of Bromides, Chlorides, Fluorides, Nitrates, Nitrites, Phosphates and Sulphates. Available online: https://store.uni.com/uni-en-iso-10304-1-2009 (accessed on 25 May 2023). (In Italian).
  34. UNI 11658:2016 Water Quality—Determination of Total Nitrogen in Wastewater, Natural and Intended for Human Consumption by Means of a Cuvette Test. Available online: https://store.uni.com/uni-11658-2016 (accessed on 25 May 2023). (In Italian).
  35. APAT-IRSA-CNR 2090 Analytical Methods for Water. Section 2000—Physical, Chemical Parameters and Chemical-Physical. Solids (Total Dissolved; Total Suspended; Sedimentable; Fixed and Volatile at 600 °C). Available online: https://www.irsa.cnr.it/wp/wp-content/uploads/2022/04/Vol1_Sez_2000_Parametri-chimico-fisici.pdf (accessed on 12 May 2023). (In Italian).
  36. Rahman, M.S.; Islam, M.A.; Habib, S.; Sarker, J. Measuring Biodegradability of Industrial Wastewater by A Low-Cost Differential Respirometer. Res. J. Eng. Sci. 2013, 2, 1–4. [Google Scholar]
  37. Hoque, M.A.; Aravinthan, V.; Pradhan, N.M. Can we decode the messages of activated sludge through the respirograms? Water Air Soil Pollut. Focus 2009, 9, 449–459. [Google Scholar] [CrossRef]
  38. Andreottola, G.; Foladori, P.; Ziglio, G.; Cantaloni, C.; Bruni, L.; Cadonna, M. Methods for Toxicity Testing of Xenobiotics in Wastewater Treatment Plants and in Receiving Water Bodies. In Dangerous Pollutants (Xenobiotics) in Urban Water Cycle; Springer: Dordrecht, The Netherlands, 2007; pp. 191–206. [Google Scholar]
  39. Capodici, M.; Fabio, S.; Di, F.; Di, D.; Torregrossa, M. An innovative respirometric method to assess the autotrophic active fraction: Application to an alternate oxic–anoxic MBR pilot plant. Chem. Eng. J. 2016, 300, 367–375. [Google Scholar] [CrossRef] [Green Version]
  40. Etienne, P.; Mathieu, S. Estimation of wastewater biodegradable COD fractions by combining respirometric experiments in various So/Xo ratios. Water Res. 2000, 34, 1233–1246. [Google Scholar]
  41. Di Trapani, D.; Christensson, M.; Torregrossa, M.; Viviani, G.; Ødegaard, H. Performance of a hybrid activated sludge/biofilm process for wastewater treatment in a cold climate region: Influence of operating conditions. Biochem. Eng. J. 2013, 77, 214–219. [Google Scholar] [CrossRef]
  42. Statiris, E.; Dimopoulos, T.; Petalas, N.; Noutsopoulos, C.; Mamais, D.; Malamis, S. Investigating the long and short-term effect of free ammonia and free nitrous acid levels on nitritation biomass of a sequencing batch reactor treating thermally pre-treated sludge reject water. Bioresour. Technol. 2022, 362, 127760. [Google Scholar] [CrossRef]
  43. Inglezakis, V.J.; Malamis, S.; Omirkhan, A.; Nauruzbayeva, J.; Makhtayeva, Z.; Seidakhmetov, T.; Kudarova, A. Investigating the inhibitory effect of cyanide, phenol and 4-nitrophenol on the activated sludge process employed for the treatment of petroleum wastewater. J. Environ. Manag. 2017, 203, 825–830. [Google Scholar] [CrossRef]
  44. Kujawa, K.; Klapwijk, B. A method to estimate denitrification potential for predenitrification systems using NUR batch test. Water Res. 1999, 33, 2291–2300. [Google Scholar] [CrossRef]
  45. Peng, Y.Z.; Ma, Y.; Wang, S. ying Denitrification potential enhancement by addition of external carbon sources in a pre-denitrification process. J. Environ. Sci. 2007, 19, 284–289. [Google Scholar] [CrossRef]
  46. Itokawa, H.; Hanaki, K.; Matsuo, T. Nitrous oxide production in high-loading biological nitrogen removal process under low cod/n ratio condition. Water Res. 2001, 35, 657–664. [Google Scholar] [CrossRef]
  47. Collivignarelli, M.C.; Abbà, A.; Bertanza, G.; Baldi, M.; Setti, M.; Frattarola, A.; Carnevale Miino, M. Treatment of high strength wastewater by thermophilic aerobic membrane reactor and possible valorisation of nutrients and organic carbon in its residues. J. Clean. Prod. 2021, 280, 124404. [Google Scholar] [CrossRef]
  48. Collivignarelli, M.C.; Carnevale Miino, M.; Arab, H.; Bestetti, M.; Franz, S. Efficiency and Energy Demand in Polishing Treatment of Wastewater Treatment Plants Effluents: Photoelectrocatalysis vs. Photocatalysis and Photolysis. Water 2021, 13, 821. [Google Scholar] [CrossRef]
  49. Dulekgurgen, E.; Doǧruel, S.; Karahan, Ö.; Orhon, D. Size distribution of wastewater COD fractions as an index for biodegradability. Water Res. 2006, 40, 273–282. [Google Scholar] [CrossRef]
  50. Lagarde, F.; Tusseau-Vuillemin, M.H.; Lessard, P.; Héduit, A.; Dutrop, F.; Mouchel, J.M. Variability estimation of urban wastewater biodegradable fractions by respirometry. Water Res. 2005, 39, 4768–4778. [Google Scholar] [CrossRef]
Figure 1. (a) Reference scheme of the case study and (b) structure of the experimental protocol. ID: industrial discharge; IN: WW entering the urban WWTP; BIO: autotrophic and heterotrophic biomass sampled in WWTP; WWTP: wastewater treatment plant.
Environments 10 00108 g001
Figure 2. Laboratory respirometric apparatus.
Environments 10 00108 g002
Figure 3. Results of the batch OUR tests carried out with the heterotrophic biomass sampled in the WWTP. End: Endogenous OUR. Ref: Reference value. Boxplots represent the distance between the first and third quartiles while whiskers are set as the most extreme (lower and upper) data point not exceeding 1.5 times the quartile range from the median. The cross represents the mean value. N: number of replicated tests.
Environments 10 00108 g003
Figure 4. Continuous OUR tests performed in parallel with (a) IN and (b) INNEW (IN + ID) substrate.
Environments 10 00108 g004
Figure 5. Results of the batch AUR tests with autotrophic biomass sampled in the case study-WWTP. Ref: Reference value. Boxplots represent the distance between the first and third quartiles while whiskers are set as the most extreme (lower and upper) data point not exceeding 1.5 times the quartile range from the median. The cross represents the mean value. N: number of replicated tests.
Environments 10 00108 g005
Table 1. Qualitative characteristics of AWTP industrial effluent. n: number of data.
Mean ValueConfidence Interval
pH (-)10.1
[n: 12]
±0.24
COD (mg L−1)2143
[n: 12]
±85
BOD5 (mg L−1)317
[n: 12]
±77
TN (mg L−1)154
[n: 5]
±50
N-NO3 (mg L−1)15.5
[n: 12]
±3.5
N-NH4+ (mg L−1)15.4
[n: 12]
±3.5
The monitoring data of AWTP refer to the year 2019.
Table 2. Flow rates (m3 d−1) and loads (kg d−1) of the polluting parameters in ID, IN, INNEW and mixing ratio of ID in INNEW. n: number of data.
IDININNEW *
(IN + ID)
Mixing Ratio (ID/INNEW)
Q (m3 d−1)200 ± 5045.575 ± 205345.7750.45 ± 0.05%
[set/estimated][n: 12][calculated][n: 12]
COD (kg d−1)441 ± 4312.677 ± 260613.1183.7 ± 0.7%
[n: 12][n: 70][calculated][n: 12]
TN (kg d−1)28.4 ± 9.31044.6 ± 1010732.6 ± 0.9%
[n: 5][n: 5][calculated][n: 5]
N-NO3 (kg d−1)3.0 ± 0.810.1 ± 3.41327.3 ± 8.5%
[n: 12][n: 70][calculated][n: 12]
N-NH4+ (kg d−1)3.2 ± 0.9731.1 ± 947340.44 ± 0.12%
[n: 12][n: 70][calculated][n: 12]
The monitoring data of AWTP and WWTP refer to the year 2019. * Calculated from the sum of IN and ID mean values.
Table 3. Operating conditions at the urban WWTP, without ID (IN) and with ID (INNEW: IN + ID) into the WW to be treated. SLR: sludge loading rate, VOX: oxidation/nitrification volume, VDEN: denitrification volume, OC: organic carbon.
ININNEW
(IN + ID)
Oxidation/nitrification
SLR (kgBOD5 kgSS−1 d−1)0.1110.109
BOD:N:P100:26:4100:26:4
Oxygen supply (kgO2 d−1)12′30012′400
Denitrification
VDEN (m3)6700 (14 °C)
3785 (20 °C)
(Real volume: 6000 m3)
6990 (14 °C)
3950 (20 °C)
(Real volume: 6000 m3)
OC (kg d−1)2500
(BOD5, IN BIO: 4370 kg d−1)
2600
(BOD5, IN BIO: 4440 kg d−1)
BOD5,IN BIO (kg d−1): BOD5 daily load entering the biological oxidation/nitrification compartment.
Disclaimer/Publisher’s Note: The statements, opinions and data contained in all publications are solely those of the individual author(s) and contributor(s) and not of MDPI and/or the editor(s). MDPI and/or the editor(s) disclaim responsibility for any injury to people or property resulting from any ideas, methods, instructions or products referred to in the content.

