Abstract
The current Waste Electrical and Electronic Equipment (WEEE) management system of the European Union to be applied in all member states was introduced in 2002 by the first WEEE directive (2002/96/EC). Since the beginning, the system was intended to improve the management of WEEE and promote circular economy principles in the sector. This study aims at evaluating the environmental and social impacts of the WEEE management system in Italy, with a special focus on collection and recycling in Campania Region (the third more populated Italian Region, Southern Italy). The Life Cycle Assessment (LCA) is jointly applied with the Social Life Cycle Assessment (S-LCA). All five categories of WEEE (R1 to R5) are considered in the assessment. The LCA results show that the extraction of metals and materials from 1 tonne of WEEE collection and recycling generates much lower environmental impacts than the extraction and refining of an equivalent amount of virgin resources. In particular, the results of the environmental LCA highlight that the treatment of 1 tonne of WEEE collected in the Campania Region provides the opportunity to recover several metals such as Aluminum, Iron, Steel and ferrous materials, Copper, Nickel, Lead, and precious metals (Gold, Silver, and Palladium). According to S-LCA, the collection and recycling of 1 tonne of WEEE provides positive impacts to the investigated sub-categories of recipients (i.e., local community and society), except in some cases where the collection may potentially generate negative impacts, expressed by a lower “safe and healthy living conditions” indicator in the local community sub-category. In particular, much more must be done to support small Municipalities towards better collection procedures and integration within the largest Regional and national WEEE valorization networks. Solutions are suggested to improve the transition of the WEEE management system towards a more just environmental and social circular economy model.
1. Introduction
The trends of waste electrical and electronic equipment management (WEEE) are a growing worldwide issue. So far, many studies have highlighted the continuous growth of the production of WEEE or e-waste, due to the reduced lifespan of electrical and electric equipment (EEE) and the continuous upgrading/launching of new EEE versions (e.g., mobile phones, personal computers, etc.) by companies influencing consumers to replace the old devices [1,2]. Massa and Archodoulaki [3] analysed the growth of WEEE in the period 2014–2019 and found that only screens and monitors had a reverse trend, while the other WEEE categories (e.g., large and small equipment, temperature exchange equipment, and small ICT devices) have grown by 4–7%. The consumption of some of the metals contained in WEEE, such as copper, iron, gold, silver, lead, and zinc and their accumulation in stocks (which can also be considered WEEE) has achieved amounts higher than those in known natural deposits [4,5].
WEEE prevention and valorization [6,7,8] in a Circular Economy perspective [9] are therefore necessary resource savings measures to preserve the known natural deposits of these scarce materials [10] and continue to rely on them for the manufacturing of new technological devices. The EU has defined lists of Strategic Raw Materials and Critical Raw Materials. In both lists, metals like Copper and Nickel, largely recoverable from WEEE, are also included [11]. WEEE valorization started to be promoted in the EU more than two decades ago using an amendment to the first WEEE directive (2002/96/EC) [12]. The latter has been replaced by another directive (Directive 2012/19/EC) [13] regulating WEEE management in the EU. This directive encourages both sustainable production and consumption and the environmental performances of EEE products over their entire life cycle, namely the design and production stages, by connecting them with the end-of-life stage [14].
Several stakeholders, such as producers, consortia, distributors, consumers, municipalities, operators of the treatment plants, the local community, and society, are involved in the whole life cycle of EEE products. The EU Directive also promotes the CE principles in the sector [15] with “prevention”, “reuse” and “repair” placed at the higher levels of the waste hierarchy before “recycling” [16]. The problem is that “recycling” is an industrial activity, which, to be profitable, needs constant and relevant flows of WEEE [17]. These features render problematic waste prevention, the shift from the linear/recycling economy to the CE, and the reduction of the environmental and social externalities of recycling [8,17]. Finally, only about 40% of WEEE are collected in the EU, while data are missing or uncertain concerning the remaining part [18].
Despite these shortcomings, the EU WEEE management system provides many advantages, encouraging collection in dedicated sites (e.g., collection centres, both fixed and mobile, retailer’s shop’s smart bins and so on) and preventing WEEE abandonment or improper handling before treatment. It also promotes the treatment of WEEE in industrial processes, set up according to environmental and social standards [19]. The implementation of these latter ensures the commitment of an organization to perceive and improve workplace health and well-being (e.g., by implementing ISO 45001 [20], decreasing the health risks for the environment and people involved in the processing plants as well as for the local communities around them. In some countries (e.g., China), WEEE treatment is becoming similar to that of the EU in some processes (e.g., WEEE dismantling [19]), while in other countries (such as Pakistan and several African countries), WEEE treatment is still based on manual dismantling, burning of wires, extraction of precious metals using their immersion in acids [2,3]. Such activities often occur in highly populated areas, negatively affecting workers involved in the treatment processes and the local community [21]. Therefore, monitoring WEEE collection and management and assessing their impacts are relevant and useful to promote transparency and convey feedback to policymakers towards hopefully improving the current situation [21,22].
To clarify the WEEE management system, it should be preliminarily stated how are WEEEs divided into main categories (R1, R2, R3, R4, R5) in Italy. R1 includes WEEEs from refrigerators, freezers, and air conditioning devices; R2 includes WEEEs from washing machines, dishwashers, hoods, and ovens; flat screens from televisions, CRT screen televisions, tablets, digital picture frames generate R3 WEEEs; the R4 WEEE category derives from small appliances, electronic or digital appliances, lighting appliances, photovoltaic panels, and finally R5 WEEEs mainly include exhausted discharge lamps, fluorescent lamps, neon tubes, LED bulbs. Biganzoli et al. [23] and Fiore et al. [24] applied LCA in combination with Material Flow Accounting to analyse impacts and mass balances of the five categories of WEEE in Lombardia and Piemonte Regions (Northern Italy, Lombardia being the most populated Italian Region). Biganzoli et al. [23] found that Steel is the main recovered metal from R1, R2 and R4 WEEE groups, while Glass ranks higher in the treatment of R5 WEEE. The environmental benefits of the WEEE recovery (resulting from replacing the primary materials and energy by means of recovered secondary items) offset the environmental costs in all five groups (for almost all the impact categories). ABS (acrylonitrile butadiene styrene) and PS (polystyrene) plastics are also recovered in essential quantities, while precious metals, such as gold, silver, and palladium, are recovered in much lower amounts. Fiore et al. [24] point out that the recycling rates of the R1, R2 and R3 categories achieve 80, 99 and 91% of the total material input at the recycling plant, while the most important categories to which the recycling processes of these three investigated WEEE groups (R1, R2, R3) contribute are marine ecotoxicity potential and freshwater ecotoxicity potential.
While many LCA studies highlight the environmental benefits of WEEE recovery in the international literature, only a few studies investigated the social impacts of the whole WEEE management systems using S-LCA individually or jointly with LCA. Concerning S-LCA, Umair et al. [21] adopted this method to analyse the social performances and social impacts of informal WEEE recycling in Pakistan. They considered as stakeholders’ categories: workers, local community, society, and value chain actors. These authors collected the data for the assessment by means of interviews and on-field analyses. Their results highlight that informal recycling mainly negatively impacts the health of workers and the local community, but at the same time, it provides employment opportunities, reducing poverty and favoring economic development. Therefore, they recommend Governmental initiatives to protect the environment and the health of workers and local communities. These authors also suggest the importance of monitoring the level of hazardous substances in water and soil, the reduction of working hours and ban child labor to align Pakistan regulations with those adopted at the international level.
Similarly, Abeliotis et al. [25] assessed the social impacts of WEEE reuse in Greece by means of S-LCA to highlight the main factors to be considered to assess the social effects of WEEE reuse. They perform the S-LCA within the framework of an interesting project, namely REWEEE, funded by a Life EU programme, which aims to prevent the generation of WEEE by means of their reuse and preparation for reuse as well as improvement of awareness of reuse by the consumers. In their study, the authors assessed the social impacts of a WEEE collection and sorting centre. Their results show that WEEE collection generates positive social impacts regarding new jobs, particularly at the local level. Further positive social impacts are accrued from the repair of household EEEs and the increase in their lifetime. However, the authors highlight that these measures could decrease the demand for EEE, generating negative social impacts on the manufacturing companies and the whole EEE and WEEE supply chain.
It is important to consider that the WEEE directive (Directive 2012/19/EC) and the transition to CE aim to improve the environmental sustainability of EEE products since they promote sustainable production and consumption. In that, the EU aims to stimulate a market of EEE where products generate lower environmental externalities. As a result, some negative effects of the reuse can be compensated by better products on the market and better use of natural resources. Therefore, these distributional aspects further underline the relevance of conducting an S-LCA for policy decision-making.
Finally, Lu et al. [26] performed an interesting Life cycle sustainability assessment, including LCA, LCC (Life Cycle Costing) and S-LCA in the analytical framework. They compare two scenarios for recovering waste mobile phones in China: reuse of mobile phone components (scenario A) and material recovery of mobile phones (scenario B). They also compared formal and informal sectors in performing scenarios A and B for the recovery of waste mobile phones. Their results highlight that both scenarios provide environmental benefits in terms of avoided use of natural resources for the production of new products and components, but the benefits are higher for scenario A compared to scenario B. Scenario A is also better than B in the LCC results because the price of reusable components is higher. The S-LCA framework considers both workers’ and local community stakeholders’ categories. The results indicate that the formal sector hired fewer workers than the informal sector, but the wages, social guarantees and health conditions are much better.
Italy (and Southern Italy in particular) is characterized by a very low rate of WEEE collection and recovery [23,24]. This is due to several reasons: lack of a collection network well distributed throughout the territory, weak participation, and awareness on the part of citizens/consumers, lack of trust of stakeholders towards public administrations initiatives, lack of educational programs to generate awareness and appropriate perception of benefits, lack of incentives. This study evaluates via LCA the Campania region WEEE collection and treatment stages. It compares it with Northern Italy’s performances, intending to clearly show a global picture of the potential benefits that could be achieved if a circular economy model were applied to the WEEE sector, per a series of EU and national Directives. Therefore, this study has two main joint goals. The first one is to point out the environmental impacts and benefits of the collection and recovery of WEEEs compared to primary materials from mining using the Life Cycle Assessment approach. In addition, as previously mentioned, the study also aims at identifying the most important social impacts (negative and positive) of the WEEE management system and test the contribution of S-LCA to a formal WEEE management system of the EU.
2. Materials and Methods
2.1. The WEEE Management System in Italy
Figure 1 provides an overview of how WEEE management is organized in Italy and the main involved stakeholders. Currently, both the collection and recycling of WEEE are regulated by the Italian legislative decree 49/2014, which defines the responsibilities of the different stakeholders in the WEEE system. These are manufacturers, collective systems (consortia), retailers, local authorities, consumers, and treatment companies. The latter has specific tasks to ensure that the system works adequately, and the environmental impacts are minimized [27].
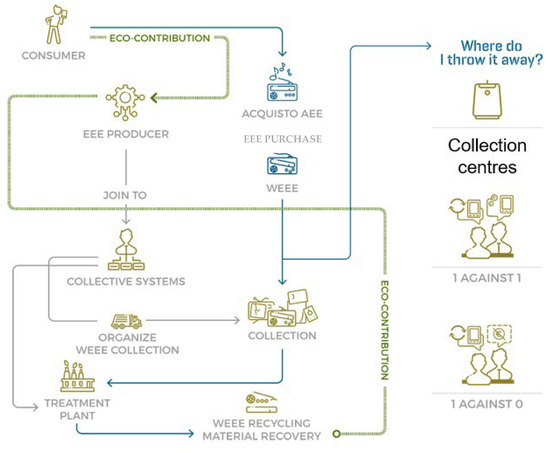
Figure 1.
The WEEE system in Italy and all the most important stakeholders. Reprinted/adapted with permission from [27]. © 2019 WEEE Coordination Centre [27].
Figure 1 also shows that the citizens/consumers can confer their WEEE free of charge to the collection centres managed by the municipalities, preventing WEEE landfilling or disposing of it together with other urban waste. Citizens can also benefit from the “1 against 1” or “1 against 0” services managed by the retailers, i.e., if they confer their WEEE to the retailers when purchasing a new EEE (i.e., “1 against 1”) or not (i.e., “1 against 0”). The collective systems (consortia) help the EE manufacturers address responsibilities concerning the end-of-life operations of EEE until they are treated and transformed into secondary materials. The cost of the end-of-life activities performed by the collective systems is funded by the eco-contribution paid by the consumer when purchasing a new product (Figure 1).
In compliance with the Italian legislative decree 49/2014, the producers of domestic EEE assign the responsibility for managing domestic WEEE to the Collective Systems. Currently, 13 non-profit Collective Systems handle the transport, treatment, and recovery of collected WEEE in agreement with the decrees and the rules set by the WEEE Coordination Centre. The role of the Collective Systems is proportional to the market share of the corresponding producers of the five WEEE groups classified in Italy as shown in Figure 2: R1 (cooling and freezing appliances), R2 (large household appliances), R3 (screen monitors), R4 (consumer equipment), R5 (lighting equipment).
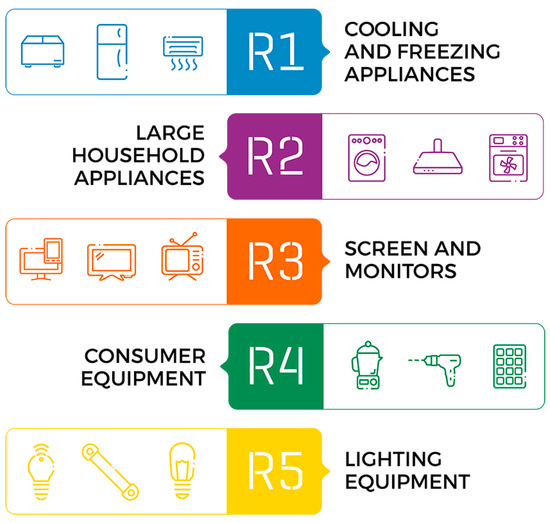
Figure 2.
Classification of WEEE in Italy. Source: Reprinted/adapted with permission from [27]. © 2019 WEEE Coordination Centre [27].
Producers of EEE also encourage, by means of the collective systems and the provision of efficiency rewards, the local municipalities to improve the quantity and quality of the WEEE collected. Efficiency rewards are paid to Collection Centres, considering specific criteria and their good performances [27].
2.2. Life Cycle Assessment Method
The LCA is a well-known and standardized method within the framework of the ISO norms (14040). It is helpful to determine the environmental loads and the opportunities for their improvement in the life cycle of products, services, and activities [28,29]. LCA supports the decision-making of private companies and the public sector. In that, it can be used for different purposes (product design, adoption of eco-labelling schemes, strategic policy planning, etc.) as well as in combination with other tools to have a broader picture of an investigated system according to all the sustainability dimensions (environmental, economic, and social) [30,31].
2.2.1. Goal and Scope
The main goal of the present study is to evaluate the materials that can be recovered by the collection and treatment of WEEE in the Campania Region and the environmental impacts associated with such a sequence of processes as a sample of the whole Italian WEEE treatment. Therefore, the system boundaries of the present LCA consider the collection in Campania Region in the year 2020, the transport of WEEE from the collection centres of the Campania Region to the processing and recovery plant located in a bordering Region (Basilicata) in Southern Italy. About 70% of the WEEE collected is treated in the big recycling plant of the company Ri-Plastic which receives the WEEE collected from almost all the Southern Italian Regions (Basilicata, Abruzzo, Molise, Calabria, and Sicily). Figure 3 shows how the WEEE collected in Campania is transported for treatment towards other Italian Regions and abroad (Germany, Netherlands, India, and Pakistan) [32].
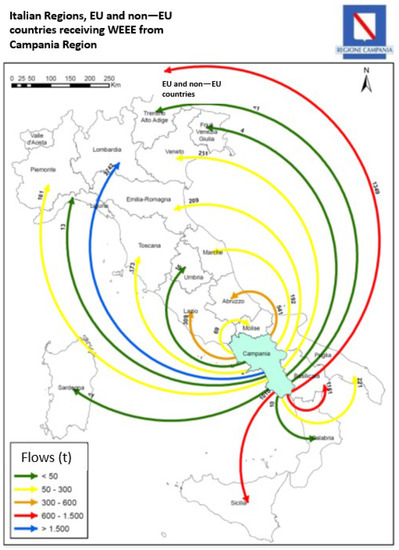
Figure 3.
Outflows of WEEE sent out from Campania Region to other Italian Regions, EU countries and abroad for treatment after collection. Reprinted/adapted with permission from [32]. © 2022 ARPAC Campania Region [32].
In 2020, the total WEEE collected in Campania Region amounted to 20,269 tonnes. Figure 4 shows the distribution of the WEEE collected through the five WEEE groups (R1, R2, R3, R4, R5) following the Italian WEEE classification (Figure 2) in the year 2020.
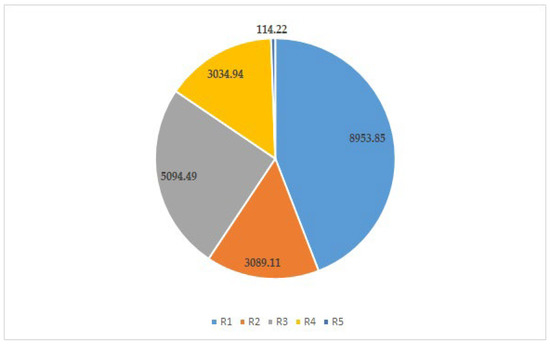
Figure 4.
Total WEEE Collected in Campania Region (Southern Italy) in the year 2020 (considered in this study) across the five WEEE categories. Own elaboration of the authors.
An economical allocation is adopted in this study due to the fact that the main driver for the treatment of WEEE is the economic valorization of the materials/components that can be extracted [33]. In this case, most of the data about the economic value of recovered materials and components have been gathered from the database of the Italian Borsino dei Rifiuti (Waste Stock Exchange) website (accessed on: 5 May 2023) [34].
2.2.2. Life-Cycle Inventory
Inventories of the investigated WEEE categories are provided in Appendix A, Table A1, Table A2, Table A3, Table A4 and Table A5 referred to 1 tonne of each WEEE category as a Functional Unit.
This study uses primary annual data (the year 2020) for the collection stage from the database of the Italian WEEE Coordination Centre—WEEE Italian Management System established to comply with the WEEE EU directive. Primary data have been provided about the treatment stage by the most critical recycling Company, Ri-Plastic [35], located in Southern Italy, which processes a large share of the WEEE collected in the Campania Region. The data regard the mass balance of the five WEEE groups (R1, R2, R3, R4, R5).
Secondary data collected from Ecoinvent 3.1 [36] are associated with the transport processes of WEEE from users to the ecological islands (assuming an average distance of 15 km) and from the ecological islands to the recycling plant (assuming a distance of 150 km). Additional secondary processes retrieved from Ecoinvent 3.1 are the treatment and disposal of some WEEE materials or components (plastic from cables, capacitors) in waste-to-energy plants or disposal in sanitary landfills (polyurethane) as well as in landfills for hazardous waste (cone glass).
2.2.3. Life Cycle Impact Assessment
This stage identifies and calculates the environmental impacts (emissions) associated with each material flow recovered from the five WEEE groups (R1, R2, R3, R4, R5) in terms of the overall contribution provided by each WEEE category to the 18 environmental categories considered in the Impact Assessment Method used in this study (ReCiPe 2016 Midpoint [37]). The software used for LCA assessment based on primary and secondary data is OpenLCA 2.0 [38].
2.3. Social Life Cycle Assessment
The Social life-cycle assessment (S-LCA), as evidenced in the UNEP Guidelines for SLCA [39], is a method for the assessment of the potential social impacts of products and services over their life cycle (e.g., from the extraction of raw material to the end-of-life phase) as well as of organizations [40,41]. S-LCA comprises a systematic assessment framework consisting of quantitative and qualitative indicators providing information on social and socio-economic aspects of the life cycle of products and organizations, showing how the latter could monitor and improve their social performances and, ultimately, the well-being of stakeholders [39]. The present study performs an S-LCA based on the UNEP Guidelines for S-LCA [39] and ISO 14040/14044 for Environmental LCA. This S-LCA develops over the main four stages: Goal and scope definition, life cycle inventory, life cycle impact assessment, and life cycle interpretation results [41,42,43] and can be considered a most suited complementary study of the environmental LCA mentioned above.
2.3.1. Goal and Scope
The main goal of this S-LCA is the following:
- Assessment of the potential social impacts (positive and negative) associated with 1 tonne of collected and treated WEEE (groups R1, R2, R3, R4, R5) of Campania Region.
- Assessment of the social performances of the WEEE management system of Campania Region in the year 2020 to provide helpful feedback to public decision-making in defining policies and programs for CE development.
The social performances of the WEEE management system have been evaluated by considering the behaviors of the organizations involved in collecting and treating the WEEE.
The system boundaries cover the stages of collection and recycling of the five WEEE product categories.
We selected two stakeholder categories, “Local community” and “Society”, in this S-LCA, trying to interpret the general interests of the WEEE directive (Directive 2012/96/EC), the goal of which is to favor a cleaner production of EEE (with limited use of hazardous substances such as heavy metals and flame retardants and the replacement with safer tools) and better management of WEEE to reduce the risks for the local natural environment, community and society and favor their valorization. Collection and treatment are critical in the Southern Regions of Italy because of the lower collection rates compared to the northern areas of Italy and the lower number of certified treatment plants for WEEE recovery and recycling [44].
However, at the same time, WEEE collection and treatment can also be an opportunity for development for local communities and the whole society of the Campania Region. Therefore, it is essential to apply assessment frameworks to monitor and evaluate the environmental and social performances of the involved organizations and the potential impacts associated with collecting and treating the WEEE [45].
2.3.2. Social Life Cycle Inventory
The Subcategories and related social indicators have been identified considering the UNEP/SETAC Guidelines for S-LCA [39] and the Methodological sheets by UNEP/SETAC [42]. Accordingly, the data have been collected through direct interviews with several important stakeholders operating in the WEEE management system of Campania Region and from the analysis of their websites and social networks, as well as plans and legislation of Campania Region.
The data relating to the WEEE collection stage have allowed for assessing the social performances and potential social impacts of the WEEE management system by considering the activities of the municipalities, the Regional Department of Campania of the Integrated Water and Waste Cycle, Environmental Assessments and Authorizations and consortium ECOEM (a national WEEE recovery consortium, located in Campania region). For the treatment stage, the data collected have been very useful in analysing the social performances and potential social impacts associated with the processing plant for WEEE treatment of the company Ri-Plastic. The interviewees of the two stages are listed in Table 1.

Table 1.
Stakeholders were interviewed in the collection and treatment stages.
Moreover, the data collection for this study has benefitted the research activities of the JUST2CE project funded by the EU within the Horizon 2020 actions (currently ongoing), which considers the whole Campania Region as a case study for larger picture development and adds the consideration of the social performances of WEEE management system. One of the goals of this project is to evaluate the potential for moving towards just circular production-consumption patterns and leveraging the involvement and behavioral aspects of the various stakeholders and the related social effects [45].
2.3.3. Social Life Cycle Impact Assessment
This stage is crucial since it has the goal of calculating, understanding and evaluating the magnitude and significance of the potential social impacts of a product system throughout the life cycle of the product” [39].
The collected data and information of the inventory social indicators of the two stakeholder’s categories “local community“ (Table A6) and “society (Table A7)” allows us to determine the results of this S-LCA and evaluate the social performances and potential social impacts of the WEEE management system in the stages of collection and treatment.
Type I impact assessment–The checklist method has been adopted for the impact assessment as applied by previous scholars [21,46].
3. Results
This section starts by analyzing the materials and components that can be derived from the recycling of WEEE and, in Section 3.2 and Section 3.3, evaluates the main results of the performed LCA and S-LCA, respectively.
3.1. WEEE Composition
Table 2 shows the outputs from each WEEE group (R1, R2, R3, R4, R5). These outputs can also be ascertained, along with the input, in the Inventory Table A1, Table A2, Table A3, Table A4 and Table A5 included in Appendix A. Table 2 evidences that very different amounts of the same materials and components can be recoverable from each WEEE group. Ten important metals of the periodic table are included. R1 and R4 WEEE groups are the richest of iron, while R2 WEEE has the largest fractions of steel and ferrous metals. The highest number of precious metals (gold, silver, and palladium) is obtained from R3 and R4 WEEE categories due to their higher quantity of Printed Wiring Boards (PWBs). Beyond metals, R5 WEEE contains the highest amount of glass, including several light sources such as discharge lamps, fluorescent lamps, neon tubes, LED bulbs, etc.
Table 2.
Output (materials/components) from input R1, R2, R3, R4, and R5 WEEE groups, according to the WEEE classification in Italy (kg/tonne of WEEE group).
According to Table 2, each WEEE category provides, when properly treated, large amounts of valuable materials and metals. When considered in absolute terms, these amounts are not fully telling until they are compared regarding energy, economic and environmental costs. For example, extracted gold is very small, but its economic value is much more than many other items recovered from WEEE. Some metals are certainly very valuable in terms of absolute amounts (Iron and steel), saved energy cost of refining (Aluminum), and economic cost (Copper). For this reason, it may be very important to estimate the impacts associated with these recovered metals (per kg) and compare them with primary metals. This comparison will be made in Section 4—discussion, starting from Table 6.
3.2. Life Cycle Assessment Results
Table 3 presents the different environmental impacts of 1 kg of iron across the five WEEE groups due to the different treatment procedures. As shown in Table 2, iron is one of the metals recoverable in larger amounts than the other materials. The treatment of 1 kg of iron generates the highest impact in all R1 WEEE. For example, the Global Warming impact of iron is 0.0824 kg of CO2 eq, while the lowest environmental costs of iron treatment are found in R4 WEEE (−0.0063 kg of CO2 eq.), where the negative value refers to avoided impacts due to saved emissions in some steps of the process.
Table 3.
Impacts of 1 kg of Iron (out of total iron from Table 3) for each WEEE group.
Aluminium is recoverable in all five WEEE groups. Table 4 shows that 1 kg of Aluminum from R5 WEEE has the highest impact in most analyzed environmental impacts categories.
Table 4.
Impacts of 1 kg of Aluminum (out of total Aluminum from Table 2) for each WEEE group.
Copper is only recovered from four WEEE groups, except R5 WEEE (Table 5). The highest amount of copper arises from the treatment of the R4 WEEE group (Table 2). With the R3 group, this latter generates lower environmental impacts to all the impact categories compared to R1 and R2 groups.
Table 5.
Impacts of 1 kg of copper (out of total Copper from Table 2) for each WEEE group.
3.3. Social Life Cycle Assessment Results
The results of this S-LCA applied to the collection and treatment of WEEE are presented in detail in Table A6 and Table A7 of Appendix B and summarized in Table 8 in Section 4—Discussion. Section 3.3.1 evaluates the results for the collection stage, while Section 3.3.2 evaluates those of the treatment stage.
3.3.1. Inventory Analysis and Assessment of Collection Stage
Table A6 shows the subcategories and related social indicators evaluated for the “local community” category. The indicators used are mainly qualitative. The results of the social indicator “Annual stop connected to protests of organizational actionP” (impact subcategory: access to immaterial resources) reveals that the past problems in the management of urban solid waste experienced by Campania Region still affect the relationships between public administrations and authorities and local communities also for other waste streams such as WEEE.
Due to the so-called “waste crisis” from the years 1994 to 2012 [47,48], there is a lack of trust in the local communities (in particular of the suburbs) towards the management of waste by the public sector. These factors contribute to negatively affecting the collection of WEEE in the Campania Region as citizens are uncertain about how the WEEE will be handled by the public municipalities. Moreover, citizens are not still fully aware of the value of WEEE, and which benefits could derive from their collection.
The interviews with the Regional Authority Representatives have underlined that they are increasing their efforts towards improving the relationships with the local communities and invested last year in education initiatives. The municipality of Naples is currently promoting (April–May 2023) cultural events and environmental education programs to enhance WEEE collection in Naples and awareness about its importance.
In the past years, other municipalities in Campania Region have participated in the project “WEEE School”, aimed to educate students and their families about the value of WEEE (small WEEE) and how they should be collected and properly handled [49]. A further project has been the “Inno WEEE”, in which some pilot provinces of the Campania region have been involved. The project focused on smart bins available 24 h/day where citizens could deliver their WEEE as an alternative option to municipal collection centers [50]. The Municipality of Naples has also participated with the University of Naples “Parthenope”, Legambiente and other social organizations in the project RE-BIT. The latter was centred on the repair and regeneration of still-use personal computers that, after the repair, have been donated to primary schools [51]. These latter actions positively affect the “Presence/strength of community education initiatives” indicator.
With regard to the impact subcategory “Access to Material resources”, the interview with the director of the consortium ECOEM indicated they have implemented an environmental certification management system, ISO 14001, to identify and improve the management of the environmental aspects of their organization. Such activity contributes positively to the indicator “Evidence of a certified environmental management system”.
However, the results of the subcategory “Safe and Healthy Living Conditions” highlight that there are also cases of small municipalities in Campania that devote low attention to the WEEE collection contributing negatively to the social indicators “Management oversight of structural integrity” and “Management effort to minimize the use of hazardous substances”.
Another important aspect regards the evaluation of the contribution to “Local employment” by means of the social indicator “Percentage of the workforce hired locally”. WEEE collection represents an opportunity for the local workforce to be employed in collection centers, consortium and local companies aimed at collecting and first dismantling the WEEE.
Table A7 shows the results of the contribution to the social indicators used to assess the performances of the WEEE management system towards the stakeholder category “Society”. The system’s performances in both collection and treatment can be considered positive to the social indicators of the subcategory “Public commitment to sustainability issues” since Campania is committed, within the wider Italian framework, to the achievement of the targets of the EU in terms of collection rates. Moreover, the Region has also updated the Regional Plan for managing Special waste to strengthen the implementation of the CE in the Region [52].
The plan aims to achieve the objectives of CE and ecological transition, considering the effects of the management of special waste on the environment, human health, the economy, and society. The Plan is articulated into five main goals such as (1) The promotion of the reduction of the quantity and hazardousness of waste produced; (2) The reuse of waste within different production cycles; (3) The maximization of recycling and other forms of recovery and the minimization of disposal; (4) The promotion of the principle of the proximity of the plants in relation to the sites where they are produced, in compliance with the criteria of environmental sustainability and (5) The commitment to fight the illegal management of special waste. Finally, the Plan develops the five goals into further specific 16 goals that also include actions aimed at the improvement of the performances of the collection and recovery system of WEEE.
Campania Region, by means of its Regional Agency for the Protection of the Environment [53], has also set a monitoring system for tracking the inflows and outflows of WEEE of the Region towards the other Italian Regions, the EU, and foreign countries.
The improvement of the collection targets is a prerequisite to favor the investments and installation of treatment plants in the Campania Region that currently are not available. Opening new treatment plants requires high investment costs, so a minimum amount and constant flow of WEEE are needed to justify such investments.
The collection of WEEE contributes to the economic progress and development of the society of the Campania Region, while the treatment stage at present favors the economic progress of other Italian Regions where the WEEE are transported to be treated.
The Consortium ECOEM, in charge of the collection of WEEE from the different collection points of the Region and their transport to the treatment plants, is an important reference organization for the promotion of the correct collection and recycling of WEEE as well as for the establishment of “Partnership in research and development” with universities in the field of WEEE, contributing to influence positively the social indicator “Partnerships in research and development” in the subcategory “Technological Development”.
3.3.2. Inventory Analysis and Assessment of Treatment Stage
The social indicators in Table A6 and Table A7 have also been used to evaluate the potential social impacts and social performances of the organizations mainly involved in treating WEEE collected in the Campania Region. In the interview with the Chief operating officer of the Ri-Plastic Company emerges that in their activity, they are committed to maximizing the recovery of materials from the collected WEEE and, at the same time, minimizing the impacts on the environment.
The Company also aims to have a positive social impact towards the local community where its treatment plants are located (in total, Ri-Plastic has three treatment plants, each one located in three different Italian Regions in Central–Southern Italy). Recently, the company in one of its plants has organized a social event in collaboration with Legambiente environmental association to strengthen the relationships with the local community and promote the dissemination of the principles of CE, such as the regeneration, repair, and the value of the donation to the local community.
The organisation’s overall activity is conducted in agreement with the current European and Italian legislations and environmental, quality and occupational health and safety certification standards such as the certification schemes ISO 14001, ISO 9001 and 45001. These aspects positively influence the subcategories “Access to immaterial resources” and “Access to material resources” and related social indicators. During the interview, the Company’s Chief Operating Officer also confirmed that their processes are subject to internal audits aimed at certifying that they comply with the required standards of the certification schemes and authorizations. The adoption of ISO 14001 positively impacts the social indicator “Management efforts in minimizing the use of hazardous substances” in the subcategory “Safe and healthy living conditions.”
Implementing the certification, ISO 45001 assures the commitment of the company towards the care of its employees and, potentially, the willingness to maintain a safe and healthy working environment. Recent events organized by the company in one of the plants can be considered a form for engaging with the local community stakeholders. Finally, a positive social impact is provided to the “Local Employment subcategory” since the treatment plants mainly hire local employees.
Concerning the social impacts on the stakeholder category “society”, the Company is certified ISO 14001. This aspect contributes positively to the social indicator “Public commitment to sustainability issues.”.
Adopting an environmental management system, ISO 14001 (based on respecting the LCA principles), is handy for an organization to identify and manage their environmental aspects in continuous improvement. The adoption of ISO 14001 assures that the whole organization, including managers and employees as well as their external stakeholders, quantify and continuously improve the environmental impacts [54].
4. Discussion
As mentioned above, this paper aims at three different goals:
- a.
- To identify the impacts associated with the collection and treatment steps of the WEEE recovery process; and
- b.
- To compare environmental costs and benefits of the secondary minerals and metals from the recovery process with the mining and refinement environmental costs of primary materials.
- c.
- To identify social barriers and positive and negative social impacts associated with WEEE collection and treatment.
Table 6 reports the environmental impacts of primary Iron, Aluminum and Copper, showing that, for example, the production of primary Aluminum generates much higher implications in the GWP category (9.39 kg CO2 eq) compared to the production of primary Iron (0.13 kg CO2 eq) and Copper (2.00 kg CO2 eq). In other impact categories, the ranking is different, e.g., Freshwater Ecotoxicity, where Copper ranks first. The comparison of these impacts with those of secondary Iron, Aluminum and Copper recovered from the five WEEE categories shows clear environmental advantages for the latter ones. For example, the extraction and refining of 1 kg of primary Iron contribute to GWP by releasing 0.13 kg CO2 eq. The impacts for recovered iron achieve the highest value (0.0824 kg CO2 eq) in the R1 WEEE group, which is still lower than in primary production.
Table 6.
Impacts of 1 kg of primary Iron, Aluminum and Copper.
The GWP impacts of the WEEE recovery of Aluminum are much lower (Table 5), with the highest ranking in the R5 WEEE group (0.75 kg CO2 eq). Also, in the other impact categories (Table 5), the impacts of recovered Aluminum are much smaller than those of primary Aluminum. In a like manner, the production of primary Copper releases 2.00 kg CO2 eq., while the recovery of Copper from WEEE shows the highest impacts in R1 WEEE (1.28 kg CO2 eq), again still much lower than for primary Copper.
Regarding the input F.U. (WEEE to be treated instead of metals extracted), Table 7 shows that treating R5 WEEE provides the highest load compared to other WEEE groups in almost all the environmental categories. The LCA software allows inputting all the treatment costs (transport, electricity, machinery, chemicals, etc.) associated with the selected functional unit (e.g., 1 ton of R2 WEEE to be treated), entering as output all the recovered products and those to be landfilled. Adding the impacts of all these outputs allows us to generate the total impact associated with treating one ton of WEEE in a specific category R1, R2, etc., as shown in Table 8. The treatment of 1 tonne of R5 WEEE generates, for example, a total of 100.42 kg CO2 eq/tonne, while the contribution of the R4 group is the lowest, being negative (−23.24 kg CO2 eq/tonne), and in the others, the impacts increase from 37.48 kg CO2 eq/tonne (R3) to 76.30 kg CO2 eq/tonne (R2) and 79.37 kg CO2 eq/tonne (R3).
Table 7.
Total impacts per FU (1 tonne of collected and treated WEEE for each group).
Table 8.
Social performances and potential social impacts associated with 1 tonne of collected and treated WEEE in the management system of Campania Region in 2020.
Figure 5 shows the relative contribution to the total impacts of the R5 FU (1 tonne of R5 WEEE) in treating and recovering the materials: Aluminum, Steel and Ferrous, glass, paper, and cardboard. The recovery of glass has the highest share of the total environmental impacts compared to the other materials.
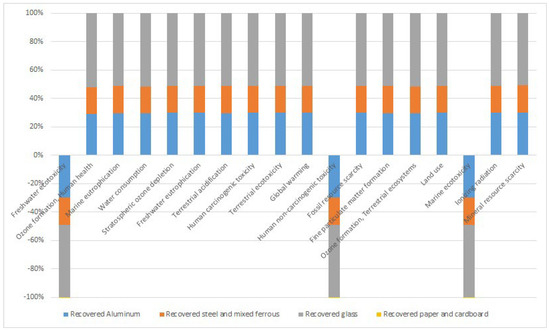
Figure 5.
The relative contribution of recovered materials in the R5 WEEE group to total impacts per FU.
Figure 6 shows that iron and copper generate more than 80% of the total impacts in the R1 WEEE category, while much lower impacts are due to gold, palladium, nickel, and silver recovery. However, the allocation was made based on economic value.
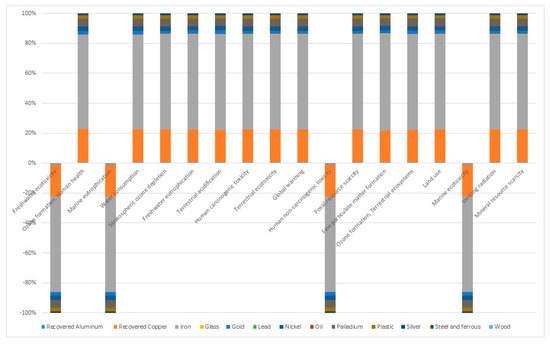
Figure 6.
The relative contribution of each recovered material in the R1 WEEE group to total impacts per FU.
Concerning the social aspects, the S-LCA procedure has assessed the potential social impacts and social performances of the organizations of Campania’s formal WEEE management system on the two stakeholders’ categories, “Local community” and “Society”. The results in Table 8 show that overall, the potential social impacts of the WEEE management system the “Society” are mainly positive as the system is committed to attaining the WEEE collection target and goals set by the EU and Italian legislation transposing the EU WEEE directive as well as has adopted a monitoring system evaluating the collection WEEE performances and the inflows and outflows of WEEE from and to the Region. The WEEE collection provides socio-economic benefits to the Region since it hires local employees in such operations contributing to the economic development of the Region. As evidenced, the treatment of WEEE is performed outside the Region for a large fraction of the WEEE collected. The Company involved in the treatment is a capital company with good economic performance and specific goals regarding recycling efficiency and environmental sustainability. The overall sector of WEEE collection and recycling in Italy involves almost 10,000 organizations, of which a large part are capital companies.
The analysis of the potential social impacts of the WEEE management system on the Local Community shows that there are some social barriers to the local collection and recycling of WEEE, e.g., the lack of educational programs continue to generate awareness and appropriate perception of benefits, lack of incentives for entrepreneurial WEEE recycling projects as well as the presence of small municipalities that do not properly perform in the collection of WEEE, leaving space to informal collection exposing local communities and environment to potential health risks. Moreover, issues related to the past waste crisis still affect the citizens and their trust in the municipalities, discouraging WEEE collection. Therefore, the initiatives by the regional authorities and municipalities to involve the local communities and citizens are very important to improve their awareness about the need for collecting WEEE. Finally, the study has helped test the S-LCA to a WEEE formal management system of the EU as well as prove further the capacity of UNEP guidelines for S-LCA [39] and Methodological Sheets [42] to capture the potential social impacts of investigated systems systematically [21].
5. Conclusions
This study aimed to assess, by adopting a joint framework involving LCA and S-LCA, the environmental and social impacts and performances of the WEEE management system of the Campania Region (Southern Italy) as a sample of the way EU Directives are applied in Italy. The collection and treatment stages have been considered in the analysis.
The results of the environmental LCA highlight that the treatment of 1 tonne of WEEE collected in the Campania Region provides the opportunity to recover several metals such as Aluminum, Iron, Steel and ferrous, Copper, Nickel, Lead, and precious metals (Gold, Silver, and Palladium). Copper and Nickel are also included in the European list of rare and strategic metals.
The recovery of 1 kg of Iron, Copper, and Aluminum, the metals recoverable in the highest amounts across the five WEEE groups, generates the highest impacts for Iron and Copper in the R1 WEEE group and R5 group for Aluminum. In any case, the environmental impacts of the recovery of these metals are much lower than the environmental impacts of the production of their corresponding primary metals from mining and refining. The analysis of the effects per FU (1 tonne of collected and treated WEEE for each one of the five groups) shows that the R5 WEEE group and R1 WEEE group generate the highest impacts on GWP, releasing 100.42 kg CO2 eq per FU and 79.37 kg CO2 eq per FU respectively. In the R5 WEEE group, the recovery of Glass provides the highest relative impacts, while in the R1 WEEE group, the recovery of Copper and Aluminum are the highest share processes.
Finally, the social benefits in terms of human health and better living environment seem worth the effort and consistent with EU goals and Directives, although much more needs to be done to support small Municipalities in their way towards better collection procedures and integration within the largest Regional and national WEEE valorization network.
Author Contributions
Conceptualization, P.G. and S.U.; methodology, P.G. and S.U.; software, P.G.; data curation, P.G.; writing—original draft preparation, P.G.; writing—review and editing, P.G., R.P. and S.U.; visualization, P.G.; supervision, S.U.; project administration, S.U.; funding acquisition, S.U. All authors have read and agreed to the published version of the manuscript.
Funding
This research was funded by the European Commission’s research programs Horizon 2020-SC5-2020-2 scheme, Grant Agreement 101003491 “JUST Transition to Circular Economy” Project (Acronym JUST2CE).
Institutional Review Board Statement
Not applicable.
Informed Consent Statement
Informed consent was obtained from all subjects involved in the study.
Data Availability Statement
The data about the annual treatment of WEEE collected in the Campania Region in the large recycling plant located in Southern Italy have been kindly provided by the Chief Operating Officer of the recycling plant. The data for the S-LCA have been collected by means of interviews with the most important stakeholders operating in the WEEE supply chain of the Campania Region. The authors greatly acknowledge all the stakeholders for providing the data for this study.
Acknowledgments
The authors would like to thank the data provided for this study: Emanuele Armentano of the Company Ri-Plastic S.p.A, Luca Fasolino of the Consortium ECOEM. Alberto Grosso, ARPAC Regione Campania, Antonello Baretta, Integrated Cycle of Water, Waste, Evaluations and Environmental Authorizations of the Regional Council of Campania Region, Luca Pucci of the Environmental Association Legambiente Campania Region, Marco Tammaro, Laboratory Technologies for the Reuse, Recycling, Recovery and Valorization of Waste and Materials of the ENEA (Italian National Agency for New Technologies, Energy and Sustainable Economic Development).
Conflicts of Interest
The authors declare no conflict of interest.
Abbreviations
| Abbreviation | Full term |
| EEE | Electrical and Electronic Equipment |
| WEEE | Waste Electrical and Electronic Equipment |
| EU | European Union |
| CE | Circular Economy |
| LCA | Life Cycle Assessment |
| MFA | Material Flow Accounting |
| S-LCA | Social Life Cycle Assessment |
| FU | Functional Unit |
| GW | Global Warming |
| PWB | Printed Wireless Board |
Appendix A
Table A1.
Inventory data for 1 tonne of R1 WEEE was collected and treated.
Table A1.
Inventory data for 1 tonne of R1 WEEE was collected and treated.
| Flow | Amount | Unit | |
|---|---|---|---|
| Input | R1 WEEE collected to be treated | 1 | Tonne |
| Transport of R1 WEEE to collection centres | 15 | Tonne*km | |
| Transport from collection centres of R1 WEEE to the processing plant | 150 | Tonne*km | |
| Electricity, medium voltage—Italy | 100 | kWh | |
| Treatment and disposal of non-recoverable capacitors | 0.20 | kg/tonne | |
| Treatment and disposal of non-recoverable waste plastic | 21.19 | kg/tonne | |
| Treatment and disposal of non-recoverable polyurethane | 166.00 | kg | |
| Output | Recovered Aluminium | 6.20 | kg/tonne |
| Recovered Copper | 13.51 | kg/tonne | |
| Recovered Iron | 611.80 | kg/tonne | |
| Recovered Lead | 0.010 | kg/tonne | |
| Recovered Nickel | 0.59 | kg/tonne | |
| Recovered Palladium | 0.0003 | kg/tonne | |
| Recovered Gold | 0.0002 | kg/tonne | |
| Recovered Silver | 0.0052 | kg/tonne | |
| Recovered Steel and Mixed Ferrous | 0.040 | kg/tonne | |
| Recovered Glass | 10.76 | kg/tonne | |
| Recovered Wood | 1.20 | kg/tonne | |
| Recovered Oil | 2.90 | kg/tonne | |
| Recovered Plastic | 160.30 | kg/tonne | |
| Components to be further treated (*) | 192.69 | kg/tonne |
(*) Miscellaneous Gases. Note: Tonne*km refers to the number of kilometers per tonne of transported WEEE.
Table A2.
Inventory data for 1 tonne of R2 WEEE collected and treated.
Table A2.
Inventory data for 1 tonne of R2 WEEE collected and treated.
| Flow | Amount | Unit | |
|---|---|---|---|
| Input | R2 WEEE collected to be treated | 1 | Tonne |
| Transport of R2 WEEE to collection centres | 15 | Tonne*km | |
| Transport from collection centres of R1 WEEE to the processing plant | 150 | Tonne*km | |
| Electricity, medium voltage—Italy | 66 | kWh | |
| Treatment and disposal of non-recoverable capacitors | 1.20 | kg/tonne | |
| Treatment and disposal of non-recoverable waste plastic | 1.50 | kg/tonne | |
| Output | Recovered Aluminium | 4.20 | kg/tonne |
| Recovered Copper | 13.10 | kg/tonne | |
| Recovered Iron | 53.90 | kg/tonne | |
| Recovered Lead | 0.044 | kg/tonne | |
| Recovered Nickel | 1.835 | kg/tonne | |
| Recovered Palladium | 0.0009 | kg/tonne | |
| Recovered Gold | 0.0005 | kg/tonne | |
| Recovered Silver | 0.0158 | kg/tonne | |
| Recovered Steel and Mixed Ferrous | 648.10 | kg/tonne | |
| Recovered Cement | 274.00 | kg/tonne | |
| Recovered Plastic | 2.10 | kg/tonne |
Note: Tonne*km refers to the number of kilometers per tonne of transported WEEE.
Table A3.
Inventory data for 1 tonne of R3 WEEE collected and treated.
Table A3.
Inventory data for 1 tonne of R3 WEEE collected and treated.
| Flow | Amount | Unit | |
|---|---|---|---|
| Input | R3 WEEE collected to be treated | 1 | Tonne |
| Transport of R3 WEEE to collection centres | 15 | Tonne*km | |
| Transport from collection centres of R1 WEEE to the processing plant | 150 | Tonne*km | |
| Electricity, medium voltage—Italy | 28.5 | kWh | |
| Treatment and disposal of non-recoverable capacitors | 1.50 | kg/tonne | |
| Treatment and disposal of non-recoverable waste plastic | 50.98 | kg/tonne | |
| Treatment and disposal of non-recoverable cone glass | 210.90 | kg/tonne | |
| Output | Recovered Aluminium | 1.28 | kg/tonne |
| Recovered Copper | 24.82 | kg/tonne | |
| Recovered Iron | 10.01 | kg/tonne | |
| Recovered Lead | 0.65 | kg/tonne | |
| Recovered Nickel | 28.51 | kg/tonne | |
| Recovered Palladium | 0.0130 | kg/tonne | |
| Recovered Gold | 0.0072 | kg/tonne | |
| Recovered Silver | 0.2353 | kg/tonne | |
| Recovered Steel and Mixed Ferrous | 80.40 | kg/tonne | |
| Recovered Wood | 4.90 | kg/tonne | |
| Recovered Glass | 373.90 | kg/tonne | |
| Recovered Plastic | 165.89 | kg/tonne | |
| Components to be further treated (*) | 309.38 | kg/tonne |
(*) Transformers, Miscellaneous Powders, Coils, Deflection Coils, Cannons. Note: Tonne*km refers to the number of kilometers per tonne of transported WEEE.
Table A4.
Inventory data for 1 tonne of R4 WEEE was collected and treated.
Table A4.
Inventory data for 1 tonne of R4 WEEE was collected and treated.
| Flow | Amount | Unit | |
|---|---|---|---|
| Input | R4 WEEE collected to be treated | 1 | Tonne |
| Transport of R4 WEEE to collection centres | 15 | Tonne*km | |
| Transport from collection centres of R1 WEEE to the processing plant | 150 | Tonne*km | |
| Electricity, medium voltage—Italy | 66 | kWh | |
| Treatment and disposal of non-recoverable capacitors | 2.2 | kg/tonne | |
| Treatment and disposal of non-recoverable waste plastic, toner and cartridges, plastic cables | 32.97 | kg/tonne | |
| Treatment and disposal of undifferentiated waste to landfill | 9.7 | kg/tonne | |
| Output | Recovered Aluminium | 37.67 | kg/tonne |
| Recovered Brass | 1.3 | ||
| Recovered Copper | 49.54 | kg/tonne | |
| Recovered Iron | 383.09 | kg/tonne | |
| Recovered Lead | 0.44 | kg/tonne | |
| Recovered Nickel | 19.06 | kg/tonne | |
| Recovered Palladium | 0.00872 | kg/tonne | |
| Recovered Gold | 0.00480 | kg/tonne | |
| Recovered Silver | 0.15731 | kg/tonne | |
| Recovered Steel and Mixed Ferrous | 1.20 | kg/tonne | |
| Recovered Wood | 8.80 | kg/tonne | |
| Recovered Glass | 0.50 | kg/tonne | |
| Recovered Plastic | 399.07 | kg/tonne | |
| Components to be further treated (*) | 99.17 | kg/tonne |
(*) Miscellaneous powder, batteries, residual mobile phones, processors and RAM, connectors, hard disks, and transformers. Note: Tonne*km refers to the number of kilometers per tonne of transported WEEE.
Table A5.
Inventory data for 1 tonne of R5 WEEE was collected and treated.
Table A5.
Inventory data for 1 tonne of R5 WEEE was collected and treated.
| Flow | Amount | Unit | |
|---|---|---|---|
| Input | R4 WEEE collected to be treated | 1 | Tonne |
| Transport of R5 WEEE to collection centres | 15 | Tonne*km | |
| Transport from collection centres of R5 WEEE to the processing plant | 150 | Tonne*km | |
| Electricity, medium voltage—Italy | 96 | kWh | |
| Treatment and disposal of undifferentiated waste to landfill | 15 | kg/tonne | |
| Output | Recovered Aluminium | 40.00 | kg/tonne |
| Recovered Steel and Mixed Ferrous | 50.00 | kg/tonne | |
| Recovered Glass | 800.00 | kg/tonne | |
| Recovered Paper and cardboard | 15.00 | kg/tonne | |
| Components to be further treated (*) | 95.00 | kg/tonne |
(*) Phosphoric powder. Note: Tonne*km refers to the number of kilometers per tonne of transported WEEE.
Appendix B
Table A6.
Set of indicators used to assess the social performances of the WEEE management system in collection and treatment stages concerning the stakeholders’ category “Local Community”.
Table A6.
Set of indicators used to assess the social performances of the WEEE management system in collection and treatment stages concerning the stakeholders’ category “Local Community”.
| Subcategory | Social Indicators | Unit of Measure (*) | Results |
|---|---|---|---|
| Access to Immaterial Resources |
|
|
|
|
|
| |
|
|
3.
| |
| Access to Material Resources |
|
|
|
|
|
| |
|
|
| |
| Safe and Healthy Living Conditions |
|
|
|
|
|
| |
|
|
| |
| Community Engagement |
|
|
|
|
|
| |
|
|
| |
|
|
| |
| Local Employment |
|
|
|
|
|
| |
|
|
|
Notes: Social Indicators have been included taking into account the UNEP/SETAC 2021, Methodological sheets for subcategories in social life cycle assessment (S-LCA) 2021 [42]. (*) Unit of measure of social indicators: yes (presence of social aspects); Not (no evidence of social aspects).
Table A7.
Set of Indicators used to assess the social performances of the WEEE management system in the collection and treatment stage on the stakeholder category “Society”.
Table A7.
Set of Indicators used to assess the social performances of the WEEE management system in the collection and treatment stage on the stakeholder category “Society”.
| Society Subcategories | Social Indicators | Unit of Measure (*) | Results Current Status |
|---|---|---|---|
| Public commitment to sustainability issues |
|
| 1.
|
|
|
| |
|
|
| |
|
|
| |
|
|
| |
| Contribution to economic development |
|
|
|
|
|
| |
|
|
| |
| Technology development |
|
|
|
|
|
| |
|
|
|
Notes: Social Indicators have been included taking into account the UNEP/SETAC 2021, Methodological sheets for subcategories in social life cycle assessment (S-LCA) 2021 [42]. (*) Unit of measure of social indicators: yes (presence of social aspects); Not (no evidence of social aspects).
References
- Prabhu, S.M.; Majhi, R. Disposal of obsolete mobile phones: A review on replacement, disposal methods, in-use lifespan, reuse and recycling. Waste Manag. Res. 2023, 41, 18–36. [Google Scholar] [CrossRef] [PubMed]
- Abalansa, S.; El Mahrad, B.; Icely, J.; Newton, A. Electronic Waste, an Environmental Problem Exported Developing Countries: The GOOD, the BAD and the UGLY. Sustainability 2021, 13, 5302. [Google Scholar] [CrossRef]
- Moyen Massa, G.; Archodoulaki, V.-M. Electrical and ElectronicWaste Management Problems in Africa: Deficits and Solution Approach. Environments 2023, 10, 44. [Google Scholar] [CrossRef]
- Krook, J.; Baas, L. Getting serious about mining the technosphere: A review of recent landfill mining and urban mining research. J. Clean. Prod. 2013, 55, 1–9. [Google Scholar] [CrossRef]
- Zhang, S.; Ding, Y.; Liu, B.; Chang, C.-C. Supply and demand of some critical metals and present status of their recycling in WEEE. Waste Manag. 2017, 65, 113–127. [Google Scholar] [CrossRef] [PubMed]
- Cossu, R.; Williams, I.D. Urban mining: Concepts, terminology, challenges. Waste Manag. 2015, 45, 1–3. [Google Scholar] [CrossRef]
- Graedel, T.E. The prospects for urban mining. The Bridge: Linking engineering and society. Urban Sustainability. Bridge 2011, 41, 43–50. [Google Scholar]
- Ghisellini, P.; Ncube, A.; Casazza, M.; Passaro, R. Toward circular and socially just urban mining in global societies and cities: Present state and future perspectives. Front. Sustain. Cities 2022, 4, 930061. [Google Scholar] [CrossRef]
- Ghisellini, P.; Ulgiati, S. Circular economy transition in Italy. Achievements, perspectives and constraints. J. Clean. Prod. 2019, 243, 118360. [Google Scholar] [CrossRef]
- Heckens, T. Scarce mineral resources: Extraction, consumption and limits of sustainability. Reource Conserv. Recycl. 2021, 169, 105511. [Google Scholar] [CrossRef]
- European Commission. 2023. Available online: https://eur-lex.europa.eu/legal-ontent/EN/TXT/?uri=CELEX%3A52023PC0160 (accessed on 7 May 2023).
- Directive 2002/96/EC of the European Parliament and of the Council of 27 January 2003 on Waste Electrical and Electronic Equipment (WEEE). Available online: https://eur-lex.europa.eu/resource.html?uri=cellar:ac89e64f-a4a5-4c13-8d96-1fd1d6bcaa49.0004.02/DOC_1&format=PDF (accessed on 7 May 2023).
- Directive 2012/19/EC of the European Parliament and of the Council of 4 July 2012 on Waste Electrical and Electronic Equipment (WEEE) (recast) Text with EEA Relevance. Available online: https://eur-lex.europa.eu/legal-content/EN/TXT/?uri=celex%3A32012L0019 (accessed on 8 May 2023).
- Compagnoni, M. Is Extended Producer Responsibility living up to expectations? A systematic literature review focusing on electronic waste. J. Clean. Prod. 2022, 367, 133101. [Google Scholar] [CrossRef]
- Cucchiella, F.; D’Adamo, I.; Lenny Koh, S.C.; Rosa, P. Recycling of WEEEs: An economic assessment of present and future e-waste streams. Renew. Sustain. Energy Rev. 2015, 51, 263–272. [Google Scholar] [CrossRef]
- Cole, C.; Gnanapragasam, A.; Cooper, T.; Singh, J. An assessment of achievements of the WEEE Directive in promoting movement up the waste hierarchy: Experiences in the UK. Waste Manag. 2019, 87, 417–427. [Google Scholar] [CrossRef] [PubMed]
- World Economic Forum. Available online: https://www.weforum.org/agenda/2019/11/build-circular-economy-stop-recycling/ (accessed on 4 May 2023).
- Habib, H.; Wagner, M.; Baldè, C.P.; Martinez, L.H.; Huisman, J.; Dewulf, J. What gets measured gets managed–does it? Uncovering the waste electrical and electronic equipment flows in the European Union. Resour. Conserv. Recycl. 2022, 181, 106222. [Google Scholar] [CrossRef]
- Salhofer, S.; Steuer, B.; Ramusch, R.; Beigl, P. WEEE management in Europe and China–A comparison. Waste Manag. 2016, 57, 27–35. [Google Scholar] [CrossRef]
- ISO 45001. Available online: https://www.iso.org/standard/63787.html (accessed on 29 April 2023).
- Umair, S.; Björklund, A.; Ekener Petersen, E. Social impact assessment of informal recycling of electronic ICT waste in Pakistan using UNEP SETAC guidelines. Res. Conserv. Recycl. 2015, 95, 46–57. [Google Scholar] [CrossRef]
- Petti, L.; Serreli, M.; Di Cesare, S. Systematic literature review in social life cycle assessment. Int. J. Life Cycle Assess. 2018, 23, 422–431. [Google Scholar] [CrossRef]
- Biganzoli, L.; Falbo, A.; Forte, F.; Grosso, M.; Rigamonti, L. Mass balance and life cycle assessment of the waste electrical and electronic equipment management system implemented in Lombardia Region (Italy). Sci. Total Environ. 2015, 524–525, 361–375. [Google Scholar] [CrossRef]
- Fiore, S.; Ibanescu, D.; Teodosiu, C.; Ronco, A. Improving waste electric and electronic equipment management at full-scale by using material flow analysis and life cycle assessment. Sci. Total Environ. 2019, 659, 928–939. [Google Scholar] [CrossRef]
- Abeliotis, K.; Chroni, C.; Lasaridi, K. Social Life Cycle Assessment for WEEE Reuse. In XI Convegno della Rete Italiana LCA Resource Efficiency e Sustainable Development Goals: Il Ruolo del Life Cycle Thinking 2017. Available online: http://uest.ntua.gr/athens2017/proceedings/pdfs/Athens2017_Abeliotis_Chroni_Lasaridi.pdf (accessed on 18 June 2023).
- Lu, B.; Wang, L.; Yang, J.; Liu, J.; Wang, X.V. Reusability based on Life Cycle Sustainability Assessment: Case study on WEEE. Procedia CIRP 2014, 15, 473–478. [Google Scholar] [CrossRef]
- WEEE Coordination Centre. Available online: https://www.raeeitalia.it/en/report/ (accessed on 7 May 2023).
- European Life Cycle Assessment Platform. Available online: https://ec.europa.eu/environment/ipp/lca.htm (accessed on 27 April 2023).
- Colimoro, M.; Ripa, M.; Santagata, R.; Ulgiati, S. Environmental Impacts and Benefits of Tofu Production from Organic and Conventional Soybean Cropping: Improvement Potential from Renewable Energy Use and Circular Economy Patterns. Environments 2023, 10, 73. [Google Scholar] [CrossRef]
- Ingrao, C.; Vesce, E.; Evola, R.S.; Rebba, E.; Arcidiacono, C.; Martra, G.; Beltramo, R. Chemistry behind leather: Life Cycle Assessment of nanohydroxyapatite preparation on the lab-scale for fireproofing applications. J. Clean. Prod. 2021, 279, 123837. [Google Scholar] [CrossRef]
- Tagne, R.F.T.; Santagata, R.; Tchuifon, D.R.T.; Atangana, A.K.; Ateba, F.R.; Vintila, T.; Ndifor-Angwagor, N.C.; Anagho, S.G.; Ulgiati, S. Environmental impact of second-generation biofuels production from agricultural residues in Cameroon: A life-cycle assessment study. J. Clean. Prod. 2023, 378, 134630. [Google Scholar] [CrossRef]
- Campania Region. Proposal of Updating the Regional Plan for the Management of Special Waste. Available online: http://regione.campania.it/assets/documents/01-proposta-di-aggiornamento-prgrs.pdf (accessed on 18 June 2023).
- Favot, M.; Massarutto, A. Rare-earth elements in the circular economy: The case of yttrium. J. Environ. Manag. 2019, 240, 504–510. [Google Scholar] [CrossRef] [PubMed]
- Borsino dei Rifuti. Available online: https://www.borsinorifiuti.com/2020/prezzirifiuti.php (accessed on 5 May 2023).
- Ri-Plastic Company. Available online: https://www.riplastic.net/ (accessed on 7 May 2023).
- Ecoinvent 3.1 Database. Available online: https://ecoinvent.org/the-ecoinvent-database/data-releases/ecoinvent-3-1/ (accessed on 5 May 2023).
- Huijbregts, M.A.J.; Steinmann, Z.J.N.; Elshout, P.M.F.; Stam, G.; Verones, F.; Vieira, M.; Zijp, M.; Hollander, A.; van Zelm, R. ReCiPe 2016: A harmonised life cycle impact assessment method at midpoint and endpoint level. Int. J. Life Cycle Assess. 2017, 22, 138–147. [Google Scholar] [CrossRef]
- OpenLCA Software. Available online: openLCA_win64_1.11.0_2022-02-09.zip (accessed on 7 May 2023).
- UNEP/SETAC. Guidelines for Social Life Cycle Assessment of Products and Organizations 2020. Available online: https://www.lifecycleinitiative.org/library/guidelines-for-social-life-cycle-assessment-of-products-and-organisations-2020/ (accessed on 4 May 2023).
- Luthin, A.; Traverso, M.; Crawford, R.H. Assessing the social life cycle impacts of circular economy. J. Clean. Prod. 2023, 386, 135725. [Google Scholar] [CrossRef]
- Toniolo, S.; Tosato, R.C.; Gambaro, F.; Ren, J. Life cycle thinking tools: Life cycle assessment, life cycle costing and social life cycle assessment. In Life Cycle Sustainability Assessment for Decision-Making; Ren, J., Toniolo, S., Eds.; Elsevier Inc.: Amsterdam, The Netherlands, 2020; pp. 39–56. [Google Scholar]
- UNEP. Methodological Sheets for Subcategories in Social Life Cycle Assessment (S-LCA) 2021; Traverso, M., Valdivia, S., Luthin, A., Roche, L., Arcese, G., Neugebauer, S., Petti, L., D’Eusanio, M., Tragnone, B.M., Mankaa, R., Eds.; United Nations Environment Programme (UNEP): Nairobi, Kenya, 2021. [Google Scholar]
- D’Eusanio, M.; Serreli, M.; Petti, L. Social Life-Cycle Assessment of a Piece of Jewellery. Emphasis on the Local Community. Resources 2019, 8, 158. [Google Scholar] [CrossRef]
- Bruno, G.; Diglio, A.; Passaro, R.; Piccolo, C.; Quinto, I. Measuring spatial access to the recovery networks for WEEE: An in-depth analysis of the Italian case. Intern. J. Prod. Econ. 2021, 240, 108210. [Google Scholar] [CrossRef]
- JUST2CE Project. Available online: https://just2ce.eu/ (accessed on 5 May 2023).
- Franze, J.; Ciroth, A. A comparison of cut roses from Ecuador and the Netherlands. Int. J. Life Cycle Assess. 2011, 16, 366–379. [Google Scholar] [CrossRef]
- D’Alisa, G.; Burgalassi, D.; Healy, H.; Walter, M. Conflict in Campania: Waste emergency or crisis of democracy. Ecol. Econ. 2010, 70, 239–249. [Google Scholar] [CrossRef]
- Falcone, P.M.; D’Alisa, G.; Germani, A.M.; Morone, P.G. When all seemed lost. A social network analysis of the waste-related environmental movement in Campania, Italy. Political Geogr. 2020, 77, 102114. [Google Scholar] [CrossRef]
- RAEE School Project (In Italian). Available online: https://anci.lombardia.it/documenti/4953-Attivit%C3%83%C2%A0%20Progetto_RAEE@scuola4%20_.pdf (accessed on 5 May 2023).
- Inno-WEEE Project. Available online: http://www.innoweee.eu/en/partners?uniq=1c54ca3824bc928988549771e14be7c50 (accessed on 5 May 2023).
- Ghisellini, P.; Santagata, R.; Zucaro, A.; Ulgiati, S. Circular patterns of waste prevention and recovery. E3S Web Conf. 2019, 119, 18. [Google Scholar] [CrossRef]
- Regional Plan for the Management of Special Waste of Campania Region. Available online: http://www.regione.campania.it/regione/it/tematiche/piano-regionale-di-gestione-dei-rifiuti-speciali/piano-regionale-di-gestione-dei-rifiuti-speciali-2022?page=1 (accessed on 7 May 2023).
- ARPAC. Regional Agency for the Protection of the Environment. Available online: https://www.arpacampania.it/ (accessed on 7 May 2023).
- ISO 14001. Available online: https://www.iso.org/iso-14001-environmental-management.html (accessed on 5 May 2023).
Disclaimer/Publisher’s Note: The statements, opinions and data contained in all publications are solely those of the individual author(s) and contributor(s) and not of MDPI and/or the editor(s). MDPI and/or the editor(s) disclaim responsibility for any injury to people or property resulting from any ideas, methods, instructions or products referred to in the content. |
© 2023 by the authors. Licensee MDPI, Basel, Switzerland. This article is an open access article distributed under the terms and conditions of the Creative Commons Attribution (CC BY) license (https://creativecommons.org/licenses/by/4.0/).