Article

Assessment of Nutrient Removal in Surface Flow Constructed Wetland Treating Secondary Effluent with Low Organic, Nitrogen and Phosphorus Loads

1
School of Engineering and Built Environment, Griffith University, Nathan, QLD 4111, Australia
2
Water Service Performance, Logan Water, Logan City Council, Logan Central, QLD 4114, Australia
*
Author to whom correspondence should be addressed.
Environments 2023, 10(5), 89; https://doi.org/10.3390/environments10050089
Submission received: 19 April 2023 / Revised: 19 May 2023 / Accepted: 19 May 2023 / Published: 22 May 2023

Abstract

:
Nutrient loads must be reduced to safe levels to protect sensitive receiving environments. This work presents the results of a 15-month monitoring program of a surface flow-constructed wetland (SFCW) in Queensland, Australia. The SFCW reduced the influent TN concentration by 54% and was able to retain 80% of the TN load, mainly due to the efficient removal of NOx and ammonium (92–100%). TP removal was negative due to the unaccounted loads from wildlife activity. During occasions of high loads, the wetland reduced TP concentrations by 77%. The hydraulic loading rate (HLR) correlated poorly to the TSS and TVS loads (r < 0.55); however, when adjusted to account for precipitation and evapotranspiration, stronger correlations (r > 0.78) were revealed. Strong correlations were revealed between adjusted HLR and TP (r = 0.87) and TN (r = 0.93). TN removal was highly governed by the inflow of TN concentration. TN removal could be predicted from the inflow concentration using the first-order plug-flow model (R2 = 0.72). The model suggests that the system has an irreducible threshold TN load of 0.115 kg-N per m2 per month. This work shows that SFCW can be effective in managing the nutrient loads even in systems that receive low organic and nutrient loads.

Graphical Abstract

1. Introduction

The use of constructed wetlands as a polishing stage for wastewater treatment has grown in popularity. Constructed wetlands have been commissioned in different climatic regions of the world and with demonstrated success in improving the quality of the water discharge. The performance of a constructed wetland depends on many factors including, its configuration, climate, the quality of the received water, loading, and retention time, among other factors [1]. Long-term monitoring of the performance of constructed wetlands is important to ensure that the discharge meets the water quality standards and to identify any issues at an early stage and address them to protect the receiving environment. Data collected from monitoring programs can be used to optimize the operational parameters, such as the hydraulic loading rate and the retention time to enhance the performance of the wetland. Furthermore, monitoring data can be used to build empirical models to predict key water quality parameters in the discharge, to adjust the operational conditions to maintain the water quality, and to avoid unsafe discharges or breaches of operation license conditions.
Lavrnić, Nan [2] assessed the performance of a surface flow constructed wetland (SFCW), which has been operating for 20 years in northern Italy. They reported that this wetland reduced the total suspended solids by 82% and total nitrogen by 78%, but the total phosphorus removal was negative (−27%). They attributed the negative removal rate of phosphorus to the phosphorus loads received with the precipitation.
Rizzo, Bresciani [3] reported on a long-term monitoring program of a hybrid-constructed wetland consisting of a French Reed bed, horizontal subsurface unit, free flow unit, and sand filter, treating winery wastewater. The wetland was successful in treating the wastewater to limits acceptable for discharge, reducing the COD by 97%, NOx by 45%, and TP by 42% [3]. After analyzing the data from more than 4 years of the monitoring program of SFCW in Germany, Steidl, Kalettka [4] reported that the nitrogen retention was less than 5% in most cases, and in some cases, the effluent load was higher than influent load. They concluded that for nitrogen removal, the temperature must be higher than 8 °C, and the retention time must be more than 20 days. Ulén, Geranmayeh [5] reported average retention of 56% of TN and 35% of NO3- in Swedish-constructed wetlands receiving agricultural discharges. Furthermore, they reported that NO3- removal was positively correlated with the temperature and residence time. In planted wetlands, a negative correlation was reported between the carbon-to-nitrogen ratio and the removal rate of organic nitrogen and ammonia, whereas the opposite was observed for the removal of nitrate [6]. Mendes, Tonderski [7] concluded that phosphorus retention in free-flow constructed wetlands depended on the form of phosphorus with higher removal efficiency for particulate forms of phosphorus. They further reported that the removal efficiency correlated to the phosphorus load in the inflow but was less affected by the hydraulic loading. On average, the phosphorus removal rate was in the range of from 24 to 66% [5,7].
Nitrogen removal in constructed wetlands is affected by different processes such as ammonification, nitrification, denitrification, adsorption, biomass assimilation, etc. Ammonification is the process of converting the organic nitrogen into ammonia. It can occur in aerobic and anoxic conditions but is more active in oxygen-rich zones. The process is affected by the C:N ratio, pH, and temperature, with optimal temperatures being in the range between 40 and 60 °C [8]. The nitrification process converts ammonia to nitrate that occurs under aerobic conditions. Denitrification is an anoxic process, which converts the nitrate to nitrogen gas. Denitrification consumes large amounts of COD [9].
Previous studies focused on the performance of constructed wetlands receiving substantial organic and nutrient loads in the influent. However, the implementation of new wastewater treatment technologies, such as membrane biofilter (MBR), as secondary treatment has resulted in high-quality effluents with low organic and nutrient loads. At the same time, wastewater treatment plants are faced with more stringent regulations on the nitrogen and phosphorus concentrations of the final discharge. The aim of this study was to evaluate the effectiveness of surface flow constructed wetlands in reducing the nutrient loads even when receiving low nutrient and organic loads. The work uses the Cedar Grove constructed wetland as a case study. The results of this study are useful for engineers and decision makers, as it provides evidence on the role of constructed wetlands as a final polishing stage to manage nutrient release post-advanced secondary treatment.

2. Methods

2.1. Case Study: Cedar Grove Constructed Wetlands

Cedar Grove Constructed wetland is located in the Cedar Grove Environmental Centre in the City of Logan, Queensland (27.845 S, 152.963 E). It was commissioned in July 2020 as a tertiary treatment and polishing phase before the release of the treated wastewater into the Albert/Logan River. It receives unchlorinated secondary treated wastewater from the Cedar Grove wastewater treatment plant, which operates an MBR. The constructed wetland is operated by Logan Water, a division of Logan City. The wetland consists of three parallel muti-stage treatment trains, as shown in Figure 1. The wetland covers a total area of 7.27 ha in a free-flow surface water configuration. Each cell consists of a 300 mm grow medium (gravel + sand) layer on top of a compacted clay liner (450 mm) made of locally obtained material. The constructed wetland was densely planted with Eleocharis dulcis, Schoenoplectus validus, Baumea articulata, and Bolboschoenus caldwellii [10]. Biomass harvesting is not practiced. The design water depth ranges from 100 mm at the inlet and 240 mm at the outlet. It is designed for the treatment of wastewater with an average flow of 3.3 × 10 3 m3/day and an average hydraulic loading rate of 28.8 × 10 3 m3·m−2·day−1. Figure 2 shows the daily precipitation and average monthly temperature for the study site; data are retrieved from the nearest weather station at Beaudesert Drumley Street [11].

2.2. Sampling and Chemical Analysis of Water Quality Parameters

Weekly samples were collected from the inlet, outlet of each cell, and the combined effluent between November 2020 and February 2022. Occasionally, sampling cycles were interrupted due to COVID-19 restrictions and shutdowns. Collected samples were stored in a cooled container (4 °C) and delivered to the laboratory for chemical analysis within 2 h. DO, pH, and temperature were measured in the field. All other parameters were analyzed in a laboratory accredited by the National Association of Testing Authorities, Australia (NATA), following approved and accredited methods as summarized in Table 1.

2.3. Above-Ground Biomass

Nine quadrat, each measuring 500 by 500 mm, were installed in the wetland. The above-ground biomass was harvested in March 2021. The biomass was harvested again after 12 weeks of growth, and the nitrogen and phosphorus content in the above-ground biomass was analyzed. In brief, after harvesting, the biomass was transported to the laboratory within 2 h. Biomass was washed to remove any impurities and then chopped into coarse size before being placed in the oven at 70 °C for drying. It was left in the oven until constant weight was achieved. To determine the TN content, triplicate samples were sent for elemental analysis. To determine TP content, triplicate samples (2 g each) were placed in crucibles and combusted at 750 °C for 1 h. The remaining ash was leached with nitric acid, and the P concentration was determined following the APHA4500PF standard method.

2.4. Data Preparation and Treatment

Reports received from the laboratory were inspected for potential anomalies before transfer to an Excel database for storage and further analysis. In the case of anomalous data, the laboratory was contacted to confirm the results, and if needed and where possible, the samples were re-tested. To derive more representative values of the effluent, the average value of the effluent from the three exit sub-cells and the combined effluent was calculated for each parameter and used in the analysis. In cases where the concentration was below the detection limit of the analysis method, a value between 0 and the lower detection limit was generated using a random value generator and used in the data analysis.

2.5. Hydraulic Loading Rate, Retention Time, and Pollutant Loading

The Hydraulic loading rate (HLR) was calculated from the inflow data acquired from the operation records of the wastewater treatment plant at Cedar Grove. The HLR (mm/m2·day) was calculated by dividing inflow (Qin) by the Surface Area (A). Furthermore, adjusted HLR (Adj. HLR) was calculated taking into account the precipitation (ppt) and evapotranspiration (evapo) effect as (Qin + ppt-evapo)/A. The approximate retention time (HRT) was calculated based on the water balance, assuming that infiltration is negligible because the wetland is lined with a clay layer.
V i   =   Q i n i     Q o u t i   +   ( p p t i     e v a p o i )   ×   A i
V i :   v o l u m e   r e t a i n e d   o n   d a y   i   m 3
Q i n i ,   Q o u t i :   i n f l o w   a n d   o u t f l o w   o n   d a y   i   m 3 d a y ,   r e s p e c t i v e l y
p p t i ,   e v a p o i :   p r e c i p i t a t i o n   a n d   e v a p o t r a n s p i r a t i o n   o n   d a y   i   m ,   r e s p e c t i v e l y
A i :   s u r f a c e   a r e a   o n   d a y   i   ( m 2 )
Finally, the approximate HRT on day n was calculated as follows:
H R T n   =   0 n V n Q o u t n
Qoutn is the effluent discharge on day n.
Climatic records were downloaded from the nearest weather station at Beaudesert Drumley Street [11].

2.6. Data Analysis

The data analysis was performed in MS™ Excel® The data distribution for each parameter was plotted to gain an overall impression of the trends. General data descriptions for each parameter were calculated to have an overview of the data. Data descriptors included mean, standard deviation, and median. Data grouping via monthly averaging was also performed to reduce the effects of noise in the data and reveal the underlying correlations among the different parameters. Pollutant loads in the inflow and effluent were calculated by multiplying the concentrations by the daily flows.
Furthermore, a correlation matrix among the parameters was constructed to explore any potential correlations or co-linearity in the data. Pearson’s coefficient of correlation (r) was calculated as follows:
r = n x y x y n x 2 ( x ) 2 n y 2 ( y ) 2
One-way ANOVA was used to test the significance of the differences among the three trains as well as the sub-cells within each train. T-tests were also used to compare the water quality before and after treatment. All statistical tests were performed using a significance level α = 0.05.

2.7. Modelling of Nitrogen Removal

The constructed wetland system is often designed and modeled as a plug flow reactor with first-order decay [12]:
C f = C 0 C e k H L R + C
where Cf is the expected concentration at the effluent, C0 is the initial concentration or load, k is the first-order decay constant, HLR is the hydraulic loading rate, and C* is the irreducible background concentration or load. The removal rate (Re) can be calculated as follows:
R e = ( C 0 C f ) C 0 × 100 %
Non-linear regression was used to fit the observed data to the empirical models. Data linearization was also exercised in cases where correlations were not linear. To determine the fitness of the model to the observed data, the coefficient of determination (R2) and the root mean squared error (RMSE) were calculated.
R 2 = V a r ( y ^ ) V a r ( y )
R M S E = ( y ^ y ) 2 n
y ^ is the predicted value, y is the observed value and n is the number of observations and Var is the variance, which is defined as follows:
V a r = ( X X ) 2 n
X is the observed value and X is the mean value.

3. Results and Discussion

3.1. Overall Water Quality

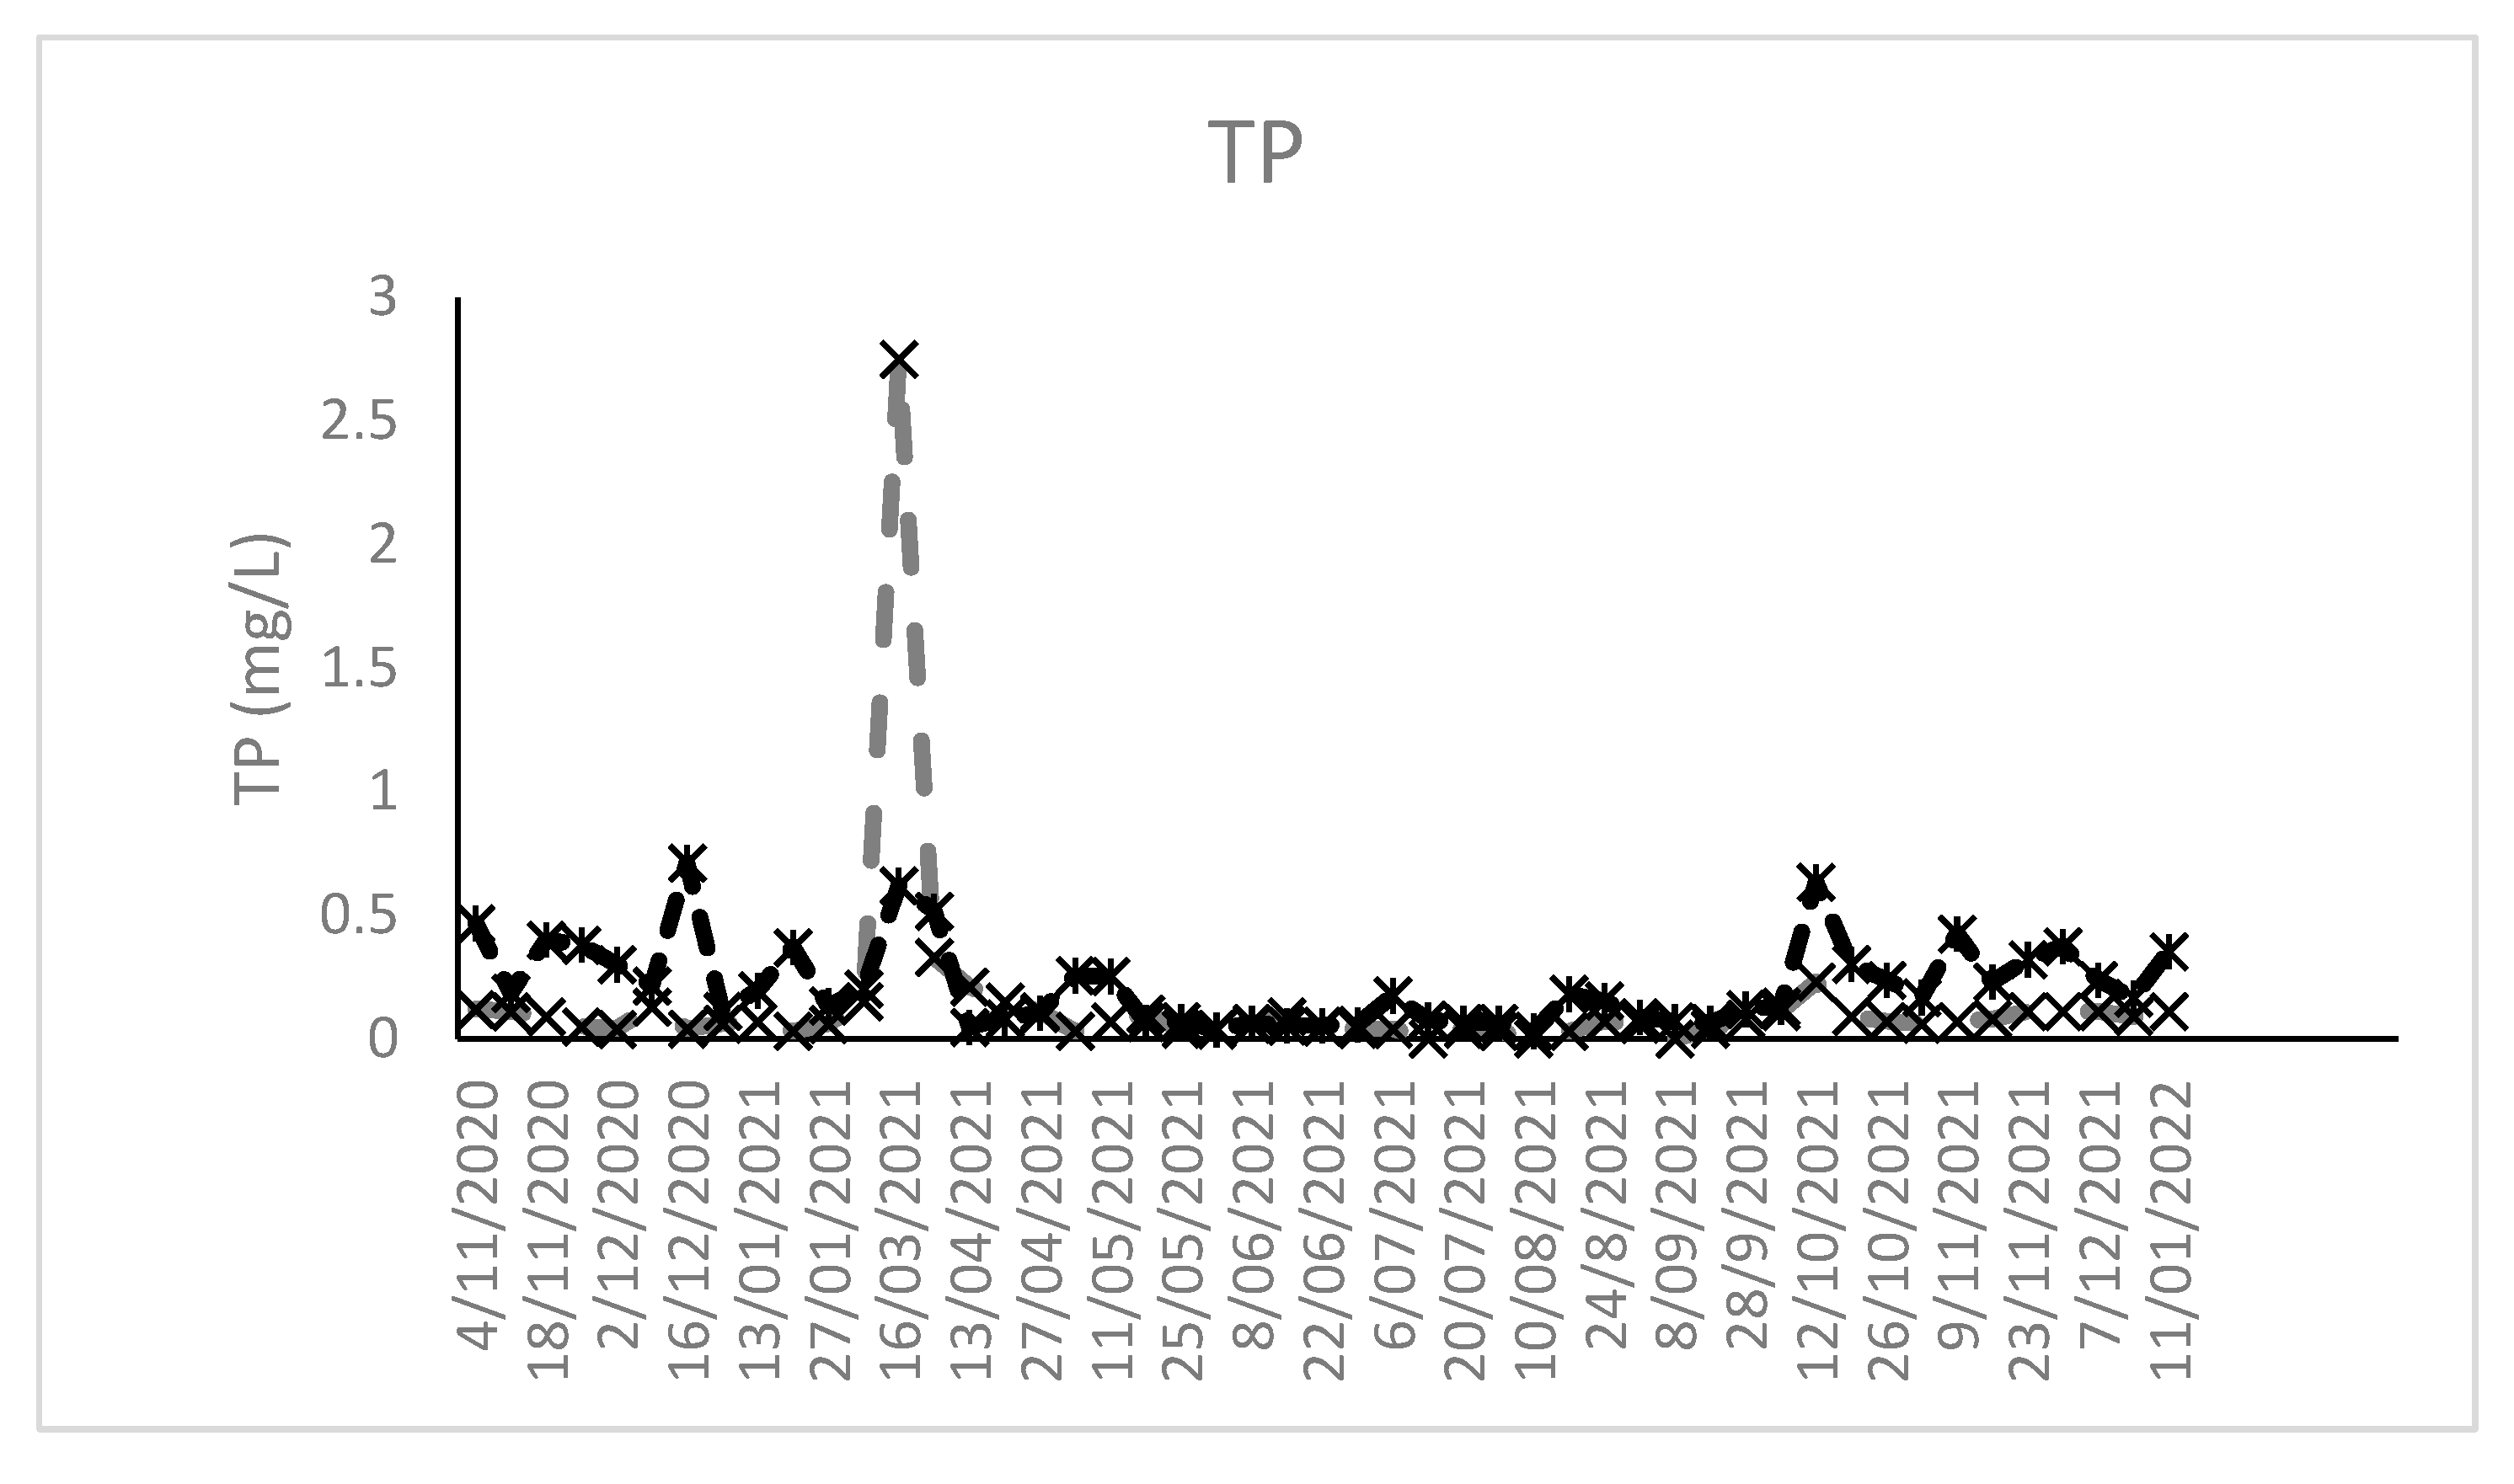
Table 2 shows the summary statistics of the monitored parameters over the study period. The data suggest that the wetland receives high-quality treated wastewater from the MBR process. There is no evidence of significant differences between the mean values of inflow and effluent water parameters, p = 0.188. Nevertheless, there is strong evidence that the constructed wetland reduced the total nitrogen concentration (p < 0.001), particularly the oxidized forms of nitrogen (NOx, p < 0.001) and ammonium. The ammonium concentration in the effluent was well below any trigger concentration (<1.88 mg/L at pH 7.3) [13]. The data suggest a slight increase in total phosphorus and ortho-phosphate concentrations, although the increase was not statistically significant (p = 0.264). The spike in TP concentration usually followed wet weather conditions, as shown in Figure 3, thus suggesting that pre-deposited phosphorus was flushed. Such behavior has been reported in the literature and is referred to as the re-setting mechanism [14]. The constructed wetland system showed good evidence of handling surges of TP load, as shown from the 16/03/2021 event, where the system reduced the TP concentration by 77.5% from 2.75 to 0.62 mg-P/L.
The discharged water has neutral pH, although it was slightly higher than the influent. The EC and TDS fall within the expected range of freshwater albeit, on the higher end, and there was no evidence of significant differences between the influent and effluent values (p = 0.131 and 0.126, respectively). Total suspended and volatile solids at the outlet were significantly higher than the influent concentrations (p < 0.001). This can be explained by the background concentration of the constructed wetland [15]. The MBR effluent had a very low concentration of solids, which is likely lower than the carrying capacity of the flow; therefore, when the water flows through the wetland, it is likely to suspend sediments and carry organic debris (fallen plant material) until it reaches the carrying capacity. This is more evident following major rain events where the dynamic energy in the system is increased due to the impact of raindrops and increased flow rate. Furthermore, surface algae were noticed occasionally, mainly during summer months, but mostly in cells A and B and rarely in cell C (exit cells). However, Azolla and duckweed were observed in the outlet zones of the cells. Although, water samples were collected at least 50 mm below the surface, it is possible some of the suspended plant and algae material was added to the suspended solid load. There was an agreement between the spike in TVS and TSS, which also corresponded to rain events. On average, TVS made up 38% of the TSS in the effluent. Figure 3 also shows that spikes in TP concentrations correspond to spikes in TSS, which indicates that, at least some of the phosphate is bonded to the suspended solids.

3.2. Pollutant Loads Analysis

Average monthly pollutant loads (kg/day) were calculated as the product of the average monthly concentration and the average flow rate (Qin) for each month. Similarly, the average pollutant exiting the wetland as the monthly average concentration is multiplied by the average monthly effluent (Qout). The average monthly loads are presented in Table 3. The loads show a general increasing trend over time due to the increased flows received by the treatment plant.
Table 4 shows the correlations between the different water quality parameters based on the average monthly loads in the influent and effluent. The matrix revealed that there is a strong correlation between the TN and TP load in the influent, suggesting that they are likely of the same origin. One likely cause is the presence of urine in the discharge. This hypothesis is further supported by the fact that most of the nitrogen in the influent is in the form of nitrate and ammonium, and the phosphate is in ortho-phosphate form. Strong correlations are also observed between the TP and TN in the influent and the TN, TP, TSS, and TVS loads in the effluent. The correlation is stronger between the influent TP load and the TSS and TVS loads in the effluent than that with the TN. This is likely because TP is mainly in soluble form, which can be absorbed by the suspended solids. TN and TP in the effluent had weak to moderate correlations with pH, Temperature, TDS, and DO loads in the influent. Kotti, Gikas [16] reported positive correlations between nutrient removal and temperature. Zhu, Zhou [17] found that temperature particularly influenced the TP, nitrate, and ammonium removal. They further reported that the wetlands performed best when the temperatures were above 19.8 °C. Low temperatures affect the microbial stability and complexity, which, in turn, reduce the removal efficiency of nutrients [18]. However, as mentioned earlier, Steidl, Kalettka [4] concluded that TN removal will occur when the temperatures are above 8 °C and the HRT is around 20 days. In our case, the retention time and temperatures remained sufficiently high to facilitate nitrogen removal.
Dissolved oxygen levels influence the nitrification process. Higher DO levels enhance the nitrification, anoxic conditions facilitate denitrification, thus resulting in higher TN removal [19]. This can explain the observed results in our case, where most of the NOx and ammonium were removed in the first cell of each treatment train. Higher DO levels in the influent facilitate the nitrification of ammonium; however, as the water is held in the wetland, anoxic conditions are encountered, leading to denitrification. This hypothesis is supported by the fact that the DO levels at the inlet were always higher than the outlet of the first cell. Enhanced DO levels can also improve phosphorus removal by manipulating redox potential, which can affect the adsorption and precipitation of phosphorus [20].
A strong correlation between HLR and TN load in the effluent was observed, but the correlation with TP load was moderate. HLR correlated weakly to TSS and TVS loads in the effluent. However, when adjusting the HLR to account for precipitation and evapotranspiration (Adj._HLR), strong correlations are revealed with all four parameters. Therefore, it is important to consider the climatic factors in the calculations of HLR.

3.3. Nutrient Removal

3.3.1. TN Removal

The average TN concentration in the influent was around 1.97 mg-N/L, although this fluctuated considerably (standard deviation = 1.09). The highest TN concentration in the influent was 7.2 mg-N/L. On average, organic nitrogen constituted around 34% of the TN in the influent. The average TN in the effluent was 0.83 mg-N/L, of which 96% is organic nitrogen. The constructed wetland showed a good removal capacity of total nitrogen; based on the inlet-outlet concentrations, on average, the TN concentration reduction was 54%. This is mainly due to the high efficiency of removing oxidized forms of nitrogen and ammonium (from 92 to 100%). The observed NOx and ammonium removal rates were higher than commonly reported in the literature, e.g., [2,4]. Nevertheless, Beutel, Newton [21] reported a nitrate concentration reduction of 94% in a constructed wetland treating diluted agricultural runoff. The carbon-to-nitrogen ratio (C:N) is an important factor affecting TN removal. Li, Liu [22] reported that maximum nitrogen removal can be achieved at a 5:1 C:N ratio. Although the organic load was low (average BOD < 5 mg/L), plant biomass provides the needed carbon to maintain the C:N ratio required for the nitrogen removal [23]. The high NOx and NH4 removal efficiency is attributed to the low nitrogen loading rate coupled with favorable temperatures and retention time as well as plant uptake. Figure 4a shows the influent and effluent concentration as well as the removal rates. An initial erratic period (before 16 December 2020) was observed, which can be attributed to the establishment phase (the wetland was still in the early stages and received very low flows) in addition to an extended drought period. However, after the initial establishment phase, a positive correlation between the removal rate and the influent concentrations can be observed. This correlation is more obvious when considering the nitrogen-loading rate, as shown in Figure 4b,c. Figure 4c reveals a saturation curve with the removal rate increasing rapidly in the beginning but slowing down as it approaches the maximum capacity. The inflection point occurs around 0.69 kg-N/month·m2, thus suggesting that optimal performance can be achieved by maintaining a loading rate higher than 0.69 kg-N/month·m2.
To gain a more accurate representation of the wetland removal efficiency, the influent and the effluent loads were considered. The effluent is usually smaller than the influent (the average influent is 884 m3/day, and the average effluent is 767 m3/day). Therefore, a mass balance to account for the total incoming and outgoing nitrogen load revealed that the wetland received 664.6 kg-N with the influent but only released 128 kg-N in the effluent over the period between 11/2020 and 02/2022. Based on the mass balance, the nitrogen retention was greater than 80%. Furthermore, the mass balance does not account for the nitrogen in precipitation and wildlife activity, which can add a significant load. Therefore, the overall nitrogen removal efficiency is higher than what was calculated based on the influent-effluent concentrations.
Rain samples were analyzed for their nitrogen content, and it was found that the rainwater has 1.39 mg-N/L. The total amount of nitrogen contributed by precipitation, during the sampling period, is approximately 179.4 kg-N. Factoring in the TN from precipitation, it can be estimated that the actual TN load reduction is nearly 85%. Furthermore, wildlife activity, especially avian, adds to the nitrogen loads. Andersen [24] reported that avian activity can add between 139 and 312 g-N per ha per day. Therefore, the actual reduction of nitrogen load, in our case, is likely to be higher than 85% when nitrogen loads from wildlife activity are accounted for.
Above-ground plant samples analyzed for nitrogen content showed that the average nitrogen concentration was 0.83% of dry biomass. Therefore, it is estimated that, in total, above-ground biomass holds around 560.83 kg-N. This represents more than 66% (including precipitation) of the TN removal in the wetland. In this context, plants play a significant role in nitrogen removal in wetlands receiving low nitrogen concentrations.
Organic nitrogen concentration in the effluent (0.82 mg-N/L) was significantly higher than the influent (0.67 mg-N/L), p = 0.017. Nevertheless, the total load in the influent (105.03 kg-N) was higher than the organic nitrogen load released with the effluent (97.83 kg-N). This may indicate limited nitrification occurring in the constructed wetland. Although this is not conclusive evidence, as nitrification-denitrification may be occurring, but more organic nitrogen could be generated withing the wetland due to release from biomass decomposition and microbial death.
A strong correlation was observed between TN and TVS in the effluent (R = 0.89), explaining nearly 79% of the variability in TN. This observation is consistent with the fact that most of the TN in the effluent is in organic form. The system (plants and microbes) can uptake the available nutrients and incorporate them into biomass, as evident from the increased organic nitrogen in the effluent. However, when the nitrogen levels are too low in the influent, the wetland is unable to reduce it further (threshold concentration). In such a case, the removal efficiency is reduced, and some of the previously removed nitrogen can be released into the system as observed on some occasions, as shown in Figure 4.
The constructed wetland removal efficiency of the TN load was fitted to the K-C* model equation.
R K C , i = L 0 , i ( L 0 , i 0.115 e ( 97.2 H L R i ) + 0.115 ) × 100 / L 0 , i
RK-C*,i is the predicted removal rate in the ith month. L0,i is the average nitrogen loading rate during the ith month.
The TN removal was satisfactorily fitted to the K-C* model (R2 = 0.80 and RMSE = 6.38), as shown in Figure 4c. The K-C* model suggests that the constructed wetland has an irreducible nitrogen load threshold of 0.115 kg/month·m2.
Further exploration of the data revealed a strong log-linear correlation (r = 0.85) between the TN concentration in the influent and removal rate, as shown in Figure 5. This is partially explained by the loading rate, as discussed above. Nevertheless, this further suggests that concentration, on its own, is important because of the earlier-mentioned background (threshold) concentration of the system. Closer inspection of Figure 5 reveals that the wetland was unable to reduce the concentrations of TN when the influent concentrations were less than 0.8 mg-N/L, thus, suggesting that the threshold of the system was around 0.8 mg-N/L. The removal efficiency increased until it reached a maximum at around 3 mg-N/L, after which the removal efficiency plateaued. Figure 4c also showed increasing removal efficiency with increasing load and it showed that the removal rate slowed down after the TN load reached 0.69 kg-N/month·m2. Interestingly, the maximum concentration reduction was 86.7% at the concentration of 2.93 mg-N/L, but the maximum load reduction was 92.6% at the highest load (2.01 kg-N/month·m2).
The observed data were fitted to the K-C*, which provided reasonable fit to the data (R2 = 0.72 and RMSE = 18.44):
C o u t = C 0 0.862 e 209.36 H R L + 0.862

3.3.2. TP Removal

The average TP concentration in the influent was 0.14 mg-P/L, 75% of which was in the ortho-phosphate form. This is very low compared to typical treated wastewater concentrations. According to the 2020 Queensland State of the Environment Report, the average TP concentration in wastewater release in Queensland was 1.7 mg/L [25]. The low concentration can present a challenge to the constructed wetland, particularly for plant and microbial growth, as phosphorus can be limiting. During the sampling period, the average TP concentration in the effluent was 0.21 mg-P/L, of which ortho-phosphate made up 81%. Mass balance showed that the TP brought with the influent was around 90.3 kg-P while the total amount discharged with the effluent was around 92.5 kg-P. This is an interesting observation, as the concentration in the effluent is higher than the influent. A similar observation was reported by Lavrnić, Nan [2], who attributed this discrepancy to the phosphorus loads received in the precipitation. Samples of rainwater were collected and analyzed to determine the precipitation contribution to phosphorus loads in the constructed wetland. The average TP concentration in the rainwater was found to be 0.02 mg-P/L. Over the sampling period, the total precipitation was 1782.4 mm. Consequently, the total contribution of the precipitation to the P load is estimated to be around 2.59 kg. Nevertheless, a study of the nutrient loads from precipitation in New South Wales forests reported a range between 0.02 and 0.293 kg-P per ha per year [26].
In our case, the excess phosphorus is attributed to wildlife activity. Birds of different species (especially moorhen), frogs, small mammals, and snakes are often sighted in the wetland. Animal droppings were often observed around the perimeter of the cells. The presence of these animals adds to the phosphorus loads in the wetland, but these additional loads are not accounted for in the mass balance. Scherer, Gibbons [27] reported that birds can have a significant role in phosphorus cycling with up to 0.16 g P per m2 per year.
Above-ground plant biomass samples were analyzed for the P content. It was found that the P content was around 1.4 mg/g (dry mass), which translates to around 1.30 g-P/m2 of the constructed wetland or 94.59 kg P in the above-ground biomass in the wetland. This demonstrates that plants can assimilate P from low-concentration influent. Although, most of this P is likely to be contributed to by wildlife activity in the wetland. It is important to note that this is temporarily stored in the biomass and can be released when plants die off.
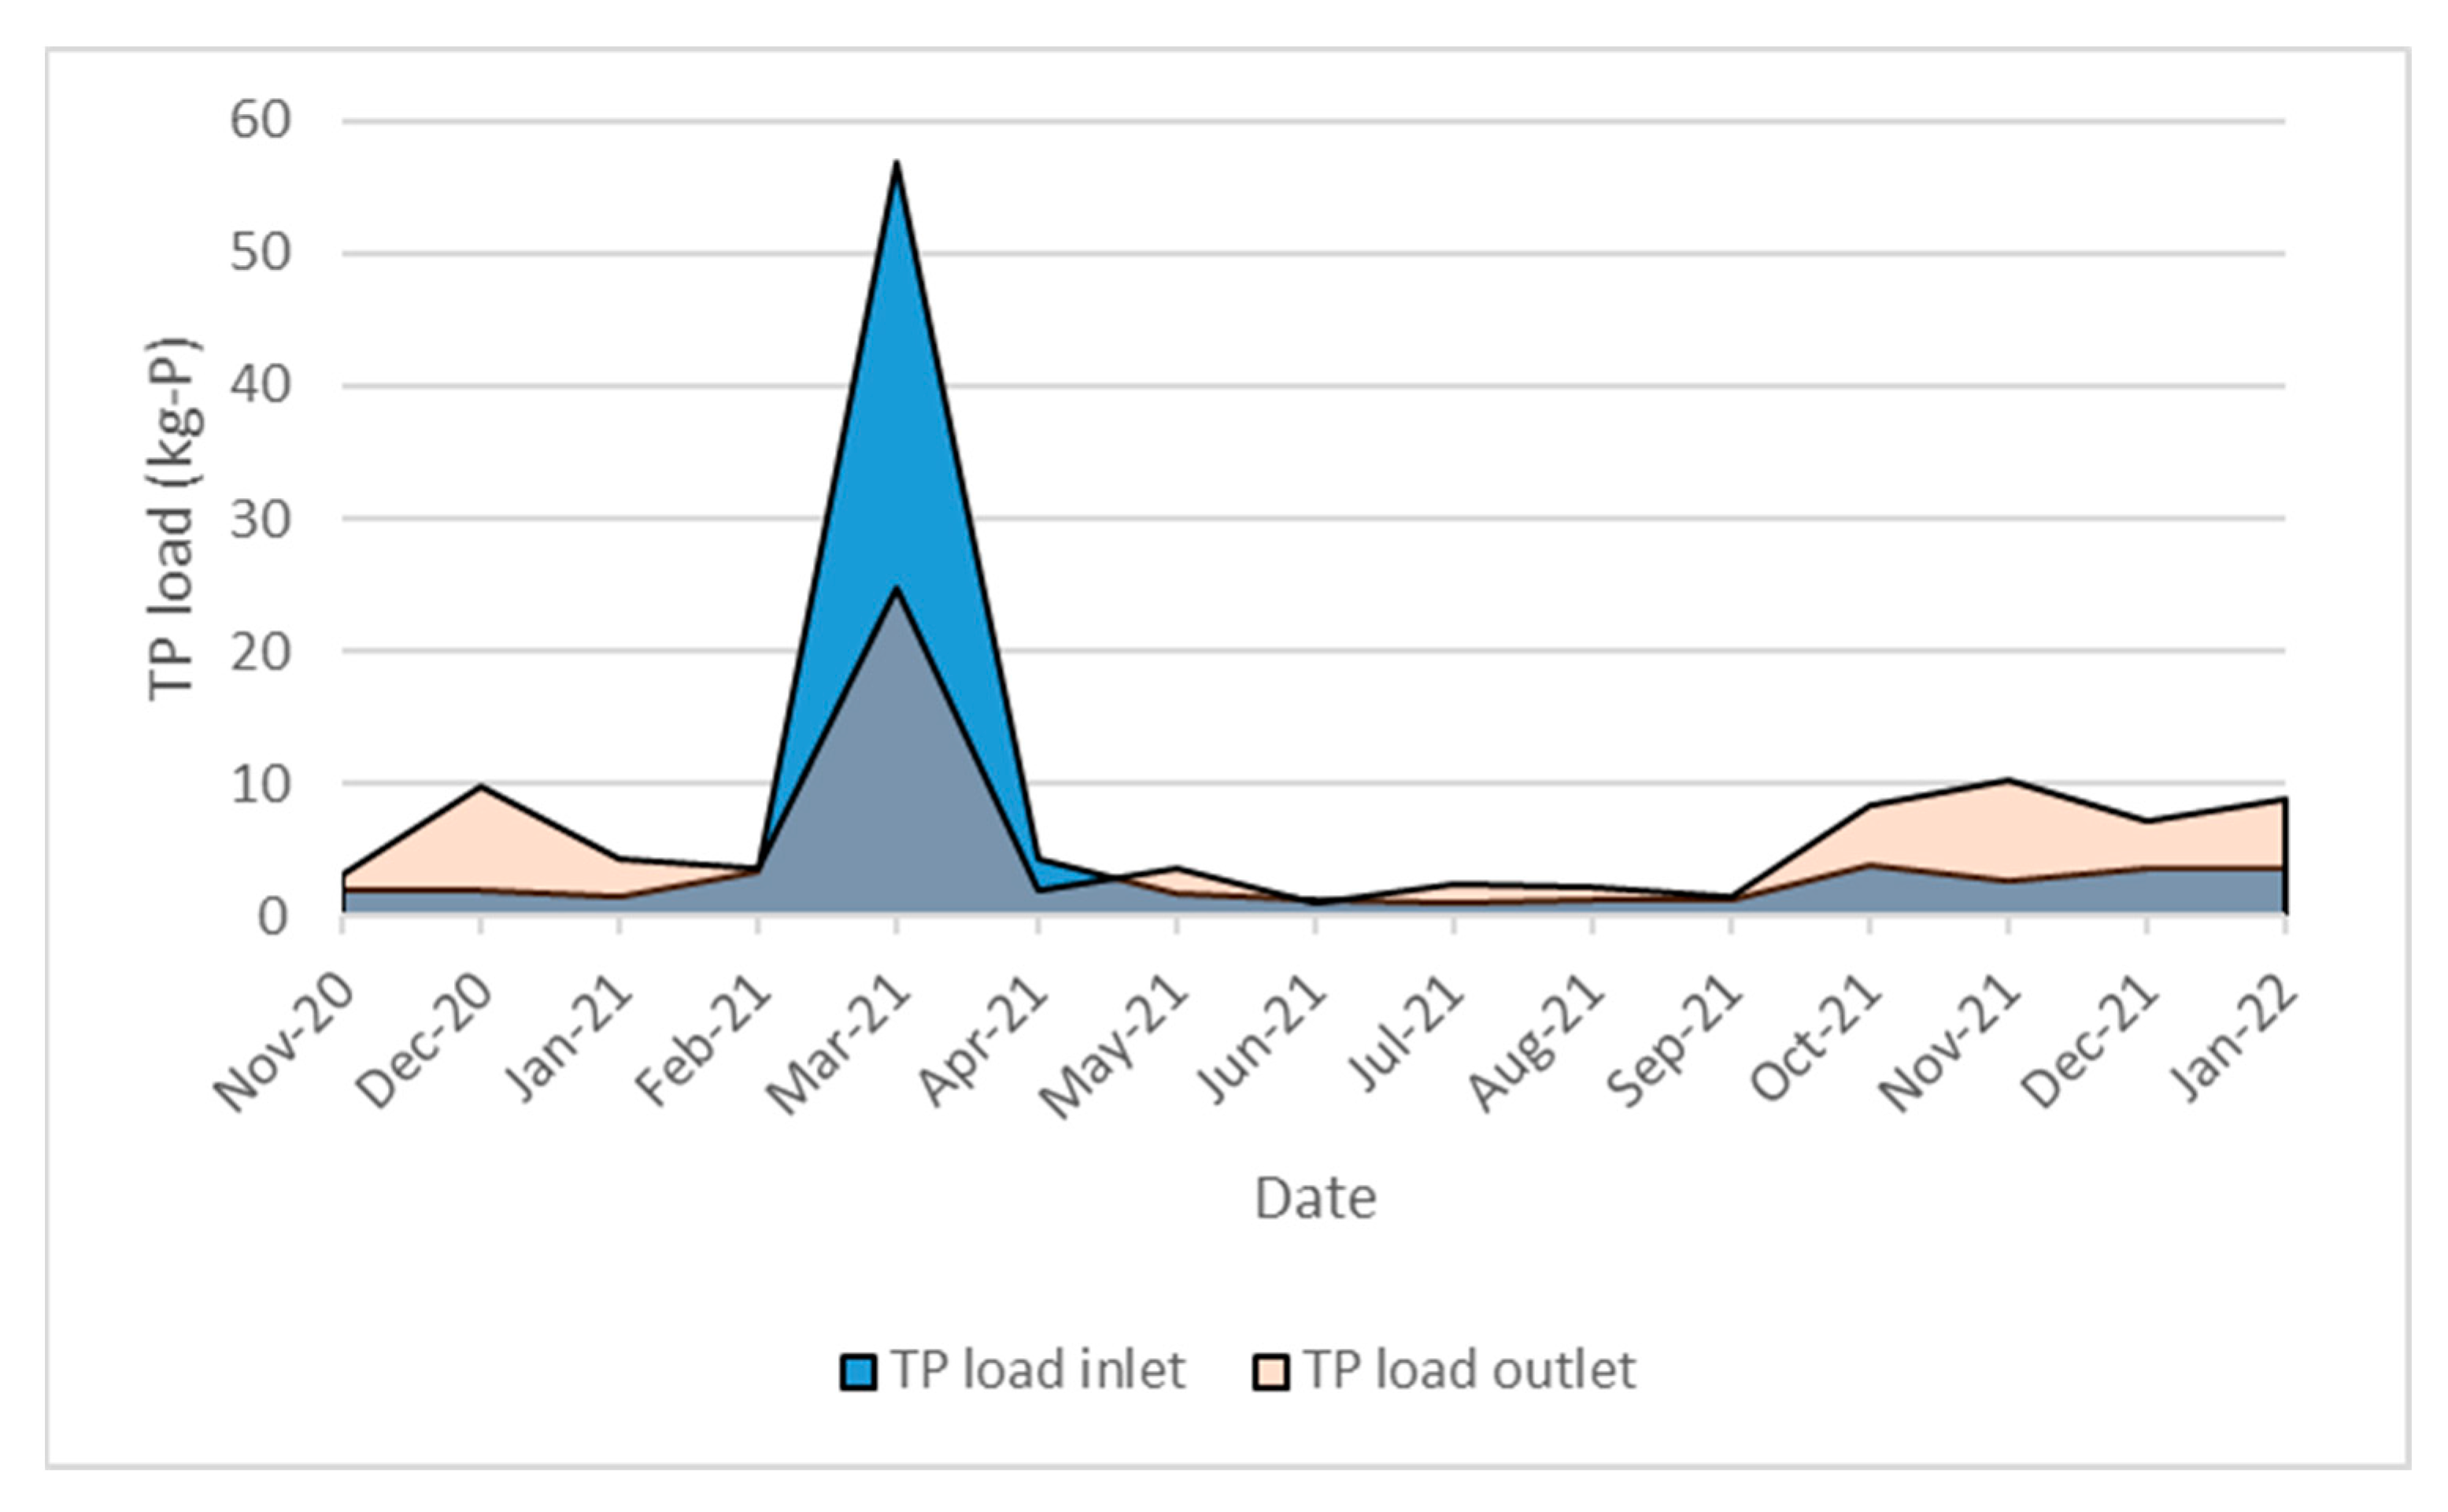
As the retention period is significantly high (influent > effluent), the phosphorus can be held in the system and later flushed out when the hydraulic loads increase or when the concentrations fall below threshold levels. Figure 6 shows that the system stored phosphorus when loads were high and released it later. The spikes in TP concentrations during wet weather further support this hypothesis, Figure 3a. However, it is important to note that the system has been able to cope with spikes in phosphorus concentrations, reducing the concentration by 78% and the load by 57%. Additionally, the pH of the effluent remained within a tight range of around 7.25, where H2PO4 and HPO42− are the dominant forms, which indicates that phosphate is mainly in soluble forms. The apparent low efficiency in TP removal is likely because most of the incoming phosphorus is in the ortho-phosphate form. Surface flow-constructed wetlands are more efficient in removing particulate phosphate [7].

4. Conclusions

Based on 15 months of water quality monitoring, the surface flow constructed wetland performed well, especially in removing oxidized forms of nitrogen and ammonium, achieving efficiencies between 92 and 100%. The TN and TP removal correlated moderately to water temperature, pH, DO levels, and hydraulic loading rate. However, the strongest predictor of TN removal was the concentration of TN in the influent. The relation between TN concentration and removal rate was modeled sufficiently using the K-C* model. Based on concentrations in the influent and effluent, TP seemed to have a negative removal rate. However, the mass balance of TP loads proved that the wetland acted as a modulator, where TP was retained in the wetland when it was supplied in excess and later released when the TP loads in the system fell below a threshold level. TP and TN loads were positively correlated to the TSS and TVS load in the effluent. It is important to account for precipitation and evapotranspiration when calculating the HLR, as the performance of the wetland showed a poor correlation to HRL but a strong correlation to the adjusted HLR (accounting for precipitation and evapotranspiration). Wildlife and rainfall added significant nutrient loads, which is particularly observed in the case of TP. The results show that SFCW are effective in reducing the nutrient loads even in cases of low nutrient and organic concentrations, and plants are crucial in nutrient retention.

Author Contributions

Conceptualization, A.E.H.; methodology, A.E.H.; software, A.E.H.; formal analysis, A.E.H.; investigation, A.E.H.; resources, A.E.H. and K.A.; data curation, A.E.H.; writing—original draft, A.E.H.; writing—review and editing, K.A. All authors have read and agreed to the published version of the manuscript.

Funding

This project received financial support from Logan City Council under the Cedar Grove Research Project.

Acknowledgments

The authors would like to acknowledge Logan City Council for their financial support of this research project. The authors also acknowledge the staff at the Logan Water lab for their help in analyzing the water samples. The authors also would like to thank the operators at the Cedar Grove Constructed wetland for their cooperation and assistance, special mention of Colin Clough and Peter Waller. The authors also acknowledge Zainab Mahdi, Firas Yusuf, Hardik Mavani, Duncan Gill, Leo Steyn, Mia Saini, and Luciane Bespalhok for their role in collecting water samples and data entry. The authors would like to thank Professor David Thiel and Professor Margaret Greenway for proofreading the manuscript and their feedback. Finally, authors thank and acknowledge Environments-MDPI for waiving the APC for this article.

Conflicts of Interest

The authors declare no conflict of interest.

References

  1. Varma, M.; Gupta, A.K.; Ghosal, P.S.; Majumder, A. A review on performance of constructed wetlands in tropical and cold climate: Insights of mechanism, role of influencing factors, and system modification in low temperature. Sci. Total Environ. 2021, 755, 142540. [Google Scholar] [CrossRef] [PubMed]
  2. Lavrnić, S.; Nan, X.; Blasioli, S.; Braschi, I.; Anconelli, S.; Toscano, A. Performance of a full scale constructed wetland as ecological practice for agricultural drainage water treatment in Northern Italy. Ecol. Eng. 2020, 154, 105927. [Google Scholar] [CrossRef]
  3. Rizzo, A.; Bresciani, R.; Martinuzzi, N.; Masi, F. Online Monitoring of a Long-Term Full-Scale Constructed Wetland for the Treatment of Winery Wastewater in Italy. Appl. Sci. 2020, 10, 555. [Google Scholar] [CrossRef] [Green Version]
  4. Steidl, J.; Kalettka, T.; Bauwe, A. Nitrogen retention efficiency of a surface-flow constructed wetland receiving tile drainage water: A case study from north-eastern Germany. Agric. Ecosyst. Environ. 2019, 283, 106577. [Google Scholar] [CrossRef]
  5. Ulén, B.; Geranmayeh, P.; Blomberg, M.; Bieroza, M. Seasonal variation in nutrient retention in a free water surface constructed wetland monitored with flow-proportional sampling and optical sensors. Ecol. Eng. 2019, 139, 105588. [Google Scholar] [CrossRef]
  6. Ding, X.; Xue, Y.; Zhao, Y.; Xiao, W.; Liu, Y.; Liu, J. Effects of different covering systems and carbon nitrogen ratios on nitrogen removal in surface flow constructed wetlands. J. Clean. Prod. 2018, 172, 541–551. [Google Scholar] [CrossRef]
  7. Mendes, L.R.D.; Tonderski, K.; Iversen, B.V.; Kjaergaard, C. Phosphorus retention in surface-flow constructed wetlands targeting agricultural drainage water. Ecol. Eng. 2018, 120, 94–103. [Google Scholar] [CrossRef]
  8. Stefanakis, A.; Akratos, C.S.; Tsihrintzis, V.A. (Eds.) Chapter 5—Treatment Processes in VFCWs. In Vertical Flow Constructed Wetlands; Elsevier: Boston, MA, USA, 2014; pp. 57–84. [Google Scholar]
  9. Zhuang, L.-L.; Yang, T.; Zhang, J.; Li, X. The configuration, purification effect and mechanism of intensified constructed wetland for wastewater treatment from the aspect of nitrogen removal: A review. Bioresour. Technol. 2019, 293, 122086. [Google Scholar] [CrossRef]
  10. Ecoteam. World Class Wetland Design at Cedar Grove. Available online: https://ecoteam.com.au/ecoteam-designs-cedar-grove-wastewater-treatment-wetlands/ (accessed on 21 July 2021).
  11. Bureau of Meteorology. Recent Evapotranspiration. 2022. Available online: http://www.bom.gov.au/watl/eto/ (accessed on 18 February 2022).
  12. Kadlec, R.H.; Knight, R.L. Treatment Wetlands; CRC Press: Boca Raton, FL, USA, 1996. [Google Scholar]
  13. Anzecc, A. Australian and New Zealand guidelines for fresh and marine water quality. Aust. N. Z. Environ. Conserv. Counc. Agric. Resour. Manag. Counc. Aust. N. Z. Canberra 2000, 1, 1–314. [Google Scholar]
  14. De Rozari, P.; Greenway, M.; El Hanandeh, A. Phosphorus removal from secondary sewage and septage using sand media amended with biochar in constructed wetland mesocosms. Sci. Total. Environ. 2016, 569–570, 123–133. [Google Scholar] [CrossRef] [Green Version]
  15. Greenway, M. Stormwater wetlands for the enhancement of environmental ecosystem services: Case studies for two retrofit wetlands in Brisbane, Australia. J. Clean. Prod. 2017, 163, S91–S100. [Google Scholar] [CrossRef] [Green Version]
  16. Kotti, I.P.; Gikas, G.D.; Tsihrintzis, V.A. Effect of operational and design parameters on removal efficiency of pilot-scale FWS constructed wetlands and comparison with HSF systems. Ecol. Eng. 2010, 36, 862–875. [Google Scholar] [CrossRef]
  17. Zhu, H.; Zhou, Q.-W.; Yan, B.-X.; Liang, Y.-X.; Yu, X.-F.; Gerchman, Y.; Cheng, X.-W. Influence of vegetation type and temperature on the performance of constructed wetlands for nutrient removal. Water Sci. Technol. 2017, 77, 829–837. [Google Scholar] [CrossRef] [PubMed]
  18. Mu, X.; Zhang, S.; Lv, X.; Ma, Y.; Zhang, Z.; Han, B. Water flow and temperature drove epiphytic microbial community shift: Insight into nutrient removal in constructed wetlands from microbial assemblage and co-occurrence patterns. Bioresour. Technol. 2021, 332, 125134. [Google Scholar] [CrossRef] [PubMed]
  19. Li, F.; Lu, L.; Zheng, X.; Ngo, H.H.; Liang, S.; Guo, W.; Zhang, X. Enhanced nitrogen removal in constructed wetlands: Effects of dissolved oxygen and step-feeding. Bioresour. Technol. 2014, 169, 395–402. [Google Scholar] [CrossRef] [PubMed]
  20. Ilyas, H.; Masih, I. The effects of different aeration strategies on the performance of constructed wetlands for phosphorus removal. Environ. Sci. Pollut. Res. 2018, 25, 5318–5335. [Google Scholar] [CrossRef]
  21. Beutel, M.W.; Newton, C.D.; Brouillard, E.S.; Watts, R.J. Nitrate removal in surface-flow constructed wetlands treating dilute agricultural runoff in the lower Yakima Basin, Washington. Ecol. Eng. 2009, 35, 1538–1546. [Google Scholar] [CrossRef]
  22. Li, H.; Liu, F.; Luo, P.; Chen, X.; Chen, J.; Huang, Z.; Peng, J.; Xiao, R.; Wu, J. Stimulation of optimized influent C:N ratios on nitrogen removal in surface flow constructed wetlands: Performance and microbial mechanisms. Sci. Total. Environ. 2019, 694, 133575. [Google Scholar] [CrossRef]
  23. Chen, Y.; Wen, Y.; Zhou, Q.; Vymazal, J. Effects of plant biomass on nitrogen transformation in subsurface-batch constructed wetlands: A stable isotope and mass balance assessment. Water Res. 2014, 63, 158–167. [Google Scholar] [CrossRef]
  24. Andersen, D.C.; Sartoris, J.J.; Thullen, J.S.; Reusch, P.G. The effects of bird use on nutrient removal in a constructed wastewater-treatment wetland. Wetlands 2003, 23, 423–435. [Google Scholar] [CrossRef]
  25. Department of Environment and Science. Queensland State of the Environment 2020; Department of Environment and Science: Brisbane, QLD, Australia, 2021; 96p. Available online: https://www.stateoftheenvironment.des.qld.gov.au/ (accessed on 10 May 2023).
  26. Turner, J.; Lambert, M.; Knott, J. Nutrient Inputs from Rainfall in New South Wales State Forests; Forest Research and Development Division: Sydney, Australia, 1996.
  27. Scherer, N.M.; Gibbons, H.L.; Stoops, K.B.; Muller, M. Phosphorus Loading of an Urban Lake by Bird Droppings. Lake Reserv. Manag. 1995, 11, 317–327. [Google Scholar] [CrossRef]
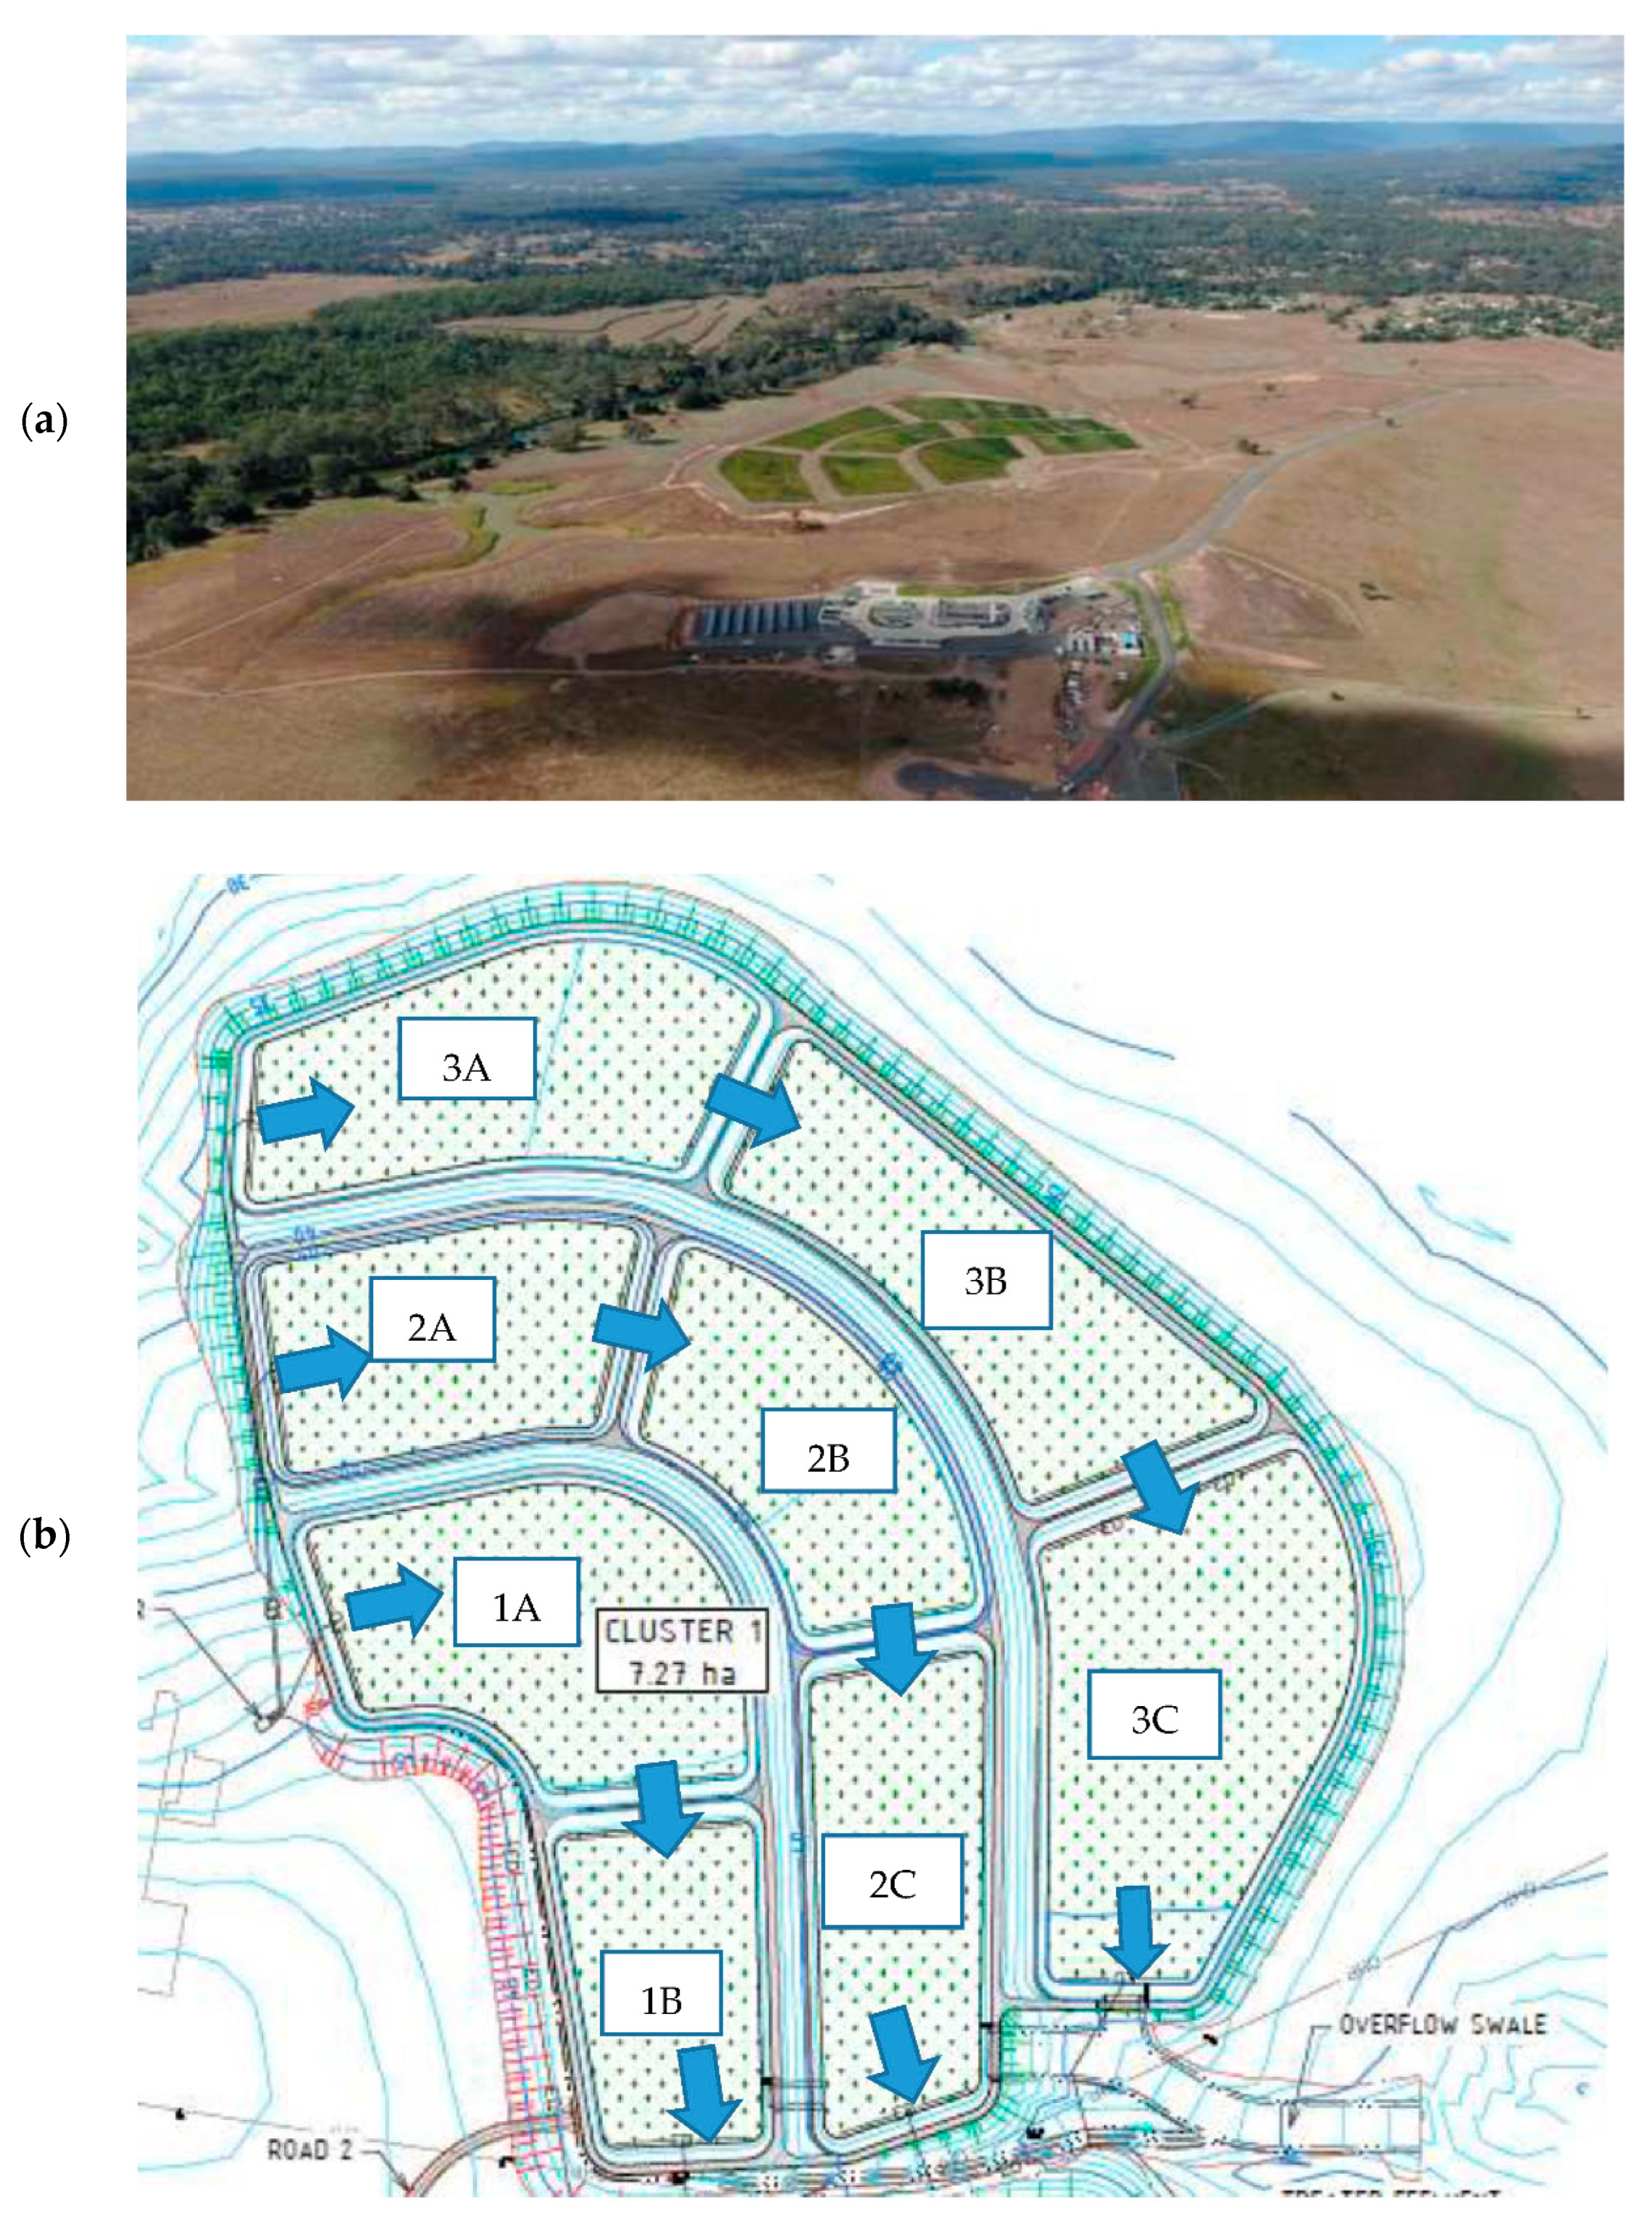
Figure 1. Aerial view (a) and schematic diagram (b) of Cedar Grove constructed wetland and environmental center (arrows show direction of flow). Courtesy: Logan City Council.
Environments 10 00089 g001
Figure 2. (a) Daily precipitation over the study period (b) and average monthly temperature. Source: Bureau of Meteorology [11].
Environments 10 00089 g002
Figure 3. Concentration over time: TP; TSS; TVS.
Environments 10 00089 g003aEnvironments 10 00089 g003b
Figure 4. (a) TN concentration in the influent and effluent, (b) loading rate over time, (c) and monthly loading vs removal rate.
Environments 10 00089 g004aEnvironments 10 00089 g004b
Figure 5. Inlet TN concentration vs removal rate.
Environments 10 00089 g005
Figure 6. TP loads load in the influent and effluent.
Environments 10 00089 g006
Table 1. Methods used for chemical analysis of the defined water parameters.
ParameterMethod of Analysis
TNAPHA4500 P J
TPAPHA4500 P J
BODAPHA5210D
NH4+APHA4500NH3D
TSSAPHA2540D
TVSAPHA2540E
TDSAPHA2510A
Organic NAPHA4500 P J
Organic PAPHA4500PF
NO3 APHA4500NO3F
NO2 APHA4500NO3F
TKNAPHA4500 P J
PO4−3APHA4500PF
Table 2. Summary statistics of monitored water quality parameters over the study period (November 2020 to February 2022).
ParameterMean ± Standard DeviationMedian
Influent (N = 50)Effluent (N = 50)Influent (N = 50)Effluent (N = 50)MCR * (%)
Water Temperature (°C)23.6 ± 3.417.7 ± 4.824.118.4NA
DO (mg/L)5.8 ± 0.96.1 ± 1.76.15.7NA
BOD (mg/L)<5<5<5<5-
NOx (mg-N/L)1.06 ± 0.630.08 ± 0.020.970.0792.4
Organic N (mg-N/L)0.67 ± 0.430.83 ± 0.230.620.83−22.8
Ammonia<=0.33 (n = 20, <0.1)<=0.18 (n = 38, <0.1)<0.1<0.160.3
TN (mg-N/L)1.83 ± 1.080.84 ± 0.221.810.8454.3
Orthophosphate (mg-P/L)0.11 ± 0.130.17 ± 0.150.060.13−56.4
Organic Phosphorus (mg-P/L)<0.1<0.1<0.1<0.1-
TP (mg-P/L)0.14 ± 0.40.21 ± 0.170.070.17−40.5
TSS (mg/L)0.73 ± 0.836.44 ± 6.640.603.92−562
TVS (mg/L)0.60 ± 0.742.45 ± 2.440.513.25−302
TDS (mg/L)428 ± 36446 ± 73421443-
pH7.08 ± 0.167.25 ± 0.197.17.23-
EC (μS/cm)704.9 ± 59.4734.3 ± 123.9693729-
* MCR: mean concentration reduction (influent—effluent)/influent.
Table 3. Average monthly loads in the influent and effluent (kg/day), pH (units), and temperature (°C), HLR and adjusted HLR (m3·m−2·day−1) and HRT (days).
MonthTN-inTP-inpH-inTDS-inTemp-inDO-inTN-outTP-outTSS-outTVS-outpH-outTDS-outTemp-outDO-out H L R   ( × 10 3 ) HRTAdj. HLR
Nov-200.510.077.25352.5223.883.650.400.103.650.897.70168.5523.882.379.9218.815.79
Dec-200.600.067.03347.0522.904.630.880.318.152.737.63400.9322.905.5912.1721.4513.43
Jan-210.560.057.10369.6423.684.360.760.147.532.377.45390.7823.686.7011.8922.7411.32
Feb-210.900.127.20338.0523.604.010.560.133.592.887.50255.3823.604.5711.0319.137.20
Mar-216.781.847.30492.1521.387.871.910.8036.3813.447.37410.8621.384.6716.4319.7724.43
Apr-211.700.147.10414.6515.806.130.630.0611.201.007.60448.4515.808.4912.6630.3411.93
May-211.960.057.13426.2214.906.030.590.123.573.247.28403.0914.905.5012.4433.1012.96
Jun-211.650.046.90326.0612.095.060.360.031.330.717.17299.6712.095.6410.7933.009.77
Jul-212.000.036.98360.8711.505.540.520.071.880.977.48363.4611.507.7211.9735.1911.63
Aug-211.300.046.95347.6314.184.350.390.071.991.437.33269.8414.185.5511.8638.409.82
Sep-211.460.047.13322.1815.404.740.440.051.320.747.40275.3115.405.9911.1242.008.23
Oct-212.350.136.95415.6419.635.890.720.273.531.397.25334.4919.637.0113.8737.7313.75
Nov-212.250.097.24461.6220.406.550.990.346.092.507.38475.1820.408.6614.8039.2415.03
Dec-211.900.127.20497.0822.336.421.020.236.362.757.23410.4622.335.0116.5235.2516.62
Jan-221.570.227.20488.2224.446.160.970.322.422.247.33460.6024.444.2014.8940.8814.24
Table 4. Correlation matrix between the different water quality parameters.
TN-inTP-inpH-inTDS-inTemp-inDO-inTN-outTP-outTSS-outTVS-outpH-outTDS-outTemp-outDO-outHLRHRTAdj. HLR
TN-in1.00
TP-in0.921.00
pH-in0.320.461.00
TDS-in0.580.480.541.00
Temp-in−0.060.200.650.351.00
DO-in0.810.630.300.85−0.051.00
TN-out0.800.850.570.750.450.761.00
TP-out0.800.870.510.660.460.680.961.00
TSS-out0.840.950.470.480.240.610.870.841.00
TVS-out0.870.960.510.510.280.610.890.890.931.00
pH-out−0.32−0.080.26−0.340.31−0.43−0.12−0.090.08−0.101.00
TDS-out0.330.220.180.710.100.740.570.440.330.29−0.211.00
Temp-out−0.060.200.650.351.00−0.050.450.460.240.280.310.101.00
DO-out0.04−0.20−0.360.04−0.450.30−0.05−0.14−0.06−0.21−0.090.53−0.451.00
HLR0.650.550.410.930.300.870.830.740.540.58−0.420.720.300.131.00
HRT−0.05−0.35−0.320.19−0.480.27−0.23−0.26−0.47−0.41−0.590.26−0.480.410.231.00
Adj. HLR0.840.770.320.800.180.900.930.870.780.80−0.340.700.180.140.890.001.00
Disclaimer/Publisher’s Note: The statements, opinions and data contained in all publications are solely those of the individual author(s) and contributor(s) and not of MDPI and/or the editor(s). MDPI and/or the editor(s) disclaim responsibility for any injury to people or property resulting from any ideas, methods, instructions or products referred to in the content.