Article

Legacy Phosphorus in Sediments of Lowland Waterways

1
Agrar- und Umweltwissenschaftliche Fakultät, Universität Rostock, Justus-von-Liebig-Weg 6, 18059 Rostock, Germany
2
Interdisziplinäre Fakultät, Institut für Chemie, Universität Rostock, Albert-Einstein-Straße 25, 18059 Rostock, Germany
*
Authors to whom correspondence should be addressed.
Environments 2023, 10(3), 43; https://doi.org/10.3390/environments10030043
Submission received: 20 January 2023 / Revised: 22 February 2023 / Accepted: 25 February 2023 / Published: 27 February 2023
(This article belongs to the Special Issue Potentially Toxic Elements in Sediments of Protected Areas)

Abstract

:
Riverbed sediments in agricultural landscapes are loaded with phosphorus (P). They may act as a source or sink for riverine P, possibly causing harmful algae blooms and eutrophication in streams and receiving water bodies, including coastal waters. In this study, we aimed at identifying the labile, moderately labile, and stable P fraction (Hedley fractionation) in sediments of a northeastern German river basin (3000 km2). A non-metrical multidimensional scaling (NMDS) was used to identify the most significant environmental predictors of the P fractionation in sediments. The total P contents of the sediments varied over a wide range (698 ± 701 mg P kg−1 sediment−1), spanning from 98 to 2648 mg P kg−1 sediment−1. Adjacent agricultural reference soils had markedly lower total P contents of 354 ± 132 mg P kg−1 soil−1, ranging from 146 to 483 P kg−1 soil−1. There were almost no differences between the P contents of the top (0–2 cm) and the bottom (2–10 cm) layer. The dominant P fractions were the moderately labile (NaOH-P) and the stable (H2SO4-P) fractions, which accounted for more than 50% of the total P at each sampling point. The NMDS revealed that iron and aluminum contents, as well as land use, are significant predictors for the P fractionation of the sediment. The sediment P-composition reflects the P-status of the agriculturally used mineral soils. However, the size of the contributing catchment as well as the length of the water way have no effects on sediment P. In conclusion, sediment P stocks, though variable, may impede the good ecological status of river waters for decades, especially in lowland basins where hydraulic conditions and a very low stream velocity often create low redox and P dissolution conditions in sediments.

1. Introduction

Phosphorus (P) is essential for human food production and security and is increasingly crucial for bioenergy generation [1]. However, the unsustainable use of P has increased the pressure on the finite global phosphate rock reserves. Little is known about the implications of future phosphorus scarcity for global food security [2]. Unsustainable fertilization of agricultural lands with an over-application of P is directly linked to ground and surface water contamination. The emerging eutrophication leads to various adverse environmental impacts, such as excessive algae blooms, oxygen depletion, reduced water transparency, and decreased water quality [3].
Since the first Helsinki Convention (HELCOM) in 1974, the necessity for reducing the nitrogen (N) and P inputs into the Baltic Sea to conquer further eutrophication had the consent of the neighboring countries. Beginning in the late 1980s, the stream P concentrations from rivers draining into the Baltic Sea experienced a significant decline [4] in, for example, Finland [5] and Germany [6]. Such reductions are often correlated with improvements in wastewater treatment plants [4,6]. However, recently, the intended further reductions in catchment P concentrations did not occur as quickly as expected by scientists, state agencies, and stakeholders [7].
P stocks in agriculturally used soils and the complex release patterns in watersheds and their streams may be the main reasons for invariable stream P concentrations [8]. In contrast to mobile nutrients, P is accumulated in the landscape over decades of fertilizer application and agricultural production [9]. The historical burden of prior land use is referred to as “legacy P” [4,10,11]. Watersheds in industrialized countries are still in the stages of an accumulation process. Phosphorus may be retained in the drainage system over long periods. However, phosphorus legacies of rivers and lakes are governed by a wide range of processes that control retention and remobilization, and are strongly linked to water and sediment residence time [7]. These are, for instance, sedimentation and accumulation of particle-bound P, remobilization and relocation of sediments by hydraulic pressure, re-solubilization of P due to changes in redox conditions, P uptake and removal by plants and microorganisms.
The chemical composition of sediments affects P dynamics [11]. In sediments, as in soils, P can be bound to iron (Fe), aluminium (Al) (hydr)oxides, and calcium carbonates. The actual P contents and P availability are, for instance, affected by sediment P binding capacity, sediment pore water and column water concentration [12], pH [13], and redox potential [14].
To gain an understanding of the potential mobility of P in soils and sediments, a variety of extraction methods have been developed. Sequential P fractionation has become a commonly used approach to determine the distribution and mobility of various P forms in soils and sediments [15,16,17]. Differentiation of labile, increasingly stable, and stable organic and inorganic P fractions in soils has been introduced by [18]. The Hedley fractionation scheme—sometimes with slight modifications—has been frequently applied in Germany [19,20,21] and worldwide [22,23]. The fractionation of P has also been employed to analyze lake sediments [24,25,26] and is increasingly used for streambed sediments [11,27]. The combination of sequential P fractionation with other innovative methods such as XANES (X-ray adsorption near edge structure) or 31P-NMR may allow deeper insights into the chemical processes of P formation [17]. However, these methods are expensive and not always feasible for state agencies and decision-makers.
The research questions in this study aimed to (a) measure total P contents of riverbed sediments in second-degree tributaries in the northeastern German Warnow River Basin, (b) identify the Hedley P speciation and the potential mobility of legacy P, and (c) depict environmental predictors for the sediment P speciation.
We hypothesize that the composition of P in the sediments is formed by complex interactions between dynamic (e.g., flow velocity, redox potential) and static environmental variables (e.g., land use type, Fe, Al contents of the sediments). Furthermore, we believe that the sediments in lowland river systems support evidence for the long-term accumulation of P, referred to as legacy P, in agriculturally used basins and reflect the historical land use and the soil characteristics in the watershed.
Two reasons justify the increasing scientific and public interest in the investigated Warnow River Basin. (i) The Warnow River is the second-largest German river discharging into the Baltic Sea. All neighbor countries of the Baltic Sea and the Helsinki Commission (HELCOM) have agreed to lower nutrient input into the Baltic Sea as it has been done for many river basins around the world (e.g., the Mississippi River Basin). (ii) The river water is used as the source of fresh water supply for the greater region of the city of Rostock, home to 250,000 inhabitants. Hence, it is tremendously important to provide knowledge to reduce freshwater contamination for future generations.

2. Materials and Methods

2.1. Conceptual Design of the Study

This study was designed to reveal the total P content and P speciation of second-degree river tributaries to the Warnow River in northeastern Germany. Samples were collected at two depths to characterize recent (0–2 cm) and older (2–10 cm) sediment. Furthermore, environmental variables were recorded to depict possible mechanisms of legacy P storage and release to surface waters.

2.2. Study Site

The study site was the northeastern German lowland Warnow River Basin with seven subbasins (Figure 1a,b). The length from the spring to the estuary mouth in the city of Rostock is approximately 155 km. After 149 km, the freshwater part is separated from the brackish section by a weir. The total drained area of the freshwater region is 3038 km2. The basin is primarily agriculturally used (70%). Other land uses are forests (22%), urban areas (3%), open water (4%), and wetlands (<1%). The extent of forests and open water increases towards the south of the catchment (Figure 1c). Approximately 42% of the basin is artificially drained, mainly by tile drainage [6,28]. Detailed characterizations of the Warnow River Basin have been presented in previous studies [6,29,30].

2.3. Sampling, In Situ, and Laboratory Analysis

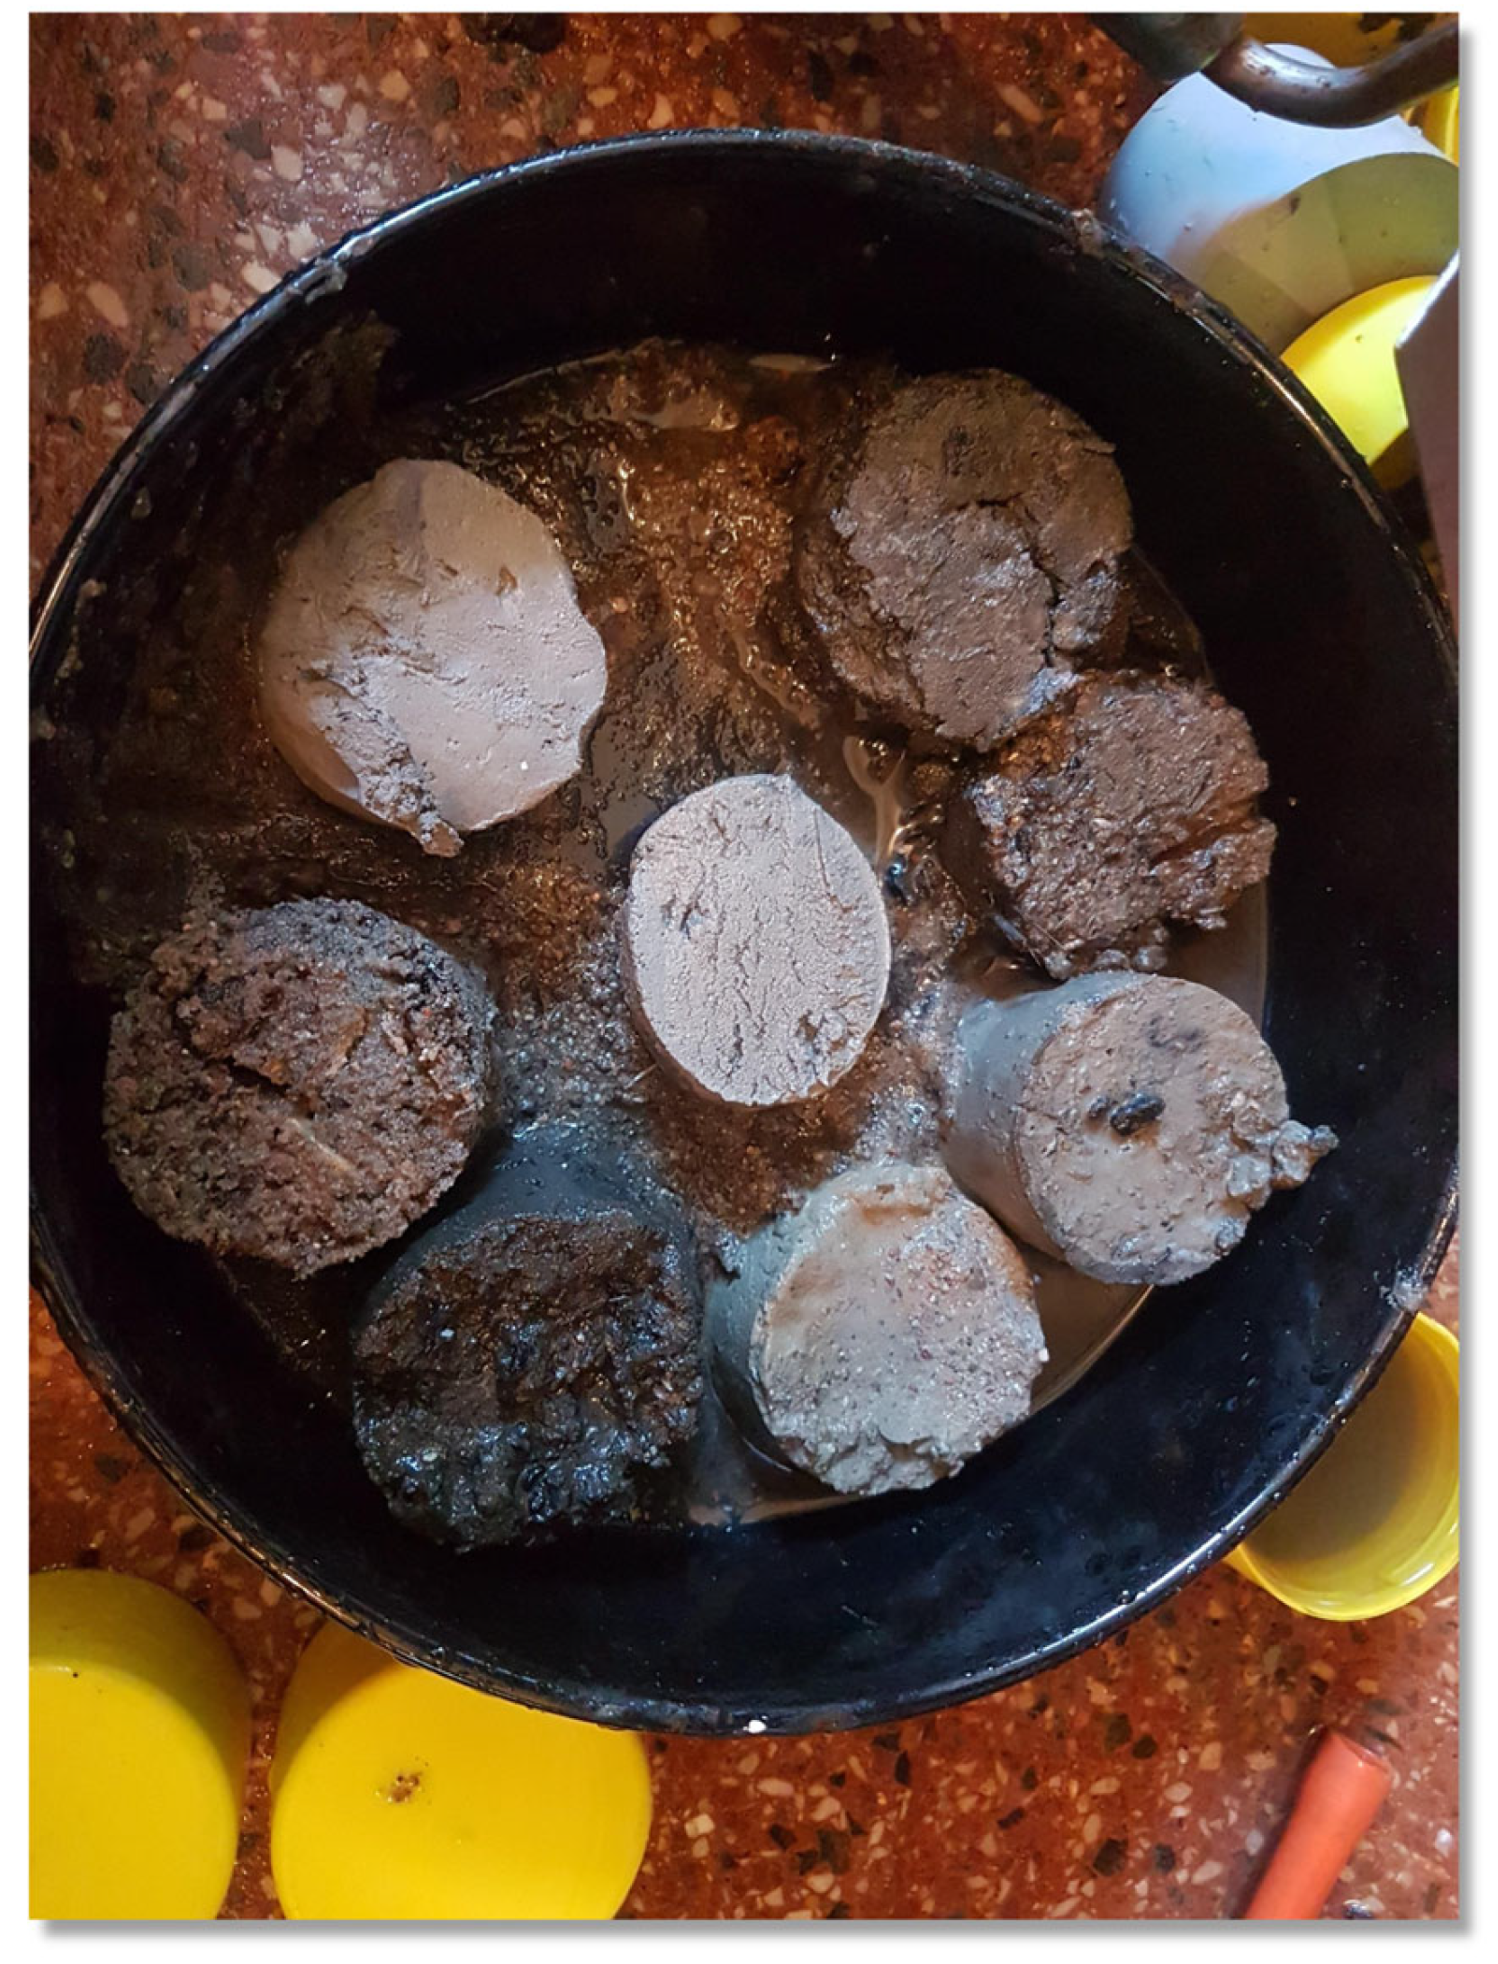
Sediment sampling was done from 21 September until 30 September 2019, at 36 sampling points within the borders of the Warnow River Basin. Three pseudo-replicate samples per sampling point were taken using a corer (UWITEC, 60 mm diameter). If possible, at least 10 cm of sediment was collected. At spots with a marked rock content, the total depth of sampled sediment was somewhat lower. The sampling was done in late September to minimize interference with fertilizer application in agricultural areas. The sampling points were selected preferentially by the authors. Accessibility was decisive for a sampling point selection, and at least three sampling points per second-order stream were chosen. Our sampling approach was designed to cover all sediment types published by the State Department of Environment, Nature Conservation, and Geology Mecklenburg and Western-Pomerania [31]: sand/sill lowland river sediments, sand/sill lowland brook sediments, organic river sediments, organic brook sediments, gravel river sediments, gravel brook sediments, and sediments influenced by a lake outlet. The seven designated freshwater sediment types were grouped into organic sediments, sand/sill sediments, lake sediments, and gravel sediments (some samples are seen in Figure 2).
Pretests in the Warnow River Basin showed structural changes in the sediments with increasing depths. While the top layer was dominated by fresh organic material at most places with lower flow velocities, deeper sediment layers carry higher amounts of mineral material. Hence, the fresh samples were subdivided into subsamples from 0–2 cm and 2–10 cm sediment depth. The three replicates were air-dried and sieved with a two mm mesh opening to remove the coarse fraction of the sediment texture. Then, the samples were mixed and homogenized manually. Samples (0.5 g) of the sieved materials were stored in the fridge (−12 °C) for further chemical treatment (Hedley fractionation).
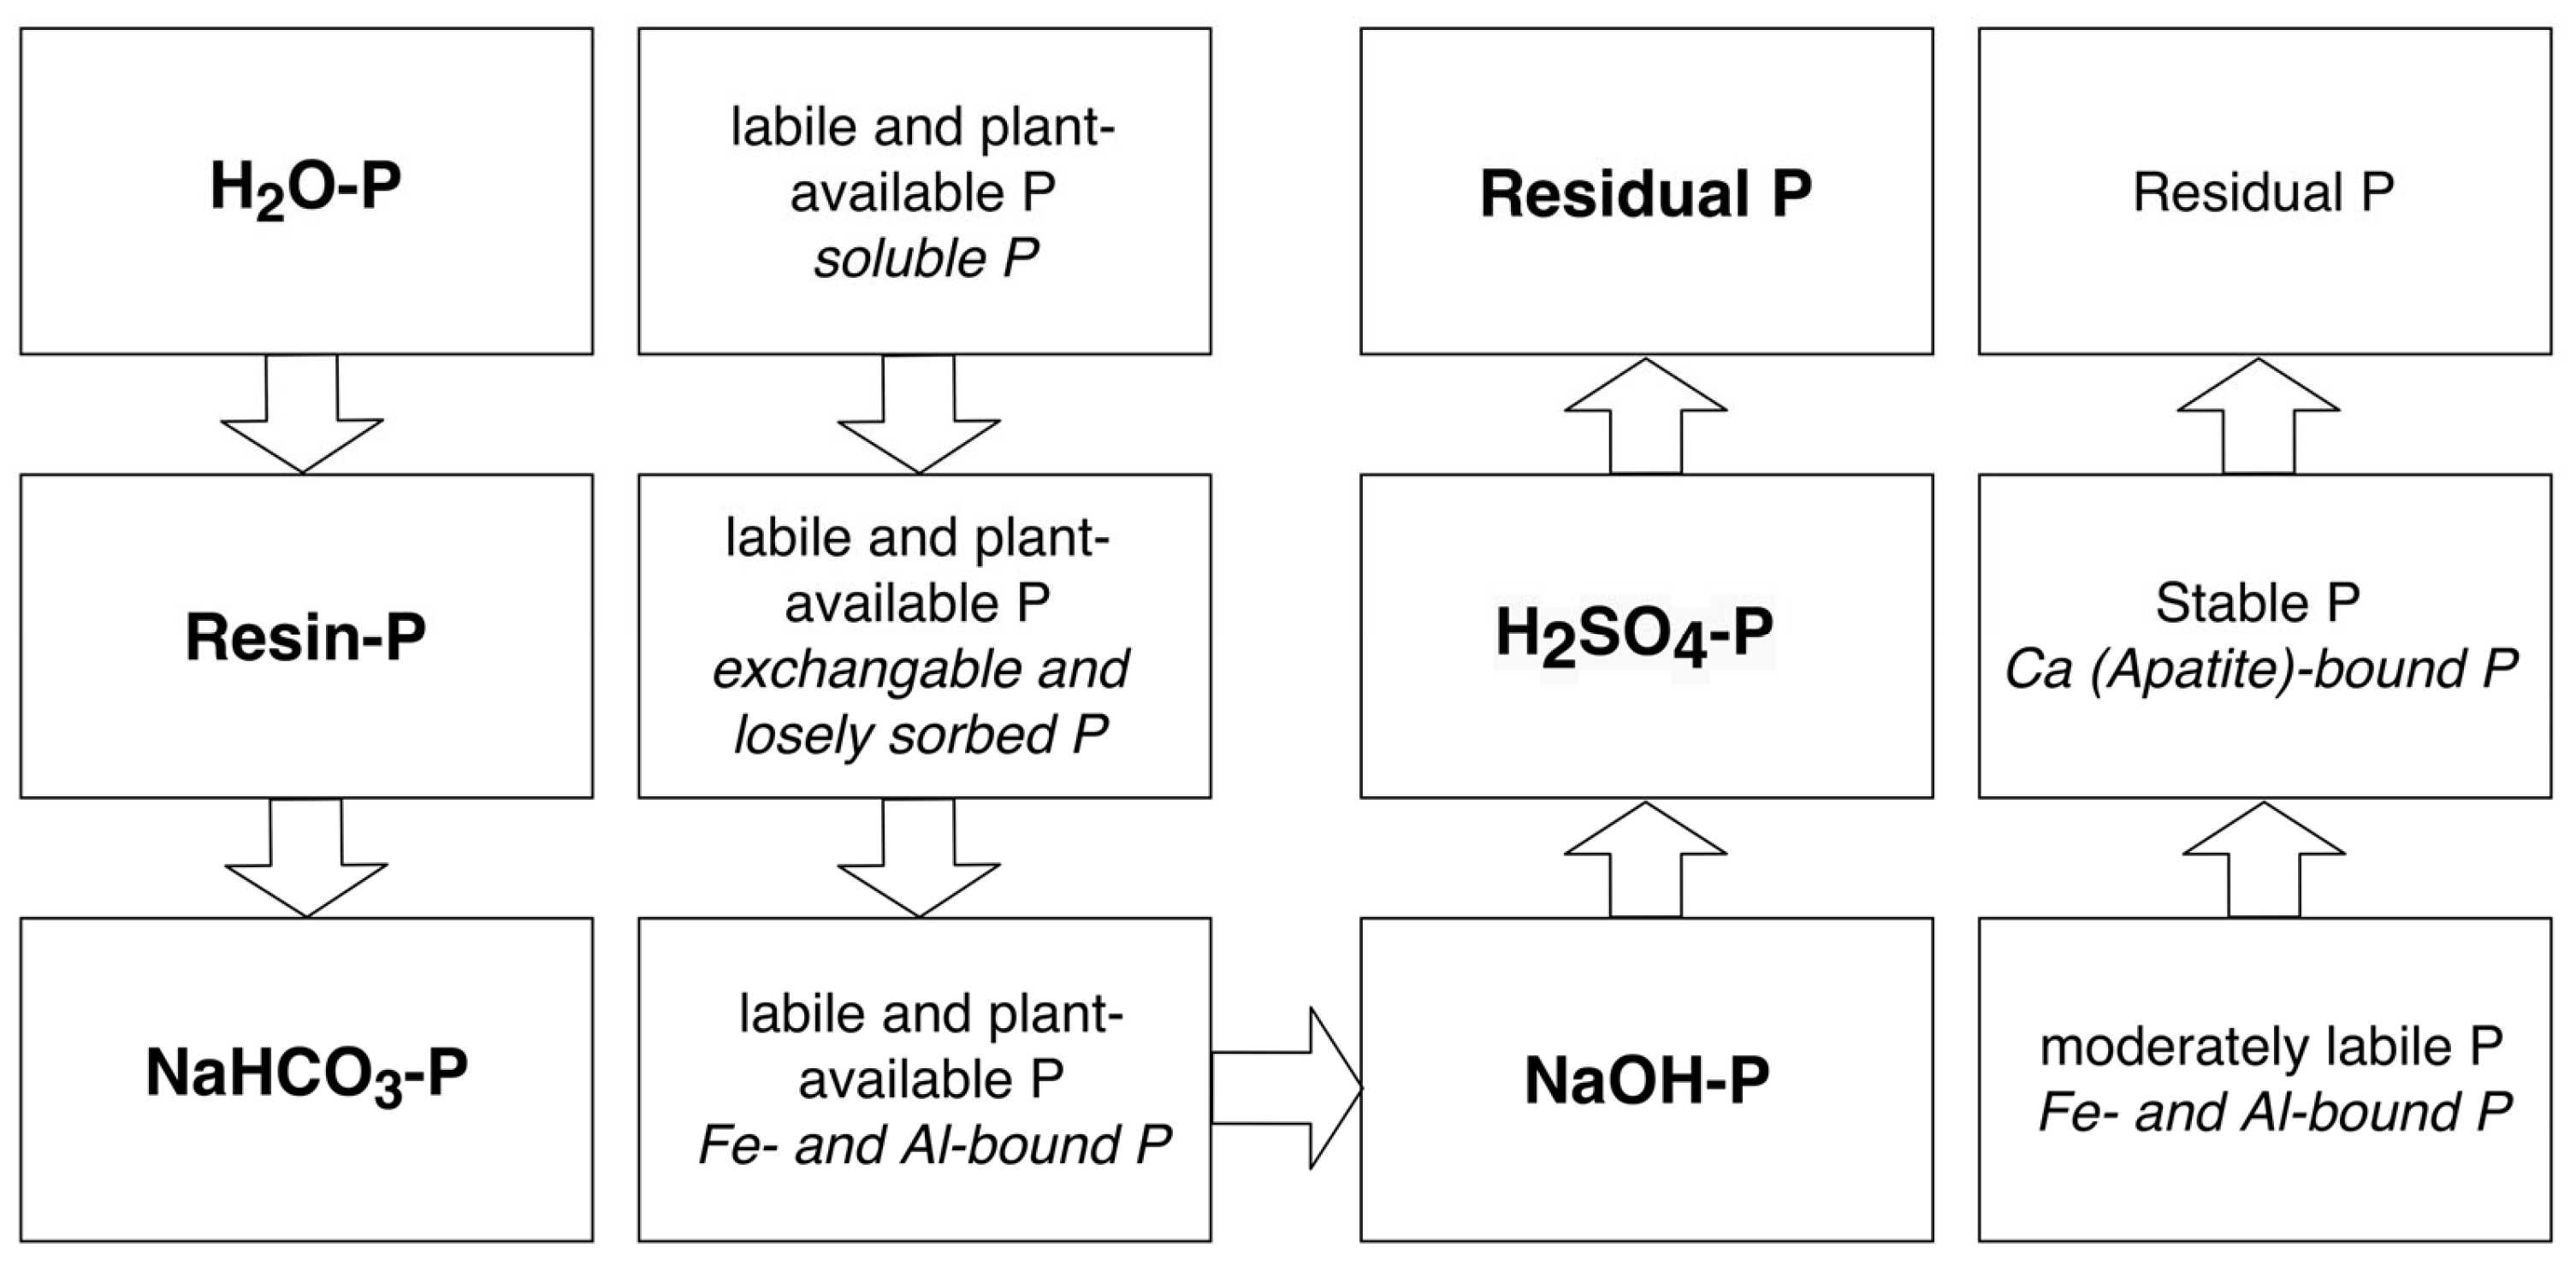
A total of 72 (0–2 and 2–10 cm) sediment samples were analyzed using the Hedley sequential fractionation [18] modified by [32], using extractants with increasing chemical strength (Figure 3). All samples were shaken for 20 min at 4000× g and decanted. We used (1) water, (2) resin strips and 1 M HCl, (3) 0.5 M NaHCO3, (4) 0.1M NaOH, (5) 1 M H2SO4, and (6) HNO3 + 3 HCl (Figure 2) to extract fractions of easily exchangeable and labile, moderately labile and stable P from the sampled sediments. As suggested by [33], the total P (inorganic and organic P of each fraction) concentration of each extractive fraction was measured using an ICP-OES (Optima 8300, Perkin Elmer, Waltham, MA, USA) at wavelength of 214.914 nm. The authors stated that sample treatment (filtration, acidification, and digestion) may have a marked impact on TP concentrations. To achieve better comparability to other local studies, we used the above-mentioned methodological approach that was also used by [17] in the present study.
To better understand the relationship of sediments to adjacent soils, additional reference soil samples were collected from the topsoil (0–0.3 m) and the subsoil (0.3–0.7 m) at four cropland spots in the Zarnow sub-basin. The Zarnow watershed is a representative sub-basin for agriculturally used watersheds in northeastern Germany. The preparation and analysis of the soil samples were consistent with the sediment samples. Three replicate soil samples (a total of 12 samples) were collected at the four spots and were then mixed, homogenized, and sieved with a two-mm mesh size.
Iron (Fe), Aluminium (Al), and Calcium (Ca) content of soils and sediments were measured by aqua regia digestion using an ISP-OES (iCAP 6000, Thermo Fischer Scientific, Waltham, MA, USA). The amounts of organic carbon (COrg) and total N were determined by dry combustion using a CNS analyzer (Vario EL, Elementar Analysensysteme GmbH, Hanau, Germany).
Redox potential, dissolved oxygen, electric conductivity, temperature, and pH of the water column were measured directly at the sampling points with a multi-parameter probe (YSI ProDSS, Eco-Tech, Bonn, Germany). Stream velocity was measured with an inductive flowmeter (Flo-MateTM, Marsh-McBirney, Inc., Frederick, MD, USA) at each sampling point.
A map of wastewater treatment works, and their P load in the effluent of 2014–2016, was provided by the State Department of Environment, Nature Conservation, and Geology of Mecklenburg-Western Pomerania (LUNG-MV).

2.4. Statistical Analysis

One-way analysis of variance (ANOVA) and the Wilcox test were applied to analyze the dataset for differences in means of all P fractions between sediment types and subbasins.
We used a nonmetric multidimensional scaling ordination (NMDS) to depict the relationship between the content of the quantified P fractions and all measured abiotic parameters. The goal of the NMDS is to represent the position of objects in a multidimensional space by using a reduced number of dimensions. Bray-Curtis distances were used to calculate dissimilarities in the data set. The variables used were Fe, Ca, and Al content, C, N, and S content and C:N ratio of the sediment samples, and water level, SO42−, NO3, Cl, PO43−, and TP concentrations, pH, electric conductivity, redox potential in the water column. Additionally, we defined the following land use types: areas of agriculture, forests, areas with artificial drainage, and open water as well as the total catchment area at each sampling point. The catchment area was calculated using ArcGIS 10.8.1 (Environmental Systems Research Institute, ESRI) and the Spatial Analyst extension. Land use data were derived from the Corine Land Cover 2018 [35].
All statistical analyses were performed using R [36] and the additional packages “factoextra” [37] and “ggplot2” [38] and vegan [39].

3. Results and Discussion

3.1. Total P Contents of the Warnow River Basin

The mean (±standard deviation) total P content of the top 2 cm sediment across all sampling points was 698 ± 701 mg P kg−1 sediment−1 with a minimum and maximum of 155 and 2648 mg P kg−1 sediment−1, respectively (Table 1). The mean (±standard deviation, not shown in Table 1) total P content of the 2–10 cm sediment layer across all sampling points was 561 ± 602 mg P kg−1 sediment−1 with a minimum and maximum of 99 and 2182 mg P kg−1 sediment−1, respectively, and, thus, only slightly lower than in the top layer. The mean (± standard deviation), maximum and minimum total P contents of the reference soils were 354 ± 132, 146, and 483 mg P kg−1 soil−1 in the topsoil.
The total P contents at two spots in the northeastern German Recknitz River (approx. 50 km east of the Warnow River Basin) were 912 and 3973 mg P kg−1 sediment−1 and, hence, comparable to our observations [17]. In general, the observed total P contents in our study are within the previously reported ranges of streambed sediments (Table 2). However, the highest concentrations of the recent study and sediments investigated by [17] exceed other observations up to two-fold.
The reference soil samples we analyzed here had lower total P contents but with still in the same order of magnitude. We found similar ranges of total P contents from arable soils in the federal state of Mecklenburg-Western Pomerania [40,41,42].
Table 2. Different total P contents of river ed sediments worldwide.
SourceCatchmentRegionTP Levels
mg P kg−1 Sediment−1
Main Land Use
[17]Recknitz RiverEurope, Northern Germany912–3974Agriculture
[43]River SwaleEurope, England, Yorkshire500–1500Agriculture, Moorland
[11]Sävjaån RiverEurope, central Sweden73–1568Permanent Forest
[44]West Holland RiverNorth America, Canada1600–2000Agriculture
[45]Hadlock BrookNorth America, USA211–223Forest
[46]Agudo RiverSouth America, Brazil, Rio Grande du sol622–992Permanent Forest
[47]Mekong RiverAsia, China, Yunnan Province500–800Non-Agricultural
[12]Yangtze RiverAsia, China,550–844Urban, Agriculture
Ten of the 36 sediment samples from the Warnow River Basin showed P contents ger than 600 mg P kg−1 sediment−1, a threshold for polluted lake sediments [48]. Although threshold values for river sediments are missing, [49] applied them to evaluate riverbed sediments. In each subbasin, elevated P contents were found, which counts as evidence for the large spatial variation.
Interestingly, P levels of sediments tend to exceed P levels of adjacent soils in the watershed. Three mechanisms may cause an accumulation of P in riverine sediments. (a) There are additional P sources in the water system, for instance, point sources such as wastewater treatment works (WWTW). In total, there are 82 WWTWs in the freshwater section of the Warnow River Basin (See Figure 1). The mean (±standard deviation), minimum, and maximum TP loads in the effluent of the WWTWs were 100 ± 137, 0, and 877 kg in the year 2013 (data provided by the State Department of Environment, Nature Conservation, and Geology of Mecklenburg-West Pomerania). However, NMDS (see later) and simple linear regression models did not confirm the idea of a marked contribution of WWTWs to the sediment TP contents. (b) Long-term accumulation of particulate P emitted from agricultural fields. Large amounts of the TP are particulate P [50,51] that tend to sink to the river bed under low hydraulic pressure in lowland river basins. (c) Recently, mobile organic fertilizers such as biogas digestate, slurry, and compost have been increasingly applied to agricultural fields. These more mobile organic fertilizers [52] are likely to bypass the soil matrix by subsurface transport and end up as significant diffuse sources of P, for instance, after heavy rainfall events [53]. Evidence can be found in the literature that tillage orientation [54], rainfall intensity [6,55], slope, and soil moisture conditions may be the cause of an increase in sediment enrichment.
An earlier study from the watershed found that at least 82% of the total phosphorus that has been released into the Baltic Sea in 2013 originated from diffuse sources [6]. Hence, diffuse sources are likely to be the main contributor to the river and sediment P in the Warnow River Basin, which is not prone to intense surface (sediment) runoff.
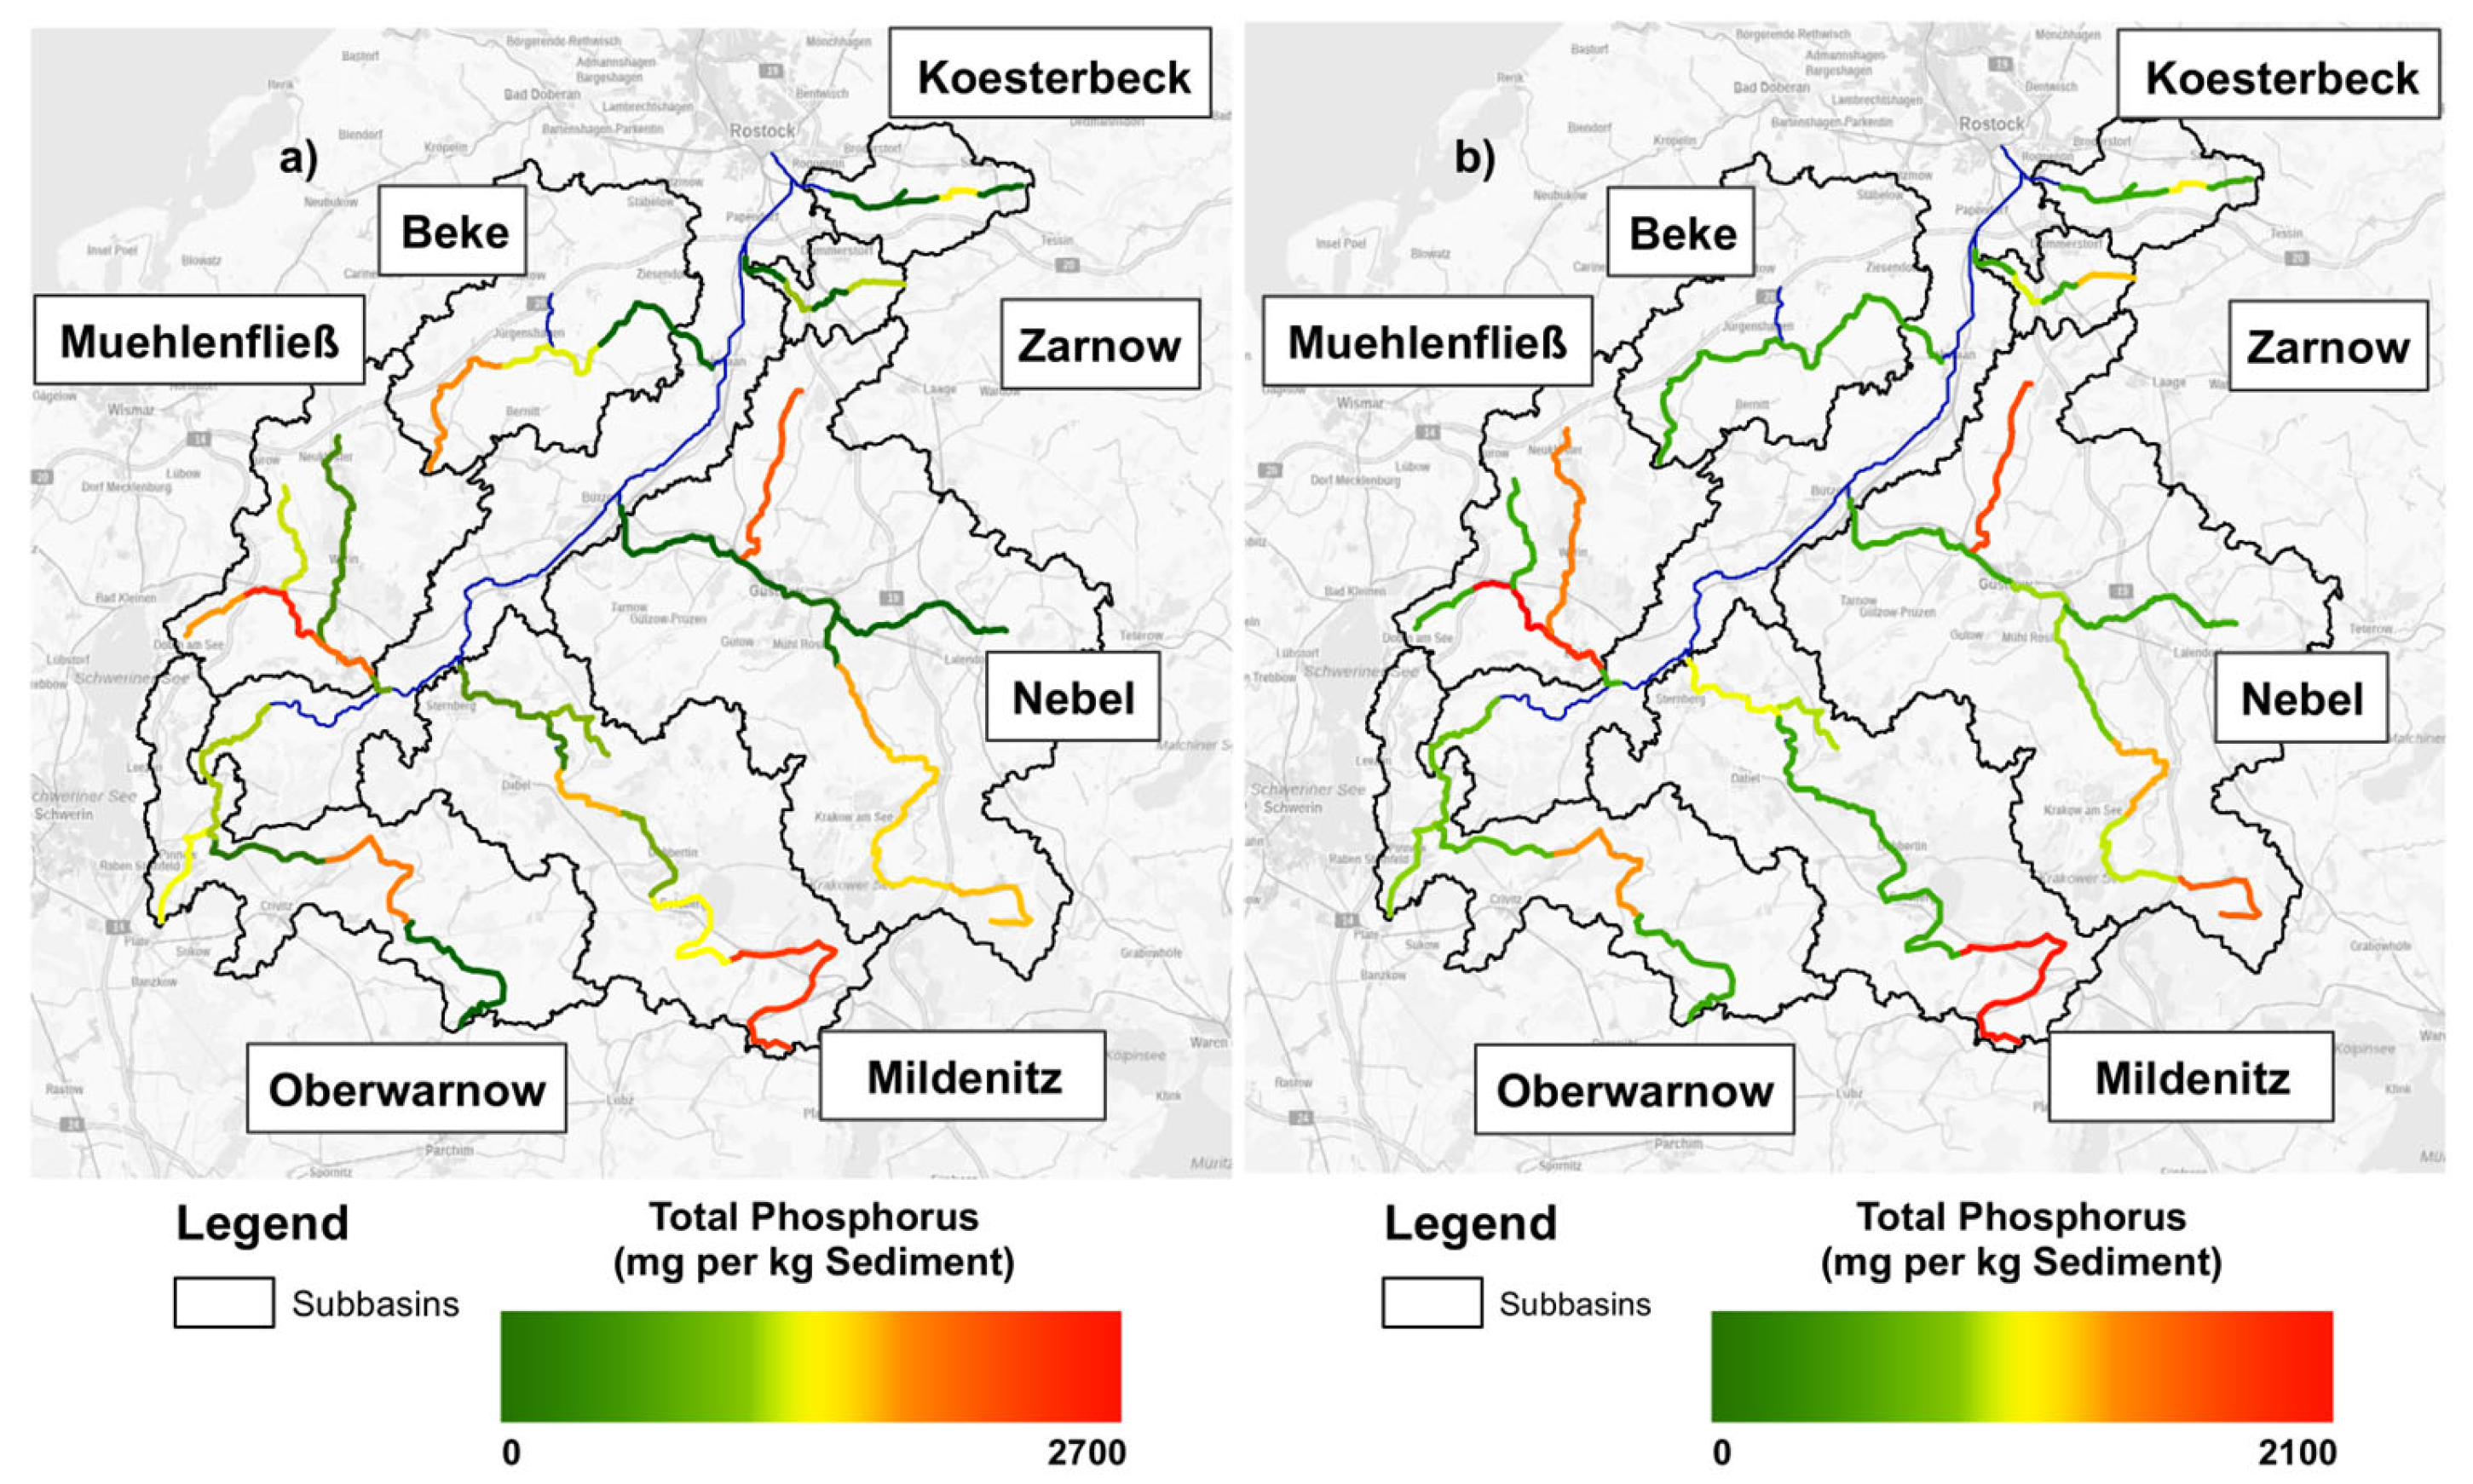
Remarkably, there was no clear detectable spatial trend upstream or downstream (Figure 4). The ten most P-laden spots of all sampling points were located in the sub-basins Muehlenfliess, Nebel, Mildenitz, Zarnow, and Oberwarnow. The lowest P contents were measured in the subbasins Mildenitz, Muehlenfliess, Nebel, and Oberwarnow. A variogram analysis did not reveal any replicable spatial patterns.
A high spatial variability in riverine sediments has been observed earlier in other agriculturally used watersheds in Europe [11,17] and the United States [56,57]. In contrast to our study, a downstream increase in sediment P has been reported for two English catchments [43]. Higher near-outlet P contents were also observed by [11]. This was explained by the integrated signal of both point sources (e.g., wastewater treatment works, farms, greenhouses etc.) and diffuse sources from agriculture [11], as discussed earlier. However, the sediment P distribution maps (Figure 4) suggest that processes such as physical re-suspension or remobilization through redox conditions in low-velocity areas may hamper accumulation to result in the remobilization of sediment P throughout the river continuum. A hierarchical monitoring of P concentrations in the Zarnow sub-basin showed increasing P concentrations with increasing catchment size (unpublished results). This is an indication that re-mobilization occurs along the river system It is known that hydraulic conditions may play a critical role in the stratification of streambed sediments [58,59,60], and hence the resulting P reserves. Simple linear regression models did not endorse this hypothesis. However, the highest TP contents of the sediments were measured at spots with flow velocities below 0.1 m s−1, mostly observed in tributaries. As stated earlier, it is known that high proportions of the total phosphorus load are transported to surface waters as particle-bound P [50,51]. At low flow velocities, this particulate fraction can sink to the riverbed and accumulate over time. Lower TP contents were observed mainstream at higher hydraulic pressure.
It was further shown that the P contents of sediments are highly variable over time in just one growing season [61]. Before and during sediment sampling, the total precipitation was 11.2 mm with no significant precipitation events. Sampling took place before the cultivation of winter wheat, winter barley, and winter rape seed and the application of fertilizers in wide areas of the watershed. We can, therefore, assume that the sediment P contents are not affected by local management operations.

3.2. P Fractionation and Controlling Factors

The most pronounced P fraction is the H2SO4-P (both sediment layers combined) with a mean (±standard deviation), maximum and minimum of 257 ± 67, 628, and 79 mg P kg−1 sediment−1, respectively. At a single sampling point, the most essential P fraction was NaOH-P with a max of 1493 mg P kg−1 sediment−1. The smallest fraction across all sampling points was H2O-P with a mean (±standard deviation), maximum, and minimum of 12 ± 6, 46, and 1 mg P kg−1 sediment−1, respectively.
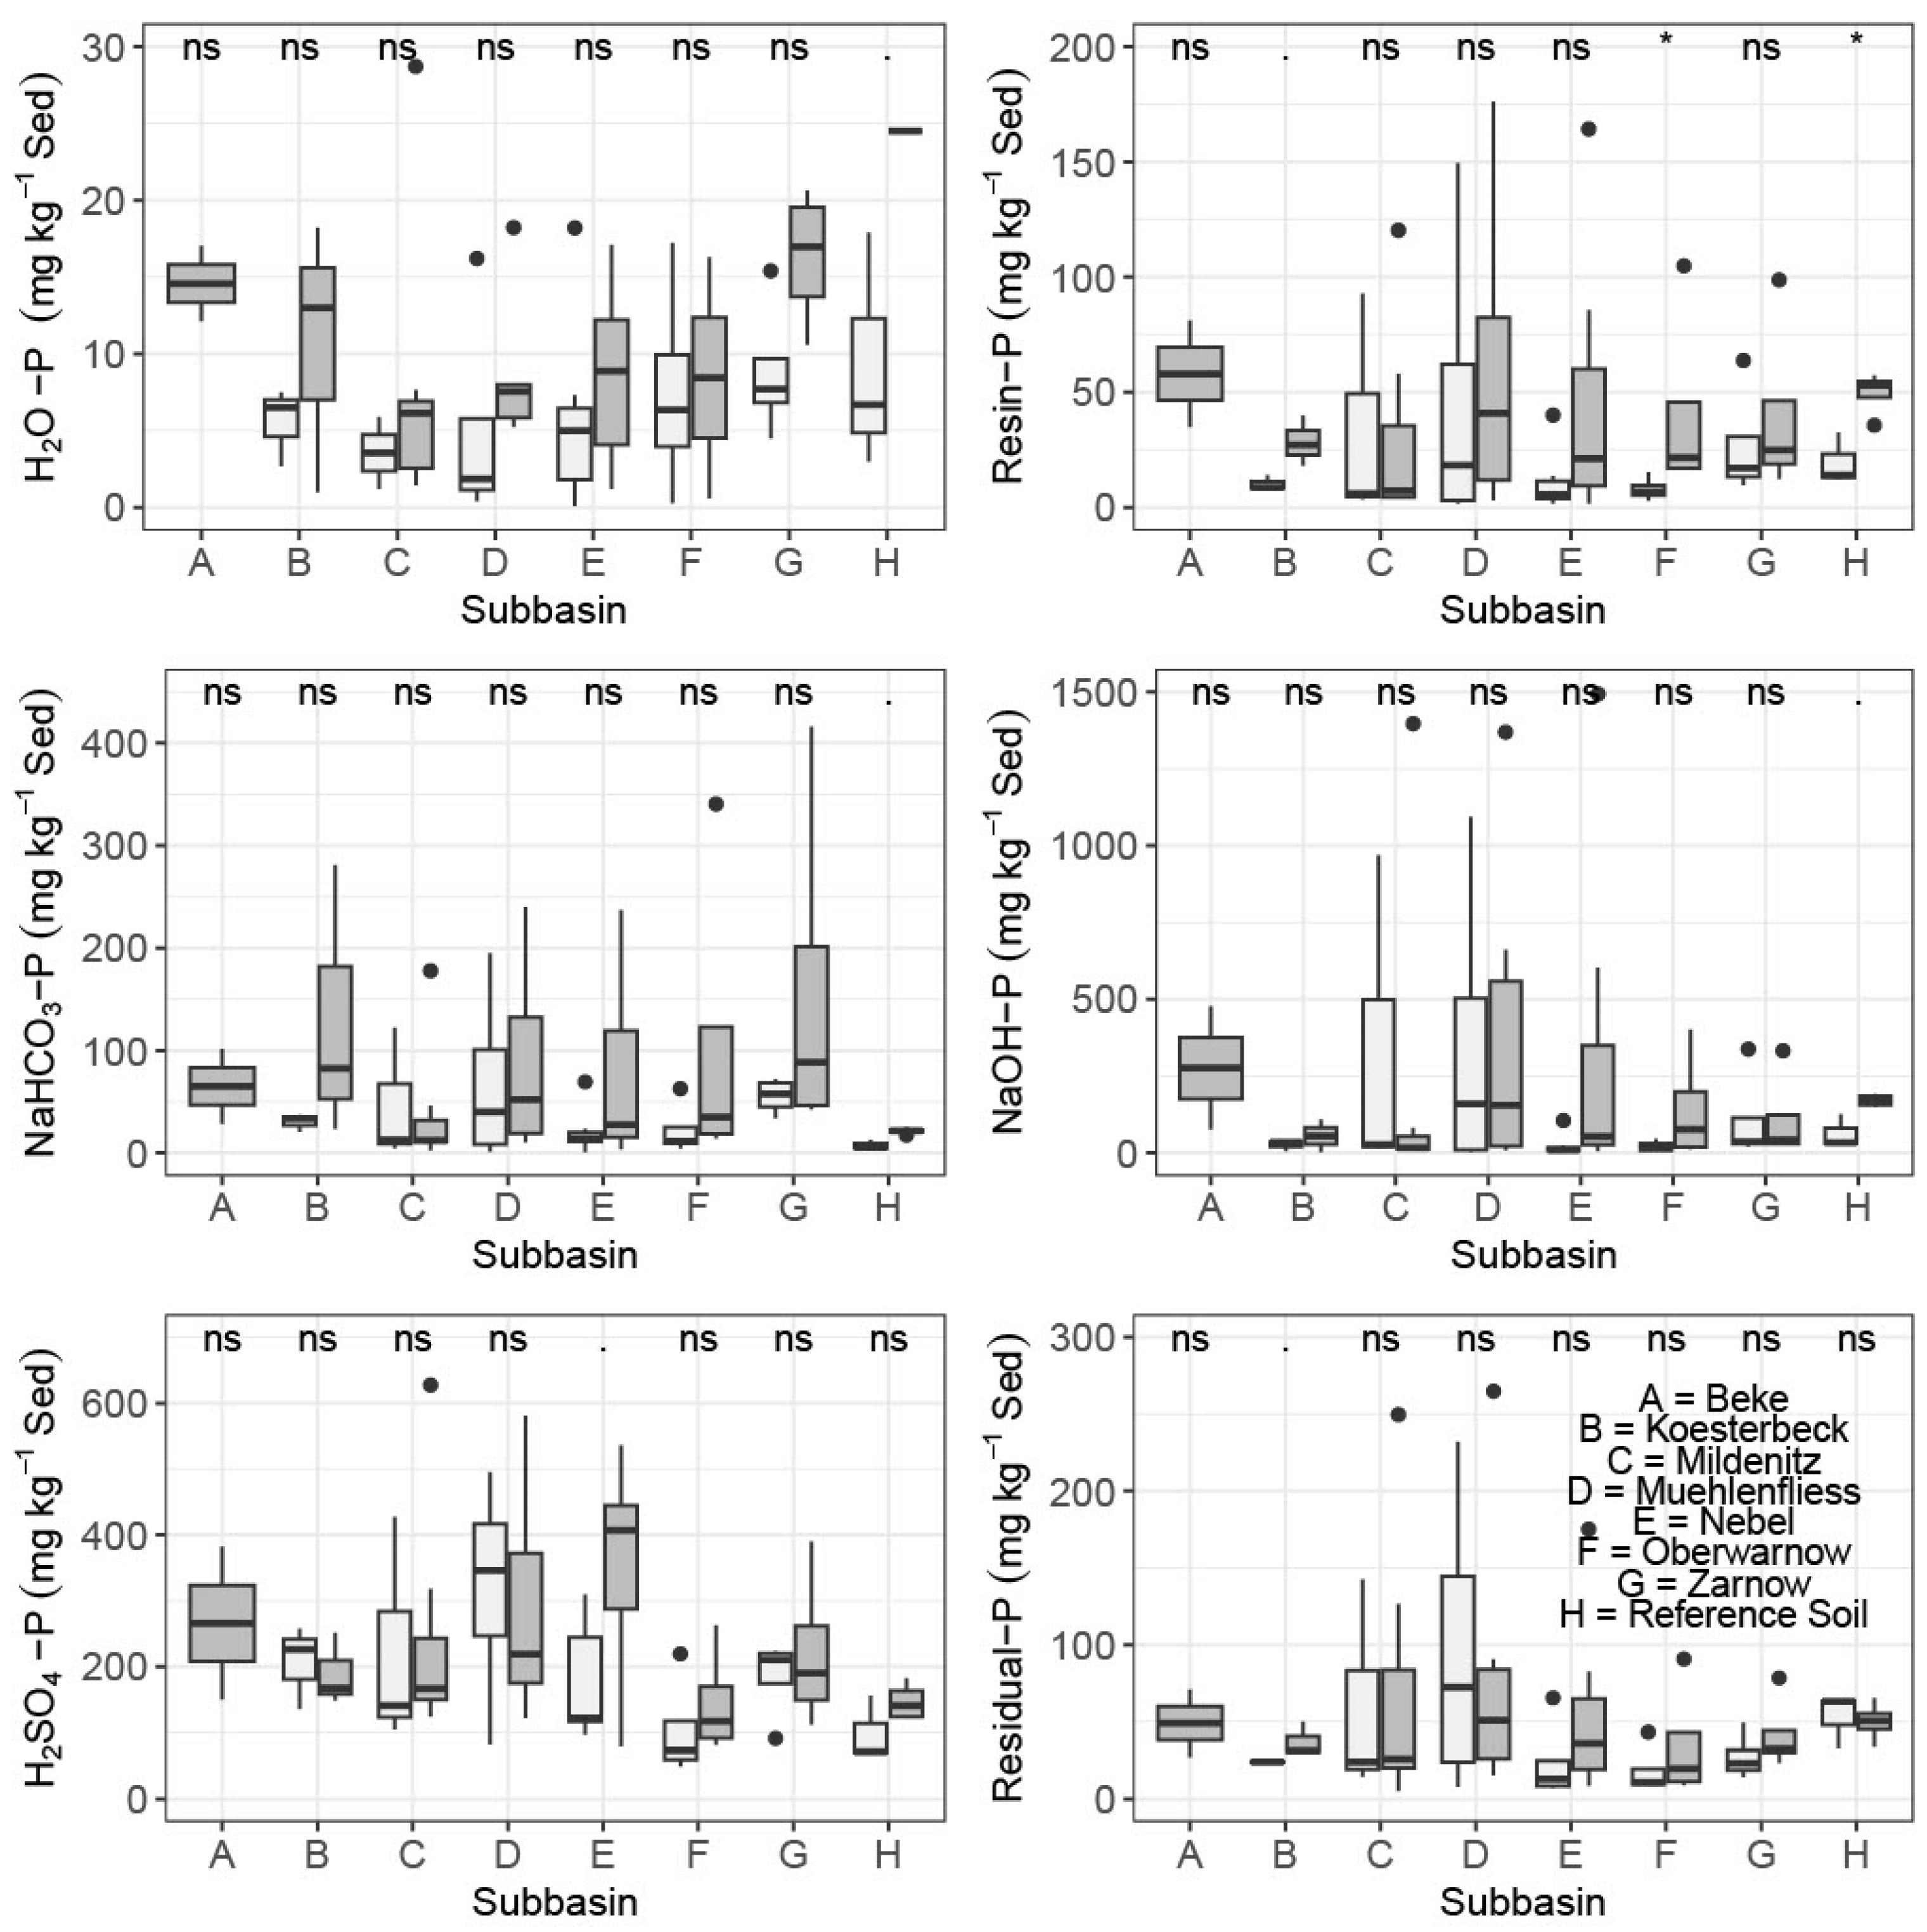
There were differences in the P contents and speciation from 0–2 cm and 2–10 cm between the top and bottom sediment layers (Figure 5), although these differences were statistically insignificant in most cases. Solely, the reference mineral soils showed significant differences in the P fractions between topsoil (0–0.3 m) and subsoil (below 0.3 m) for the labile and moderately labile fractions (H2O-P, Resin-P, NaHCO3-P, and NaOH-P) continuously, but no significant differences between the stable P fractions (H2SO4-P and Residual P). This was most likely caused by differences in soil texture between topsoil and subsoil as well as higher contents of soil organic matter in the topsoil.
There were also no significant differences in the P fractionation from 0–2 cm and 2–10 cm in most of the various sediment types (see Section 2). Only the fine-textured sediments (sand/sill lowland river sediments, sand/sill lowland brook sediments) showed significant differences in the H2O-P-fractions and NaHCO3-P (p < 0.05) between the upper and lower layer.
The results confirmed the dominance of H2SO4- and NaOH-P pools. High levels of moderately labile NaOH-P and stable H2SO4-P fractions were also reported for the nearby Recknitz River sediments [17]. P leaching from agricultural areas was likely to have harmonized the composition of soils and sediments over the last decades. Again, the P composition of the fractions in the sediments reflects the long-built P pools of the parent soil material that is transferred to the streams by surface and subsurface soil erosion. Substantial quantities of the NaOH-P fraction in mineral soils have been presented for many field trials in various climates, geographical regions, and land uses [62]. A substantial presence of NaOH-P (Fe- and Al-bound P, see Figure 3) and H2SO4-P can be explained by the large pools of Fe- and Al-rich clay minerals and calcareous bedrock in northeastern Germany.
Interestingly, the ANOVA revealed no significant differences in the populations of each phosphorus fraction between all sub-basins and all sediment types and between 0–2 cm and 2–10 cm. Additionally, there were no significant differences between the P fractions of the sediments and the observed reference soils. This fact endorses the idea of a minor contribution of WWTWs to the sediment TP contents. Therefore, it can be assumed that the long-term losses of particulate P from agricultural soils in the watershed may be the most significant contributor to the P-pollution of riverine sediments. As a shortcoming of the present study, one has to consider that our soil samples were collected solely in the Zarnow watershed. However, similar total P contents and a marked dominance of Al- and Fe-bound P in agricultural soils have also been shown for other sites in northeastern Germany [40,42].
It became clear that the consideration of total phosphorus (TP) levels alone is not sufficient to evaluate the environmental threat of P-laden river bed sediments, since the mobility and re-solubility of P are not reflected. However, the mobility of P is often a crucial and overseen contributor to river eutrophication [63]. German state agencies rely on sediment TP and water P concentrations to evaluate the quality of a river system. Instead, we recommend taking steady-state and dynamic environmental variables and the fractionation of the P of the sediments into account.
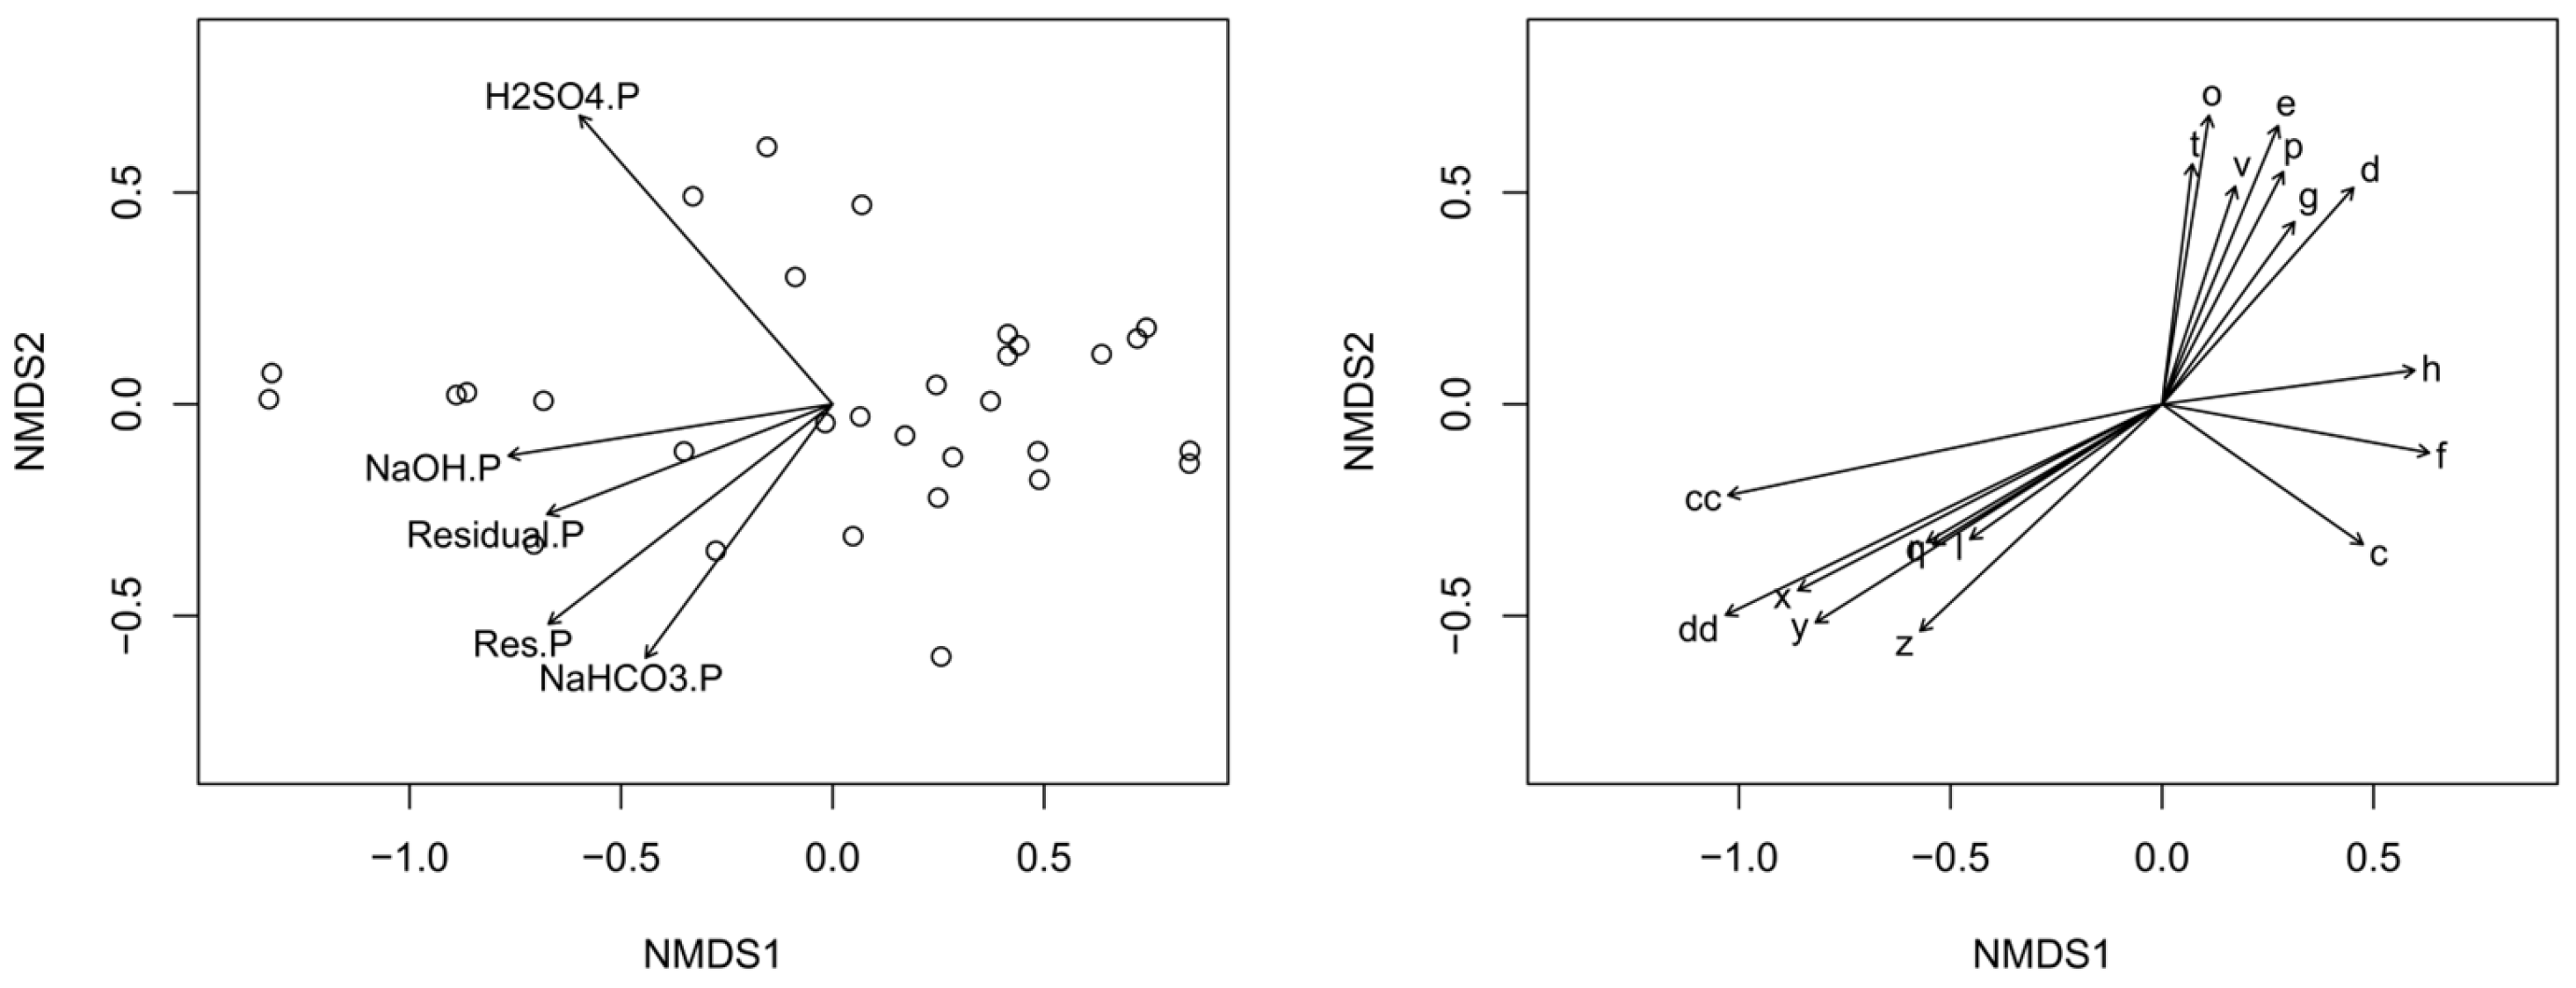
The non-metrical multidimensional scaling (Figure 6) correlates the P fractionation and environmental variables (Table 3). The NMDS stress value was 0.07, which indicates a reliable performance.
The most predictive variables revealed by the NMDS were stationary variables: Fe (R2 = 0.68, p < 0.00) and the Al (R2 = 0.57, p < 0.001) content and carbon (C) (R2 = 0.48, p < 0.001) and N (R2 = 0.48, p < 0.001) content of the sediment. Other important environmental predictors were the sulfur (S) content of the sediment (R2 = 0.32, p < 0.01), the total area of open waters (R2 = 0.26, p < 0.01), the total area of forest (R2 = 0.24, p < 0.05), and the total area of urban structures (R2 = 0.21, p < 0.05) in the watershed. The most predictive non-stationary variables were pH (R2 = 0.25, p < 0.05), electric conductivity, salinity (R2 = 0.21, p < 0.05), and redox potential (R2 = 0.20, p < 0.05).
The high explanatory power of Fe and Al seems reasonable, with a large proportion of Fe and Al-bound NaOH-P in all observed subbasins (see Figure 4). This reflects the origin of the soils and sediments in the Warnow watershed from till formed in the Weichselian glaciation. In northern German Watersheds, large amounts of Fe and Fe-bound P can be released to surface waters during storm events by artificial drainage [55]. This is supported by [11] who found Fe- and Al-bound P strongly correlated with the spatial abundance of agricultural areas in the watershed. The marked presence of Fe- and Al-bound P implies that the P might not be directly available. However, as Fe-P is a strongly redox-sensitive fraction, periods of low oxygen concentrations and negative redox potentials bare the highest risk of P release from the sediment to the water column. This is confirmed in the literature [64] and in our data set, where the highest concentrations of dissolved P were detected at spots with low oxygen concentrations (logarithmic function PO4 = 0.057 ln(DO) + 0.1462, p < 0.001, R2 = 0.46).
We assume that, although static variables are the best predictors in our case, the erraticism of variables such as discharge, redox potential, or flow velocity/hydraulic pressure will markedly affect the P fractionation of river bed sediments over time. However, the low explanatory power of non-stationary variables can be attributed to their high temporal variability and the complexity of sediment-related processes (e.g., nutrient concentration, temperature, conductivity, redox potential).
The potential of the release of mobile P fractions within one growing season was shown in sediments of a eutrophic lake in Southern China [61]. High temporal variability in the fractionation of P was also reported for Lake Kinneret [65]. Taking the long water residence times into account, one could assume that with shorter residence time and higher hydraulic pressure during runoff events, the P fractionation in rivers might change even more severely with time. Thus, we recommend studying the temporal variation of P in sediments in diverse river systems to assess the eutrophication potential of riverbed sediments.
The NMDS revealed that the parent soil material and land use contributed significantly to the formation of the P fractionation of riverine sediments in the Warnow River Basin. This is a decade-long process. We believe that the formation of the sediments is primarily caused by surface and sub-surface suspended sediment released from agricultural areas. Interestingly, the area of tile drainage from agricultural fields was no significant predictor in the NMDS, although the importance of tile drainage as a contributor to (suspended) sediment P was often emphasized [55,66,67]. Neither the size of the contributing catchment nor the length of the considered waterway have a statistically significant impact on the P loading.

4. Conclusions

Riverine sediments play an essential role in the P cycle of agricultural landscapes. Sediments can store considerable amounts of P in watersheds. Even though the P inputs to rivers from agriculture have decreased since the 1990s, the burden of prior land use and long periods of leaching untreated wastewater from households and industry will impair water quality over the coming decades.
We could demonstrate that the fractionation of the sediment P reflects the fractionation of the agriculturally used soils in the watershed, underlining that land use has a prominent impact on the P content of the sediment. Moderately labile and stable P fractions are dominant in both soils and sediments, which implies a potential risk for a re-suspension and re-release of stored sediment P. Thus, the mitigation of remobilization of the stored P is a major future task for stakeholders and water management agencies.
For the investigated lowland river basin, no influence of hydraulic parameters on sediment P could be demonstrated, which we attribute to the overall low hydraulic gradients in the system. Furthermore, both the area of the catchment and the length of the waterway had, likewise, no impact on the P content of the sediment. The content of iron and aluminum is the best predictor for sediment P, suggesting that periods of low oxygen concentrations and negative redox potentials bear the highest risk of P release from the sediment to the water column. Even though the inputs of P from agriculture have declined over the past decades, the legacy P from river bed sediments will be environmentally available by remobilization for a long time. This has to be considered to secure future freshwater supply in the Warnow River Basin and other agriculturally used lowland river basins. Furthermore, remobilized sediment P can be transferred directly to the Baltic Sea and possibly accelerate eutrophication. We suggest taking sediment into account for the modelling of watershed P cycling and also for P monitoring of rivers.

Author Contributions

All authors contributed to the study conception and design. Material preparation, data collection and analysis were performed by S.K., E.I.R. and B.L. The first draft of the manuscript was written by S.K. and all authors commented on previous versions of the manuscript. All authors have read and agreed to the published version of the manuscript.

Funding

This work was supported by the German Federal Ministry of Education and Research (BMBF) (Grant numbers 031A558 and 031B0509D).

Data Availability Statement

All data will be available at the Bonares Data Centre after publication of the manuscript. (https://www.bonares.de/datacentre, accessed on 27 February 2023).

Acknowledgments

We kindly like to acknowledge the laboratory work of André Aksel, Elena Heilmann, Evelyn Bolzmann, and the LUFA Rostock. We also like to thank Franziska Bitschofsky and biota-Institut für ökologische Forschung und Planung.

Conflicts of Interest

All authors have no conflict of interest to disclose. The Authors declare they have no financial interest. The authors have no relevant financial or non-financial interest to disclose. The authors have no competing interests to declare that are relevant to the content of this article. Stefan Koch received funding by the German Federal Ministry of Education and Research (BMBF) (Grant numbers 031A558 and 031B0509D).

References

  1. Rowe, H.; Withers, P.J.A.; Baas, P.; Chan, N.I.; Doody, D.; Holiman, J.; Jacobs, B.; Li, H.; MacDonald, G.K.; McDowell, R.; et al. Integrating legacy soil phosphorus into sustainable nutrient management strategies for future food, bioenergy and water security. Nutr. Cycl. Agroecosyst. 2016, 104, 393–412. [Google Scholar] [CrossRef]
  2. Cordell, D.; Drangert, J.-O.J.O.; White, S. The story of phosphorus: Global food security and food for thought. Glob. Environ. Chang. 2009, 19, 292–305. [Google Scholar] [CrossRef]
  3. Smith, V. Eutrophication of freshwater and coastal marine ecosystems a global problem. Environ. Sci. Pollut. Res. 2003, 10, 126–139. [Google Scholar] [CrossRef] [PubMed]
  4. Mccrackin, M.L.; Muller-Karulis, B.; Gustafsson, B.G.; Howarth, R.W.; Humborg, C.; Svanbäck, A.; Swaney, D.P. A Century of Legacy Phosphorus Dynamics in a Large Drainage Basin. Glob. Biogeochem. Cycles 2018, 32, 1107–1122. [Google Scholar] [CrossRef]
  5. Ekholm, P.; Rankinen, K.; Rita, H.; Räike, A.; Sjöblom, H.; Raateland, A.; Vesikko, L.; Cano Bernal, J.E.; Taskinen, A. Phosphorus and nitrogen fluxes carried by 21 Finnish agricultural rivers in 1985–2006. Environ. Monit. Assess. 2015, 187, 216. [Google Scholar] [CrossRef]
  6. Koch, S.; Kahle, P.; Lennartz, B. Spatio-temporal analysis of phosphorus concentrations in a North-Eastern German lowland watershed. J. Hydrol. Reg. Stud. 2018, 15, 203–216. [Google Scholar] [CrossRef]
  7. Sharpley, A.N.; Jarvie, H.P.; Buda, A.; May, L.; Spears, B.; Kleinman, P. Phosphorus Legacy: Overcoming the Effects of Past Management Practices to Mitigate Future Water Quality Impairment. J. Environ. Qual. 2013, 42, 1308–1326. [Google Scholar] [CrossRef] [Green Version]
  8. Haygarth, P.M.; Jarvie, H.P.; Powers, S.M.; Sharpley, A.N.; Elser, J.J.; Shen, J.; Peterson, H.M.; Chan, N.I.; Howden, N.J.K.; Burt, T.; et al. Sustainable phosphorus management and the need for a long-term perspective: The legacy hypothesis. Environ. Sci. Technol. 2014, 48, 8417–8419. [Google Scholar] [CrossRef]
  9. Powers, S.M.; Bruulsema, T.W.; Burt, T.P.; Chan, N.I.; Elser, J.J.; Haygarth, P.M.; Howden, N.J.K.; Jarvie, H.P.; Lyu, Y.; Peterson, H.M.; et al. Long-term accumulation and transport of anthropogenic phosphorus in three river basins. Nat. Geosci. 2016, 9, 353–356. [Google Scholar] [CrossRef]
  10. Jarvie, H.P.; Sharpley, A.N.; Brahana, V.; Simmons, T.; Price, A.; Neal, C.; Lawlor, A.J.; Sleep, D.; Thacker, S.; Haggard, B.E. Phosphorus retention and remobilization along hydrological pathways in karst terrain. Environ. Sci. Technol. 2014, 48, 4860–4868. [Google Scholar] [CrossRef] [Green Version]
  11. Lannergård, E.E.; Agstam-Norlin, O.; Huser, B.J.; Sandström, S.; Rakovic, J.; Futter, M.N. New Insights Into Legacy Phosphorus From Fractionation of Streambed Sediment. J. Geophys. Res. Biogeosci. 2020, 125, e2020JG005763. [Google Scholar] [CrossRef]
  12. Jin, X.; He, Y.; Kirumba, G.; Hassan, Y.; Li, J. Phosphorus fractions and phosphate sorption-release characteristics of the sediment in the Yangtze River estuary reservoir. Ecol. Eng. 2013, 55, 62–66. [Google Scholar] [CrossRef]
  13. Temporetti, P.; Beamud, G.; Nichela, D.; Baffico, G.; Pedrozo, F. The effect of pH on phosphorus sorbed from sediments in a river with a natural pH gradient. Chemosphere 2019, 228, 287–299. [Google Scholar] [CrossRef]
  14. Rydin, E. Potentially mobile phosphorus in Lake Erken sediment. Water Res. 2000, 34, 2037–2042. [Google Scholar] [CrossRef]
  15. Levy, E.T.; Schlesinger, W.H. A comparison of fractionation methods for forms of phosphorus in soils. Biogeochemistry 1999, 47, 25–38. [Google Scholar] [CrossRef]
  16. Bauke, S.L.; Landl, M.; Koch, M.; Hofmann, D.; Nagel, K.A.; Siebers, N.; Schnepf, A.; Amelung, W. Macropore effects on phosphorus acquisition by wheat roots—A rhizotron study. Plant Soil 2017, 416, 67–82. [Google Scholar] [CrossRef]
  17. Prüter, J.; Leipe, T.; Michalik, D.; Klysubun, W.; Leinweber, P. Phosphorus speciation in sediments from the Baltic Sea, evaluated by a multi-method approach. J. Soils Sediments 2020, 20, 1676–1691. [Google Scholar] [CrossRef]
  18. Hedley, M.J.; Stewart, J.W.B.; Chauhan, B.S. Changes in Inorganic and Organic Soil Phosphorus Fractions Induced by Cultivation Practices and by Laboratory Incubations. Soil Sci. Soc. Am. J. 1982, 46, 970–976. [Google Scholar] [CrossRef]
  19. Bol, R.; Julich, D.; Brödlin, D.; Siemens, J.; Kaiser, K.; Dippold, M.A.; Spielvogel, S.; Zilla, T.; Mewes, D.; von Blanckenburg, F.; et al. Dissolved and colloidal phosphorus fluxes in forest ecosystems—An almost blind spot in ecosystem research. J. Plant Nutr. Soil Sci. 2016, 179, 425–438. [Google Scholar] [CrossRef] [Green Version]
  20. Bauke, S.L.; von Sperber, C.; Siebers, N.; Tamburini, F.; Amelung, W. Biopore effects on phosphorus biogeochemistry in subsoils. Soil Biol. Biochem. 2017, 111, 157–165. [Google Scholar] [CrossRef]
  21. Leinweber, P. Phosphorus fractions in soils from an area with high density of livestock population. Z. Pflanz. Bodenkd. 1996, 159, 251–256. [Google Scholar] [CrossRef]
  22. Guo, F.; Yost, R.S.; Hue, N.V.; Evensen, C.I.; Silva, J.A. Changes in Phosphorus Fractions in Soils under Intensive Plant Growth. Soil Sci. Soc. Am. J. 2000, 64, 1681–1689. [Google Scholar] [CrossRef]
  23. Sharpley, A.N.; Mcdowell, R.W.; Kleinman, P.J.A. Amounts, Forms, and Solubility of Phosphorus in Soils Receiving Manure. Soil Sci. Soc. Am. J. 2004, 68, 2048–2057. [Google Scholar] [CrossRef] [Green Version]
  24. Fytianos, K.; Kotzakioti, A. Sequential fractionation of phosphorus in lake sediments of Northern Greece. Environ. Monit. Assess. 2005, 100, 191–200. [Google Scholar] [CrossRef] [PubMed]
  25. Tu, L.; Jarosch, K.A.; Schneider, T.; Grosjean, M. Phosphorus fractions in sediments and their relevance for historical lake eutrophication in the Ponte Tresa basin (Lake Lugano, Switzerland) since 1959. Sci. Total Environ. 2019, 685, 806–817. [Google Scholar] [CrossRef] [PubMed]
  26. Neal, C.; Heathwaite, A.L. Nutrient mobility within river basins: A European perspective. J. Hydrol. 2005, 304, 477–490. [Google Scholar] [CrossRef]
  27. Selig, U.; Schlungbaum, G. Longitudinal patterns of phosphorus and phosphorus binding in sediment of a lowland lake-river system. Hydrobiologia 2002, 472, 67–76. [Google Scholar] [CrossRef]
  28. Koch, F.; Küchler, A.; Mehl, D.; Hoffmann, T.G. Ermittlung von Art und Intensität Künstlicher Entwässerung von Landwirtschaftlichen Nutzflächen in Mecklenburg-Vorpommern. In Aktuelle Probleme im Wasserhaushalt von Nordostdeutschland: Trends, Ursachen, Lösungen; Scientific Technical Report 10/10; Deutsches GeoForschungsZentrum: Potsdam, Germany, 2010. [Google Scholar]
  29. Koch, S.; Bauwe, A.; Lennartz, B. Application of the SWAT Model for a Tile-Drained Lowland Catchment in North-Eastern Germany on Subbasin Scale. Water Resour. Manag. 2013, 27, 791–805. [Google Scholar] [CrossRef]
  30. Bitschofsky, F.; Nausch, M. Spatial and seasonal variations in phosphorus speciation along a river in a lowland catchment (Warnow, Germany). Sci. Total Environ. 2019, 657, 671–685. [Google Scholar] [CrossRef]
  31. Thiele, V.; Degen, B.; Kasper, D. Erarbeitung Einer Methodik zur Fließgewässerstrukturgütekartierung in Mecklenburg-Vorpommern. Endbericht. Landesamt für Umwelt, Naturschutz und Geologie Mecklenburg-Vorpommern: Güstrow, Germany, 2010. [Google Scholar]
  32. Tiessen, H.; Moir, J.O. Characterization of available P by sequential extraction. In Soil Sampling and Methods of Analysis; Carter, M.R., Ed.; Canadian Society of Soil Science: Boca Raton, FL, USA, 1993; pp. 75–86. [Google Scholar]
  33. Do Nascimento, C.A.C.; Pagliari, P.H.; Schmitt, D.; He, Z.; Waldrip, H. Phosphorus concentrations in sequentially fractionated soil samples as affected by digestion methods. Sci. Rep. 2015, 5, 17967. [Google Scholar] [CrossRef] [Green Version]
  34. Ruttenberg, K.C. Development of a sequential extraction method for different forms of phosphorus in marine sediments. Limnol. Oceanogr. 1992, 37, 1460–1482. [Google Scholar] [CrossRef]
  35. Copernicus. CLC 2018—Copernicus Land Monitoring Service. Available online: https://land.copernicus.eu/pan-european/corine-land-cover/clc2018 (accessed on 26 August 2022).
  36. R Core Development Team. R: A Language and Environment for Statistical Computing; R Core Development Team: Vienna, Austria, 2019. [Google Scholar]
  37. Kassambara, A.; Mundt, F. Factoextra: Extract and Visualize the Results of Multivariate Data Analyses 2020. Available online: https://CRAN.R-project.org/package=factoextra (accessed on 9 September 2021).
  38. Wickham, H. ggplot2: Elegant Graphics for Data Analysis; Springer: New York, NY, USA, 2016. [Google Scholar] [CrossRef]
  39. Oksanen, J.; Blanchet, F.B.; Friendly, M.; Kindt, R.; Simpson, G.L.; McGlinn, D.; Minchin, P.R.; O’Hara, R.B.; Solymos, P.; Stevens, M.H.H.; et al. vegan: Community Ecology Package 2020. Available online: https://CRAN.R-project.org/package=vegan (accessed on 9 September 2021).
  40. Prüter, J.; McLaren, T.I.; Pätzig, M.; Hu, Y.; Leinweber, P. Phosphorus Speciation Along a Soil to Kettle Hole Transect: Sequential P Fractionation, P Xanes, and 31p Nmr Spectroscopy. SSRN Electron. J. 2022, 429, 116215. [Google Scholar] [CrossRef]
  41. Prüter, J.; Schumann, R.; Klysubun, W.; Leinweber, P. Characterization of Phosphate Compounds along a Catena from Arable and Wetland Soil to Sediments in a Baltic Sea lagoon. Soil Syst. 2023, 7, 15. [Google Scholar] [CrossRef]
  42. Baumann, K.; Shaheen, S.M.; Hu, Y.; Gros, P.; Heilmann, E.; Morshedizad, M.; Wang, J.; Wang, S.L.; Rinklebe, J.; Leinweber, P. Speciation and sorption of phosphorus in agricultural soil profiles of redoximorphic character. Environ. Geochem. Health 2020, 42, 3231–3246. [Google Scholar] [CrossRef] [Green Version]
  43. Owens, P.N.; Walling, D.E. The phosphorus content of fluvial sediment in rural and industrialized river basins. Water Res. 2002, 36, 685–701. [Google Scholar] [CrossRef]
  44. Audette, Y.; O’Halloran, I.P.; Nowell, P.M.; Dyer, R.; Kelly, R.; Voroney, R.P. Speciation of Phosphorus from Agricultural Muck Soils to Stream and Lake Sediments. J. Environ. Qual. 2018, 47, 884–892. [Google Scholar] [CrossRef]
  45. SanClements, M.D.; Fernandez, I.J.; Norton, S.A. Soil and sediment phosphorus fractions in a forested watershed at Acadia National Park, ME, USA. For. Ecol. Manag. 2009, 258, 2318–2325. [Google Scholar] [CrossRef]
  46. Tiecher, T.; Schenato, R.B.; Santanna, M.A.; Caner, L.; dos Santos, D.R. Phosphorus forms in sediments as indicators of anthropic pressures in an agricultural catchment in Southern Brazil. Rev. Bras. Cienc. Solo 2017, 41, e0160569. [Google Scholar] [CrossRef] [Green Version]
  47. Liu, Q.; Liu, S.; Zhao, H.; Deng, L.; Wang, C.; Zhao, Q.; Dong, S. The phosphorus speciations in the sediments up- and down-stream of cascade dams along the middle Lancang River. Chemosphere 2015, 120, 653–659. [Google Scholar] [CrossRef]
  48. Persaud, D.; Jaagumagi, R.; Hayton, A. Guidelines for the Protection and Management of Aquatic Sediment Quality in Ontario Ministry of Environment and Energy; Ontario Ministry of the Environment: Toronto, ON, Canada, 1993. [Google Scholar]
  49. Katsaounos, C.Z.; Giokas, D.L.; Leonardos, I.D.; Karayannis, M.I. Speciation of phosphorus fractionation in river sediments by explanatory data analysis. Water Res. 2007, 41, 406–418. [Google Scholar] [CrossRef]
  50. Tiemeyer, B.; Kahle, P.; Lennartz, B. Phosphorus losses from an artificially drained rural lowland catchment in North-Eastern Germany. Agric. Water Manag. 2009, 96, 677–690. [Google Scholar] [CrossRef]
  51. Sandström, S.; Futter, M.N.; Kyllmar, K.; Bishop, K.; O’Connell, D.W.; Djodjic, F. Particulate phosphorus and suspended solids losses from small agricultural catchments: Links to stream and catchment characteristics. Sci. Total Environ. 2020, 711, 134616. [Google Scholar] [CrossRef] [PubMed]
  52. Darch, T.; Blackwell, M.S.A.; Hawkins, J.M.B.; Haygarth, P.M.; Chadwick, D. A meta-analysis of organic and inorganic phosphorus in organic fertilizers, soils, and water: Implications for water quality. Crit. Rev. Environ. Sci. Technol. 2014, 44, 2172–2202. [Google Scholar] [CrossRef]
  53. Koch, S.; Kahle, P.; Lennartz, B. Biogas Digestate Application Modifies Solute Transport Conditions in Soils and Increases the Release of Phosphorus. Vadose Zone J. 2019, 18, 1–8. [Google Scholar] [CrossRef] [Green Version]
  54. Wacha, K.M.; Papanicolaou, A.N.T.; Abban, B.K.; Wilson, C.G.; Giannopoulos, C.P.; Hou, T.; Filley, T.R.; Hatfield, J.L. The impact of tillage row orientation on physical and chemical sediment enrichment. Agrosyst. Geosci. Environ. 2020, 3, e20007. [Google Scholar] [CrossRef] [Green Version]
  55. Zimmer, D.; Kahle, P.; Baum, C. Loss of soil phosphorus by tile drains during storm events. Agric. Water Manag. 2016, 167, 21–28. [Google Scholar] [CrossRef]
  56. Fox, G.A.; Purvis, R.A.; Penn, C.J. Streambanks: A net source of sediment and phosphorus to streams and rivers. J. Environ. Manag. 2016, 181, 602–614. [Google Scholar] [CrossRef] [PubMed] [Green Version]
  57. Williamson, T.N.; Christensen, V.G.; Richardson, W.B.; Frey, J.W.; Gellis, A.C.; Kieta, K.A.; Fitzpatrick, F.A. Stream Sediment Sources in Midwest Agricultural Basins with Land Retirement along Channel. J. Environ. Qual. 2014, 43, 1624–1634. [Google Scholar] [CrossRef]
  58. Zhang, K.; Cheng, P.D.; Zhong, B.C.; Wang, D.Z. Total phosphorus release from bottom sediments in flowing water. J. Hydrodyn. 2012, 24, 589–594. [Google Scholar] [CrossRef]
  59. Park, J.; Batalla, R.J.; Birgand, F.; Esteves, M.; Gentile, F.; Harrington, J.R.; Navratil, O.; López-Tarazón, J.A.; Vericat, D. Influences of catchment and river channel characteristics on the magnitude and dynamics of storage and re-suspension of fine sediments in river beds. Water 2019, 11, 878. [Google Scholar] [CrossRef] [Green Version]
  60. Eder, A.; Exner-Kittridge, M.; Strauss, P.; Blöschl, G. Re-suspension of bed sediment in a small stream &ndash; Results from two flushing experiments. Hydrol. Earth Syst. Sci. 2014, 18, 1043–1052. [Google Scholar] [CrossRef] [Green Version]
  61. Cao, X.; Wang, Y.; He, J.; Luo, X.; Zheng, Z. Phosphorus mobility among sediments, water and cyanobacteria enhanced by cyanobacteria blooms in eutrophic Lake Dianchi. Environ. Pollut. 2016, 219, 580–587. [Google Scholar] [CrossRef]
  62. Negassa, W.; Leinweber, P. How does the hedley sequential phosphorus fractionation reflect impacts of land use and management on soil phosphorus: A review. J. Plant Nutr. Soil Sci. 2009, 172, 305–325. [Google Scholar] [CrossRef]
  63. Bol, R.; Gruau, G.; Mellander, P.E.; Dupas, R.; Bechmann, M.; Skarbøvik, E.; Bieroza, M.; Djodjic, F.; Glendell, M.; Jordan, P.; et al. Challenges of reducing phosphorus based water eutrophication in the agricultural landscapes of Northwest Europe. Front. Mar. Sci. 2018, 5, 276. [Google Scholar] [CrossRef] [Green Version]
  64. Smolders, E.; Baetens, E.; Verbeeck, M.; Nawara, S.; Diels, J.; Verdievel, M.; Peeters, B.; De Cooman, W.; Baken, S. Internal Loading and Redox Cycling of Sediment Iron Explain Reactive Phosphorus Concentrations in Lowland Rivers. Environ. Sci. Technol. 2017, 51, 2584–2592. [Google Scholar] [CrossRef]
  65. Eckert, W.; Didenko, J.; Uri, E.; Eldar, D. Spatial and temporal variability of particulate phosphorus fractions in seston and sediments of Lake Kinneret under changing loading scenario. In The Interactions between Sediments and Water; Springer: Dordrecht, The Netherlands, 2003; pp. 223–229. [Google Scholar]
  66. Jiang, X.; Livi, K.J.T.; Arenberg, M.R.; Chen, A.; Chen, K.Y.; Gentry, L.; Li, Z.; Xu, S.; Arai, Y. High flow event induced the subsurface transport of particulate phosphorus and its speciation in agricultural tile drainage system. Chemosphere 2021, 263, 128147. [Google Scholar] [CrossRef]
  67. Poirier, S.-C.; Whalen, J.K.; Michaud, A.R. Bioavailable Phosphorus in Fine-Sized Sediments Transported from Agricultural Fields. Soil Sci. Soc. Am. J. 2012, 76, 258–267. [Google Scholar] [CrossRef] [Green Version]
Figure 1. Study site and its location in Germany and the federal state of Mecklenburg-Western Pomerania with (a) all subbasins, streaming systems, sampling points, (b) selected subbasins, and (c) land use. Areas with decreased saturation in (c) are located in the uninvestigated main stream.
Environments 10 00043 g001
Figure 2. Photograph of sediments (0–2 cm) with different textures and origins in the Warnow River Basin.
Environments 10 00043 g002
Figure 3. Hedley fractionation and the according phosphorus fractions. Adapted from [15,18,34].
Environments 10 00043 g003
Figure 4. Map of the total P distribution in the Warnow River Basin in the (a) top (0–2 cm) and (b) bottom (2–10 cm) sediment layer.
Environments 10 00043 g004
Figure 5. Phosphorus fractions for each subbasin from 0–2 cm (light-colored boxes) and 2–10 cm (dark-colored boxes). Levels of significance are · 0.1, ns = no significance Note the varying y-axis. Black dots are values exceeding 1.5 times the inner quartile range.
Environments 10 00043 g005
Figure 6. Non-metrical multidimensional scaling (NMDS, left panel) of the P fractions of the sediment and fitting of the environmental predictors (right panel). Only parameters with a level of significance of p < 0.1 are shown. Parameters: c—agriculture, d—forest, e—open water, f—urban, g—wetland, h—watershed area, l—sulfate, o—pH, q—conductivity, r—salinity, t—oxygen, v—flow velocity, x—nitrogen, y—carbon content, z—sulfur content, cc—aluminium content, dd—iron content.
Environments 10 00043 g006
Table 1. Mean and standard deviation (M ± sd), maximum and minimum (range) values of P contents using the sequential Hedley fractionation (0–2 cm sediment) for all sub-basins and the whole watershed. All data are given in mg P kg−1 sediment−1. Bold numbers indicate the maximum values in each sub-basin.
H2O-PNaHCO3-PResin-PNaOH-PH2SO4-PResidual PTotal P
SubbasinM ± sdRangeM ± sdRangeM ± sdRangeM ± sdRangeM ± sdRangeM ± sdRangeM ± sdRange
Beke15 ± 312–1765 ± 5128–10158 ± 3235–81276 ± 28376–476266 ± 163150–38249 ± 3027–71728 ± 558333–1123
Koesterbeck11 ± 91–18129 ± 13423–28128 ± 1118–4055 ± 523–109189 ± 54149–25137 ± 1130–50449 ± 147350–619
Mildenitz8 ± 91–2940 ± 633–17830 ± 444–120222 ± 5187–1397244 ± 181124–62870 ± 885–250613 ± 874161–2578
Muehlenfliess9 ± 55–1887 ± 9110–24060 ± 653–176393 ± 5389–1369287 ± 175122–58082 ± 9315–265918 ± 964164–2648
Nebel9 ± 191–1777 ± 874–23747 ± 592–164329 ± 5555–1493355 ± 15879–53655 ± 589–175872 ± 790155–2429
Oberwarnow23 ± 191–46106 ± 15714–34141 ± 4217–105142 ± 18112–402144 ± 8281–26335 ± 389–91491 ± 467158–1182
Zarnow16 ± 511–21159 ± 17642–41640 ± 3912–99111 ± 14729–333220 ± 121112–39042 ± 2423–78589 ± 506257–1334
Whole
watershed
12 ± 91–4688 ± 1053–41643 ± 452–176241 ± 4013–1493257 ± 15079–62857 ± 615–265698 ± 676155–2648
Reference
topsoils
31 ± 1824–3421 ± 2317–2450 ± 2436–57171 ± 54151–193147 ± 56123–18250 ± 2334–65469 ± 198417–515
Reference
subsoils
9 ± 83–187 ± 54–1320 ± 1412–3263 ± 3229–12599 ± 2869–15653 ± 1233–63250 ± 123149–407
Table 3. Environmental parameters of all investigated sub-basins of Warnow River Watershed. Grey background: variables measured in sediment samples (all data given for 0–10 cm depth), italic: land use and area of the subbasins, all other variables are measured from water samples at the sampling spots.
BekeKoesterbeckMildenitzMuehlenfliessNebelWarnowZarnowWhole Watershed
MeansdMeansdMeansdMeansdMeansdMeansdMeansdMeansd
Fe (mg kg−1)0.70.41.40.81.01.51.61.51.11.20.70.60.90.71.11.1
Ca (mg kg−1)1.20.82.11.83.64.03.72.01.61.51.92.31.91.62.52.4
Al (mg kg−1)0.20.00.20.00.20.30.40.40.30.20.10.00.30.20.30.2
C (%)0.60.52.51.44.67.76.28.03.55.53.35.81.71.23.75.7
N (%)0.10.00.10.10.30.50.50.60.30.40.20.40.10.10.30.4
S (%)0.10.00.20.20.20.30.40.30.30.30.30.50.10.00.20.3
C:N ratio (1)9.85.326.317.019.811.512.62.215.013.213.29.912.96.915.810.6
openwater (km2)1.20.00.30.017.012.83.43.415.011.83.94.10.00.0--
agriculture (km2)46.413.227.532.5139.9107.363.653.6112.697.3172.974.929.915.2--
forest (km2)8.51.54.23.375.357.923.519.371.551.544.130.23.41.2--
drainage_area (km2)39.419.034.634.1112.955.748.754.149.654.776.249.446.419.1--
area (km2)57.1-34.1-241.0-94.2-206.8-228.2-34.6---
water_level (m)0.30.20.30.20.40.30.40.30.70.30.40.10.30.10.40.3
SO42− (mg L−1)108.123.865.616.187.151.377.239.8101.181.895.135.6160.254.497.254.4
NO3 (mg L−1)5.81.76.95.24.57.62.82.26.19.82.62.010.74.75.26.1
Cl (mg L−1)57.027.847.54.929.02.7150.1255.040.312.330.81.036.512.357.6110.7
velocity (m s−1)0.20.10.00.00.10.10.10.10.10.10.20.20.10.10.10.1
oxygen (mg L−1)9.00.14.14.88.91.76.62.96.82.26.02.97.21.57.02.7
pH (1)7.60.07.10.47.70.37.30.27.30.37.30.27.30.17.40.3
conductivity (µS cm−1)629.132.0563.682.5419.0110.9744.7676.6556.6308.4470.991.7656.3123.2565.5323.6
redox (mV)33.527.3−4.7128.963.350.439.646.824.839.158.753.051.024.741.354.0
PO43− (mg L−1)0.00.00.20.10.00.00.00.00.10.10.00.00.00.00.00.1
TP (mg L−1)0.10.00.30.10.10.00.10.00.00.10.10.00.00.00.10.1
P from WWT (kg a−1)116.00.048.383.7127.6157.149.2105.5319.398.7522.4664.60.00.0188.6305.2
Disclaimer/Publisher’s Note: The statements, opinions and data contained in all publications are solely those of the individual author(s) and contributor(s) and not of MDPI and/or the editor(s). MDPI and/or the editor(s) disclaim responsibility for any injury to people or property resulting from any ideas, methods, instructions or products referred to in the content.