Article

Projected Climate Change Effects on Global Vegetation Growth: A Machine Learning Approach

1
Department of Civil Engineering, National Taipei University of Technology, Taipei 10608, Taiwan
2
Faculty of Engineering, King Mongkut’s Institute of Technology Ladkrabang, Bangkok 10520, Thailand
*
Authors to whom correspondence should be addressed.
Environments 2023, 10(12), 204; https://doi.org/10.3390/environments10120204
Submission received: 25 August 2023 / Revised: 21 November 2023 / Accepted: 23 November 2023 / Published: 26 November 2023
(This article belongs to the Special Issue Environmental Risk and Climate Change II)

Abstract

:
In this study, a machine learning model was used to investigate the potential consequences of climate change on vegetation growth. The methodology involved analyzing the historical Normalized Difference Vegetation Index (NDVI) data and future climate projections under four Shared Socioeconomic Pathways (SSPs). Data from the Global Inventory Monitoring and Modeling System (GIMMS) dataset for the period 1981–2000 were used to train the machine learning model, while CMIP6 (Coupled Model Intercomparison Project Phase 6) global climate projections from 2021–2100 were employed to predict future NDVI values under different SSPs. The study results revealed that the global mean NDVI is projected to experience a significant increase from the period 1981–2000 to the period 2021–2040. Following this, the mean NDVI slightly increases under SSP126 and SSP245 while decreasing substantially under SSP370 and SSP585. In the near-term span of 2021–2040, the average NDVI value of SSP585 slightly exceeds that of SSP245 and SSP370, suggesting a positive vegetation development in response to a more pronounced temperature increase in the near term. However, if the trajectory of SSP585 persists, the mean NDVI will commence a decline over the subsequent three periods (2041–2060, 2061–2080, and 2080–2100) with a faster speed than that of SSP370. This decline is attributed to the adverse effects of a rapid temperature rise on vegetation. Based on the examination of individual continents, it is projected that the NDVI values in Africa, South America, and Oceania will decline over time, except under the scenario SSP126 during 2081–2100. On the other hand, the NDVI values in North America and Europe are anticipated to increase, with the exception of the scenario SSP585 during 2081–2100. Additionally, Asia is expected to follow an increasing trend, except under the scenario SSP126 during 2081–2100. In the larger scope, our research findings carry substantial implications for biodiversity preservation, greenhouse gas emission reduction, and efficient environmental management. The utilization of machine learning technology holds the potential to accurately predict future changes in vegetation growth and pinpoint areas where intervention is imperative.

1. Introduction

Global climate change seriously threatens both human life and the environment. As greenhouse gas emissions increase, temperatures and precipitation increase and sea levels rise. To get an overall picture of climate change, the CMIP (Coupled Model Intercomparison Project) was developed in order to reveal trends in past, present, and future climate factors such as temperature and precipitation. The CMIP Phase 6 (CMIP6) is the most recent version, which has been improved in many aspects [1]. WorldClim is a database that offers high-resolution, downscaled CMIP6 data to researchers. Additionally, WorldClim provides access not only to climate data but also to bioclimatic datasets. Studies have used these datasets to analyze the consequences of climate change on water management [2], agriculture [3], drought [4], and crop productivity [5].
Vegetation expansion and growth in natural ecosystems have been monitored using the Leaf Area Index (LAI). LAI directly reflects the amount of green leaf area per unit surface area and is widely used to monitor vegetation changes under climate change. Several studies have focused on the relationship between LAI and climate factors. For example, Li et al. examined the spatiotemporal dynamics of vegetation LAI in China and its correlation with meteorological factors [6]. Zhao et al. investigated the impact of climate change on vegetation LAI in a global study [7]. Yuan et al. studied vegetation phenological changes in Northeast China based on LAI [8]. These studies highlight the importance of LAI in understanding vegetation dynamics and its response to climate change.
The Normalized Difference Vegetation Index (NDVI) is another widely used parameter for assessing vegetation dynamics. Regional studies have employed the NDVI to analyze vegetation changes and their relationship with climate factors. Ma et al. developed a nonlinear method that combines the delta downscaling method and back-propagation artificial neural network to predict the NDVI under climate change in the Sanjiangyuan region of China [9]. Ren et al. analyzed historical and future changes in extreme climate events and their effects on vegetation on the Mongolian Plateau using NDVI data [10]. These studies demonstrate the value of the NDVI in understanding vegetation responses to climate change at regional scales. However, global-scale studies are currently lacking.
Climate variables such as temperature and precipitation have been shown to be highly correlated with the NDVI [11,12], making it a valuable tool for monitoring climate change’s impact on ecosystems. Machine learning models are popular methods nowadays that are applied in many fields such as soil erosion [13], medical research [14], and business analysis [15]. Regarding studies related to using NDVI values, the machine learning model was popularly used to classify the land use/land cover (LULC) [16,17] and to forecast the fire risk [18] and crop yield [19]. From examining the existing literature, it is evident that a considerable correlation exists between NDVI values and climate change within the related research. Specifically, there is a growing interest in predicting changes in NDVI values in the future under climate change variables such as temperature and precipitation. Furthermore, research on this relationship’s spatial (global) and temporal (time series) aspects is particularly important for a comprehensive understanding of the subject.
Researching a global scale is imperative for grasping ecological and environmental trends while seeking international solutions comprehensively. While previous investigations [20,21,22,23,24] have diligently examined trends, patterns, and drivers of NDVI values, they did not venture into predicting future trends. While Teng et al. [25] did analyze future NDVI values under climate change, their focus remained confined to global peak vegetation. Consequently, our study holds significant importance as it not only builds upon prior research but also harnesses a machine learning model to predict forthcoming NDVI values. Our research casts a broader net by encompassing a global scope and encapsulating the complex interplay between climate change and vegetation. By effectively forecasting NDVI values globally, our study offers the unique potential to identify regions that have a heightened vulnerability to climate change impacts, thereby paving the way for proactive and targeted intervention strategies.

2. Materials and Methods

Recent studies have underscored the significant threat that climate change presents to global vegetation growth. Machine learning algorithms, commonly used to predict and model changes in vegetation indices like the NDVI under future climate scenarios, have become a standard tool in this field. Figure 1 shows a flowchart that visually represents the modeling and prediction process. This flowchart is specifically used to forecast global NDVI distributions in the context of climate change, utilizing the random forest (RF) model.
The target variable of the machine learning model is the NDVI value, which was gathered from the third-generation Global Inventory Monitoring and Modeling System (GIMMS). The model utilizes 37 factors as predictors, including monthly mean minimum and maximum temperatures, 19 bioclimatic variables, and 16 topographic variables. The data used to build the model represent the mean value of the historical period from 1970 to 2000. The random forest model was built using 70% of the data and was tested with the remaining 30%. To assess the model’s performance, the Root Mean Square Error (RMSE) and the Nash-Sutcliffe Efficiency (NSE) were used as evaluation metrics.
To predict future NDVI values, data ranging from 2021 to 2100 (divided into the periods 2021–2040, 2041–2060, 2061–2080, and 2081–2100) were input into the model. Finally, mapping was created to illustrate the NDVI distribution worldwide and to observe the trends in NDVI values over time. The flowchart (Figure 1) helps to visualize the complex workflow, data sources, and algorithms in predicting global NDVI distributions under climate change.

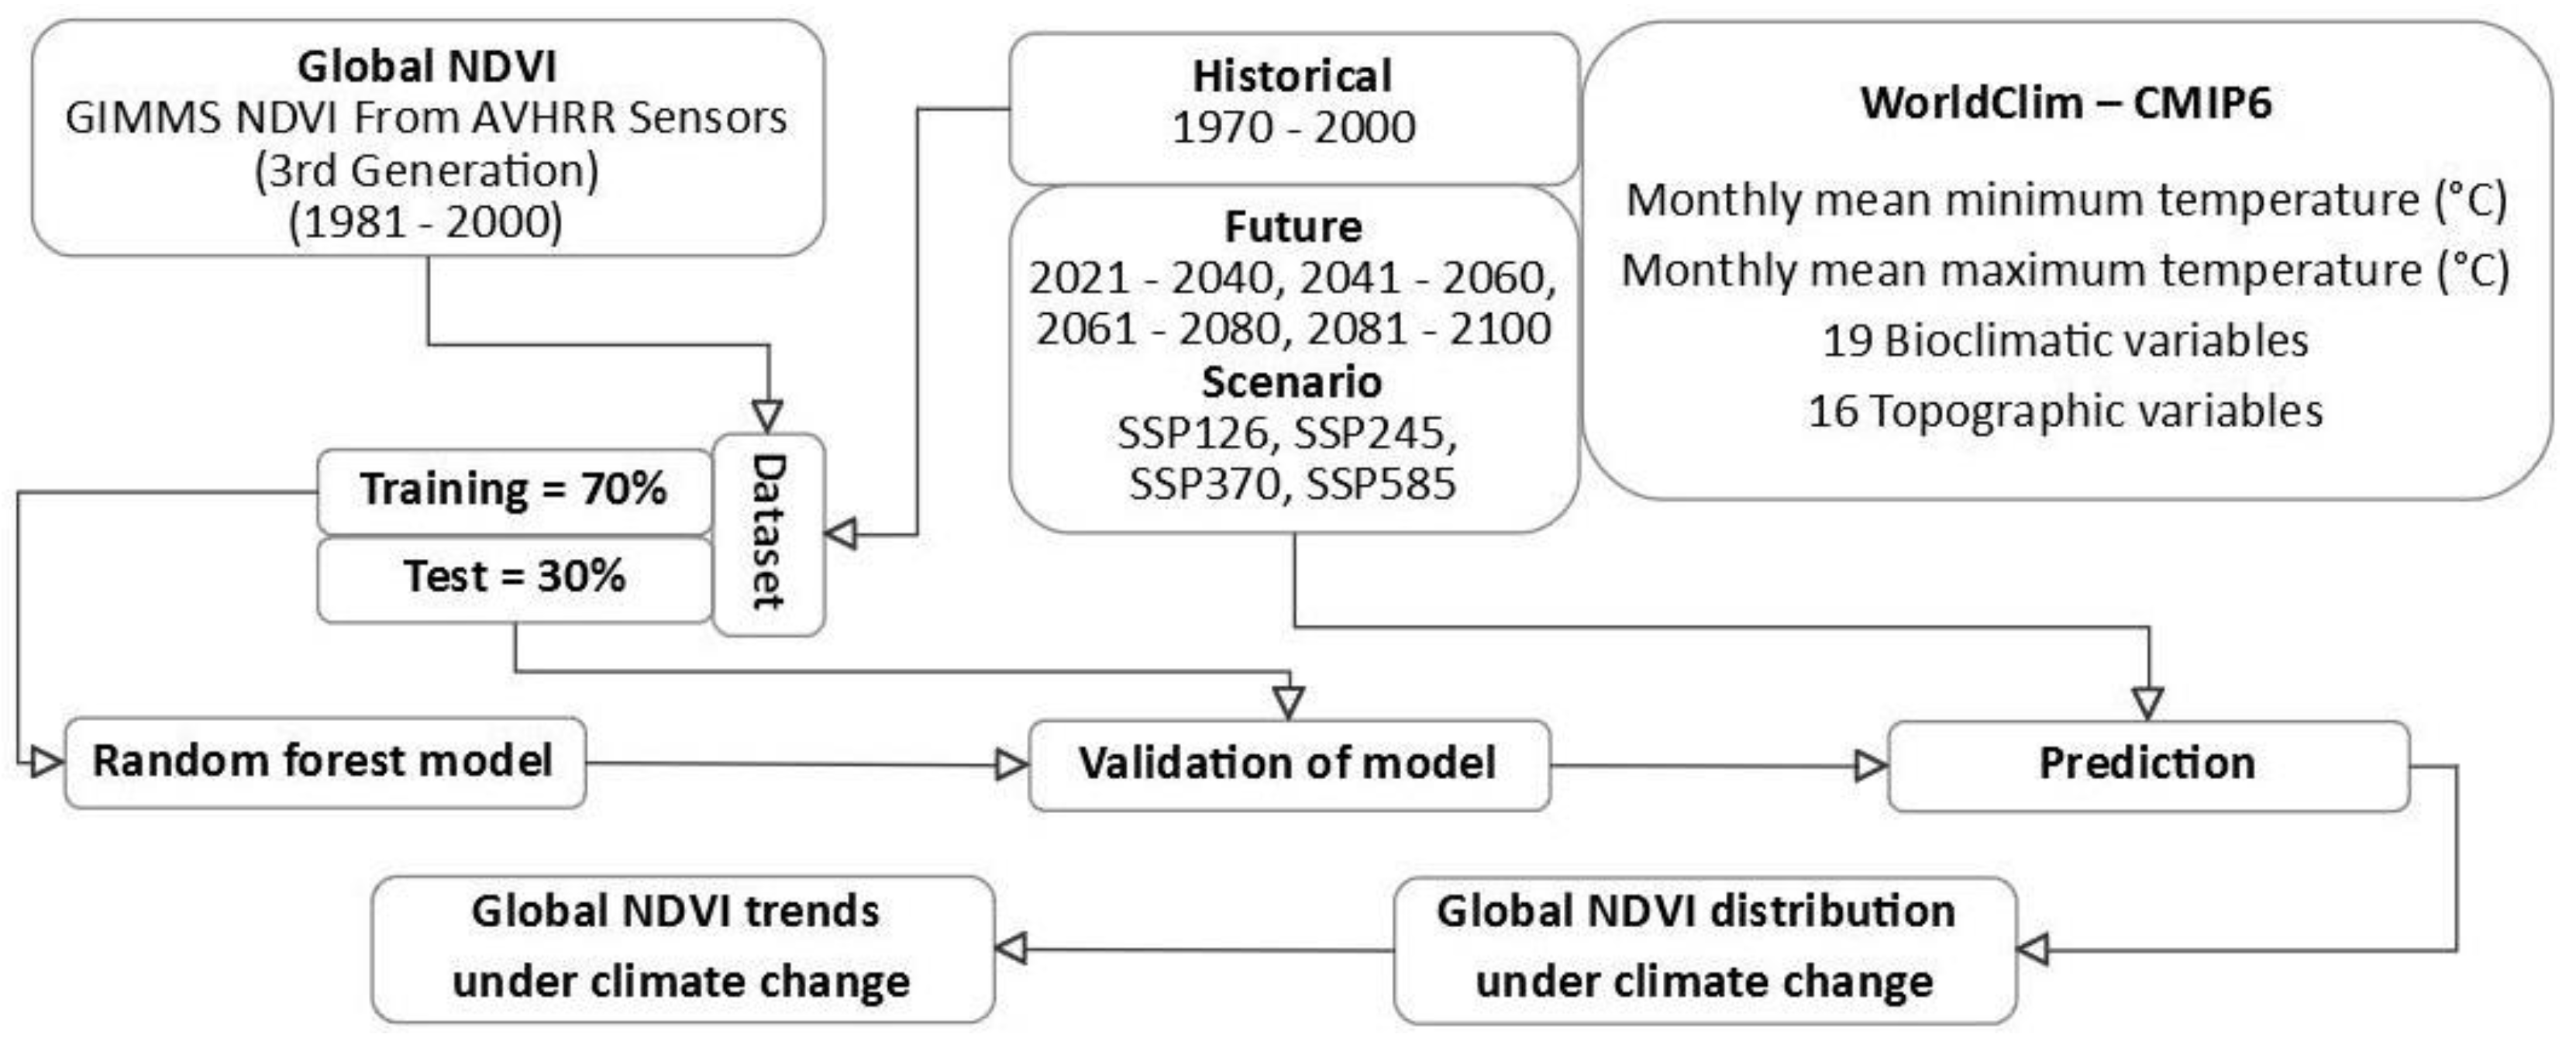
2.1. Data Collection

The target is the NDVI value collected from GIMMS using AVHRR Sensors. This data source was chosen because it provided data for the historical period of interest. In the WorldClim dataset used for climate change analysis, the historical period is before 2000. Therefore, this dataset was the most appropriate option for this study. Other global NDVI datasets, such as MODIS, mostly began collecting data from 2000 onward, which is unsuitable for this study as the historical period of interest is before 2000.
The value of the NDVI of this dataset ranges from −1 to 1, collected every 16 days from July 1981 to December 2015. Although the NDVI data was available for 35 years, this study only used data for 20 years from 1981 to 2000. This was due to the historical time frame set in the World Clim CMIP6 dataset, which only covered the years from 1970 to 2000. Therefore, the historical mean NDVI was calculated using the NDVI values before 2000 to ensure appropriate timing for assessing climate change. The NDVI data used in this study has a resolution of 9277 m (~10 km) and was collected and processed to determine the mean NDVI value in Google Earth Engine (GEE). Figure 2 depicts the global distribution of the NDVI values obtained from the data. However, the negative NDVI values were removed from the dataset before analysis using the machine learning model. Consequently, this study excluded the Antarctic and a portion of Greenland.
The predictors used in the model were climate data collected from the CanESM5 model (Canadian Centre for Climate Modelling and Analysis, Canada) in WorldClim CMIP6 [26], which included the monthly mean minimum (MONTHTMIN) and the monthly mean maximum temperature (MONTHTMAX), 19 bioclimatic variables (Table 1), and 16 topographic variables (Table 2). Bioclimatic variables are calculated from monthly temperature and rainfall data, providing more ecologically meaningful variables. These variables are commonly used in species distribution and ecological modeling. Bioclimatic variables represent annual trends (e.g., mean annual temperature and annual precipitation), seasonality (e.g., seasonal range in temperature and precipitation), and extreme or limiting environmental factors (e.g., the temperature of the coldest and warmest months and the precipitation of the wet and dry quarters). A quarter refers to three months, corresponding to one-fourth of a year.
The climate data was collected for all 21 factors during two periods: a historical period (1970–2000) and a future period (2021–2100). The WorldClim provides data at four resolutions: 10 min, 5 min, 2.5 min, and 30 s. However, this study used the 5-min resolution (~10 km) to maintain uniformity with the NDVI dataset.
The topographic variable (16 factors) was derived from the digital elevation model products of the global 250 m Global Multi-resolution Terrain Elevation Data 2010 (GMTED2010) and the near-global 90 m SRTM 4.1 [27]. The variables were aggregated to different resolutions, and this study utilized a resolution of 10 km which is consistent with other datasets. Given that the topographic factors do not vary significantly over time, this study held the topographic factors constant and unchanged in predicting the future NDVI.

2.2. Methodology

To predict changes in the future NDVI under climate change, our research utilized machine learning models, specifically the random forest algorithm. The selection of the random forest model was grounded in extensive previous research. We assessed a wide array of machine learning methodologies, including multiple regression, decision trees, support vector machines (SVMs), adaptive neuro-fuzzy inference systems, artificial neural networks (ANNs), bagged multivariate adaptive regression splines, Cubist, and gradient boosting machines (GBMs), alongside a stacked ensemble approach integrating RF and GBM as meta-models with decision trees, linear regression, ANN, and SVM as base models. These methods were rigorously compared in a series of studies [13,28,29,30,31], which led us to identify RF as a superior model for our specific analytical needs. Thus, we re-applied the random forest model to forecast the NDVI using climate and topographic variables in this study. The random forest algorithm, proposed by Breiman [32], is a supervised machine learning technique that combines the outputs of many tree-based models to create the most suitable model for the given application. This algorithm generates numerous trees by randomly dividing the training dataset into multiple subsets, producing better results than individual decision trees. In our analysis, we used the randomForest package in R, which employs measures like the Gini index to minimize impurity at each node while separating data.
Additionally, entropies and information gain were used to evaluate the input data’s impurity level. The attribute with the lowest Gini index was selected to build a conditional node in the random forest algorithm, while the other attributes were disregarded. Through multiple iterations, the algorithm divided the training data into subsets and generated multiple trees. This approach consistently yields better results than the decision tree and other models.
In addition, to assess the accuracy of the random forest model, it was validated using two statistical measures: RMSE and NSE (Equations (1) and (2)). The RMSE allows for comparing the expected values (obtained from the model outputs) with the observed values (from the NDVI values), measuring the error in the model’s predictions. On the other hand, the NSE was employed to evaluate the model’s effectiveness against the average observed value, which signifies how well the model matches the observed data’s characteristics across time. The RMSE indicates the average prediction error of the model when predicting the test dataset. The NSE measures the relative magnitude of the error and compares the modeled result against the observed data. The NSE metric ranges from −∞ to 1, with a value of 1 indicating a perfect match between the model’s predictions and the observed data. In contrast, a value of 0 signifies that the model’s performance is no better than simply using the mean value of the observed data.
R M S E = P O 2 n
N S E = 1 P O 2 O O ¯ 2
where P is the predicted value, O is the observed value, and O ¯ is the mean observed value.
To comprehensively understand the spatial pattern and trend of the changing NDVI values, we employed the Mann-Kendall test [33,34], which is a widely used statistical analysis in environmental science. The test detects any significant trends or patterns in the NDVI values globally by evaluating whether to reject the null hypothesis (H0) and accept the alternative hypothesis (Ha) regarding the presence or absence of a monotonic trend in the data. The Mann-Kendall test statistic (S) is given by:
S = i = 1 n 1 j = i + 1 n s g n x j x i
where x i and x j are the value of sequence i, j; n is the length of the time series; and s g n x j x i is the indicator function, which equals 1 if x j x i > 0 , 0 if x j x i = 0 , or –1 if x j x i < 0 . The trend of the data can be identified as a downtrend if the S value is negative, an uptrend if the S value is positive, and no trend if the S value is 0 [35]. Then, the hypothesis test was used to test the result of trending as follows:
H0 (null hypothesis):
there is no trend present in the data.
Ha (alternative hypothesis):
an uptrend/downtrend is present in the data.
If the p-value is less than or equal to 0.01, 0.05, or 0.1 (the significance level), the null hypothesis is rejected, and the alternative hypothesis is accepted. Additionally, it is worth noting that researchers have utilized the Mann-Kendall test to identify temporal trends in various climatic and ecological variables, including vegetation indices such as the NDVI. To perform the Mann-Kendall test in our research, we utilized the “rkt” package in the R software V4.2.2, which has proven to be an efficient and reliable tool for conducting such analyses. By applying this methodology, we gained valuable insights into the trends and changes in the NDVI values over time, which are paramount to understanding the impacts of climate change on global vegetation patterns and productivity.

3. Results and Discussion

This study uses machine learning algorithms to forecast changes in the NDVI values under climate change scenarios. The results of this research are divided into three main sections. First, the performance of the random forest model for the NDVI prediction is evaluated. Second, the model predicts the NDVI values under diverse climate change scenarios. Third, the variable trends in the NDVI values are analyzed spatially and temporally. Comparisons are drawn between different continents and studies to determine the relative efficacy of this study’s methods.

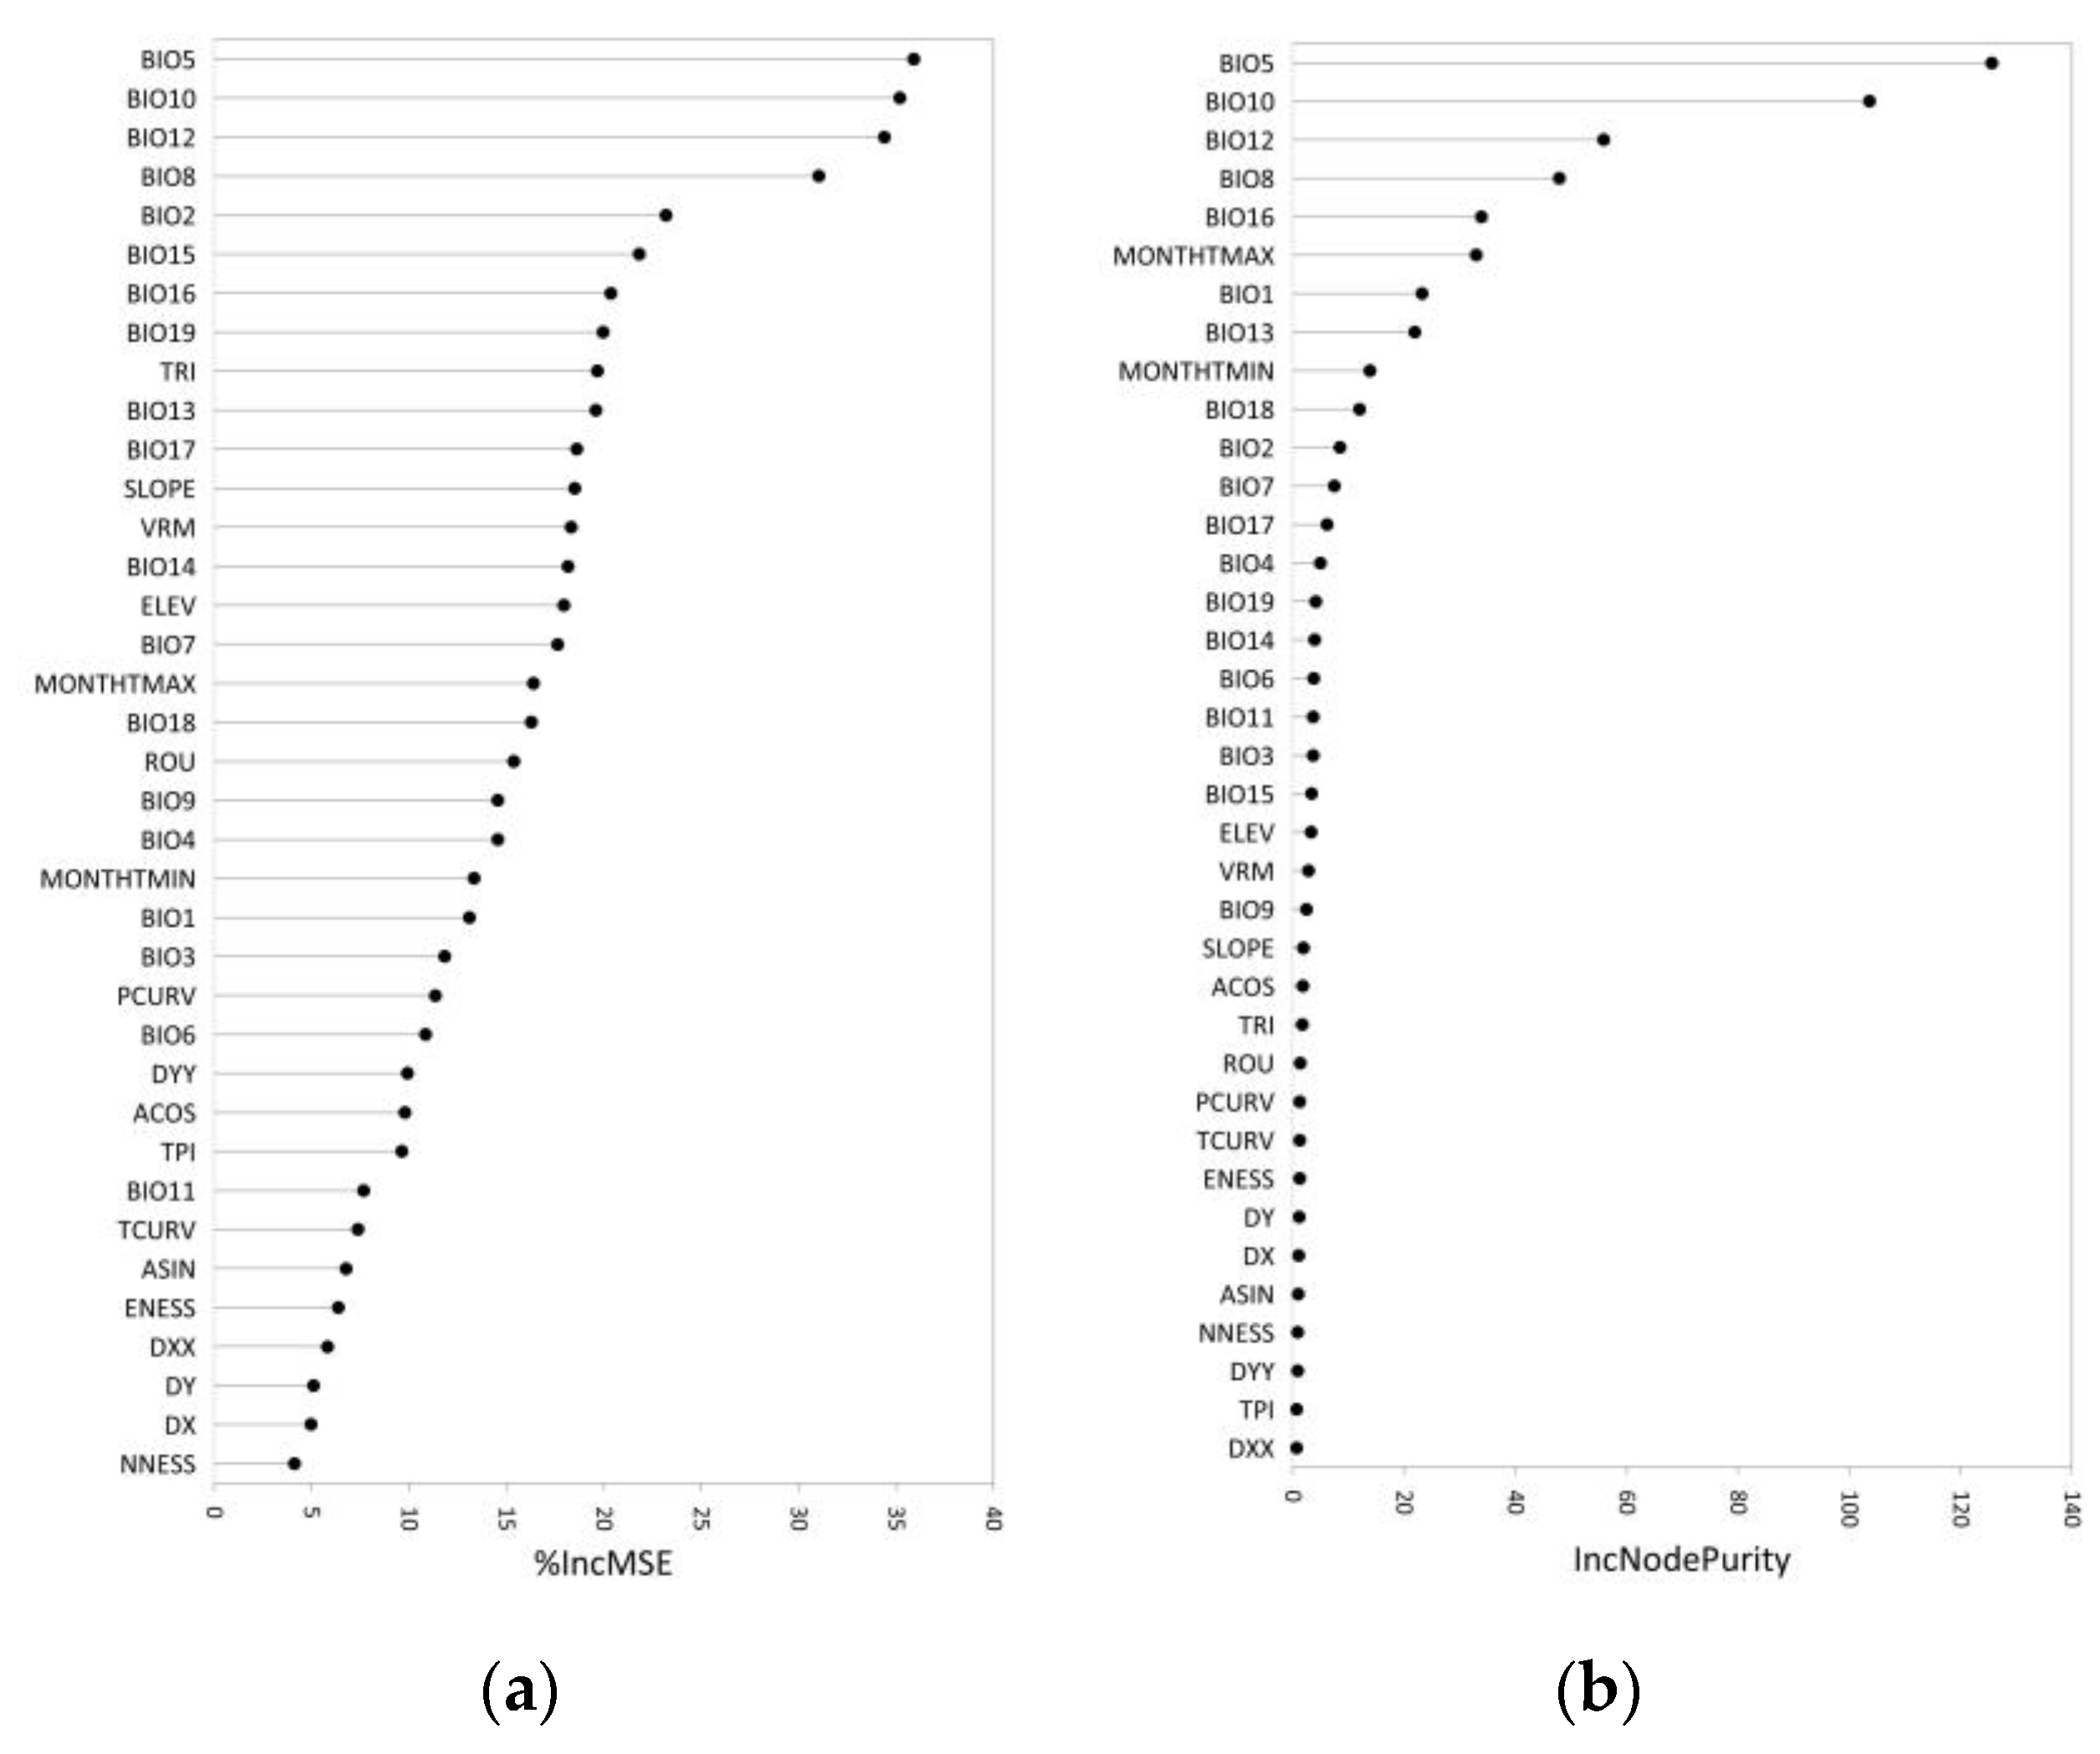
3.1. Random Forest Model

Table 3 summarizes the predictive performance of a random forest model in estimating the NDVI values based on two subsets of data: a training dataset with 4164 samples and a test dataset with 1785 samples. The model’s performance was evaluated in terms of RMSE and NSE on both the training and test datasets. RMSE measures the differences between the actual and predicted NDVI values; lower values show better performance. NSE measures the predictor’s ability to provide a meaningful prediction when considering the data’s observed variability. A higher NSE value indicates a better result. We ran the random forest 30 times to calculate the statistically significant averages and standard deviations of RMSE and NSE.
Based on the table, the random forest model performs better on the training dataset with an RMSE of 0.050 and an NSE of 0.982. In contrast, the test dataset has a higher RMSE of 0.108 and a lower NSE of 0.913, indicating that the model is less effective when applied to new data. Although the test dataset shows slightly higher RMSE and lower NSE values than the training dataset, the model’s predictive performance is still considered good as the NSE value 0.913 is high. This indicates that the random forest model can provide accurate predictions for the NDVI values even in unseen data.
The random forest model is an effective machine learning algorithm for predicting the NDVI values under climate change. The input factors of the model were also arranged based on their importance in affecting the NDVI value. This importance is determined by the decrease in accuracy when excluding each variable (%IncMSE) while considering each outcome class separately. Additionally, the second measure of importance is the reduction in Gini impurity (IncNodePurity) which refers to the process in which a variable is selected to split a node. In this study, the list of important factors was chosen to include only the factors that are common to both variables.
Figure 3 shows that the top four crucial factors that affect the NDVI values are BIO5 (Max Temperature of Warmest Month), BIO10 (Mean Temperature of Warmest Quarter), BIO12 (Annual Precipitation), and BIO8 (Mean Temperature of Wettest Quarter). These factors represent important climatic variables such as temperature and precipitation, which significantly impact the NDVI values. The BIO5, BIO10, and BIO8 variables related to temperature are essential indices for measuring plant growth under different climatic conditions. The BIO12 variable, on the other hand, represents the mean annual precipitation, which is another critical factor affecting plant growth. The random forest model’s ability to identify and rank crucial factors provides valuable insights into the underlying relationships between climatic variables and the NDVI values, enabling us to better understand the impact of climate change on vegetation growth.

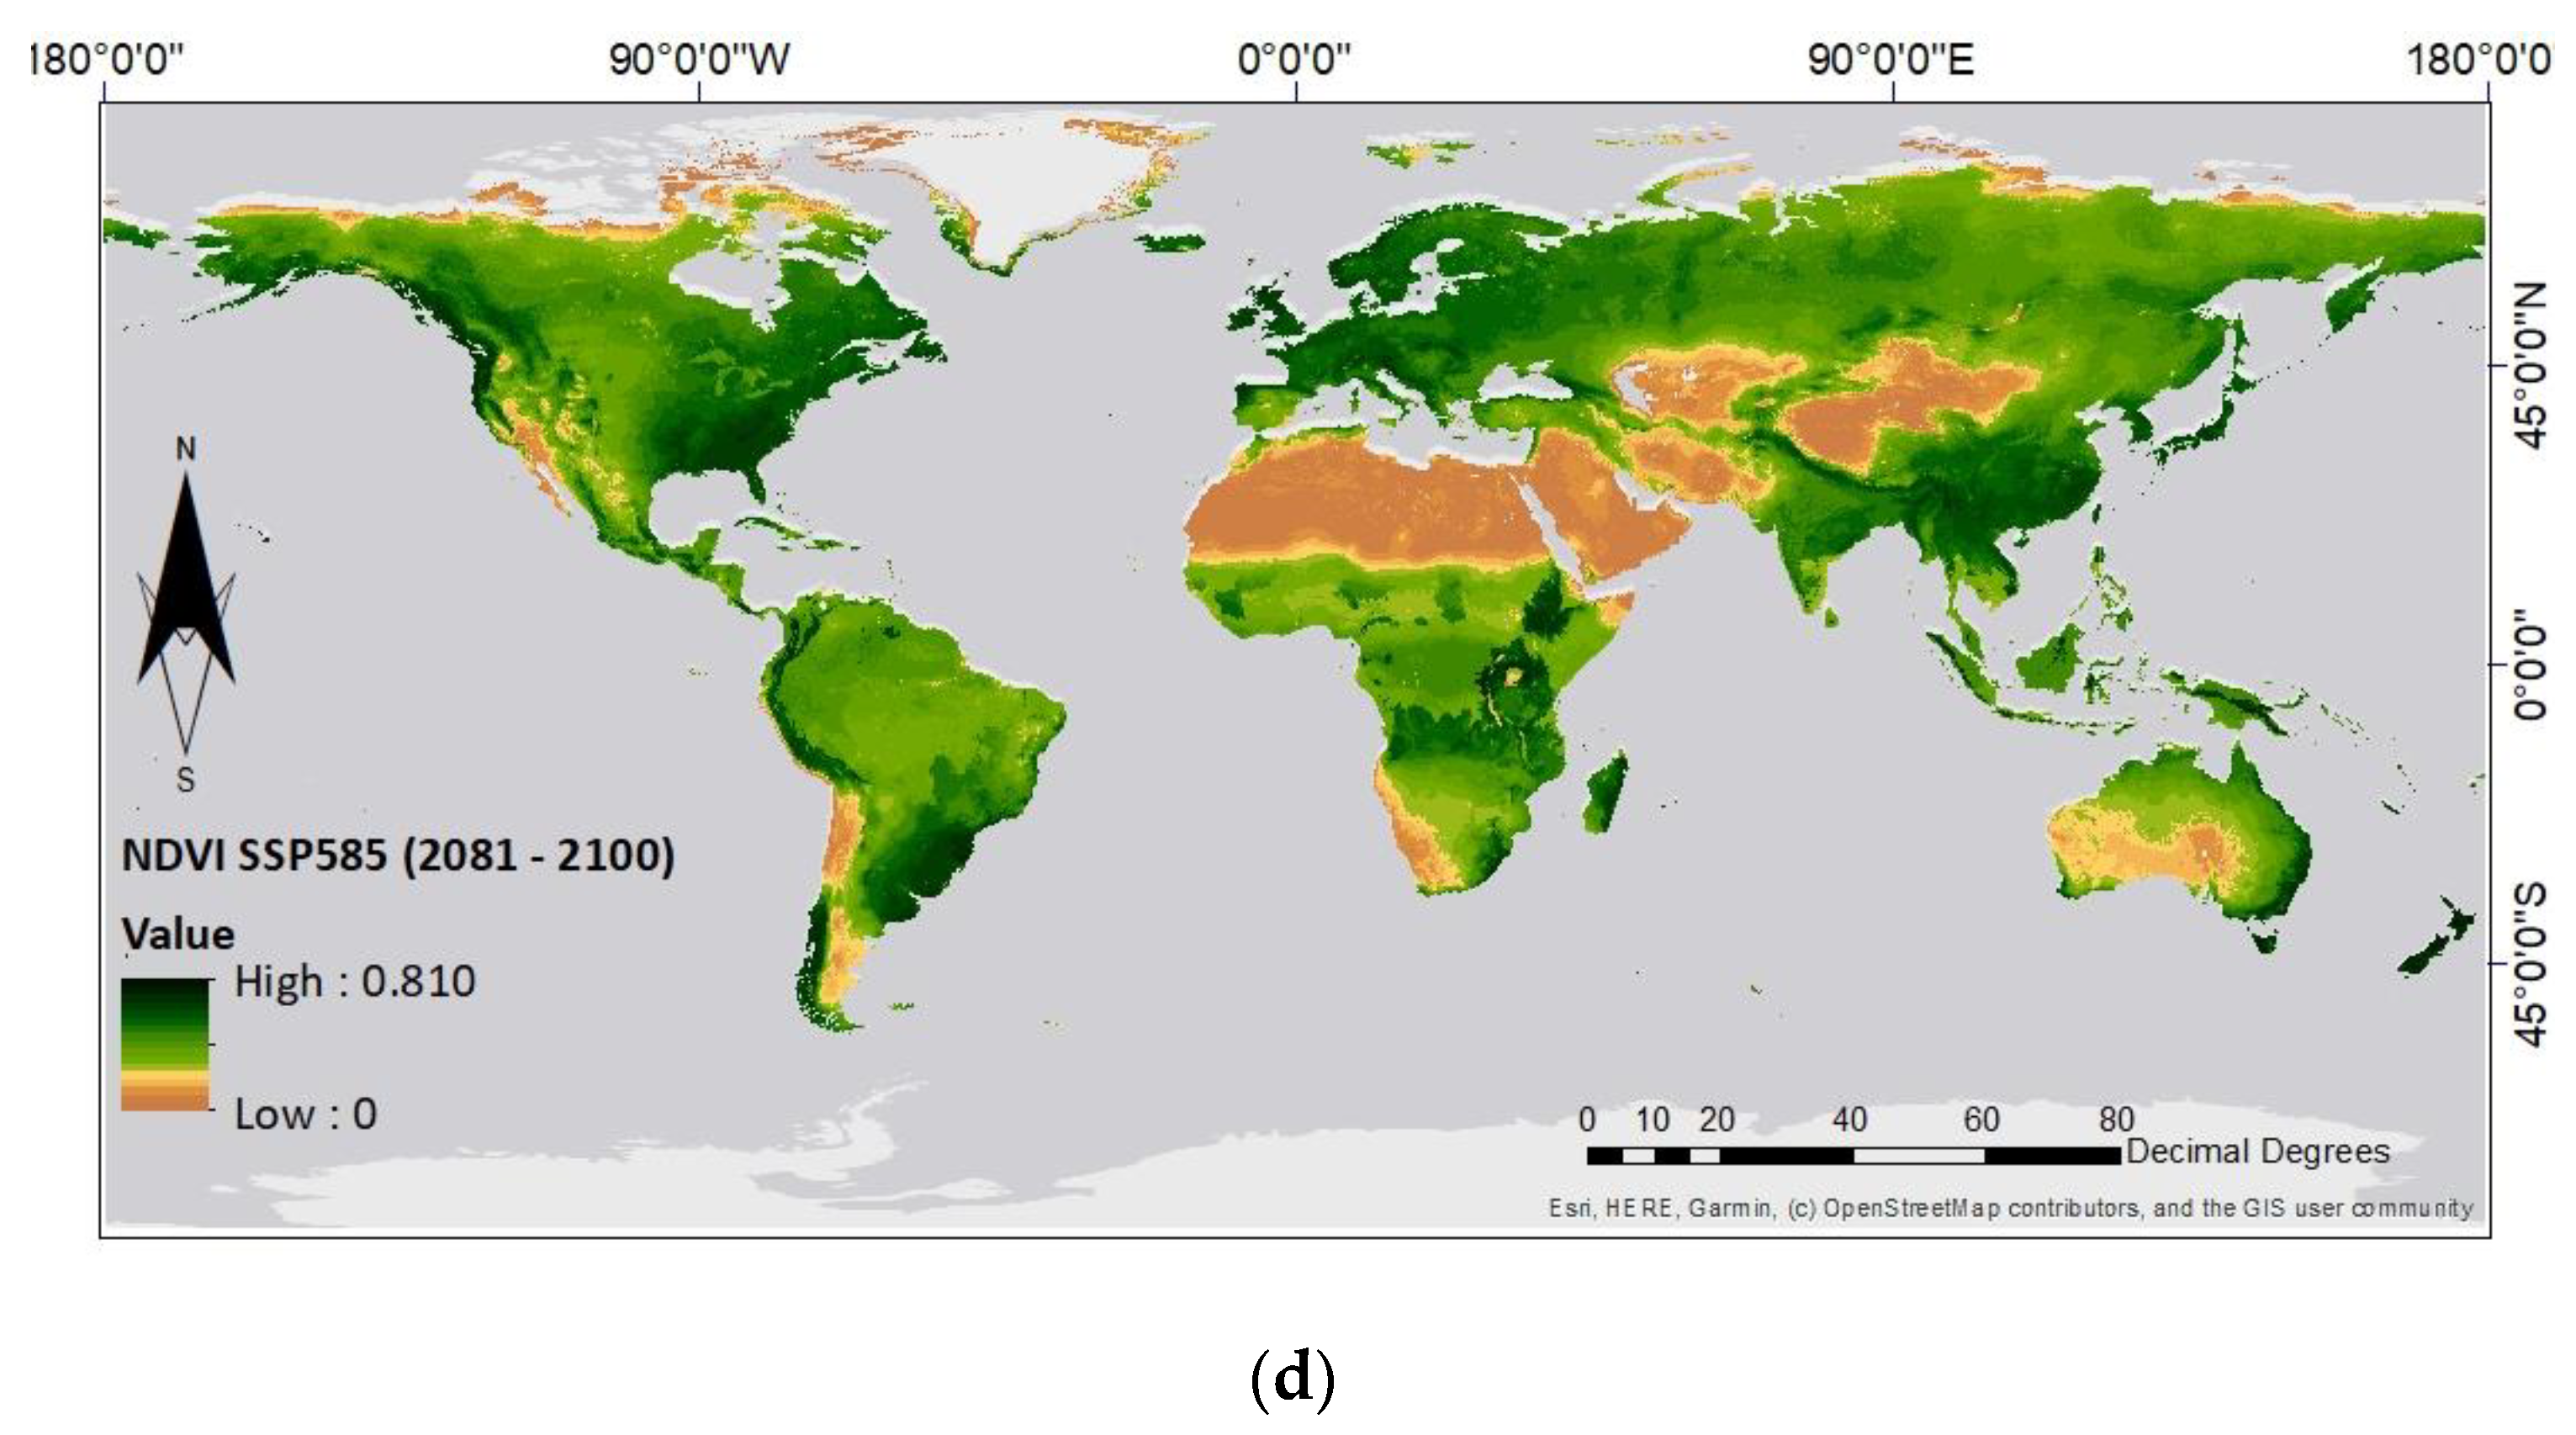
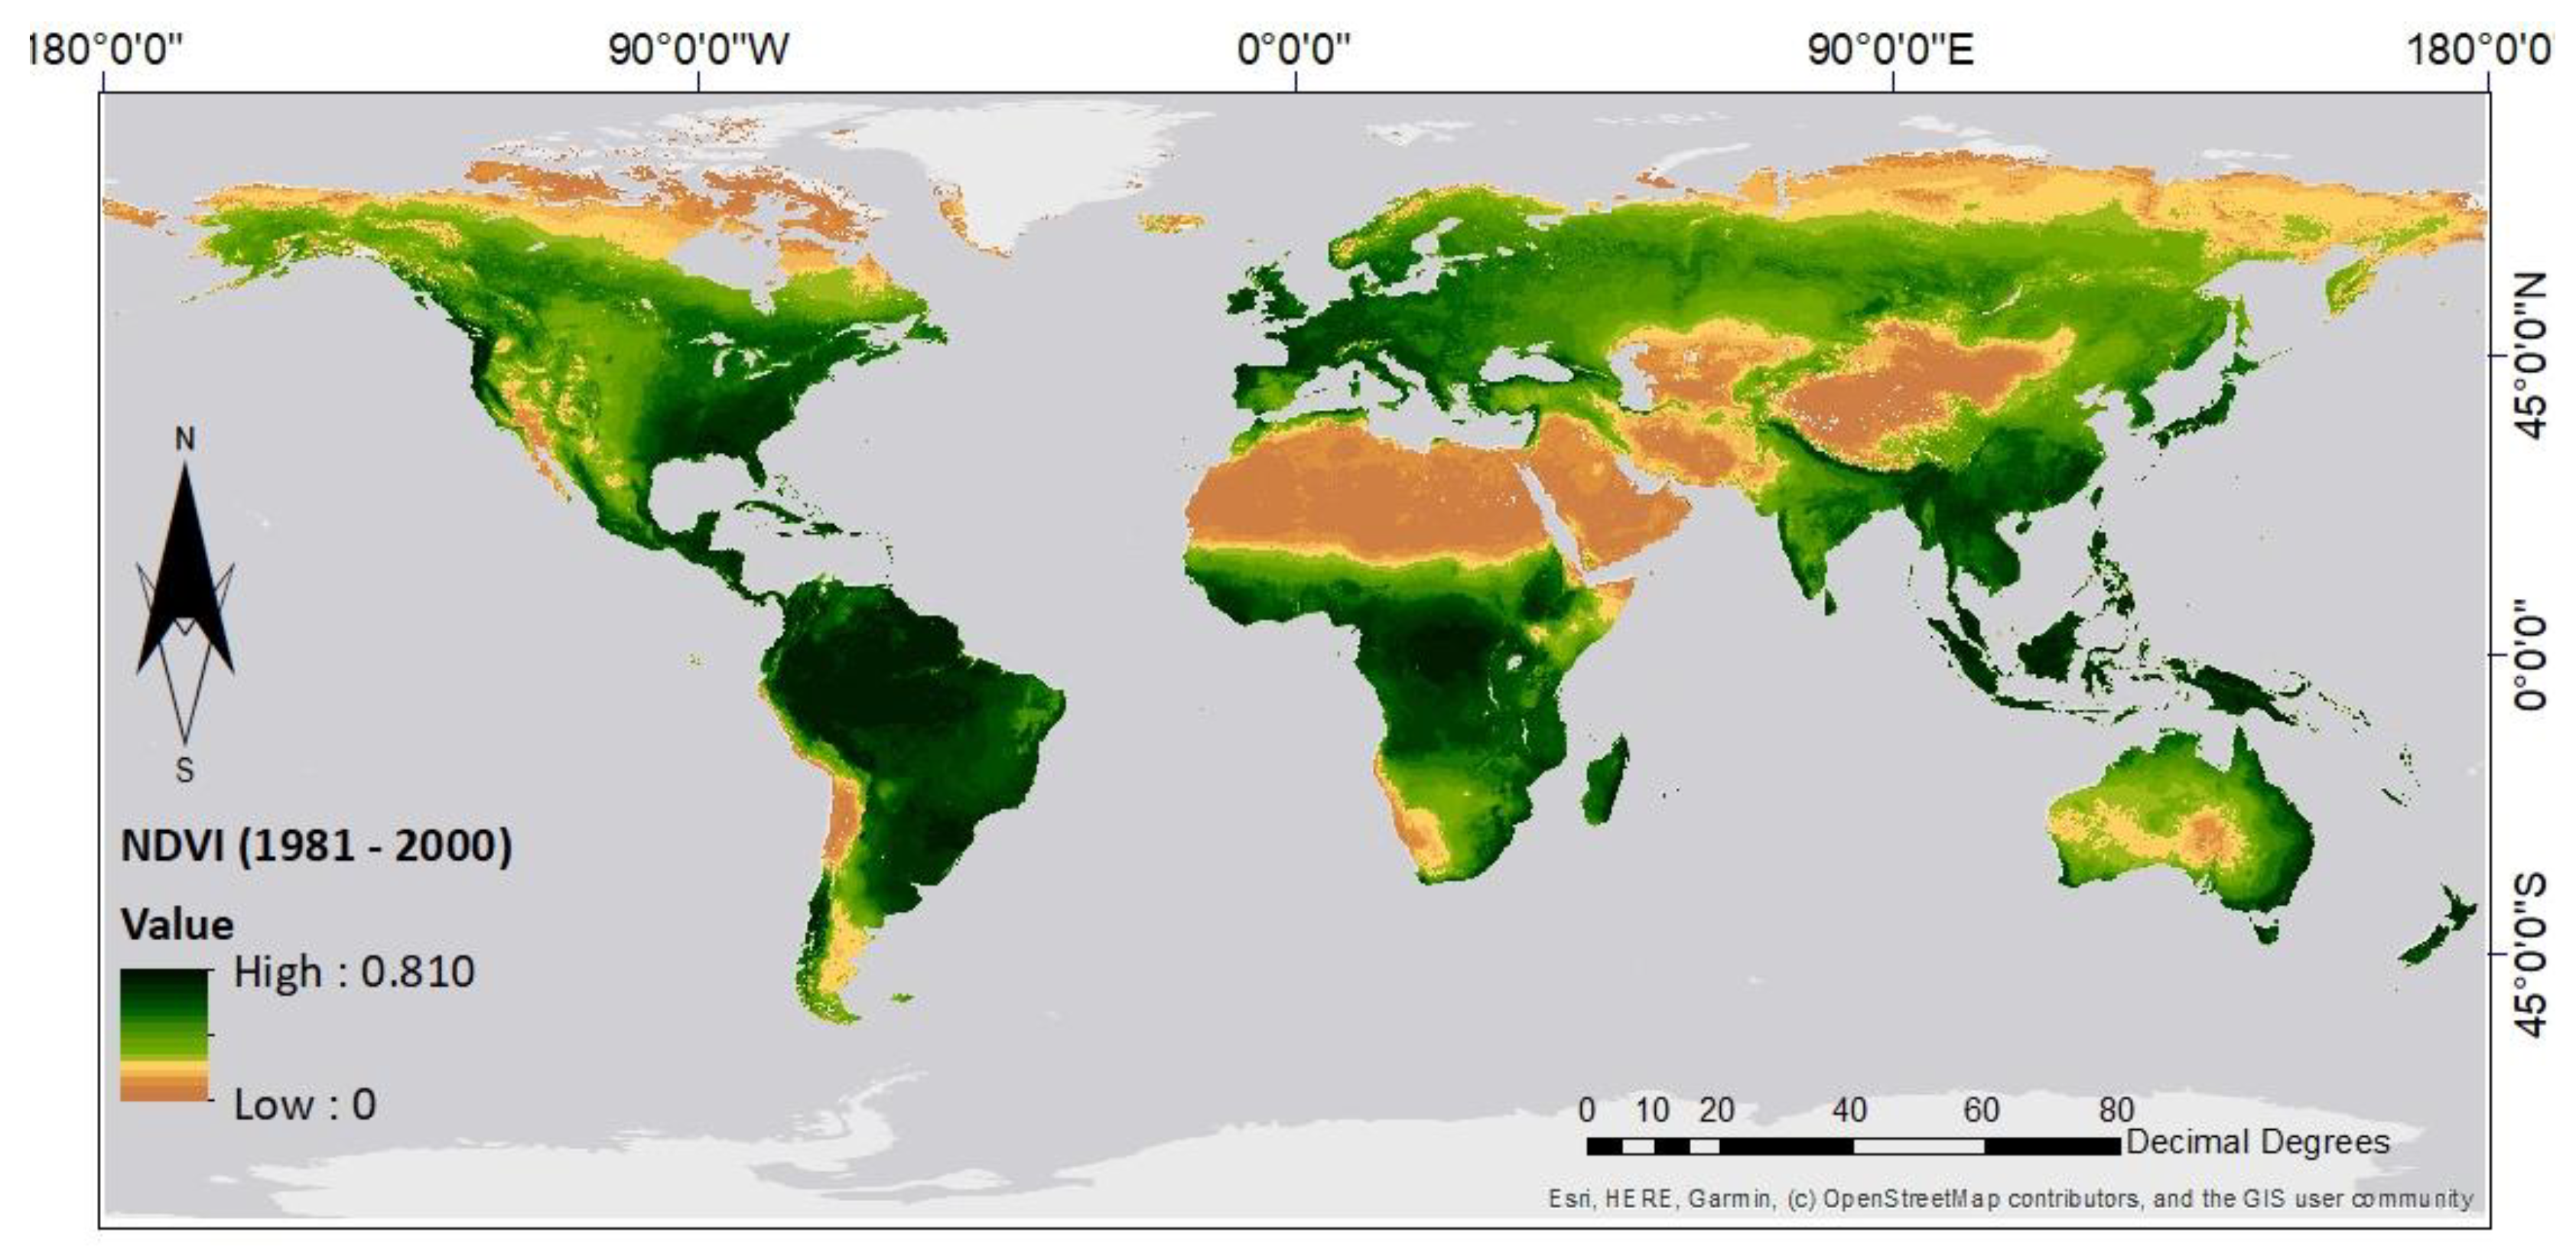
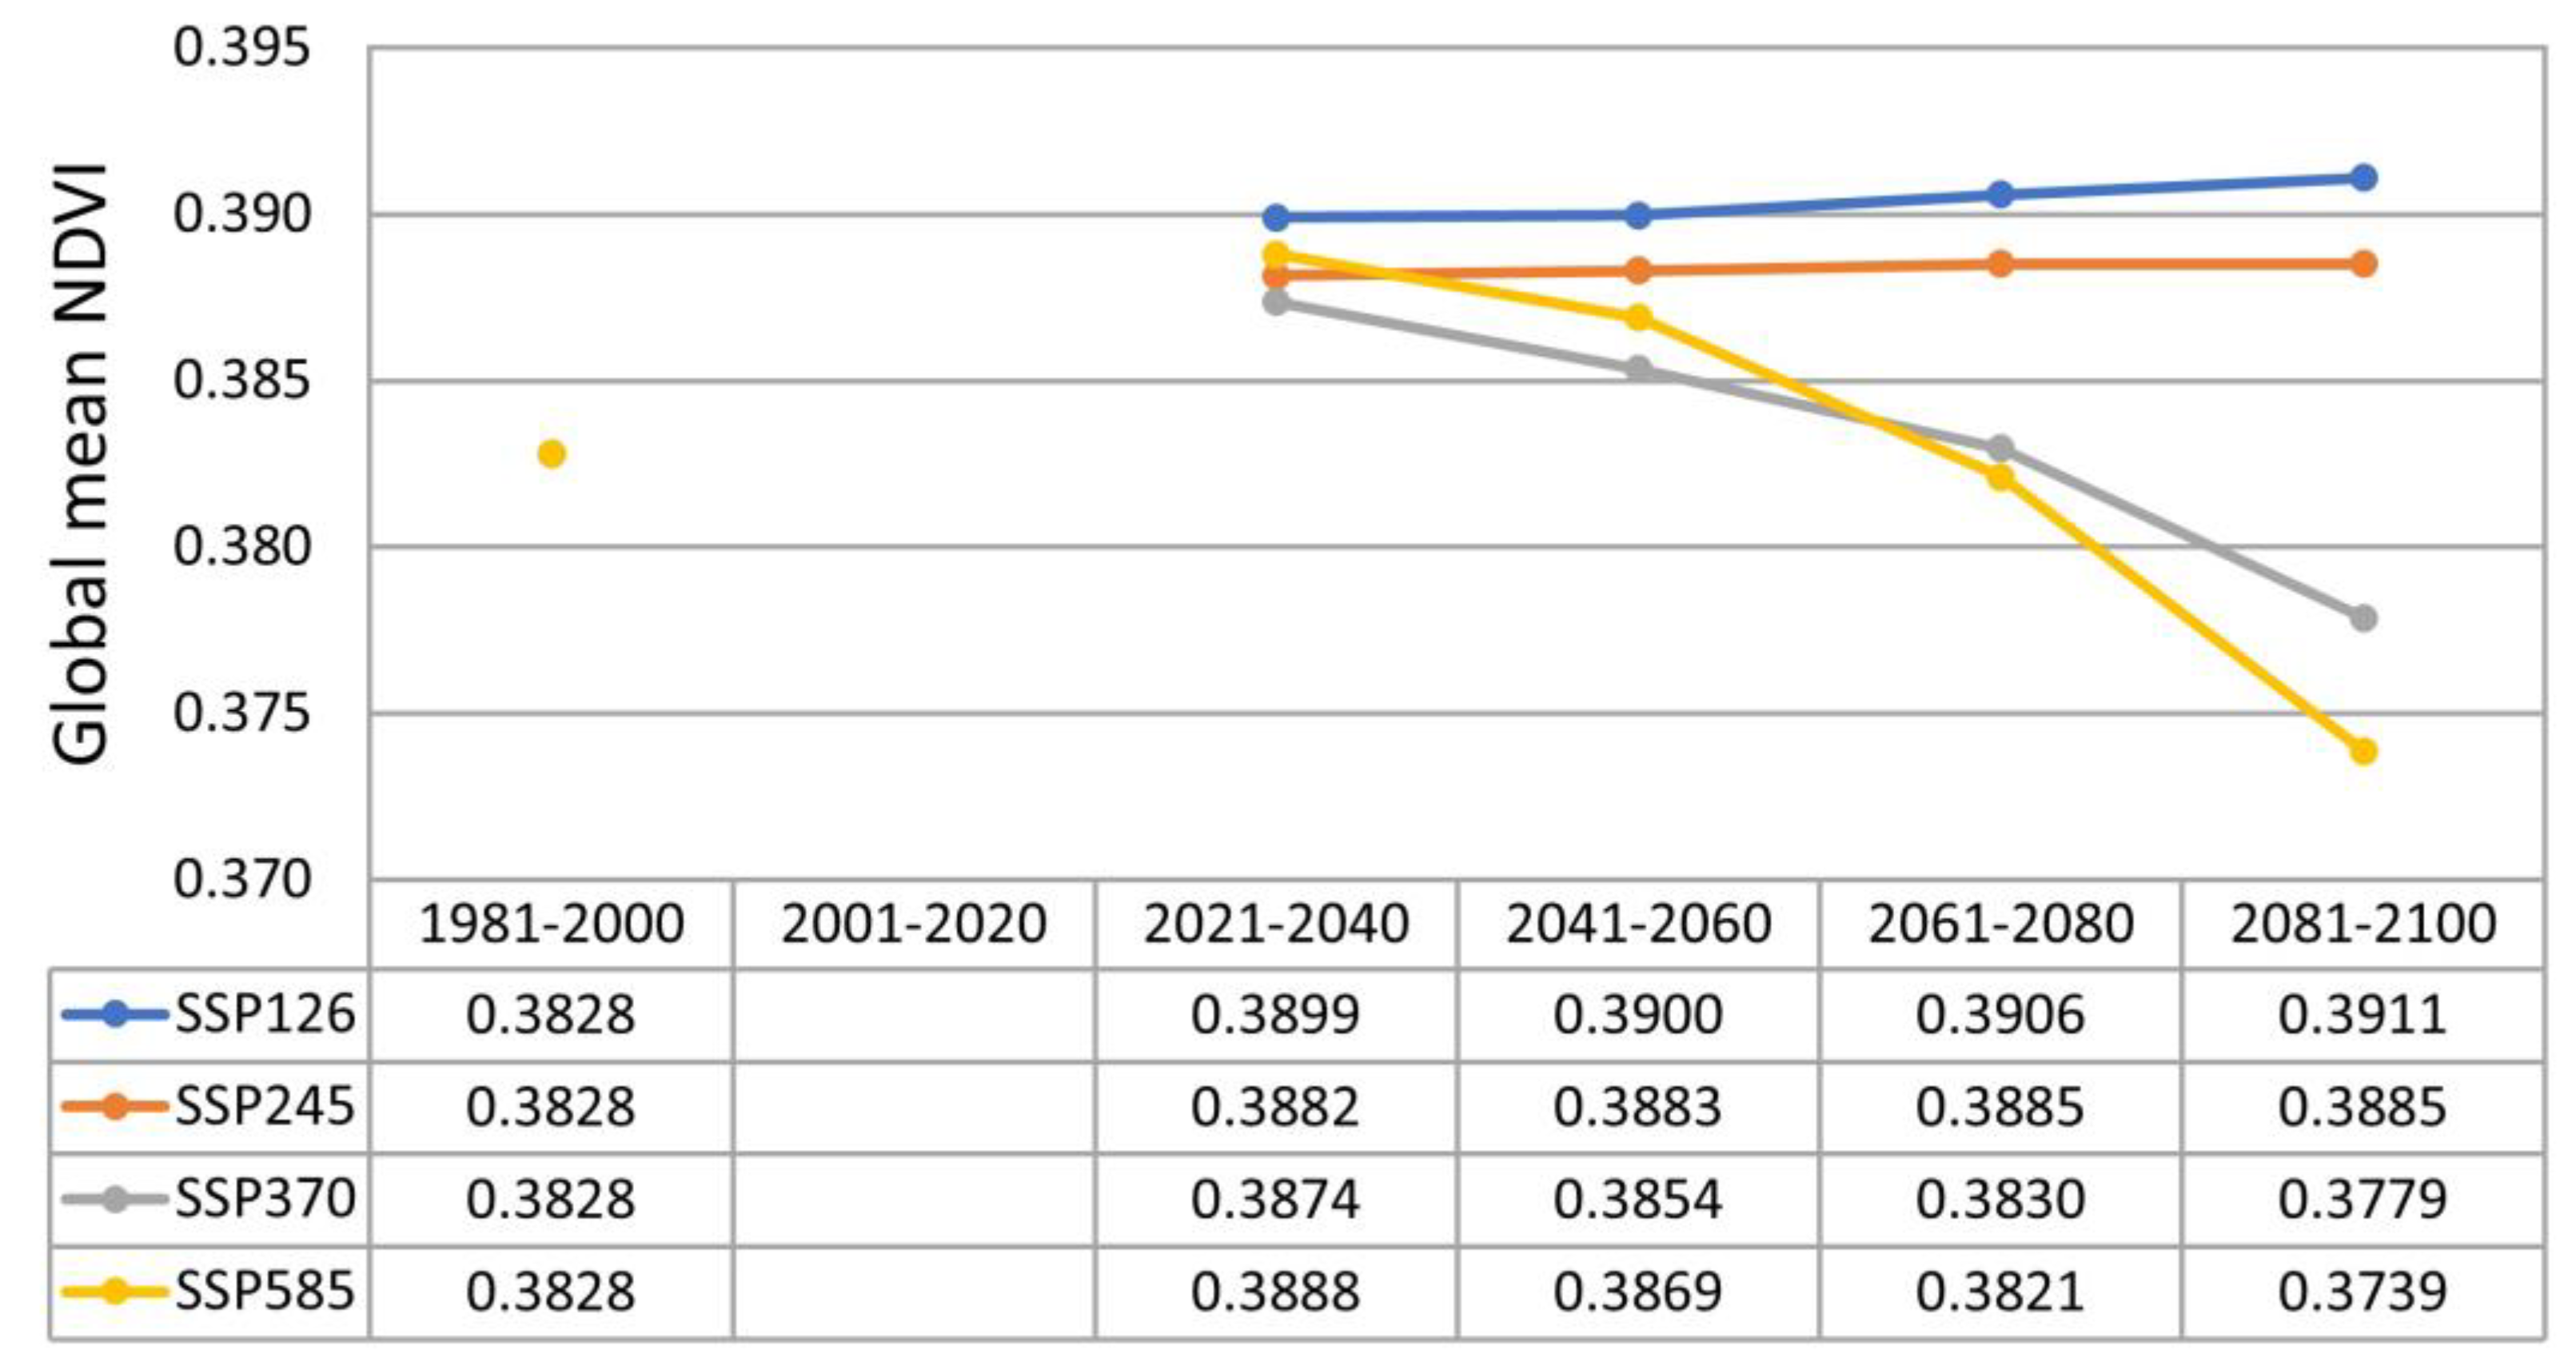
3.2. Prediction of the NDVI Value under Climate Change

The predicted distribution of the NDVI values provides valuable insights into how vegetation growth may be affected under different future climate scenarios. Figure 4 presents the distribution of the predicted NDVI values under two scenarios, namely SSP126 and SSP585, representing low-emission and high-emission climate conditions, respectively. The results show that the changing of the NDVI values was minimal under the low-emission scenario (SSP126), as evidenced by the minimal variation of the NDVI distribution from the period 2021–2040 to 2081–2100. This is consistent with the expectation that, under a low-emission scenario, greenhouse gas concentrations are expected to be low, which may not result in significant changes to vegetation growth.
However, the high-emission climate scenario (SSP585) showed a significant reduction in the NDVI values over time. As the planet continues to warm, vegetated regions are projected to experience more severe droughts, heat waves, and other extreme weather events, which would reduce vegetation growth. For instance, in South America and Africa, the NDVI values are projected to decrease significantly from dark green to light green, indicating a notable decline in vegetation growth.
Figure 5 provides a comprehensive insight into the conclusion based on a comparison of the global mean NDVI values during two distinct periods, namely, the historical period (1981–2000) and the future period (2021–2100). This comparison sheds light on the potential impacts of climate change on vegetation growth. The global mean NDVI value was determined at 0.3828 during the historical period.
The global mean NDVI value trends demonstrate an increase under low-emission climate scenarios (SSP126 and SSP245) while indicating a decrease under high-emission scenarios (SSP370 and SSP585). For example, the NDVI value of SSP126 increased slightly from 0.3899 to 0.3911, while the NDVI value under SSP245 also showed a slight increase, rising from 0.3882 during the 2021–2040 period to 0.3885 during the 2081–2100 period. In contrast, SSP370 and SSP585 show a decreasing trend, particularly in the last period, with the NDVI value of SSP585 declining to 0.3739, which is the lowest point among all the periods. The scenario SSP585 is a scenario that ultimately results in a mean NDVI value lower than that of the 1981–2000 period. However, the average NDVI value of SSP585 marginally surpasses that of both SSP245 and SSP370 during the near-term span of 2021–2040, and SSP370 during 2041–2060.
According to the random forest model, the two most important factors are temperature-related (BIO5 and BIO10). We plotted the relationship between the temperature increases and the NDVI values for different scenarios in Figure 6. As can be observed from Figure 5 and Figure 6, it is evident that during the period 2021–2040, the mean NDVI of SSP585 is higher than that of SSP370 and SSP245, primarily due to a 1 °C increase in temperature for SSP585, compared to a less-pronounced temperature increase for SSP370 and SSP245. The slightly higher temperature increase in SSP585 suggests a positive impact on vegetation growth. However, in the subsequent periods, the temperature increase in SSP585 accelerates significantly, with temperatures in SSP585 rising by close to 6 °C during the period 2081–2100. This ultimately has a detrimental effect on vegetation growth, leading to a sharp decrease in the NDVI values. Similarly, the NDVI value of SSP370 also experiences a rapid decline as temperatures rise to over 4 °C during the period 2081–2100.

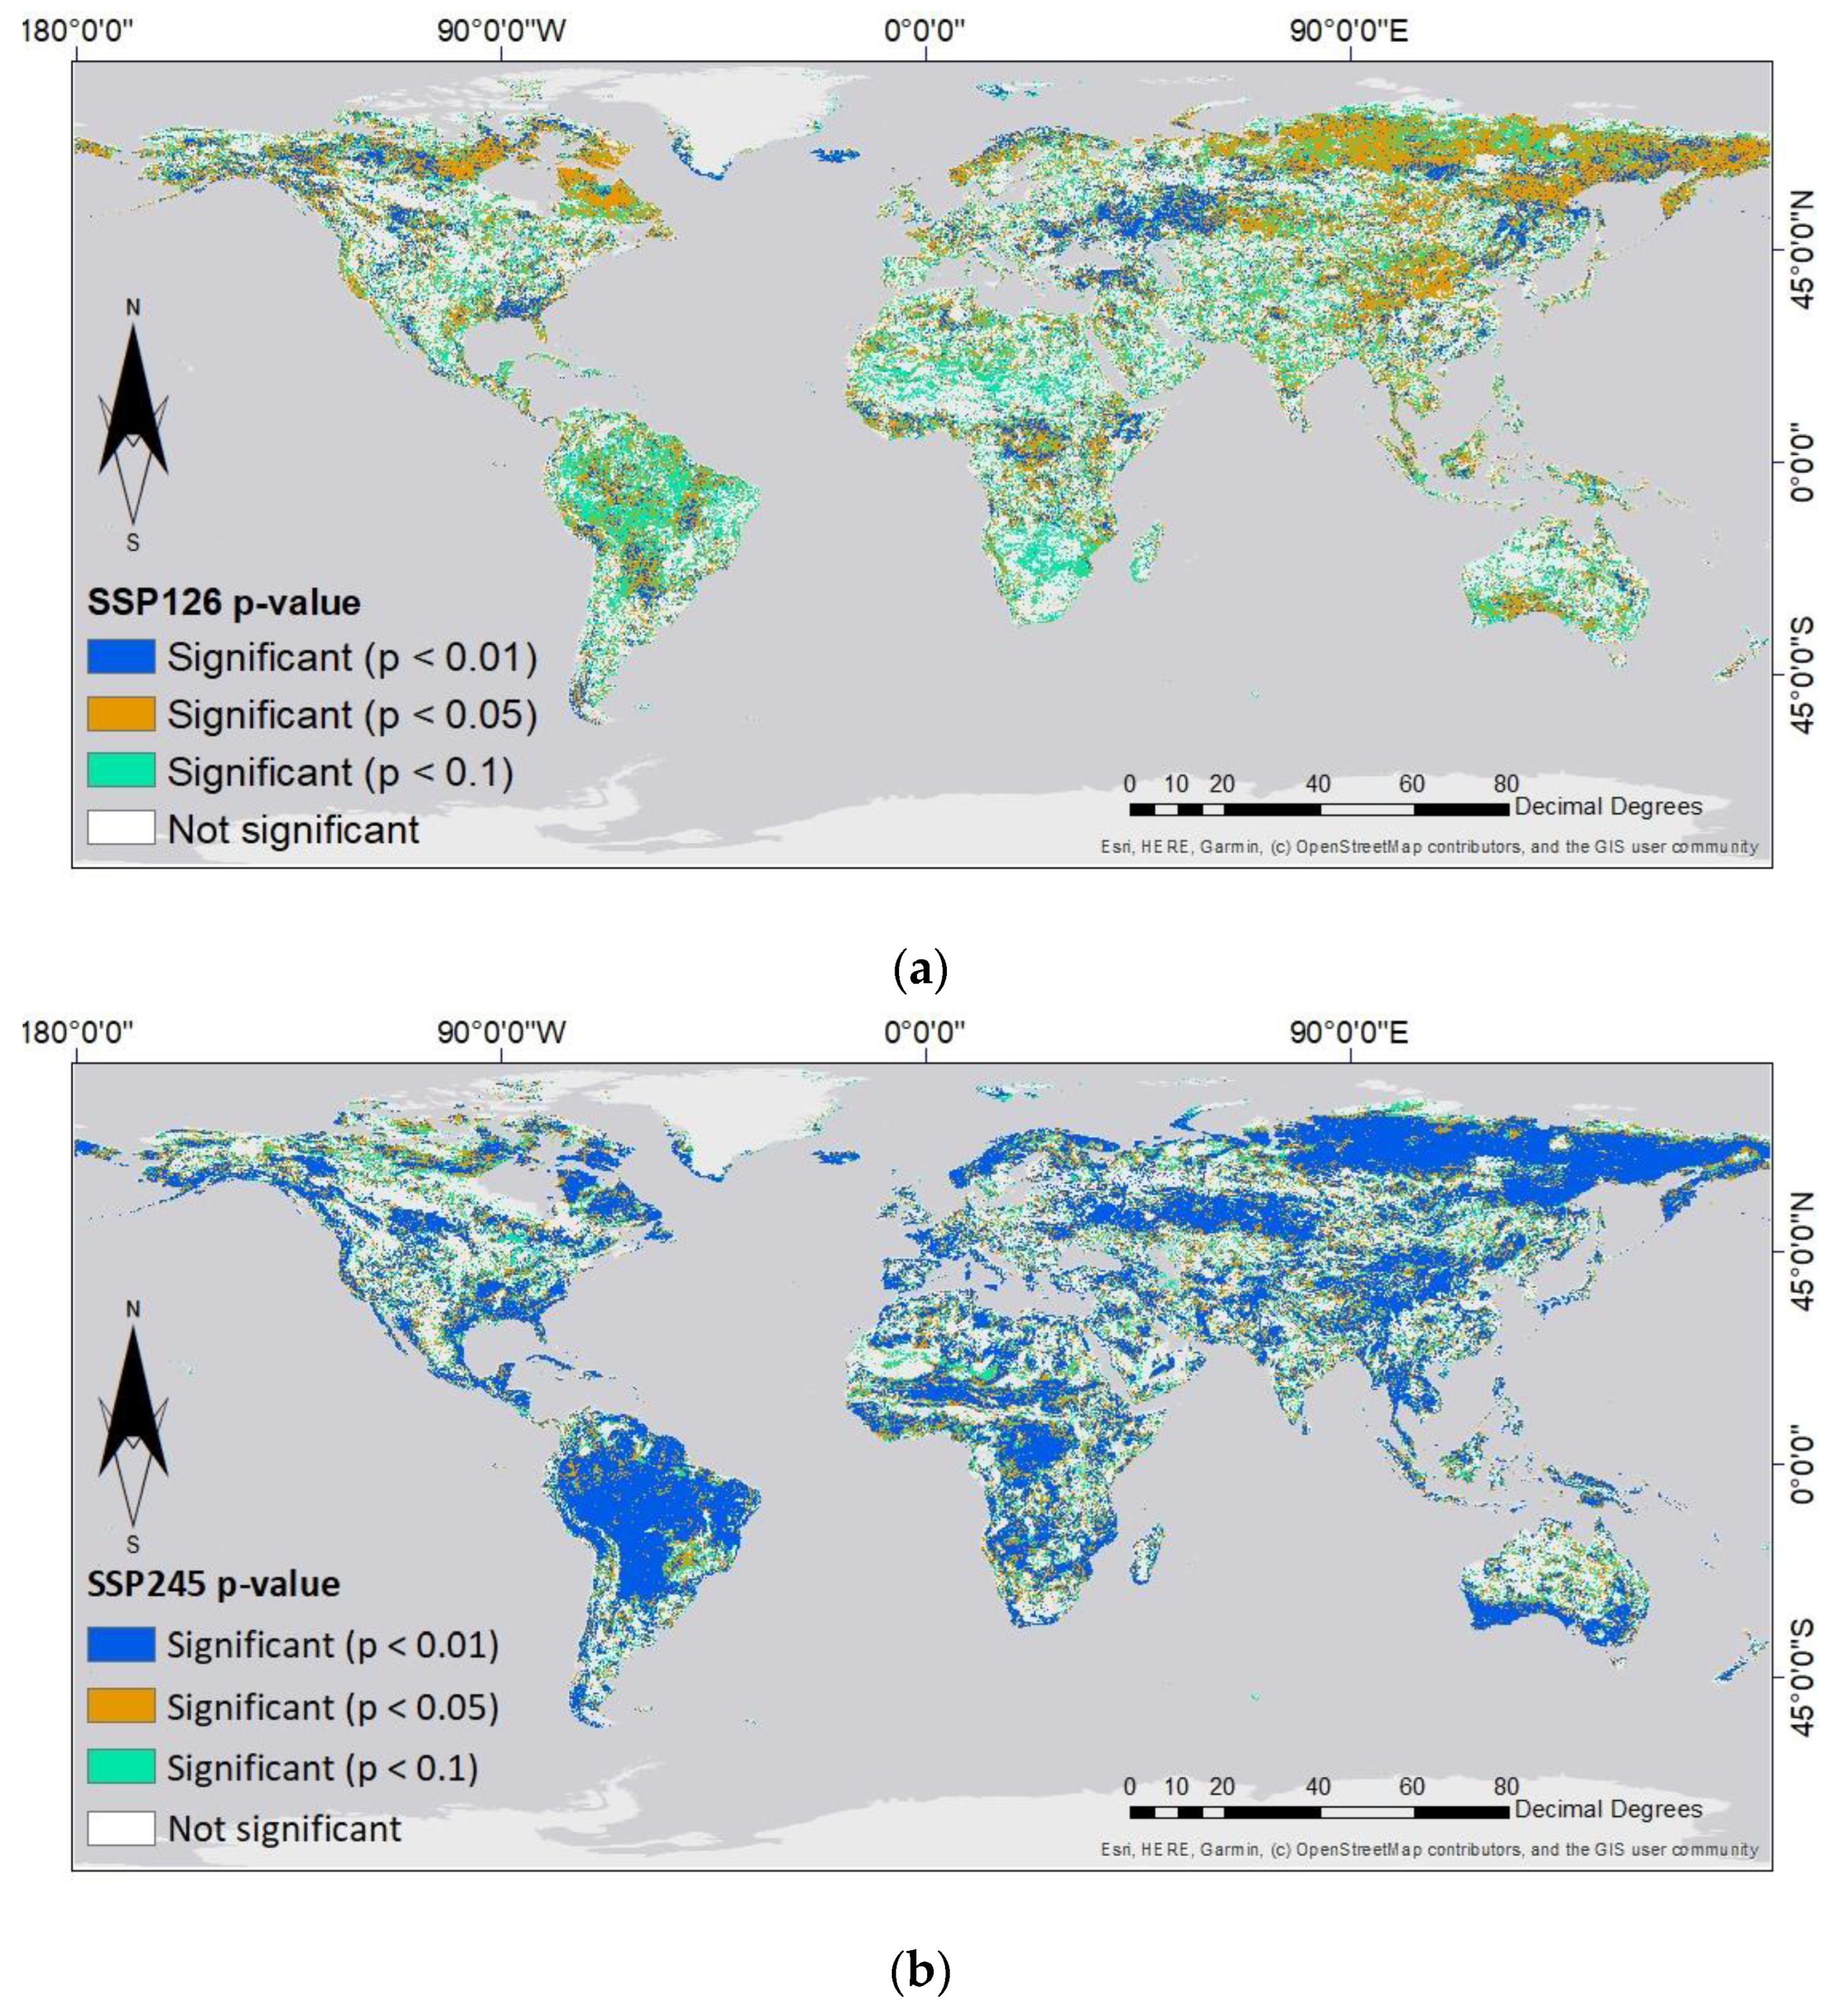
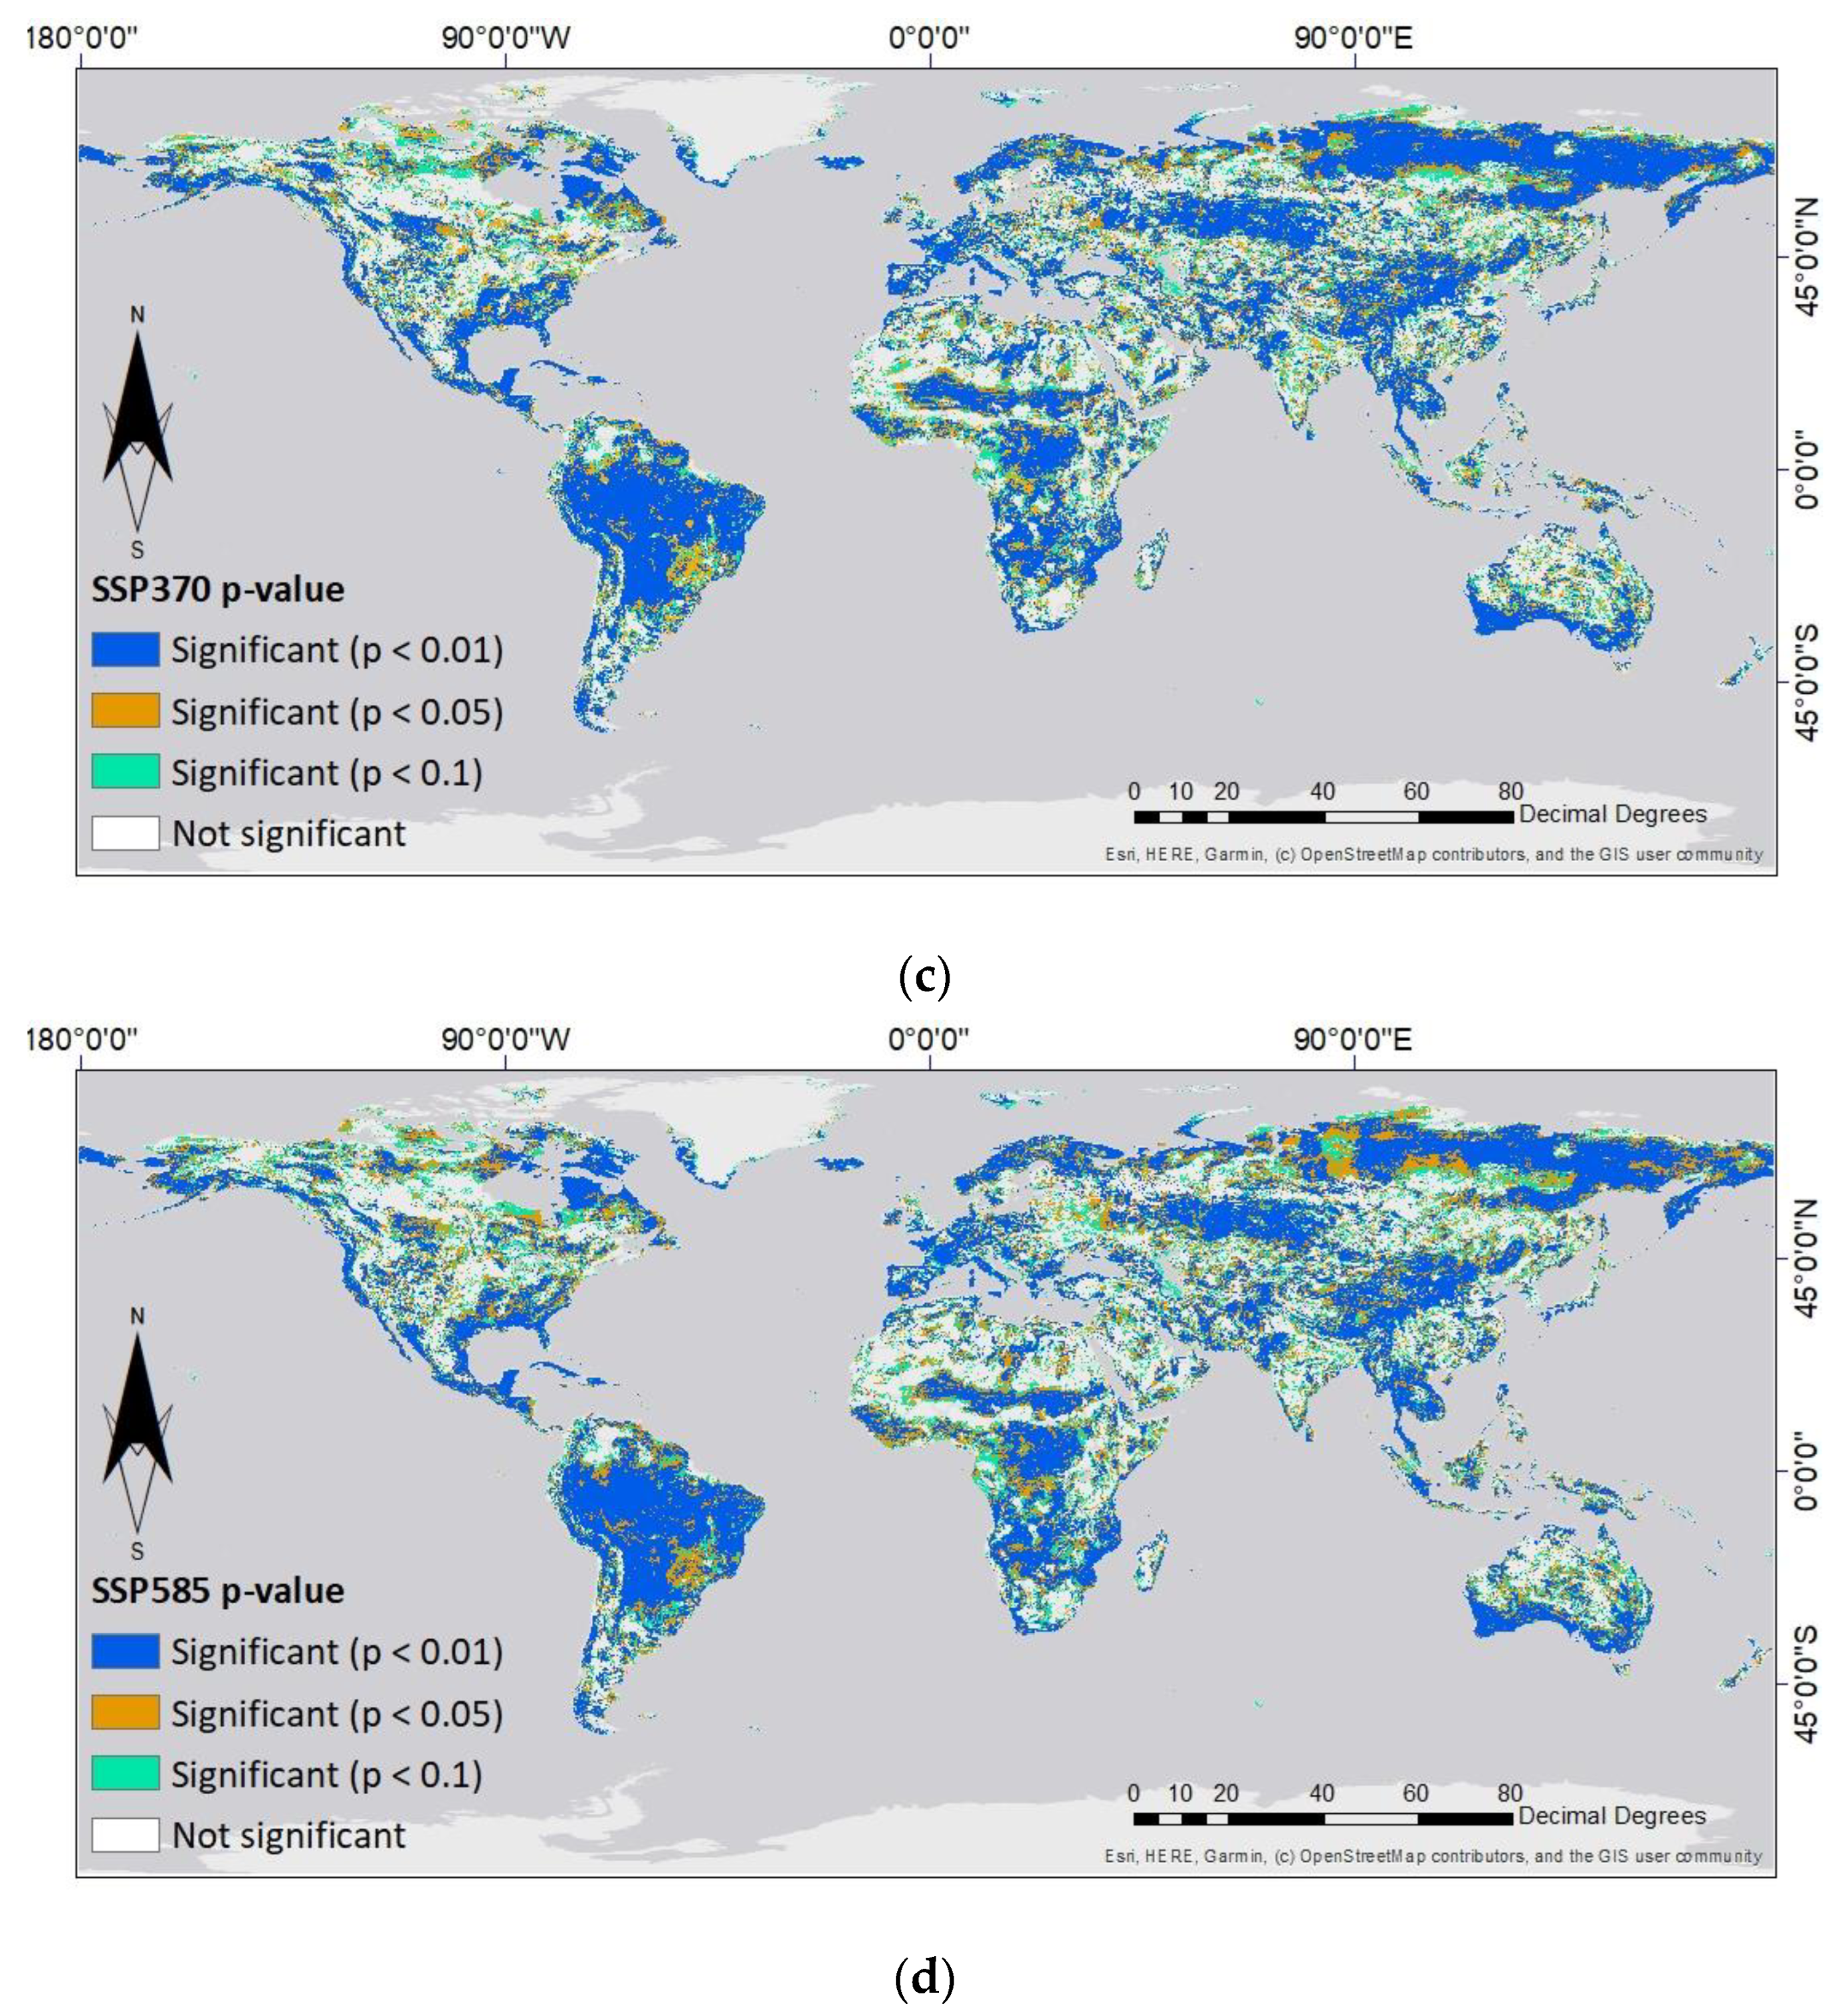
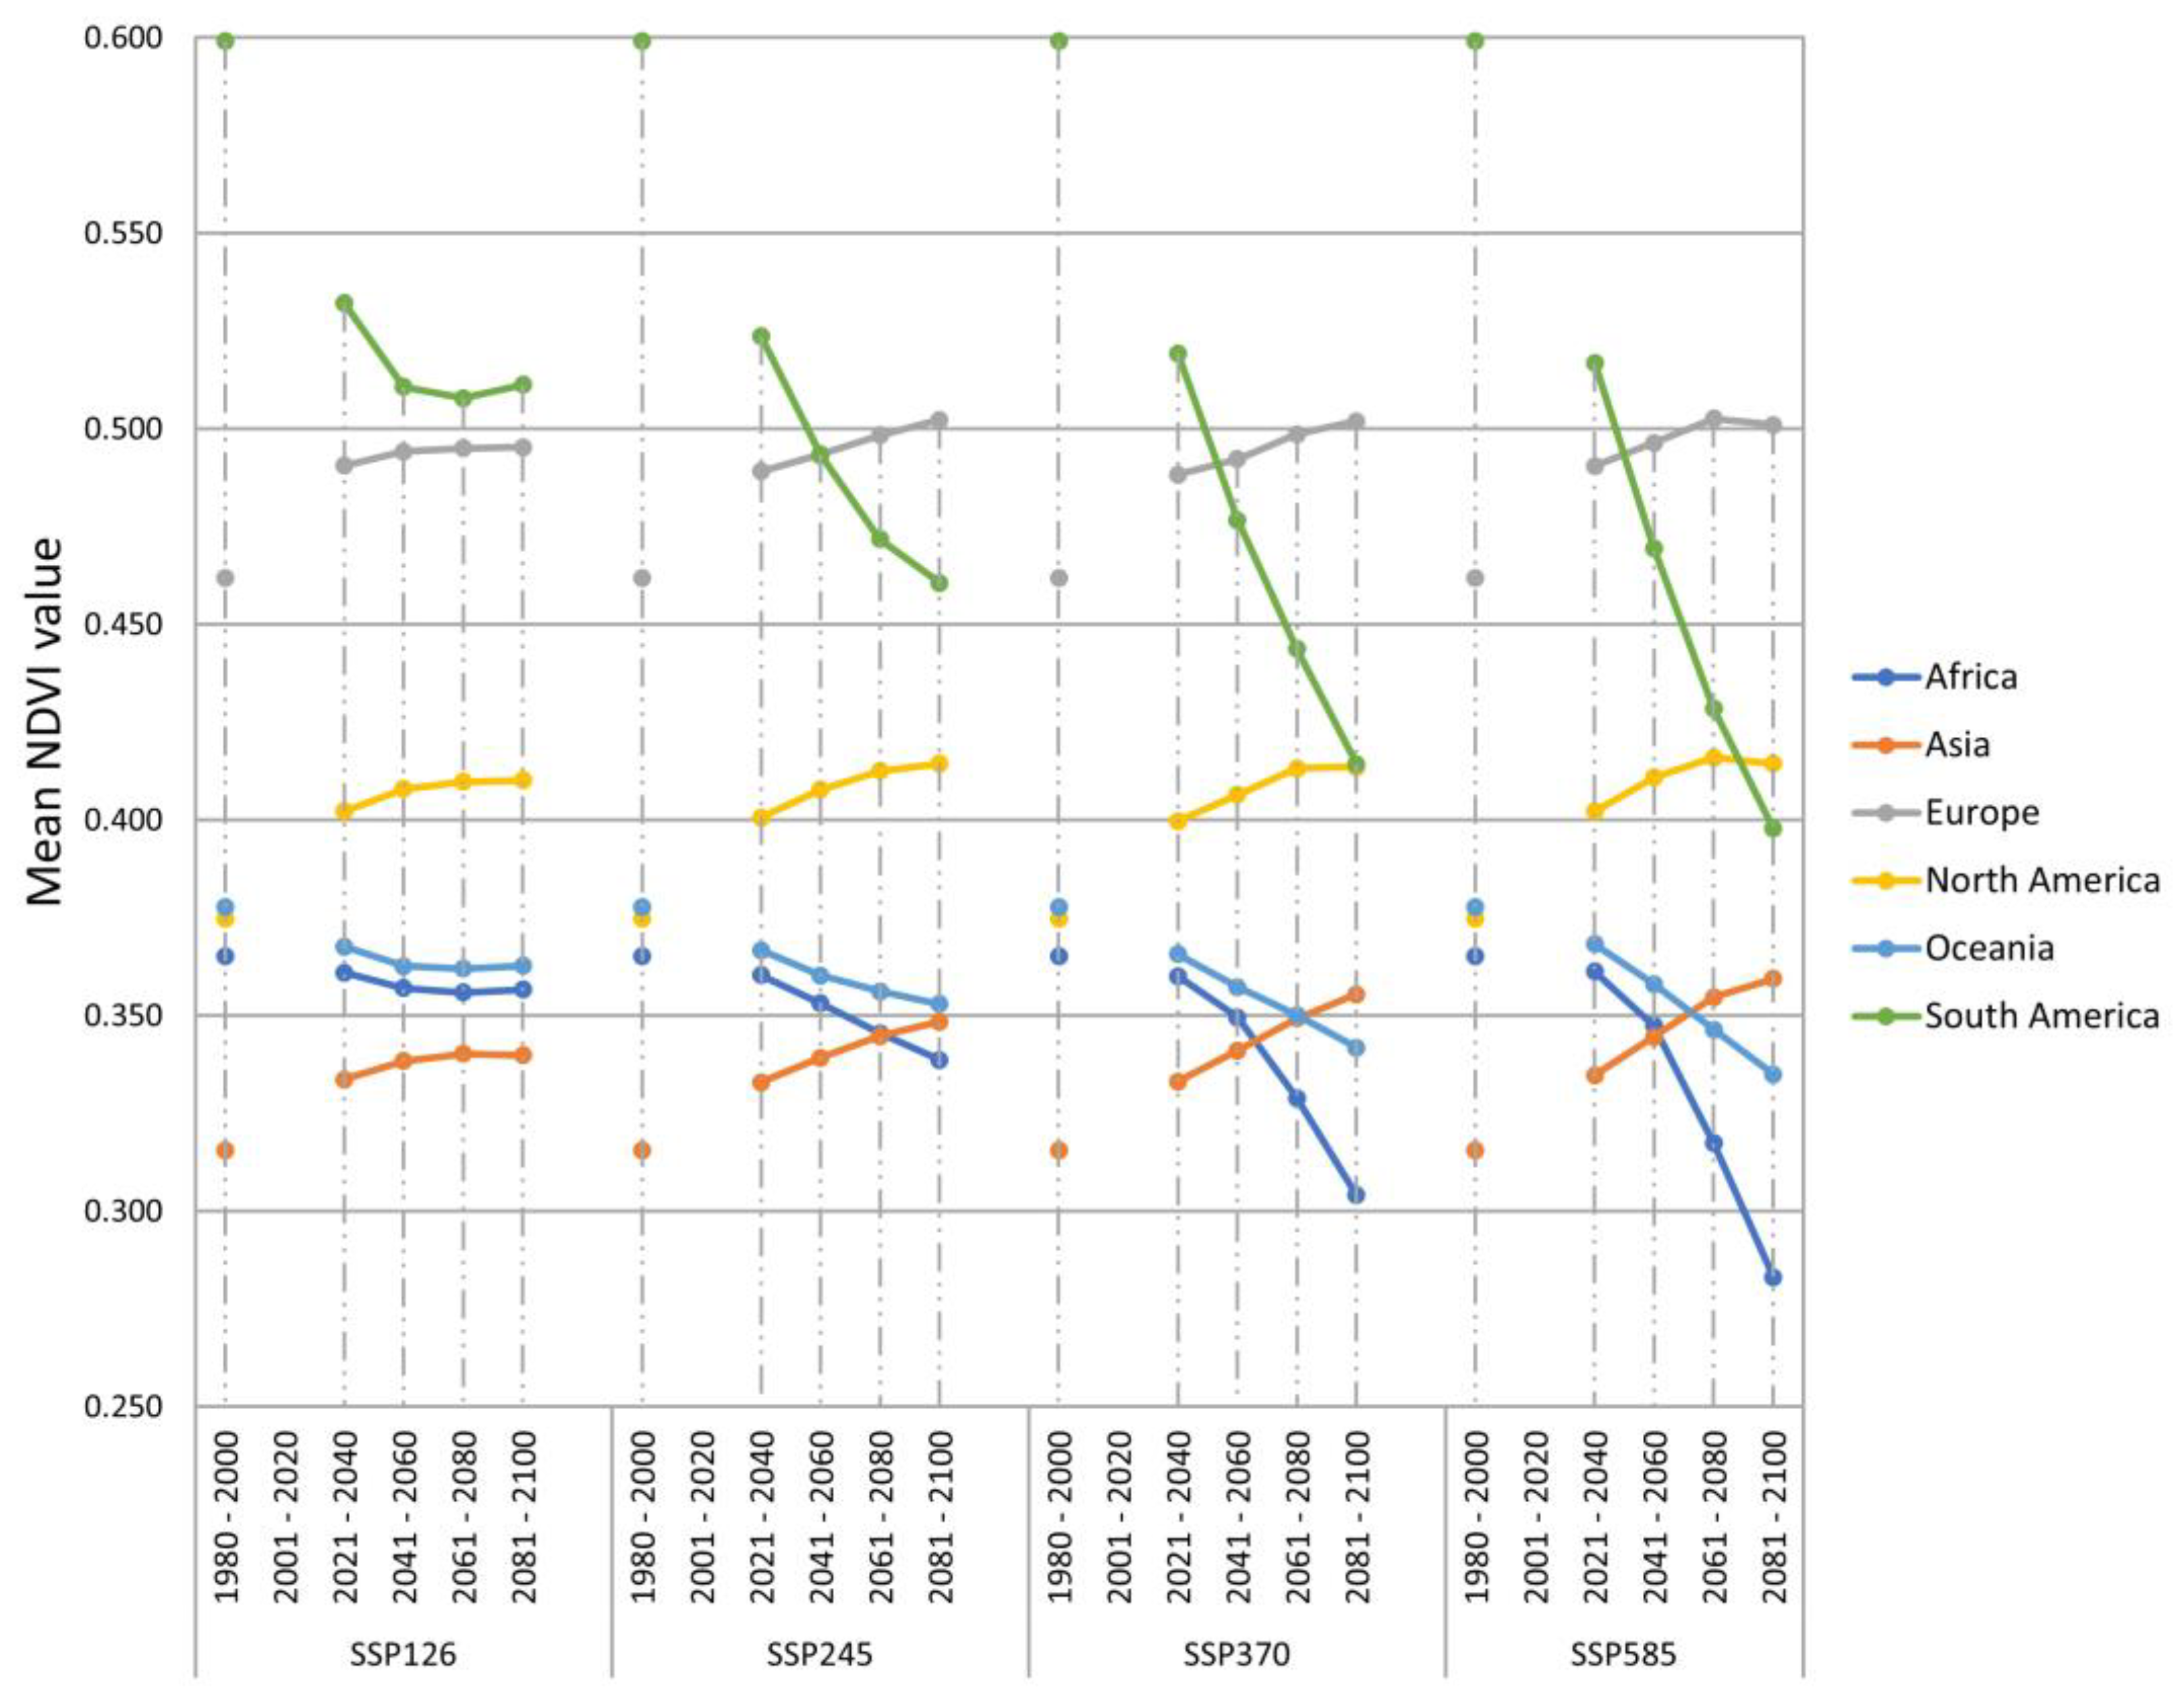
3.3. Statistical Analysis of Simulated Changes in NDVI Values

The Mann-Kendall test results, shown in Figure 7 and Figure 8, play a crucial role in identifying the trend of the NDVI values for each pixel across four distinct scenarios (Figure 7) and in evaluating the statistical significance (p-value) of these trends (Figure 8). Figure 7 illustrates the Mann-Kendall S value through color coding, indicating the trend of the NDVI values: red for a downward trend, green for an upward trend, and yellow for a stable trend. The p-value serves as a measure of the significance of the hypothesis test. This study evaluates the trend of the NDVI values for statistical significance at levels of p < 0.01, p < 0.05, and p < 0.1, as demonstrated in Figure 8. For instance, a p-value below 0.1 at a significance level of 0.1 is considered statistically significant, whereas a p-value exceeding 0.1 indicates a non-significant result.
From Figure 7, the analysis under the SSP126 scenario indicates a predominant increasing trend in the northern part of the northern hemisphere, while other regions exhibit a decreasing trend in the corresponding NDVI values. In the SSP245 scenario, both the increasing (green) and decreasing (red) areas expand, with notable growth in the increasing NDVI values in the northern and eastern parts of Africa. As the scenarios progress to SSP370 and SSP585, the extent of the green and red areas remains relatively unchanged, though there are variations in intensity. Figure 8 reveals that in the SSP126 scenario, the area within the 99% confidence interval (p < 0.01) is limited (blue), but this area significantly expands under the SSP245 scenario. In subsequent SSP370 and SSP585 scenarios, while the area coverage remains relatively stable, local variations are observed. Overall, the results of the Mann-Kendall analysis presented in these figures provide valuable insights into the NDVI value trends under different scenarios, highlighting the potential impact of climate change on the vegetation growth in various regions of the world.
To compare vegetation growth across different regions of the world, Figure 9 presents the predicted NDVI values for six continents: Africa, Asia, Europe, North America, Oceania, and South America. The figure provides valuable insights by comparing the predicted NDVI values for each region across different SSP scenarios and time periods. The predicted NDVI values for Africa, South America, and Oceania indicate a significant decline over time, except under scenario SSP126 between 2081 and 2100. Conversely, the predicted NDVI values in North America and Europe experience an upward trend under different SSP scenarios, except under scenario SSP585 from 2081 to 2100. For Asia, there is an overall increasing trend, with the exception of scenario SSP126 during 2081–2100. Furthermore, when considering the predicted NDVI values within each region, variations can be observed across scenarios and time periods. For instance, in South America, the predicted NDVI values generally decline across all SSP scenarios, with the most substantial decrease observed in the SSP585 scenario. Similarly, in Africa, the predicted NDVI values generally decrease in all scenarios, with the most significant reduction occurring in the SSP585 scenario.
Comparing our results to those of Teng [25], who focused on the maximum NDVI values under climate change, reveals interesting insights. While Teng’s study compared historical data with the last two decades of the 21st century (2081–2100), our analysis encompasses the entire climate change period (2021–2100). Both studies concur on the significance of annual precipitation and temperature-related factors in determining the NDVI values. However, Teng emphasized annual total precipitation as the most crucial factor, followed by soil organic carbon, annual mean temperature, and annual nitrogen deposition. In contrast, our study identified BIO5 (max temperature of warmest month) as the most influential factor, followed by BIO10 (mean temperature of warmest quarter), BIO12 (annual precipitation), and BIO8 (mean temperature of wettest quarter). Regarding the NDVI values under climate change, Teng observed an increasing trend in the maximum NDVI values under scenarios SSP126, SSP245, and SSP370, and a decreasing trend under scenario SSP585. We have observed an upward trend in low-emission climate scenarios (SSP126 and SSP245) and a downward trend in high-emission scenarios (SSP370 and SSP585).

4. Conclusions

This study aimed to investigate the potential impact of climate change on vegetation growth by applying a machine learning model to predict the NDVI values. The input data used in the model included various climate factors such as temperature, rainfall, bioclimatic factors, and topographic factors. The results indicate that the machine learning model performed exceptionally well in predicting the NDVI values. The most significant factors that affected the NDVI values were BIO5, BIO10, BIO12, and BIO8.
The observed distribution of the predicted NDVI values highlights the complexity and regional variability in the impact of climate change on vegetation growth. Nonetheless, the results suggest that the impact of climate change on vegetation growth will be substantial under a high-emission scenario. In contrast, a low-emission scenario could help to avoid this impact. This underscores the significance of adopting effective climate change mitigation and adaptation policies that could minimize the effect of greenhouse gas emissions on vegetation growth and ecosystem health.
The model’s predictions show that under a high-emission climate scenario (SSP370 and SSP585), there is a significant reduction in the NDVI values over time, indicating a decrease in vegetation growth. However, under a low-emission climate scenario (SSP126 and SSP245), the model predicted a slightly increased NDVI value trend over time, suggesting that vegetation growth may be positively impacted by the increasing temperature associated with climate change. Also, the model predicted that climate change’s impact on vegetation growth would be more significant in the long term, as a possibly more pronounced reduction in the NDVI values was observed in the later periods. This highlights the importance of taking a long-term perspective when planning for the impact of climate change on vegetation growth.
Interestingly, when considering the entire period of climate change from 2021 to 2100, we observed a unique feature regarding SSP585. The mean NDVI of SSP585 is higher than SSP245 and SSP370 during 2021–2040, and higher than SSP370 during 2041–2060. However, SSP585 consistently has the lowest mean NDVI value for the remaining two periods. The relationship between increased temperature and vegetation growth explained this (Figure 6).
Overall, the predicted distribution of the NDVI values under different scenarios and periods provides valuable information for understanding the potential impact of climate change on vegetation growth and can help inform policy decisions and management strategies to mitigate its effects. Furthermore, this study’s application of a machine learning model to predict the NDVI values under different climate scenarios and its use of multiple influencing factors on vegetation growth contributes to the ongoing research on the topic. It highlights the potential of using machine learning to study climate change and its impact on the Earth’s ecosystems. Future research should focus on understanding the ecological mechanisms driving these relationships, extending analyses beyond 2100, integrating socio-economic factors, and leveraging advancements in technology to refine predictive models. These efforts can contribute to more effective policies and strategies for preserving ecosystems and biodiversity in the face of climate change.
In conclusion, this study provides critical insights into the potential impact of climate change on vegetation growth by predicting the NDVI values using a machine learning model. The results highlight the importance of adopting effective climate change mitigation and adaptation policies to minimize the effects of greenhouse gas emissions on vegetation growth and ecosystem health. Additionally, the research confirms the effectiveness of machine learning techniques for modeling complex ecological systems and predicting trends in response to external factors such as climate change. The findings are expected to inform future research and policy decisions aimed at mitigating the effects of climate change on global ecosystems and biodiversity.

Author Contributions

Conceptualization, K.A.N.; data curation, K.A.N.; funding acquisition, U.S. and W.C.; investigation, K.A.N. and W.C.; methodology, K.A.N., U.S. and W.C.; project administration, U.S. and W.C.; resources, U.S. and W.C.; software, K.A.N.; supervision, W.C.; validation, W.C.; visualization, K.A.N. and W.C.; writing—original draft, K.A.N. and W.C.; writing—review and editing, K.A.N., U.S., and W.C. All authors have read and agreed to the published version of the manuscript.

Funding

This study was partially supported by the Ministry of Science and Technology (Taiwan) Research Project (Grant Number MOST 111-2121-M-027-001) and the National Taipei University of Technology-King Mongkut’s Institute of Technology Ladkrabang Joint Research Program (Grant Number NTUT-KMITL-111-02).

Data Availability Statement

The data used in this study is either publicly available at the sources cited or not publicly available due to restrictions imposed by the data owner or source. Therefore, the data cannot be disseminated or shared as part of this publication. Interested researchers can request access to the data directly from the data owner or source, subject to their terms and conditions. The authors confirm that they do not have the right to distribute the data used in this study.

Acknowledgments

We express our gratitude to the anonymous reviewers for their constructive feedback, which has significantly strengthened the quality of this paper.

Conflicts of Interest

The authors declare no conflict of interest.

References

  1. Wyser, K.; van Noije, T.; Yang, S.; von Hardenberg, J.; O’Donnell, D.; Döscher, R. On the increased climate sensitivity in the EC-Earth model from CMIP5 to CMIP6. Geosci. Model Dev. 2019, 13, 3465–3474. [Google Scholar] [CrossRef]
  2. Onyutha, C.; Asiimwe, A.; Ayugi, B.; Ngoma, H.; Ongoma, V.; Tabari, H. Observed and future precipitation and evapotranspiration in water management zones of Uganda: CMIP6 projections. Atmosphere 2021, 12, 887. [Google Scholar] [CrossRef]
  3. Raji, P.; Shiny, R.; Byju, G. Impact of climate change on the potential geographical suitability of cassava and sweet potato vs. rice and potato in India. Theor. Appl. Climatol. 2021, 146, 941–960. [Google Scholar] [CrossRef]
  4. Shah, S.; Adhikari, A.; Tiwari, A.; Talchabhadel, R. Seasonal Drought Index Predictability for Historical and Future periods Using Worldclim over the Southern Plain of Himalayan Tarai. In Proceedings of the AGU Fall Meeting Abstracts, New Orleans, LA, USA, 13–17 December 2021; Volume 2021, p. H45M-1328. [Google Scholar]
  5. Alsafadi, K.; Bi, S.; Abdo, H.G.; Almohamad, H.; Alatrach, B.; Srivastava, A.K.; Al-Mutiry, M.; Bal, S.K.; Chandran, S.M.A.; Mohammed, S. Modeling the impacts of projected climate change on wheat crop suitability in semi-arid regions using the AHP-based weighted climatic suitability index and CMIP6. Geosci. Lett. 2023, 10, 20. [Google Scholar] [CrossRef]
  6. Li, G.; Chen, W.; Zhang, X.; Bi, P.; Yang, Z.; Shi, X.; Wang, Z. Spatiotemporal dynamics of vegetation in China from 1981 to 2100 from the perspective of hydrothermal factor analysis. Environ. Sci. Pollut. Res. 2022, 29, 14219–14230. [Google Scholar] [CrossRef]
  7. Zhao, Q.; Zhu, Z.; Zeng, H.; Zhao, W.; Myneni, R.B. Future greening of the Earth may not be as large as previously predicted. Agric. For. Meteorol. 2020, 292, 108111. [Google Scholar] [CrossRef]
  8. Yuan, W.; Wu, S.Y.; Hou, S.; Xu, Z.; Pang, H.; Lu, H. Projecting future vegetation change for Northeast China using CMIP6 model. Remote Sens. 2021, 13, 3531. [Google Scholar] [CrossRef]
  9. Ma, B.; Zeng, W.; Hu, G.; Cao, R.; Cui, D.; Zhang, T. Normalized difference vegetation index prediction based on the delta downscaling method and back-propagation artificial neural network under climate change in the Sanjiangyuan region, China. Ecol. Inform. 2022, 72, 101883. [Google Scholar] [CrossRef]
  10. Ren, J.; Tong, S.; Ying, H.; Mei, L.; Bao, Y. Historical and Future Changes in Extreme Climate Events and Their Effects on Vegetation on the Mongolian Plateau. Remote Sens. 2022, 14, 4642. [Google Scholar] [CrossRef]
  11. Kawabata, A.; Ichii, K.; Yamaguchi, Y. Global monitoring of interannual changes in vegetation activities using NDVI and its relationships to temperature and precipitation. Int. J. Remote Sens. 2001, 22, 1377–1382. [Google Scholar] [CrossRef]
  12. Wang, J.; Rich, P.M.; Price, K.P. Temporal responses of NDVI to precipitation and temperature in the central Great Plains, USA. Int. J. Remote Sens. 2003, 24, 2345–2364. [Google Scholar] [CrossRef]
  13. Nguyen, K.A.; Chen, W.; Lin, B.S.; Seeboonruang, U. Comparison of ensemble machine learning methods for soil erosion pin measurements. ISPRS Int. J. Geo-Inf. 2021, 10, 42. [Google Scholar] [CrossRef]
  14. Willemink, M.J.; Koszek, W.A.; Hardell, C.; Wu, J.; Fleischmann, D.; Harvey, H.; Folio, L.R.; Summers, R.M.; Rubin, D.L.; Lungren, M.P. Preparing medical imaging data for machine learning. Radiology 2020, 295, 4–15. [Google Scholar] [CrossRef]
  15. Kratsch, W.; Manderscheid, J.; Röglinger, M.; Seyfried, J. Machine learning in business process monitoring: A comparison of deep learning and classical approaches used for outcome prediction. Bus. Inf. Syst. Eng. 2021, 63, 261–276. [Google Scholar] [CrossRef]
  16. Talukdar, S.; Singha, P.; Mahato, S.; Pal, S.; Liou, Y.A.; Rahman, A. Land-use land-cover classification by machine learning classifiers for satellite observations—A review. Remote Sens. 2020, 12, 1135. [Google Scholar] [CrossRef]
  17. Zhao, J.; Wang, L.; Yang, H.; Wu, P.; Wang, B.; Pan, C.; Wu, Y. A Land Cover Classification Method for High-Resolution Remote Sensing Images Based on NDVI Deep Learning Fusion Network. Remote Sens. 2022, 14, 5455. [Google Scholar] [CrossRef]
  18. Michael, Y.; Helman, D.; Glickman, O.; Gabay, D.; Brenner, S.; Lensky, I.M. Forecasting fire risk with machine learning and dynamic information derived from satellite vegetation index time-series. Sci. Total Environ. 2021, 764, 142844. [Google Scholar] [CrossRef] [PubMed]
  19. Johnson, M.D.; Hsieh, W.W.; Cannon, A.J.; Davidson, A.; Bédard, F. Crop yield forecasting on the Canadian Prairies by remotely sensed vegetation indices and machine learning methods. Agric. For. Meteorol. 2016, 218, 74–84. [Google Scholar] [CrossRef]
  20. Ichii, K.; Kawabata, A.; Yamaguchi, Y. Global correlation analysis for NDVI and climatic variables and NDVI trends: 1982–1990. Int. J. Remote Sens. 2002, 23, 3873–3878. [Google Scholar] [CrossRef]
  21. De Jong, R.; de Bruin, S.; de Wit, A.; Schaepman, M.E.; Dent, D.L. Analysis of monotonic greening and browning trends from global NDVI time-series. Remote Sens. Environ. 2011, 115, 692–702. [Google Scholar] [CrossRef]
  22. Yang, Y.; Wang, S.; Bai, X.; Tan, Q.; Li, Q.; Wu, L.; Tian, S.; Hu, Z.; Li, C.; Deng, Y. Factors Affecting Long-Term Trends in Global NDVI. Forests 2019, 10, 372. [Google Scholar] [CrossRef]
  23. Liu, Y.; Li, Y.; Li, S.; Motesharrei, S. Spatial and temporal patterns of global NDVI trends: Correlations with climate and human factors. Remote Sens. 2015, 7, 13233–13250. [Google Scholar] [CrossRef]
  24. Wu, D.; Wu, H.; Zhao, X.; Zhou, T.; Tang, B.; Zhao, W.; Jia, K. Evaluation of spatiotemporal variations of global fractional vegetation cover based on GIMMS NDVI data from 1982 to 2011. Remote Sens. 2014, 6, 4217–4239. [Google Scholar] [CrossRef]
  25. Teng, H.; Chen, S.; Hu, B.; Shi, Z. Future changes and driving factors of global peak vegetation growth based on CMIP6 simulations. Ecol. Inform. 2023, 75, 102031. [Google Scholar] [CrossRef]
  26. Fick, S.E.; Hijmans, R.J. WorldClim 2: New 1km spatial resolution climate surfaces for global land areas. Int. J. Climatol. 2017, 37, 4302–4315. [Google Scholar] [CrossRef]
  27. Amatulli, G.; Domisch, S.; Tuanmu, M.N.; Parmentier, B.; Ranipeta, A.; Malczyk, J.; Jetz, W. A suite of global, cross-scale topographic variables for environmental and biodiversity modeling. Sci. Data 2018, 5, 180040. [Google Scholar] [CrossRef]
  28. Nguyen, K.A.; Chen, W.; Lin, B.S.; Seeboonruang, U.; Thomas, K. Predicting sheet and rill erosion of Shihmen reservoir watershed in Taiwan using machine learning. Sustainability 2019, 11, 3615. [Google Scholar] [CrossRef]
  29. Nguyen, K.A.; Chen, W. DEM-and GIS-Based Analysis of Soil Erosion Depth Using Machine Learning. ISPRS Int. J. Geo-Inf. 2021, 10, 452. [Google Scholar] [CrossRef]
  30. Tsai, F.; Lai, J.S.; Nguyen, K.A.; Chen, W. Determining cover management factor with remote sensing and spatial analysis for improving long-term soil loss estimation in watersheds. ISPRS Int. J. Geo-Inf. 2021, 10, 19. [Google Scholar] [CrossRef]
  31. Nguyen, K.A.; Chen, W.; Lin, B.S.; Seeboonruang, U. Using machine learning-based algorithms to analyze erosion rates of a watershed in Northern Taiwan. Sustainability 2020, 12, 2022. [Google Scholar] [CrossRef]
  32. Breiman, L. Random forests. Mach. Learn. 2001, 45, 5–32. [Google Scholar] [CrossRef]
  33. Mann, H.B. Non-parametric tests against trend. Econom. J. Econom. Soc. 1945, 13, 245–259. [Google Scholar]
  34. Kendall, M.G. Rank Correlation Methods, 4th ed.; Charles Griffin: London, UK, 1975. [Google Scholar]
  35. Gilbert, R.O. Statistical Methods for Environmental Pollution Monitoring; John Wiley & Sons: Hoboken, NJ, USA, 1987. [Google Scholar]
Figure 1. Flowchart of this study.
Environments 10 00204 g001
Figure 2. Distribution of the mean NDVI value calculated over the 20-year period from 1981 to 2000.
Environments 10 00204 g002
Figure 3. Crucial factors in the random forest model: (a) %IncMSE, and (b) IncNodePurity.
Environments 10 00204 g003
Figure 4. NDVI predictions for selected scenarios and time periods: (a) SSP126 from 2021 to 2040, (b) SSP126 from 2081 to 2100, (c) SSP585 from 2021 to 2040, and (d) SSP585 from 2081 to 2100.
Environments 10 00204 g004aEnvironments 10 00204 g004b
Figure 5. Global mean NDVI value illustrated under different scenarios, highlighting variations and trends.
Environments 10 00204 g005
Figure 6. Plot of the relationship between increasing temperatures and the corresponding NDVI values.
Environments 10 00204 g006
Figure 7. Results of the Mann-Kendall test (S values), depicting trends in the NDVI values under various scenarios: (a) SSP126, (b) SSP245, (c) SSP370, and (d) SSP585.
Environments 10 00204 g007aEnvironments 10 00204 g007b
Figure 8. Results of the Mann-Kendall test illustrating areas categorized by different significance levels (p-values) across various scenarios: (a) SSP126, (b) SSP245, (c) SSP370, and (d) SSP585.
Environments 10 00204 g008aEnvironments 10 00204 g008b
Figure 9. Comparison of the mean NDVI values across continents under various scenarios, highlighting differences and trends.
Environments 10 00204 g009
Table 1. List of bioclimatic variables.
No.CodesMeaning
1BIO1Annual Mean Temperature
2BIO2Mean Diurnal Range (Mean of monthly (max temperature − min temperature))
3BIO3Isothermality (BIO2/BIO7) (×100)
4BIO4Temperature Seasonality (standard deviation ×100)
5BIO5Max Temperature of Warmest Month
6BIO6Min Temperature of Coldest Month
7BIO7Temperature Annual Range (BIO5–BIO6)
8BIO8Mean Temperature of Wettest Quarter
9BIO9Mean Temperature of Driest Quarter
10BIO10Mean Temperature of Warmest Quarter
11BIO11Mean Temperature of Coldest Quarter
12BIO12Annual Precipitation
13BIO13Precipitation of Wettest Month
14BIO14Precipitation of Driest Month
15BIO15Precipitation Seasonality (Coefficient of Variation)
16BIO16Precipitation of Wettest Quarter
17BIO17Precipitation of Driest Quarter
18BIO18Precipitation of Warmest Quarter
19BIO19Precipitation of Coldest Quarter
Table 2. List of topographic variables.
No.CodesMeaning
1ELEVElevation
2ROURoughness
3TRITerrain Ruggedness Index
4TPITopographic Position Index
5VRMVector Ruggedness Measure
6ACOSAspect Cosine
7ASINAspect Sine
8SLOPESlope
9ENESSEastness
10NNESSNorthness
11PCURVProfile curvature
12TCURVTangential curvature
13DXFirst-order partial derivative (E–W slope)
14DYFirst-order partial derivative (N–S slope)
15DXXSecond-order partial derivative (E–W slope)
16DYYSecond-order partial derivative (N–S slope)
Table 3. Average performance of the random forest model in predicting the NDVI values using training and test datasets after 30 trials.
Training Test
AverageStandard DeviationAverageStandard Deviation
Number of samples 4164 1785
RMSE0.050 0.0010.108 0.006
NSE0.9820.0010.9130.011
Disclaimer/Publisher’s Note: The statements, opinions and data contained in all publications are solely those of the individual author(s) and contributor(s) and not of MDPI and/or the editor(s). MDPI and/or the editor(s) disclaim responsibility for any injury to people or property resulting from any ideas, methods, instructions or products referred to in the content.

