Article

A Comparative Study of Heavy Metal Pollution in Ambient Air and the Health Risks Assessment in Industrial, Urban and Semi-Urban Areas of West Bengal, India: An Evaluation of Carcinogenic, Non-Carcinogenic, and Additional Lifetime Cancer Cases

1
Department of Environmental Studies, Siksha Bhavana (Institute of Science), Visva-Bharati, Santiniketan 731235, India
2
Department of Biology, University of Saskatchewan, Saskatoon, SK S7N 5E2, Canada
3
Toxicology Centre, University of Saskatchewan, Saskatoon, SK S7N 5E2, Canada
4
School of Environment and Sustainability, University of Saskatchewan, Saskatoon, SK S7N 5E2, Canada
*
Author to whom correspondence should be addressed.
Environments 2023, 10(11), 190; https://doi.org/10.3390/environments10110190
Submission received: 22 August 2023 / Revised: 29 September 2023 / Accepted: 1 October 2023 / Published: 1 November 2023
(This article belongs to the Special Issue Air Pollution in Urban and Industrial Areas II)

Abstract

:
Air pollution is an immense problem due to its detrimental health effects on human populations. This study investigates the distribution of particle-bound heavy metals and associated health risks in three diverse areas (Durgapur as an industrial complex, Kolkata as an urban area, and Bolpur as a semi-urban region) in West Bengal, India. Twenty-one (84 samples) sampling sites were chosen, covering industrial, traffic, residential, and sensitive zones. The respirable suspended particulate matter (RSPM) samples were collected using a portable Mini-Vol Tactical Air Sampler, and heavy metal concentrations (Cd, Cr, Mn, Ni, Pb, and As) were analyzed using ICP-OES. The non-carcinogenic and carcinogenic health risks were assessed using exposure concentration (EC), hazard quotient (HQ), hazard index (HI), and additional lifetime cancer cases. The results highlight variations in heavy metal concentrations across the regions, with industrial areas exhibiting higher levels. Principal component analysis (PCA) unveiled distinct metal co-variation patterns, reflecting sources such as industrial emissions, traffic, and natural contributors. The sum of non-carcinogenic risks (HI) of all heavy metals exceeded the US EPA’s risk limit (HI<1) in both Kolkata and Durgapur, except for Bolpur. Similarly, the sum of cancer risk in three distinct areas exceeded the USEPA limits (1.00E-06). The Monte Carlo simulation revealed the 5th and 95th percentile range of cancer risk was 9.12E-06 to 1.12E-05 in Bolpur, 3.72E-05 to 4.49E-05 in Durgapur and 2.13E-05 to 2.57E-05 in Kolkata. Kolkata had the highest additional lifetime cancer cases compared to Bolpur and Durgapur. This study provides information on the complex connections between heavy metal pollution and possible health risks in industrial, urban, and semi-urban regions.

1. Introduction

Outdoor air pollution is a major problem worldwide due to its effects on human health, with a wide range of adverse impacts shown in exposed populations. According to the World Health Organization [1], it was estimated that the effects of outdoor air pollution caused 4.2 million premature deaths worldwide in 2016 in urban and rural areas. Long-term exposure to outdoor air pollution has exacerbated pre-existing asthma and chronic obstructive pulmonary disorder (COPD) in patients, increased the risk of cardiopulmonary disease (range of conditions that affect the heart and lungs), and altered biochemical factors [2,3]. The number of deaths attributed to PM10exposure in Mumbai and Delhi rose to 32,014 and 48,651, respectively, in 2015, in comparison to 19,291 and 19,716 in 1995. The total Disability-Adjusted Life Years (DALYs) attributed to PM10 pollution experienced an increase from 0.34 million to 0.51 million in Mumbai and from 0.34 million to 0.75 million in Delhi between 1995 and 2015 [4]. The Global Burden of Disease Study (2019) in India reported that about 1.67 million (95% uncertainty interval 1.42–1.92) deaths were attributable to air pollution, i.e., 17.8% (15.8–19.5) of the total deaths in the country [5]. There are numerous ways that air pollutants enter the atmosphere, and anthropogenic activities are one of them. In a few decades, the rapid growth of the industrial sector, urban sector, thermal power plants, the extension of agriculture using more pesticides and fertilizer, and the use of fossil fuels in various sectors in uncontrolled ways has released tons of air pollution [6,7,8]. Respirable suspended particulate matter (RSPM), a significant component of air pollution, has drawn much attention due to its severe impacts on human health [9]. These particles can come from several sources, such as industrial operations, construction activities, automobile emissions, and dust and pollen from natural processes [10,11,12]. The inclusion of heavy metals in RSPM is particularly concerning since it has complicated the health hazards of exposure to these airborne contaminants. Heavy metals, such as lead (Pb), cadmium (Cd), nickel (Ni), mercury (Hg), arsenic (AS), and others, can be hazardous even at low concentrations [13,14,15]. These metals can be released into the atmosphere by a number of human activities, including mining, industrial processes, emissions from vehicles, and the burning of fossil fuels [9,13,16]. People unknowingly breathe this mixture of harmful gases containing particle-bound heavy metals. As a result, long-term exposure shows detrimental consequences on their health. It is generally known that exposure to RSPM and the heavy metals thatcreates health concerns. When RSPM particles are inhaled, they can enter the circulatory system and penetrate deep into the respiratory system, possibly even reaching the lungs’ alveoli. Inhalation is a direct route for distributing poisonous heavy metals to crucial organs and tissues, which has a variety of detrimental impacts on health [17,18]. Chronic exposure to heavy metals by RSPM has been associated with several health issues, including cancer risk, cognitive impairments, cardiovascular abnormalities, and respiratory illnesses [8]. The International Agency for Research on Cancer (IARC) has designated several heavy metals, including Cd, Cr (VI), As, and Ni, as Group 1 carcinogens for humans [19]. These airborne heavy metals pose a serious environmental risk and may be harmful to the health of those who are exposed to them. These metals can cause significant health problems such as lung cancer, cardiovascular disease, high blood pressure, renal damage, reproductive disorders, neurological problems, asthma, and bronchitis. Additionally, it also impacts children’s cognitive growth, lowering IQ, learning difficulties, and behavioral issues [20,21,22,23,24].
After carefully examining the relevant scientific literature and empirical studies, the primary objectives of this research are to (i) measure the specific concentration of RSPM in industrial, urban, and semi-urban areas ambient environment, (ii) analyze the spatial variations of particulate-containing heavy metals, and (iii) estimatetheir potential health risks, such as using the carcinogenic (CR) and non-carcinogenic health indices (HQ and HI), and calculate the additional lifetime cancer cases in industrial, urban, and semi-urban regions of West Bengal, India. The health impact of air pollution is a major concern in the studied region (eastern India), and there is a lack of research highlighting the need for air quality management. The innovative aspects of our study lie in its multi-region, multi-metal, and multi-risk assessment approach. By considering diverse regions and using comprehensive sampling, health risk assessment, and probabilistic analysis, our research offers a more nuanced understanding of heavy metal pollution and its health implications in different settings. It also provides valuable information for policymakers and environmental management in industrial, urban, and semi-urban regions. The findings will serve as a basis for evidence-based policy development for mitigating heavy metal exposure and related human health impacts. Overall, the research is thorough and addresses critical environmental contaminants and health concerns related to air pollution and heavy metal exposure in a region-specific manner.

2. Materials and Methods

2.1. Study Area

This study was conducted in three cities in different districts of West Bengal, India (Figure 1). These three cities were Durgapur (industrial complex), Kolkata (urban area), and Bolpur (semi-urban area). A total of 21 sampling sites were selected and equally distributed. Before choosing the sampling site, a prior inspection was conducted to avoid bias. After the survey, sampling sites were selected, which cover the industrial zone, traffic zone, bus stand, residential area, and sensitive zone.
Durgapur (23.5204° N, 87.3119° E) is an industrial city and a tier-II urban agglomeration in the Paschim Bardhhaman district in the Indian state of West Bengal, and it is the fourth largest urban agglomeration city after Kolkata, Asansol, and Siliguri. Durgapur is spread over an area of about 154.2 km2, and its population is approximately 780,000. Worldwide, Durgapur is known as a steel city in eastern India, and about 100 plus large and small industries and companies are situated in this area. There were seven sampling sites in Durgapur, i.e., Bankura More, DVC More, Muchi Para, the Durgapur Bus Stand, City Centre, Main-gate, and Benachity.
Kolkata (22.5726° N, 88.3639° E) is a capital city and an economic hub of West Bengal, India. Kolkata is spread over an area of about 206.08 km2. According to the 2011 Indian census, Kolkata is an urban agglomeration coming under the category of Mega City, which comprises approximately 14.1 million people and is the third most densely populated metropolitan area in the country [8]. Due to the dense population and unplanned urbanization, Kolkata suffers a heavy traffic load daily. As a result, the air quality degrades daily and increases health complications. Seven sampling sites were selected in Kolkata, i.e., Sealdah, Ballygunge, Rubi, Salt Lake, Jadavpur, New Alipur, and the Esplanade.
Bolpur (23.6712° N, 87.6919° E) is a city and a municipality in the Birbhum district in West Bengal, India. It is a semi-urban area, and limited industry exists. Bolpur is spread over an area of about 35.94 km2, and its population is approximately 110,000. The people of Bolpur mainly depend on agriculture and handicraft products made for tourists. This area’s primary sources of pollution are wood or biomass burning for cooking and other purposes, agriculture, and tourism. Like Durgapur and Kolkata, Bolpur also had seven sampling sites, i.e., Chitra More, the Bolpur Bus Stand, Siksha-Bhavana, Sriniketan, Amar Kutir, Shyambati, and Goal Para. The main significance of selecting seven sites was to cover the north, south, east, west, and central parts of cities to assess the pollution distribution of this area.

2.2. Data Collection

The respirable suspended particulate matter (RSPM) was collected using a Portable Mini-Vol Tactical Air Sampler (TAS, Air Metrics, Eugene, OR, USA) at an average flow rate of 5 L/min. The sampler was set at nose height (average 5.5 feet above the ground). Whatman glass fiberfilter paper was used to collect particulate matter (RSPM). Before and after sampling, the filter paper was kept in a desiccator (inside had activated silica crystal) for 48 h to remove moisture from the filter paper, and then the filter paper was weighed by a Shimadzu analytical electronic microbalance AUW220D (Shimadzu Corporation, Japan). The instrument was calibrated following the instruction manual before each sampling event to reduce the process of sampling error. All collected sample filter paperswere adequately stored at −20 °C before further analysis. The air sampling duration was 10 h from 8 a.m. to 6 p.m. in both the summer (end of April, May, and June) and winter seasons (end of December, January, and February) from December 2021 to June 2022. The time duration was selected to ensure the population was highly exposed to ambient air pollution. In three cities, 21 sampling sites in total were sampled, and sampling was carried out as per the Indian Central Pollution Control Board (CPCB) guidelines.

2.3. Analysis of Trace Elements

The exposed glass fiber filter paper sample was cut into pieces and then digested in a mixture of perchloric acid (HClO4) and nitric acid (HNO3), 70% and 65% GR grade (Sigma-Aldrich, St. Louis, MO, USA), respectively [25]. The solution was heated to 150 °C using a hot plate following the US EPA Compendium Method IO-3.1, and the acid solution mixture was evaporated to 2–3 mL [26]. The digested colorless solution was diluted to 25 mL using Milli-Q double distilled water and filtered with 0.22 µm syringe filter paper. The matrix was stored in a well-cleaned polypropylene vial and kept at −20 °C until the analysis. A total of six heavy metals, viz., Cd, Cr (VI), Mn, Ni, Pb, and As, wereanalyzed using ICP-OES (iCAP PRO, Thermo Fisher Scientific, Waltham, MA, USA). For obtaining metal concentrations, multi-element [Certified Reference Material (CRM) Periodic table mix 1 (33 elements], Product No. 92091) standard solutions obtained from Sigma-Aldrich (St. Louis, MO, USA) were used. The limit of detection (LOD) values for As, Cd, total Cr, Mn, Ni, and Pb were 1.22, 0.014, 0.16, 0.02, 0.06, and 0.4 ng/m3, and the limit of quantification (LOQ) values were 2.10, 0.10, 1.0, 0.42, 1.27, and 3.20 ng/m3, respectively.

2.4. Health Risk Assessment

The inhalation pathway was used to determine the non-carcinogenic and carcinogenic health risk assessments [27,28] for adults from exposure to atmospheric RSPM-bound heavy metals (Cd, Cr (VI), Mn, Ni, Pb, and As). For calculations of the exposure concentration (EC), the hazard quotient (HQ), hazard Index (HI), carcinogenic risk (CR),lifetime cancer risk (LCR), or incremental lifetime cancer risk (ILCR) of heavy metals pollutant was used following supplemental guidance for inhalation risk assessment [29,30,31]. The following four equations (Equations (1)–(4)) are involved in assessing health risk. The lifetime cancer risk (LCR), which was calculated using the exposer concentration (EC) and inhalation unit risk (IUR) of RSPM-bound heavy metals, was used to assess the possibility of developing cancer as a result of inhaling air-borne particulate matter.
The Exposure Concentration (EC, µg/m3) was calculated using Equation (1).
E C = C P × E T × E F × E D A T
where CP (µg/m3) is the concentration of pollutants (heavy metals) in air, ET (8 h/day) is the exposure time, EF (350 days/year) is the exposure frequency, ED (24 years for adults) is the exposure duration, and AT (70 years × 365 days/years × 24 h) is the average time [29,30,31].
The ratio of the non-carcinogenic risk associated with potential exposure and inhalation reference concentration (RfC) to airborne heavy metal is known as the hazard quotient (HQ), Equation (2), and the values (HQ > 1 or 1) revealed that the effectiveness of these substances [30]. An HQ ≤ 1 indicates no effect, whereas HQ > 1 indicates a greater chance of non-carcinogenic effects. The RfC (mg/m3) values of Cd, Cr (VI), Mn, Ni, and As, respectively, are tabulated in Table 1 [30,32].
H Q = E C R f C
The Hazard Index is the sum of all the Hazard Quotients (HQ) used to determine the health risks related to different pollutants (heavy metals) exposure, where HQ is used to represent a specific pollutant (Equation (3)). The HI value ≤ 1 indicates no non-carcinogenic effects. On the other hand, values HI > 1 suggest a greater likelihood of non-carcinogenic impacts [28].
H I = i = 1 n H Q i
where HQi is the HQ for the ith pollutant.
To calculate the carcinogenic risk (CR),lifetime cancer risk (LCR), or incremental lifetime cancer risk (ILCR),Equation (4). This equation helps to calculate the likelihood of developing cancer over a lifetime of exposure (70 years) to heavy metals through inhalation.
I L C R o r C R = I U R × E C
where IUR (m3/mg) is the inhalation unit risk, HQ, HI, and ILCR or CR are unit less. The standard values of ET, ED, EF, AT, RfC, and IUR are given in Table 1.
The additional lifetime cancer cases and additional lifetime cancer cases per 100,000 person-years were calculated by using AirQ+ version 2.2 (a health risk analyzing software developed by WHO) [34]. The analysis of additional lifetime cancer cases was undertaken by inputting information on population data, concentrations of metals (Ni, Cr, and As), area size, exposer time (70 years), and unit risk (3.8E-04 for Ni, 4.0E-02 for Cr, and 1.5E-03 for As; provided by WHO).

2.5. Statistical Analysis

MS-Excel, SPSS v26, and JASP v0.16.4.0 were used to conduct statistical analysis. JASP was employed for principal component analysis (PCA). Descriptive statistics, i.e., mean, standard deviations (SD), and interquartile range (IQR), were carried out using MS Excel. Analysis of variance (ANOVA) was carried out through SPSS. For better clarity of the study area, an area map was created using Arc-GIS v10.3. In addition, for the estimation of probabilistic carcinogenic and non-carcinogenic risks, the Monte Carlo simulation method (Crystal Ball v11.1.3.0; Oracle, Austin, TX, USA) with a sensitivity analysis (10,000 iterations) was used for this study. Monte Carlo simulations are widely utilized as a probabilistic approach and a useful tool for thoroughly examining the cumulative uncertainty associated with the variables utilized in risk assessment [35,36,37]. This method can minimize the uncertainties of exposure-specific health risks by considering the uncertainty of concentrations and the variability of exposure factors. In this study, we used Monte Carlo simulations to investigate the multiple sides of variance and ambiguity present in the estimation of the human health hazards associated with heavy metals, taking into account both the overall and source-specific components. This study represents a comprehensive Monte Carlo simulation aimed at assessing the concentrations of heavy metals in the environment and their potential health risks to human probabilistic health risks. The investigation encompasses exposure duration (ED), exposure frequency (EF), average time (AT), and cumulative exposure time (ET) to provide a robust framework for evaluating human health risks associated with heavy metal contamination (HMs). Equations (1)–(3) were used for non-carcinogenic health risk assessment, and Equation (4) was utilized for carcinogenic risk estimations. In this study, the HM concentrations were assumed to have log-normal distributions, using mean concentrations and standard deviations of each element. For estimating the probabilistic health risk assessment, concentrations (mean) with standard deviations (SD) of metals, ED, EF, ET, and AT were entered into the assumption cell for non-carcinogenic health risk estimations and sensitivity analysis. Metals concentrations with SD were used for carcinogenic risk estimation. The health risk assessment of the Monte Carlo simulation and sensitivity analysis of risk estimation were performed using the mean and standard deviation of ED (24 ± 6), EF (350 ± 15), ET (8 ± 2), and AT (613,200 ± 67,200), respectively. The metal concentrations with SD are given in Table 2. The study employed advanced computational techniques to estimate the exposure levels and their uncertainty, offering valuable insights into environmental management and public health protection [29,37].

3. Results and Discussion

3.1. Mass Concentrations of Respirable Suspended Particulate Matter (RSPM)

The mean RSPM concentrations in Bolpur, Durgapur, and Kolkata were 320 µg/m3 (IQR range of 147.43 to 453.57 µg/m3), 473 µg/m3 (IQR range of 279.32 to 594.57 µg/m3), and 462 µg/m3 (IQR range of 298 to 605 µg/m3), respectively. The highest mass concentrations were observed in Durgapur, then Kolkata and Bolpur. Durgapur is a heavily industrialized area, making it susceptible to pollution from various sources, including heavy industry, power plants, manufacturing emissions, movements of heavy vehicles, and burning of fossil fuels for multiple operations, causing a significant amount of particulate matter to be discharged into the atmosphere [38]. On the other hand, Kolkata, a densely populated city, is faced with severe traffic congestion (vehicle emissions), ongoing construction projects, and industrial activities, which result in significant pollution sources in this area [8,39,40]. In the case of Bolpur, various factors, including agriculture, soil dust, domestic cooking, and rice mill emissions, may significantly contribute to air pollution [38].

3.2. Concentration of Heavy Metals (HM)

The mean concentrations (ng/m3) and standard deviations with analysis of variance (ANOVA) of various heavy metals, such as Cd, Cr (VI), Mn, Ni, Pb, and As (metalloid), in Bolpur, Durgapur, and Kolkata are tabulated in Table 2. Table 2 revealed that the mass concentrations of metals were significantly varied in different locations, and the higher concentrations of all metals (Cd, Cr (VI), Mn, Ni, Pb, and As) were observed in Durgapur, then Kolkata, and last Bolpur. In Durgapur (an industrial city), the concentrations (ng/m3) of heavy metals were As (26.64 ± 9.75), Cd (5.55 ± 0.69), Cr (1.80 ± 0.62), Mn (575.00 ± 164.04), Nickel (Ni) 401.00 ± 120.31, and Pb (90.00 ± 22.60). In Kolkata (a metropolitan city), the concentrations (ng/m3) were As (9.51 ± 2.60), Cd (4.78 ± 0.97), Cr (0.83 ± 0.36), Mn (195.00 ± 26.35), Ni (384.00 ± 40.76), and Pb (205.00 ± 38.28). And Bolpur (Semi-urban) showed relatively lower concentrations of metals, As (6.10 ± 0.74), Cd (3.75 ± 1.27), Cr (0.60 ± 0.06), Mn (290.00 ± 56.82), Ni (35.06 ± 8.36), and Pb (55.00 ± 7.07). The analysis of variance (ANOVA) indicated statistically significant differences (p< 0.05) among the locations for all metals, highlighting the impact of industrialization, urbanization, and local activities on heavy metal pollution distributions. The highest to lowest concentration-wise heavy metal distributions were Mn > Ni > Pb > As > Cd > Cr in Durgapur, Ni > Pb > Mn > As > Cd > Cr in Kolkata, and Mn > Pb > Ni > As > Cd > Cr in Bolpur. In Durgapur, the highest concentration of Mn, Ni, Pb, and As was due to industrial processing [38]. It has been reported that industrial activities such as smelting furnaces, coal combustion, heavy-loaded vehicle movements, fly ash from coal burning, steel making, and others are the key contributors to heavy metals in the ambient air [31,41]. Mn is usually associated with steel production due to its use as an alloying element (manganese–aluminum and nickel–chromium). During industrial processes like smelting and refining, Mn, Ni, and Cr can be released into the atmosphere [42]. On the other hand, Ni is also emitted from the fabrication of batteries, electroplating, the combustion of coal and diesel oil, and the stainless-steel manufacturing industry [43,44]. Although arsenic is a naturally occurring element, industrial operations, including mining, smelting, and coal combustion, can release significant amounts of As into the ambient environment [45,46]. In the urban (Kolkata) atmosphere, the primary contributors of heavy metals into the atmosphere were vehicle emissions, ongoing construction and demolition activities, and various medium- and small-scale industrial processing. In urban ambient atmospheres, Ni, Pb, and Cd are fingerprint elements of vehicular emissions [42,47]. In metropolitan areas, Ni and Pb sources may be fossil fuel combustion (particularly oil) and vehicle emissions with catalytic converters that can release nickel and Pb into the atmosphere [48,49]. The other sources of Pb include industrial processes (e.g., battery manufacturing, smelting) and lead-based paints in older buildings [50,51]. The Mn in urban air may cause wind erosion and construction activities [52]. Battery manufacturing and waste incineration can release cadmium into the atmosphere [53]. The sources of Cr in the urban atmosphere may be the leather tanning and drying process, and specific sources such as vehicle emissions and construction materials can also release chromium [54]. In the semi-urban (Bolpur) atmosphere, the possible sources of metals are a mix of geogenic seeds, soil, dust resuspension (unpaved roads and construction activity), agricultural practices, domestic heating and cooking, and vehicular emissions [14]. The sources of heavy metals in the ambient atmosphere depend on various factors such as the areas’ geographical locations (geogenic sources), weather conditions of that area (especially wind direction, wind speed, and temperature), and area types (rural, semi-urban, urban, and industrial). The possible sources of metal sin the atmosphere are industrial emissions, vehicle emissions, power generation, waste incineration, mining and smelting, construction and demolition, agricultural activities, natural sources, biomass burning, atmospheric deposition, and resuspension [14,31,38,55].

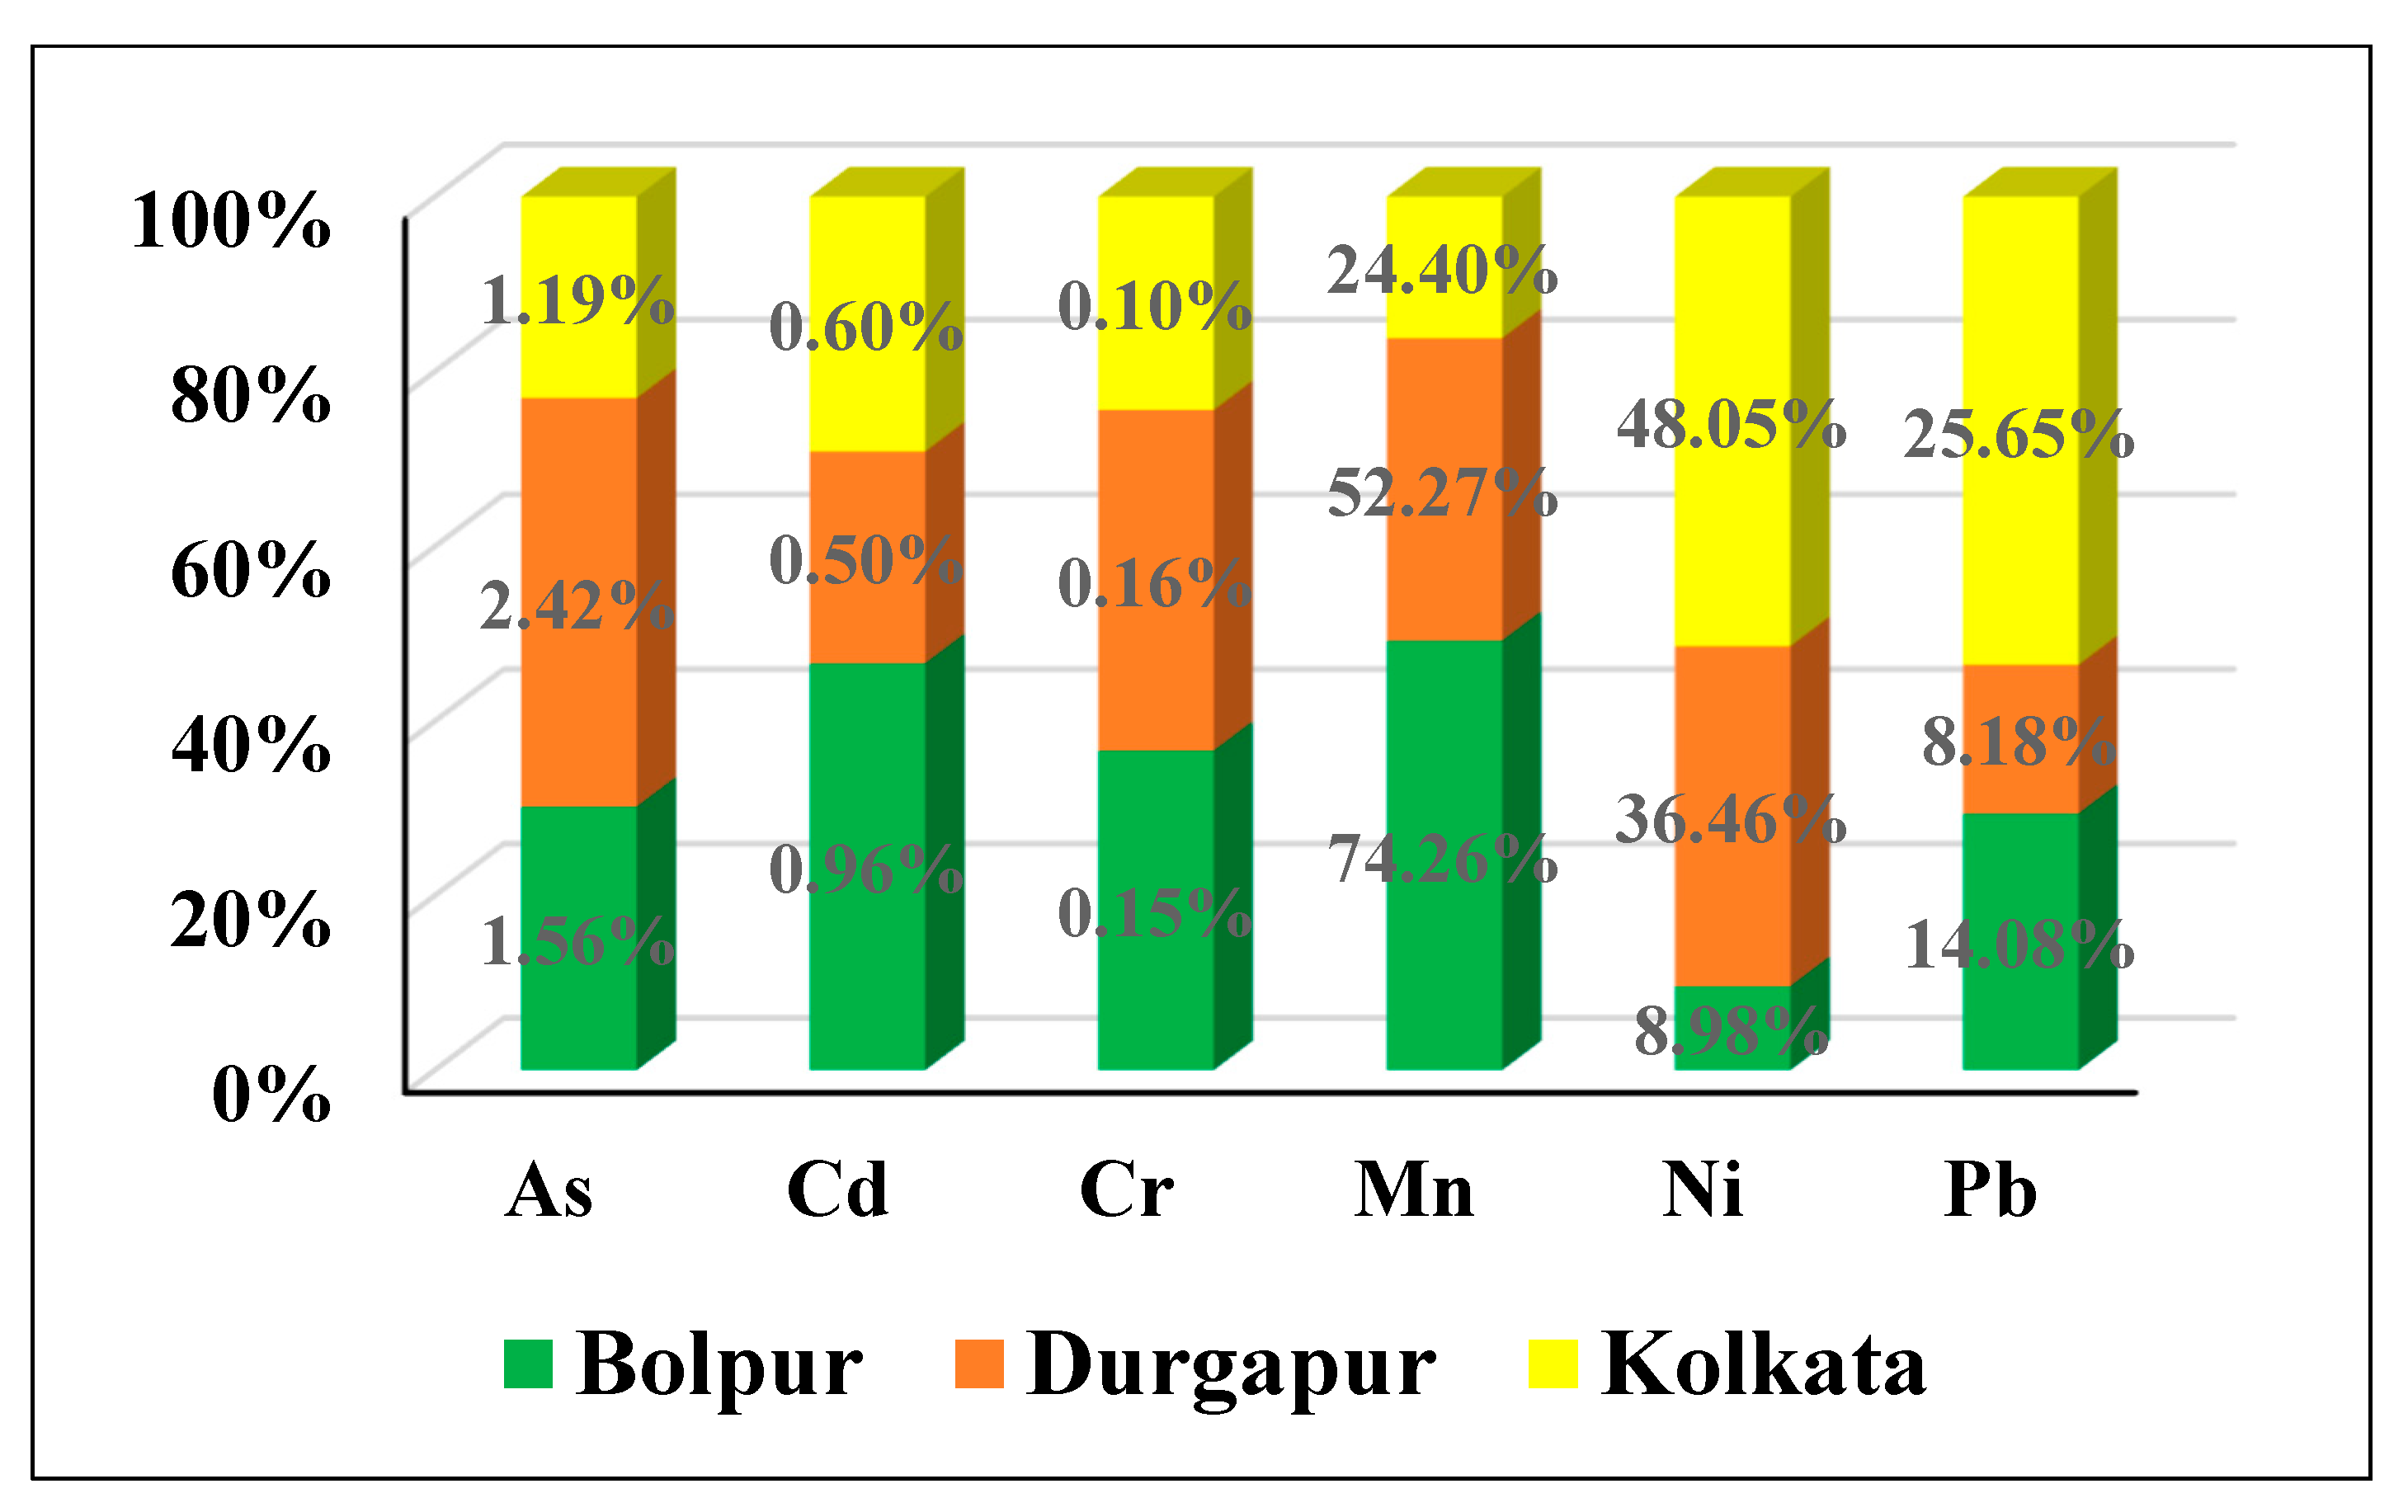
3.2.1. Relative Distribution of HM

The metal composition percentage-wise varied across Bolpur, Durgapur, and Kolkata (Figure 2). In Bolpur, the predominant metal was Mn (74.26%) at a high percentage, followed by Pb at 14.08%, nickel (Ni) at 8.98%, and other metals at lower concentrations. Durgapur showed a different composition, with significant proportions of Mn (52.27%), Ni (36.46%), and lead (8.18%) notably higher. In contrast, Kolkata’s metal distribution consisted of relatively lower manganese (24.40%) and higher Ni (48.05%) and Pb (25.65%). Cadmium (Cd), chromium (Cr), and arsenic (As) were present in smaller proportions across all three locations. These differences show the unique metal profiles in each region, which may be related to regional, industrial activity, geological, and urban sources [14,31,38].

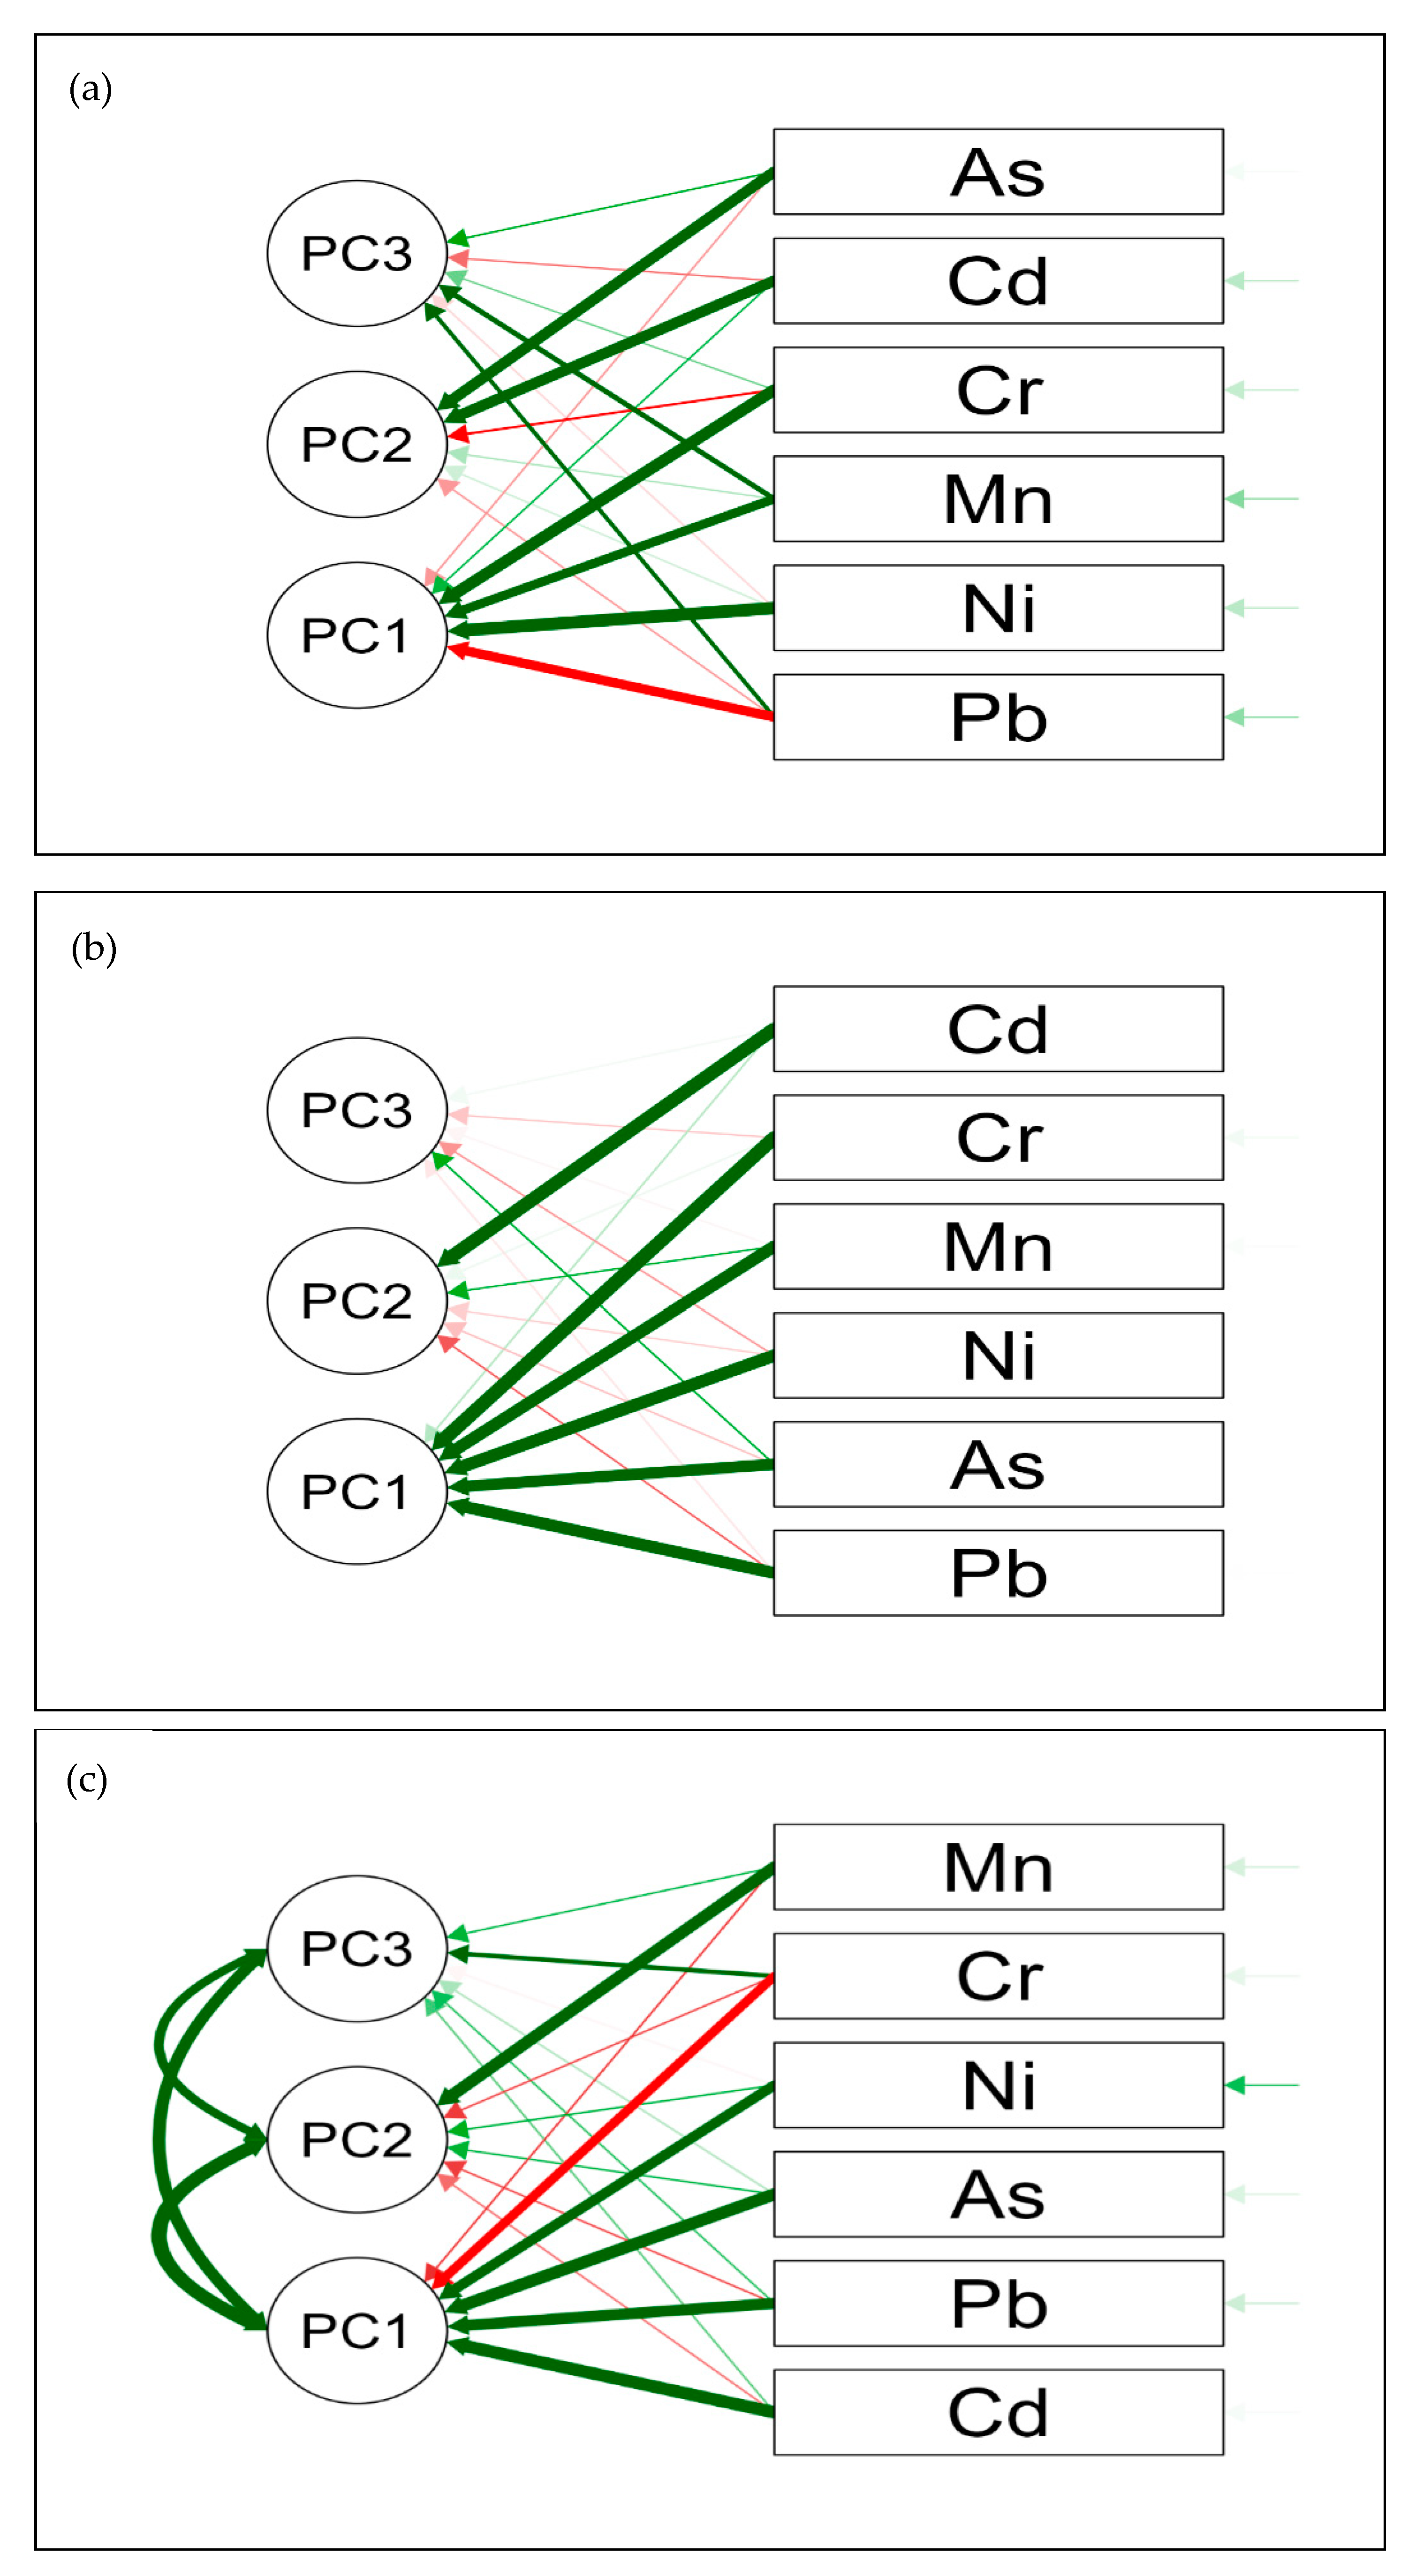
3.2.2. Source Apportionment Study of Metals

The principal component analysis (PCA) results of semi-urban areas showed distinct patterns of element co-variation in the atmosphere (Figure 3a, Table S1). PC1 predominantly reflected the variability of Nickel (Ni), Chromium (Cr), and Manganese (Mn), indicating a potential common natural source, such as wind erosion, soil dust, and road resuspension, for these elements [38]. PC2 showed cadmium (Cd) and arsenic (As), for which agricultural practices may be possible sources. Using fertilizers, pesticides, and herbicides containing elements like Pb, Cd, and As can contribute to their presence in the air source. Lastly, PC3 was associated with Lead (Pb) and a small proportion of Manganese (Mn), indicating the possible sources may be combustion processes, such as vehicle emissions, biomass burning, and small industrial operations (rice mill). The unique patterns identified through PCA revealed the complexity of element sources in this area.
Principal Component Analysis (PCA) in the industrial (Durgapur) area revealed that PC1 exhibited high loadings of Chromium (Cr), Nickel (Ni), Lead (Pb), Arsenic (As), and Manganese (Mn) ranging from 0.935 to 0.995 (Figure 3b, Table S2), indicating a strong correlation among these elements [38]. PC1 accounted for a significant proportion (77.3%) of the total variance, suggesting that dominant industrial sources influenced their presence. On the other hand, PC2 and PC3, with eigenvalues of 1.182 and 0.149, contributed 19.7% and 2.5% of the variance, respectively. The negligible loadings on PC2 and PC3 suggest a minor role of additional sources compared to the primary source (PC1). The presence of elements such as chromium (Cr), nickel (Ni), lead (Pb), arsenic (As), and manganese (Mn) in the atmosphere was caused by emissions from such industries as metal plating, metallurgy, the manufacture of stainless steel and alloys, the burning of coal, smelting, metal refining, steelmaking, metal processing, and chemical manufacturing [14,30,38]. The presence of Cd on PC2, on the other hand, indicates contributions from the mining and metal plating sectors and the battery production industry.
The PCA analysis of the urban region (Kolkata) observed different co-variational patterns for the elements cadmium (Cd), arsenic (As), lead (Pb), nickel (Ni), chromium (Cr), and manganese (Mn). Cd, As, Pb, and Ni showed a substantial connection in the PC1 (Figure 3c, Table S3) (63.8%), indicating that automotive emissions in this urban environment have a significant impact [30,38]. The dense traffic in this region suggests that road wear and exhaust emissions may be the primary sources of these substances. The possibilities for the PC2 (20.2%) involving Mn sources included particle resuspension processes brought on by urban traffic. In addition, PC3 (8.3%) elements Cr, the possibility of sources may be industrial activity in metropolitan settings.

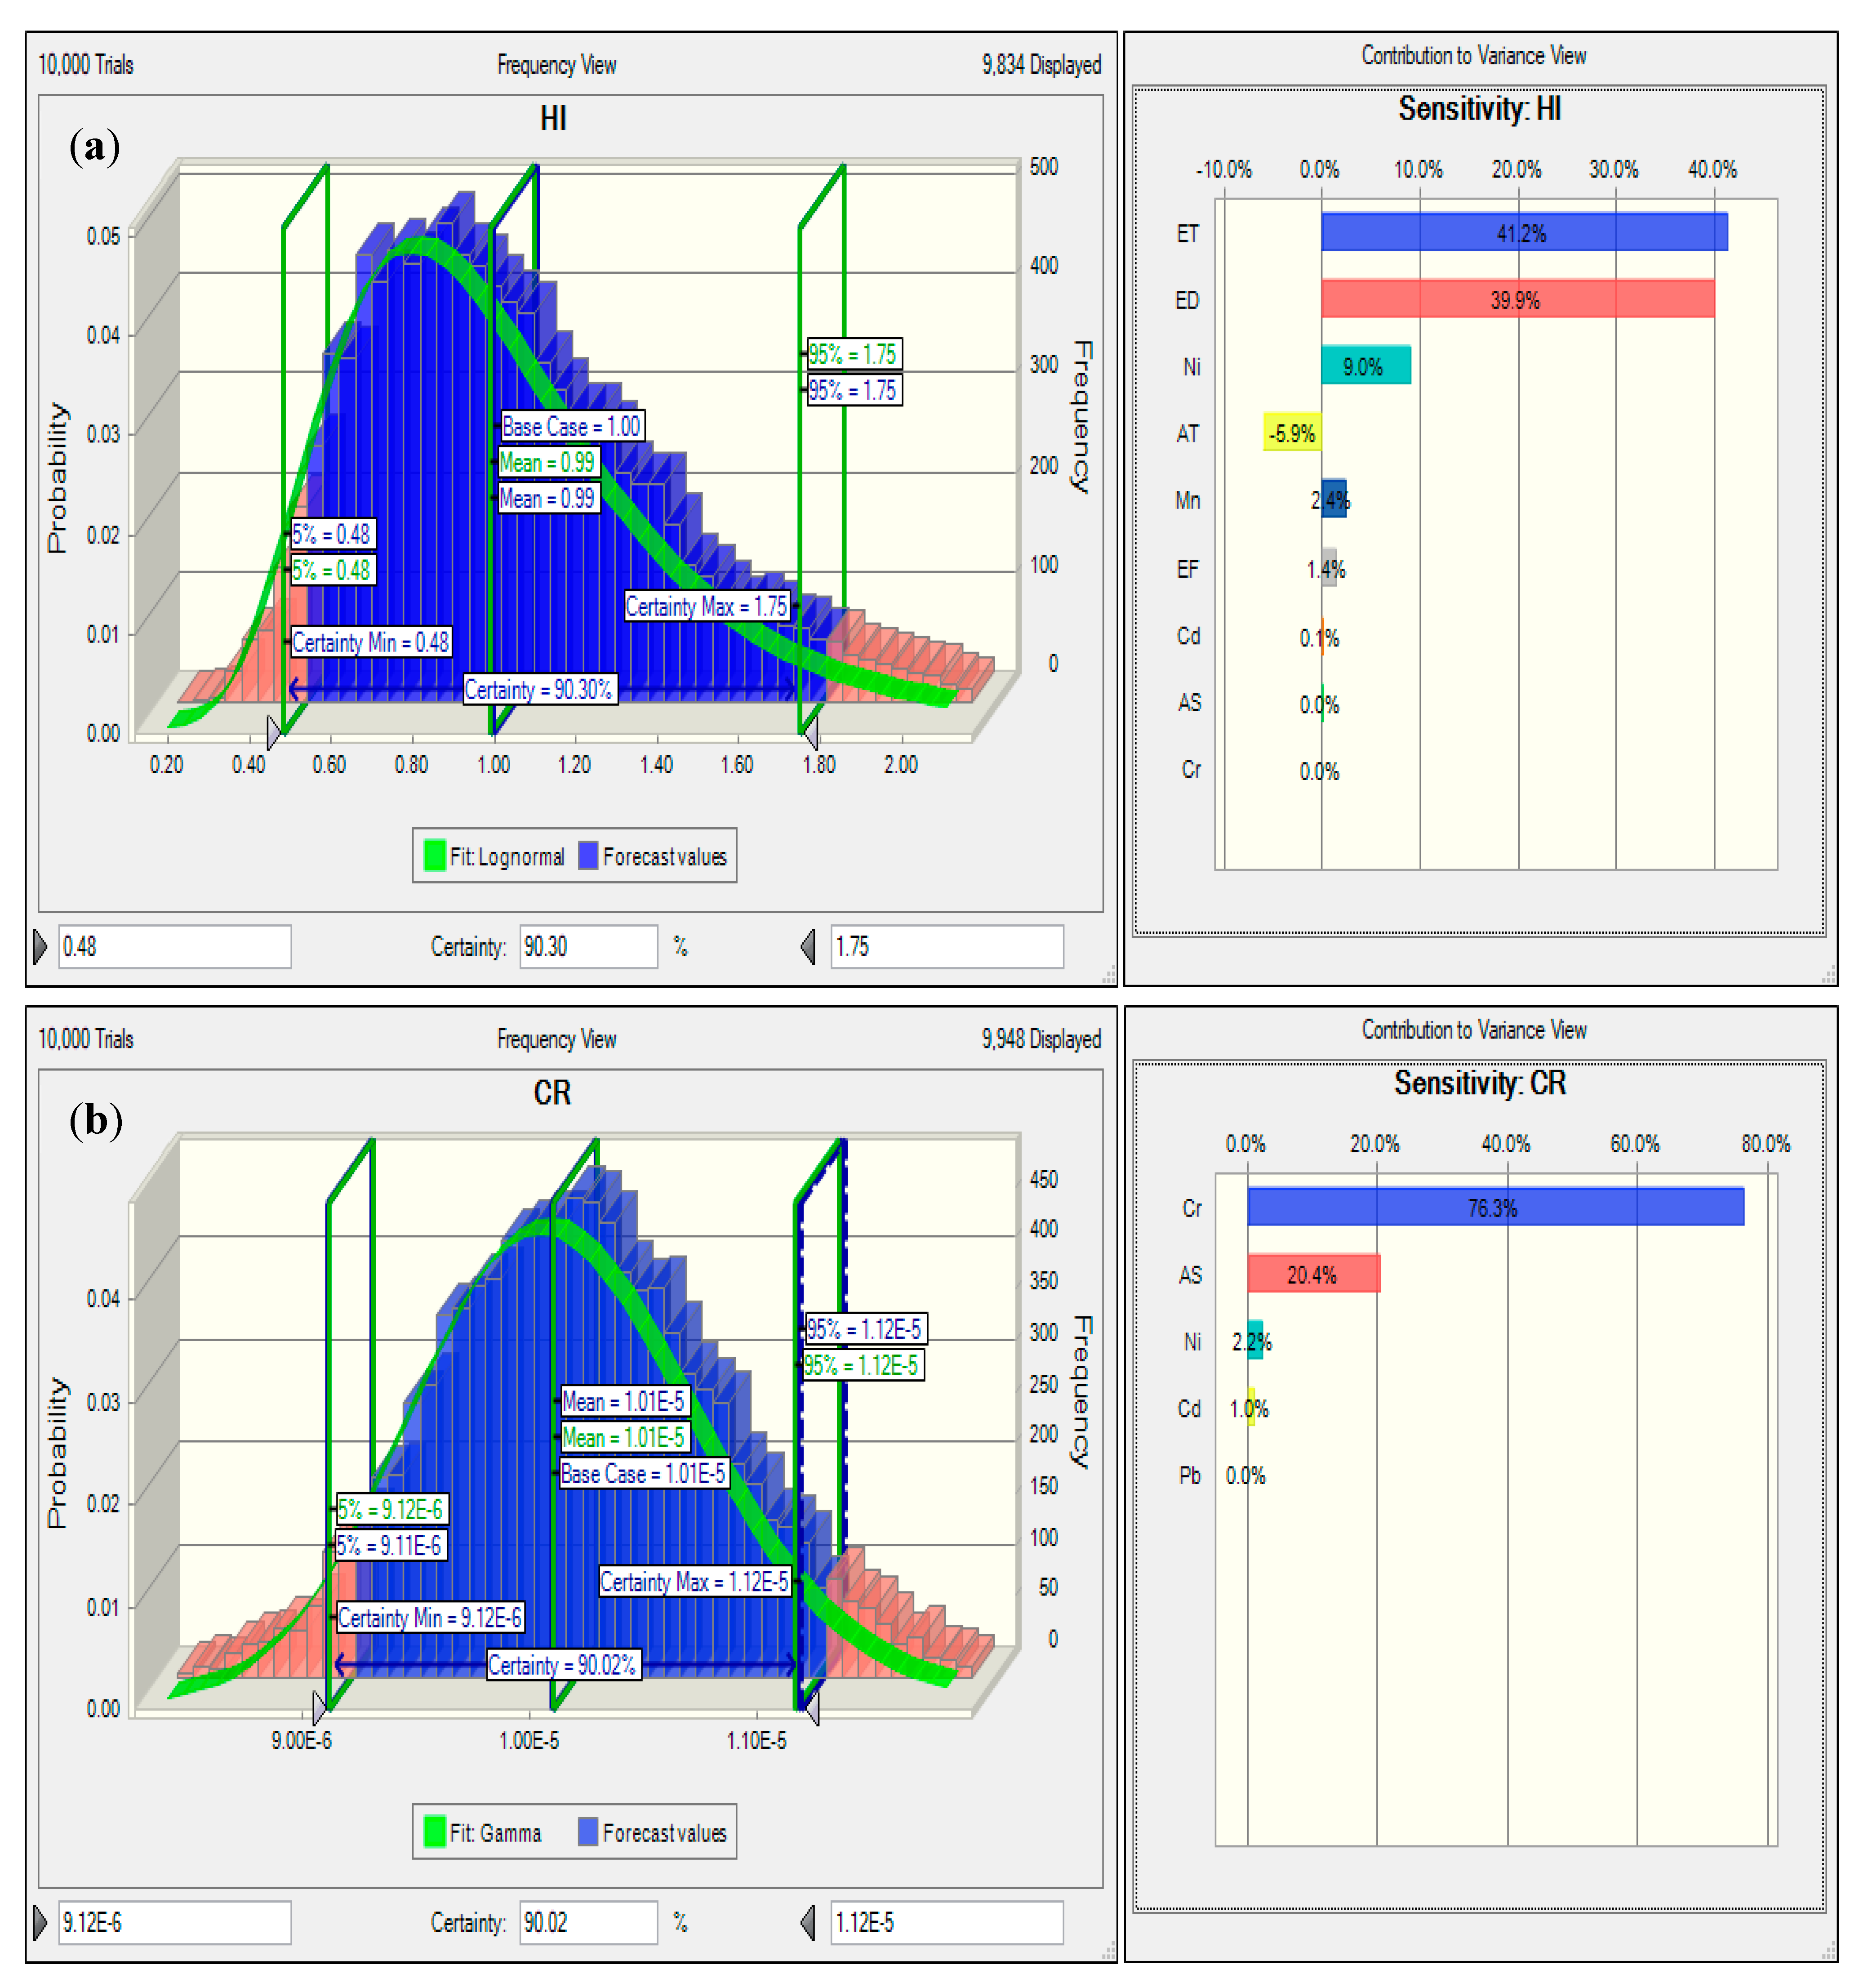
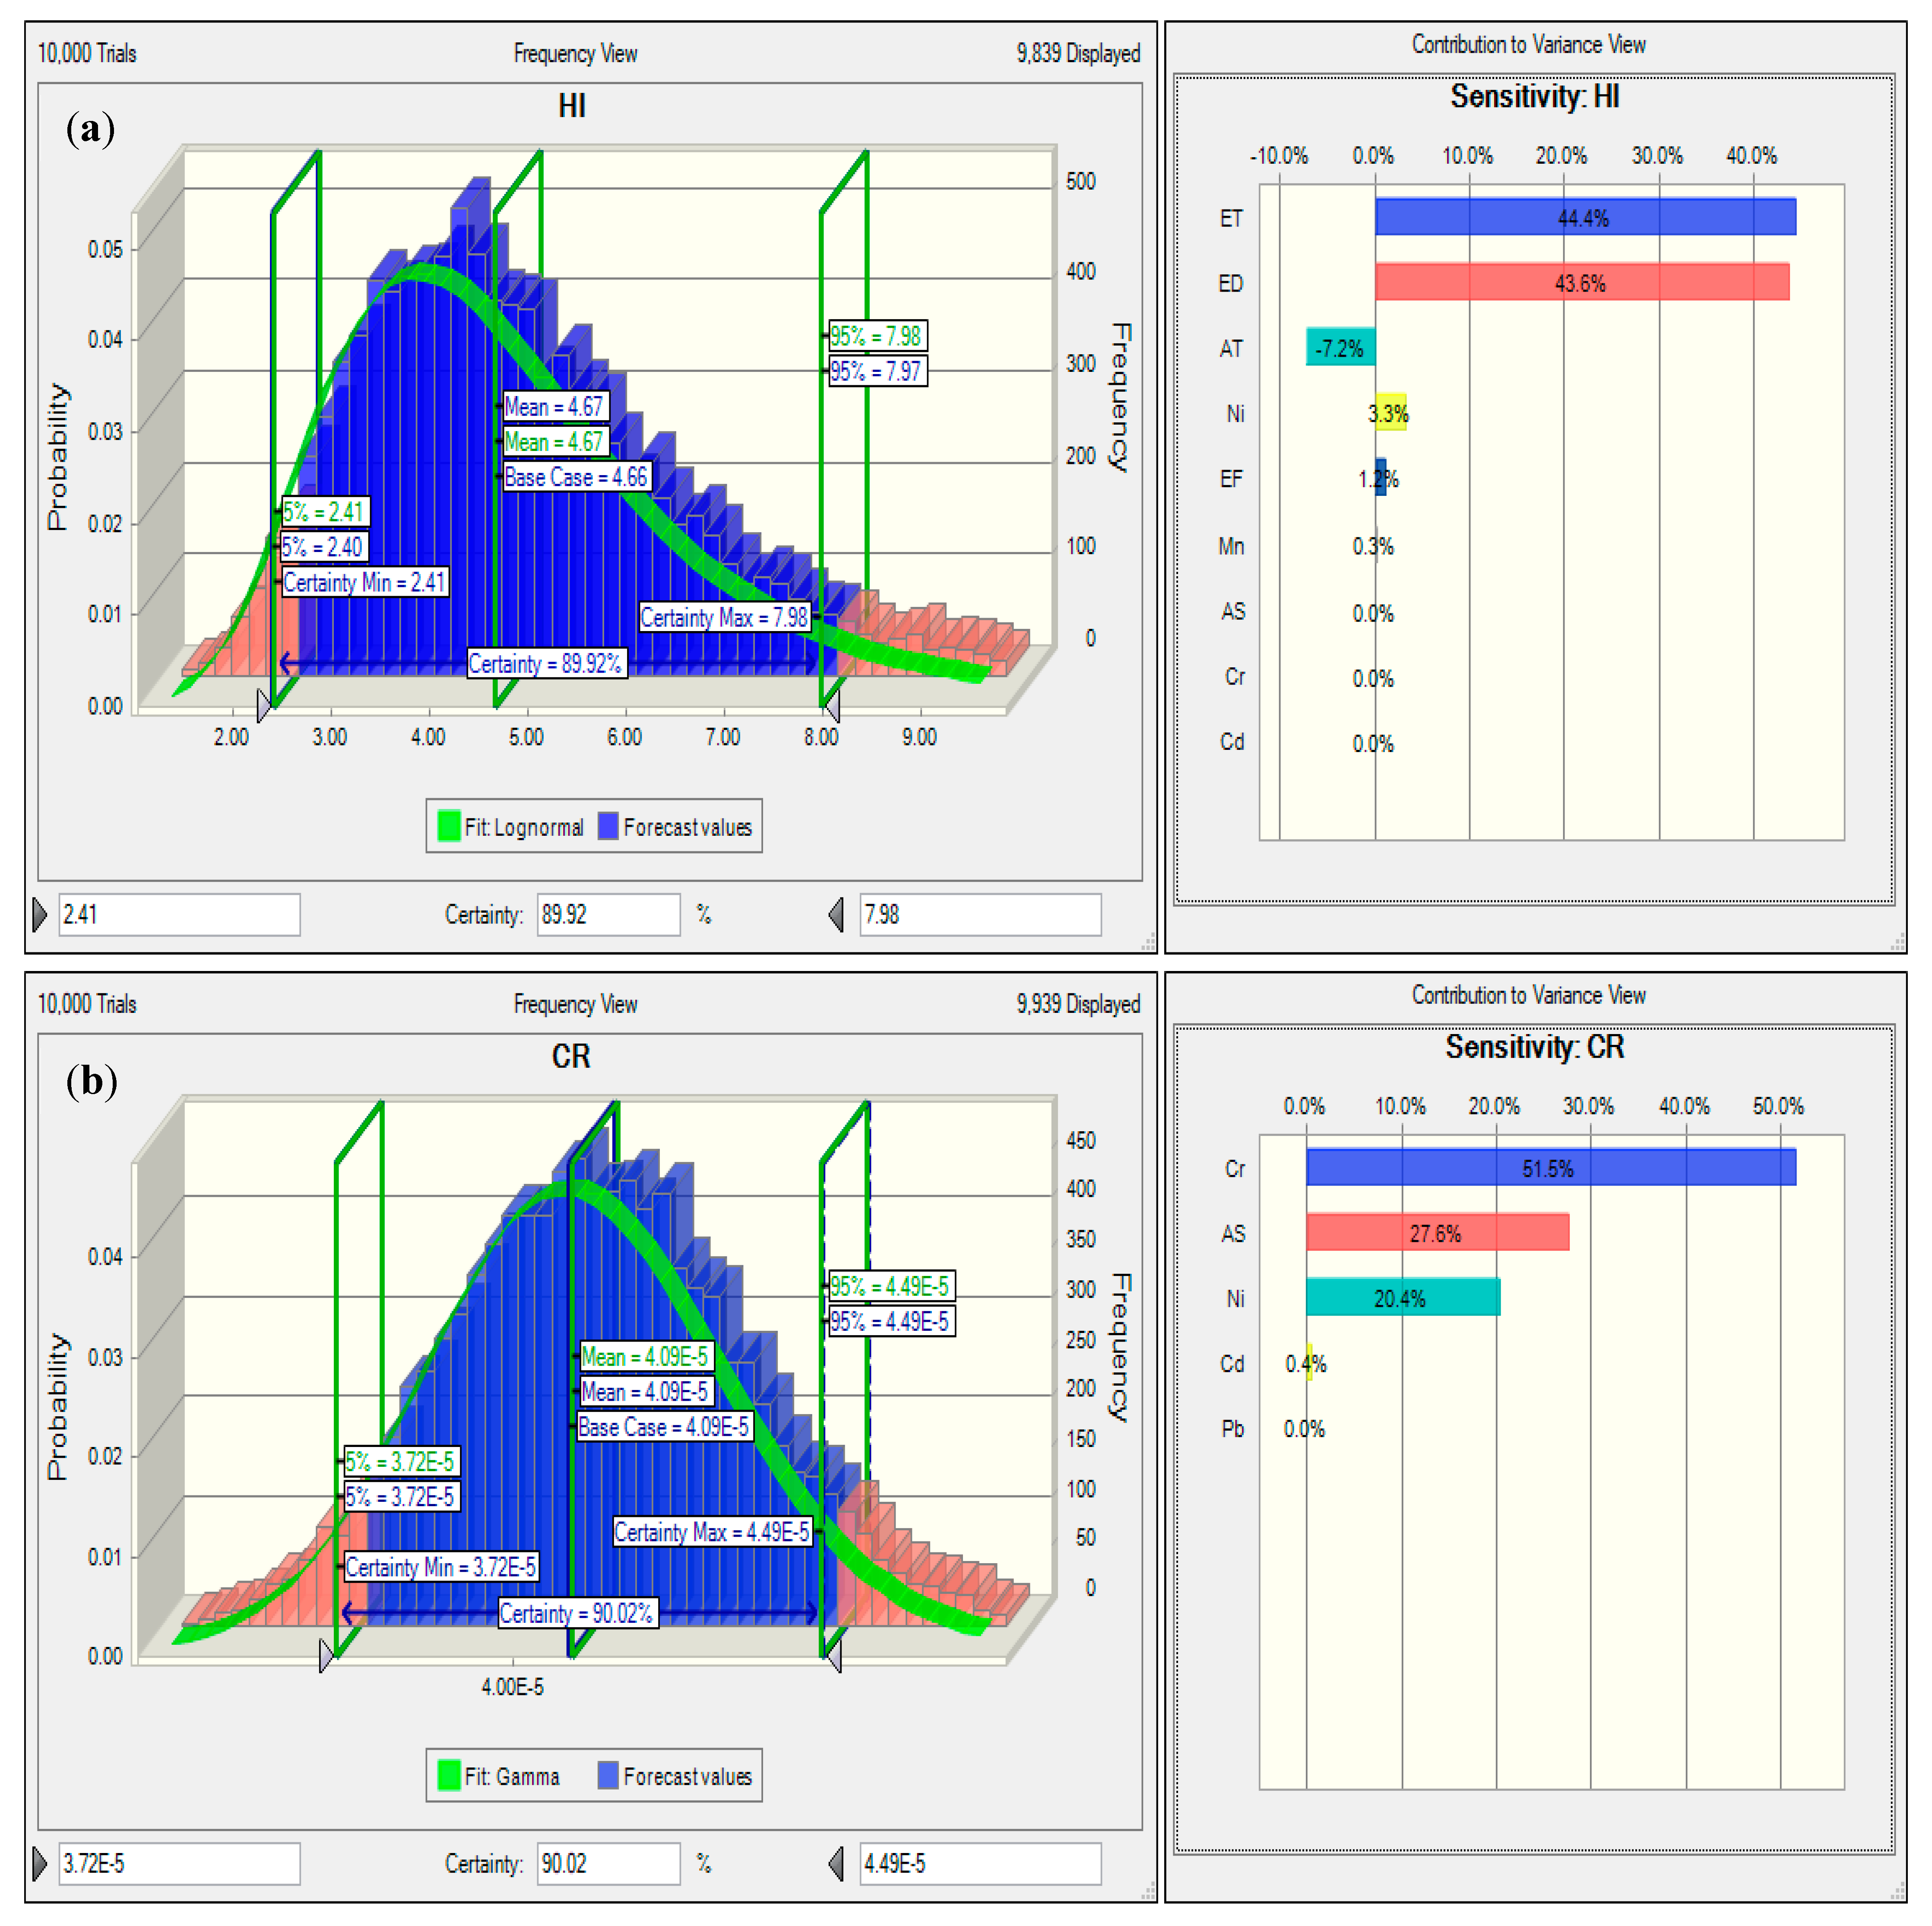
3.2.3. Carcinogenic and Non-Carcinogenic Health Risk Assessment

The carcinogenic and non-carcinogenic health risks of heavy metals in Bolpur, Durgapur, and Kolkata are tabulated in Table 3. In this study, As, Cd, Cr (VI), Mn, and Ni were considered for the estimation of non-carcinogenic risk, and As, Cd, Cr (VI), Ni, and Pb were considered for carcinogenic risk assessment due to the availability of the RfC and IUR values. In Bolpur, the non-carcinogenic risk estimation of HQ and HI showed< 1, indicating no significant non-carcinogenic health risk [31]. In Durgapur and Kolkata, the HI value > 1 was found, which indicates accumulative non-carcinogenic risks to residents [38]. The HI values were higher in the industrial area (4.66), followed by the urban area (3.56) and semi-urban area (0.99). The HQ values of every single toxic metal were lower than the safe level (HQ = 1), except for Mn (1.26) and Ni (3.12) in Durgapur and only Ni (3.01) in Kolata. The highest to lowest non-carcinogenic risks of metals occurred in the following order: Mn > Ni > Cd > As > Cr in Bolpur; Ni > Mn > As > Cd > Cr in Durgapur and Kolkata. Similarly, a study found the non-carcinogenic risks that occurred from the highest to lowest risk assessment of particle-bound heavy metal exposure to humanswas Mn > As > Ni > Cd > Cr (VI) > Se [30]. The sum of carcinogenic risk of semi-urban (CRT, 1.01E-05 in Bolpur), urban (CRT, 4.08E-05 in Kolkata), and industrial (CRT, 2.35E-05 in Durgapur) areas exceeded the USEPA limit (1.00E-06). As (2.87E-06) and Cr (5.48E-06) were slightly higher than the USEPA guidelines in Bolpur, As (1.26E-05), Cd (1.09E-06), Cr (1.66E-05); and Ni (1.05E-05) in Durgapur; and As (4.48E-06), Cr (7.59E-06), and Ni (1.01E-05) in Kolkata. Sensitivity analysis and Monte Carlo simulations with 10,000 replications were used to determine the heavy metals’ possible carcinogenic and non-carcinogenic risk in three distinct sites (semi-urban, urban, and industrial sites). The findings of the sensitivity analysis of non-carcinogenic effects in Bolpur revealed that among the heavy metals, Ni (09%) and Cd (2.5%) posed the highest impacts. The predicted upper and lower percentiles of HI in Bolpur were 1.75 and 0.48, respectively, with the upper percentile (95th) of the findings indicating that the HI limits were violated (Figure 4a). The sensitivity chart of carcinogenic risk revealed that Cr (76.30%) and As (20.41%) significantly influence developing carcinogenic health hazards. The 5th and 95th percentiles of heavy metals show probable cancer risks of 9.12E-06 and 1.12E-05, respectively (Figure 4b). In Durgapur and Kolkata, the findings showed the non-carcinogenic and carcinogenic risk tothe residents. Durgapur and Kolkata’s HI range (5th and 95th percentile) were 2.41 to 7.98 and 1.82 to 6.18 (Figure 5a and Figure 6a). The results of a sensitivity analysis of metals in Durgapur revealed that Ni (3.3%) and Mn (0.3%) were among the heavy metals that show the highest non-cancer risk, whereas Cr (51.50%), As (27.60%), and Ni (20.40%) were the most significant carcinogenic risk in the industrial area (Figure 5b). The range of carcinogenic risks (5th and 95th percentile) in Durgapur was (3.72E-05 to 4.49E-05). Similarly, in Kolkata, Ni (56.40%), Cr (31.50%), and As (11.40%) were the highest influential heavy metals that probably developed carcinogenic effects. In Kolkata, the certainty (5th and 95th percentile) range of developing cancer was 2.13E-05 to 2.57E-05 (Figure 6b). The likelihood of developing cancer was higher in the industrial (Durgapur), followed by the urban (Kolkata) and semi-urban (Bolpur) areas.
Heavy metals can increase the chance of developing cancer when exposed over a long period. Table 4 represents the additional lifetime cancer cases of metal Ni, Cr (VI), and As, and additional lifetime cancer cases per 100,000 person-years in industrial (Durgapur), urban (Kolkata), and semi-urban (Bolpur) regions. The results showed regional variances in cancer cases, with Kolkata having the highest additional cancer cases (904.00 for Ni, 205.84 for Cr, and 88.44 for As), followed by Durgapur (118.86 for Ni, 56.16 for Cr, and 31.17 for As), and Bolpur (1.47 for Ni, 2.64 for Cr, and 1.01 for As), respectively, for all three metals. The additional cancer risks of an area depend on population load and ambient atmospheric concentration of those elements. The standard values, calculated as instances per 100,000 person-years, highlight the importance of nickel exposure in Durgapur. The additional lifetime cancer cases per 100,000 person-years revealed that Durgapur was higher than Kolkata and Bolpur.

4. Conclusions

In this comprehensive study using three distinct areas, such as industrial (Durgapur), urban (Kolkata), and semi-urban (Bolpur) in West Bengal, India, an in-depth analysis of heavy metal contamination and related health risks was undertaken. The study revealed significant spatial variations of heavy metal concentrations across industrial, urban, and semi-urban areas. The highest concentrations of heavy metals were found in Durgapur, a site with extensive industrial activity, followed by Kolkata, a complex urban environment, and Bolpur, a semi-urban area with relatively moderate pollution levels. The probable emission sources were provided by identifying various patterns of metal co-variation using PCA. In Durgapur, industrial activities were the dominant sources of heavy metal emission into the ambient air, but in Kolkata, traffic-related emissions took center stage, whereas Bolpur displayed a mix of local activities, agricultural practices, and natural sources. The evaluation of health risks that are both carcinogenic and non-carcinogenic showed the possible negative consequences of heavy metal exposure to human health. Industrial and urban areas showed higher hazard indices and hazard quotients, signifying the development of non-carcinogenic hazards. In addition, carcinogenic risks exceeded the USEPA limits in each of the three regions, with Kolkata having the most significant increase in additional lifetime cancer cases. The findings highlight the needfor mitigation method implementation to address heavy metal pollution and its health hazards. Strict regulation measures are needed to reduce anthropogenic emissions, such as industrial emissions, vehicle exhaust, and others, to protect the public’s health. Implementing cleaner industrial technology, emissions restrictions norms, and sustainable urban design to reduce pollution are required. The findings serve as a basis for evidence-based policy development, urban planning, and public health initiatives to reduce the negative impacts of heavy metal exposure and encourage a population with a better living environment.

Supplementary Materials

The following supporting information can be downloaded at: https://www.mdpi.com/article/10.3390/environments10110190/s1, Table S1. Component loadings of principal component analysis (PCA) in Bolpur (sampling time December 2021 to June 2022); Table S2. Component loadings of principal component analysis (PCA) in Durgapur (sampling time December 2021 to June 2022); Table S3. Component loadings of principal component analysis (PCA) in Kolkata (sampling time December 2021 to June 2022).

Author Contributions

B.G. contributed by undertaking the study’s fieldwork, writing the original draft, statistical analysis, and helping with the study design.; P.K.P. (Pratap Kumar Padhy) conceptualized the study design, helped in writing the original draft, and reviewed and edited the final MS.; S.N. and M.H. helped in preparing the study design and reviewed the MS.; P.K.P. (Pulak Kumar Patra) helped in reviewing the MS. All authors have read and agreed to the published version of the manuscript.

Funding

This research was funded (grant number: SPARC/2018-2019/P1389/SL dt. 15 March 2019) through the SPARC scheme of the Ministry of Education (formerly MHRD), Government of India, New Delhi.

Data Availability Statement

The datasets are available from the corresponding author upon reasonable request.

Acknowledgments

The authors thank the Ministry of Education (formerly MHRD), Government of India, New Delhi, for providing funds through the Scheme for Promotion of Academic and Research Collaboration (SPARC).

Conflicts of Interest

The authors confirm that they have no known financial or interpersonal conflicts that would have had an apparent impact on the research presented in this study.

References

  1. World Health Organization. Ambient (Outdoor) Air Pollution. Available online: https://www.who.int/news-room/fact-sheets/detail/ambient-(outdoor)-air-quality-and-health (accessed on 2 April 2023).
  2. Abelsohn, A.; Stieb, D.M. Health effects of outdoor air pollution: Approach to counseling patients using the Air Quality Health Index. Can. Fam. Physician Med. De Fam. Can. 2011, 57, e881–e887. [Google Scholar]
  3. Brucker, N.; Moro, A.M.; Charão, M.F.; Durgante, J.; Freitas, F.; Baierle, M.; Garcia, S.C. Biomarkers of occupational exposure to air pollution, inflammation and oxidative damage in taxi drivers. Sci. Total Environ. 2013, 463, 884–893. [Google Scholar] [PubMed]
  4. Maji, K.J.; Dikshit, A.K.; Deshpande, A. Disability-adjusted life years and economic cost assessment of the health effects related to PM 2.5 and PM 10 pollution in Mumbai and Delhi, in India from 1991 to 2015. Environ. Sci. Pollut. Res. 2017, 24, 4709–4730. [Google Scholar]
  5. Pandey, A.; Brauer, M.; Cropper, M.L.; Balakrishnan, K.; Mathur, P.; Dey, S.; Dandona, L. Health and economic impact of air pollution in the states of India: The Global Burden of Disease Study 2019. Lancet Planet. Health 2021, 5, e25–e38. [Google Scholar]
  6. Farid, M.U.; Ullah, A.; Ghafoor, A.; Khan, S.N.; Iqbal, M.; Muhayodin, F.; Nasir, A. Air Pollution and Clean Energy: Latest Trends and Future Perspectives; Intechopen: London, UK, 2023. [Google Scholar]
  7. Perera, F. Pollution from fossil-fuel combustion is the leading environmental threat to global pediatric health and equity: Solutions exist. Int. J. Environ. Res. Public Health 2018, 15, 16. [Google Scholar]
  8. Haque, M.S.; Singh, R.B. Air pollution and human health in Kolkata, India: A case study. Climate 2017, 5, 77. [Google Scholar] [CrossRef]
  9. Pandey, M.; Pandey, A.K.; Mishra, A.; Tripathi, B.D. Speciation of carcinogenic and non-carcinogenic metals in respirable suspended particulate matter (PM10) in Varanasi, India. Urban Clim. 2017, 19, 141–154. [Google Scholar]
  10. Kumar, N.; Kumar, S.; Pandey, S.P. Traffic-Related Air Pollution and Associated Human Health Risk. Macromol. Symp. 2023, 407, 2100486. [Google Scholar] [CrossRef]
  11. Bhutiani, R.; Kulkarni, D.B.; Khanna, D.R.; Tyagi, V.; Ahamad, F. Spatial and seasonal variations in particulate matter and gaseous pollutants around integrated industrial estate (IIE), SIDCUL, Haridwar: A case study. Environ. Dev. Sustain. 2021, 23, 15619–15638. [Google Scholar]
  12. Gogikar, P.; Tyagi, B. Assessment of particulate matter variation during 2011–2015 over a tropical station Agra, India. Atmos. Environ. 2016, 147, 11–21. [Google Scholar]
  13. Chakraborty, B.; Bera, B.; Roy, S.; Adhikary, P.P.; Sengupta, D.; Shit, P.K. Assessment of non-carcinogenic health risk of heavy metal pollution: Evidences from coal mining region of eastern India. Environ. Sci. Pollut. Res. 2021, 28, 47275–47293. [Google Scholar]
  14. Liu, X.; Ouyang, W.; Shu, Y.; Tian, Y.; Feng, Y.; Zhang, T.; Chen, W. Incorporating bioaccessibility into health risk assessment of heavy metals in particulate matter originated from different sources of atmospheric pollution. Environ. Pollut. 2019, 254, 113113. [Google Scholar] [PubMed]
  15. Liu, X.; Zhai, Y.; Zhu, Y.; Liu, Y.; Chen, H.; Li, P.; Zeng, G. Mass concentration and health risk assessment of heavy metals in size-segregated airborne particulate matter in Changsha. Sci. Total Environ. 2015, 517, 215–221. [Google Scholar] [PubMed]
  16. Abdulaziz, M.; Alshehri, A.; Yadav, I.C.; Badri, H. Pollution level and health risk assessment of heavy metals in ambient air and surface dust from Saudi Arabia: A systematic review and meta-analysis. Air Qual. Atmos. Health. 2022, 15, 799–810. [Google Scholar]
  17. Balali-Mood, M.; Naseri, K.; Tahergorabi, Z.; Khazdair, M.R.; Sadeghi, M. Toxic mechanisms of five heavy metals: Mercury, lead, chromium, cadmium, and arsenic. Front. Pharmaco. 2021, 227, 643972. [Google Scholar]
  18. Engwa, G.A.; Ferdinand, P.U.; Nwalo, F.N.; Unachukwu, M.N. Mechanism and health effects of heavy metal toxicity in humans. In Poisoning in the Modern World-New Tricks for an Old Dog; Intechopen: London, UK, 2019; Volume 10, pp. 70–90. [Google Scholar]
  19. IARC Monographs on the Evaluation of Carcinogenic Risks to Humans; Agents Classified by the IARC Monographs; International Agency for Research on Cancer: Lyon, France, 2017; Volume 1–119.
  20. Guo, L.C.; Lv, Z.; Ma, W.; Xiao, J.; Lin, H.; He, G.; Liu, T. Contribution of heavy metals in PM2.5 to cardiovascular disease mortality risk, a case study in Guangzhou, China. Chemosphere 2022, 297, 134102. [Google Scholar]
  21. Buonanno, G.; Giovinco, G.; Morawska, L.; Stabile, L. Lung cancer risk of airborne particles for Italian population. Environ. Res. 2015, 142, 443–451. [Google Scholar]
  22. Kamila, W.; Wioletta, R.K.; Krzysztof, L.; Karolina, K.; Grzegorz, M. Health risk impacts of exposure to airborne metals and benzo (a) pyrene during episodes of high PM10 concentrations in Poland. Biomed. Environ. Sci. 2018, 31, 23–36. [Google Scholar]
  23. Lamas, G.A.; Ujueta, F.; Navas-Acien, A. Lead and cadmium as cardiovascular risk factors: The burden of proof has been met. J. Am. Heart Assoc. 2021, 10, e018692. [Google Scholar]
  24. Mahmoud, N.; Al-Shahwani, D.; Al-Thani, H.; Isaifan, R.J. Risk Assessment of the Impact of Heavy Metals in Urban Traffic Dust on Human Health. Atmosphere 2023, 14, 1049. [Google Scholar]
  25. Olawoyin, R.; Schweitzer, L.; Zhang, K.; Okareh, O.; Slates, K. Index analysis and human health risk model application for evaluating ambient air-heavy metal contamination in Chemical Valley Sarnia. Ecotoxicol. Environ. Safety 2018, 148, 72–81. [Google Scholar]
  26. Riggin, R.M. Compendium of Methods for the Determination of Toxic Organic Compounds in Ambient Air. Available online: https://www.epa.gov/sites/default/files/2015-07/documents/epa-io-3.1.pdf (accessed on 29 May 2023).
  27. United States Environmental Protection Agency. Risk Assessment Guidance for Superfund: Pt. A. Human Health Evaluation Manual. Available online: https://www.epa.gov/sites/default/files/2015-09/documents/rags_a.pdf (accessed on 23 May 2023).
  28. Risk Assessment Guidance for Superfund Volume I: Human Health Evaluation Manual (Part F, Supplemental Guidance for Inhalation Risk Assessment); EPA-540-R-070–002; Office of Superfund Remediation and Technology Innovation, US Environmental Protection Agency: Washington, DC, USA, 2009.
  29. Pirsaheb, M.; Sharafi, K.; Hopke, P.K.; Hadei, M.; Shahsavani, A. Carcinogenic risks of particulate matter during Middle Eastern dust events and normal days. Atmos. Pollut. Res. 2020, 11, 1566–1571. [Google Scholar]
  30. Wu, Y.; Lu, B.; Zhu, X.; Wang, A.; Yang, M.; Gu, S.; Chen, L. Seasonal variations, source apportionment, and health risk assessment of heavy metals in PM2. 5 in Ningbo, China. Aerosol Air Qual. Res. 2019, 19, 2083–2092. [Google Scholar] [CrossRef]
  31. Li, H.; Wang, J.; Wang, Q.G.; Qian, X.; Qian, Y.; Yang, M.; Wang, C. Chemical fractionation of arsenic and heavy metals in fine particle matter and its implications for risk assessment: A case study in Nanjing, China. Atmos. Environ. 2015, 103, 339–346. [Google Scholar]
  32. Uzoekwe, S.A.; Izah, S.C.; Aigberua, A.O. Environmental and human health risk of heavy metals in atmospheric particulate matter (PM 10) around gas flaring vicinity in Bayelsa State, Nigeria. Toxicol. Environ. Health Sci. 2021, 13, 323–335. [Google Scholar]
  33. United States Environmental Protection Agency. IRIS Assessments. Available online: https://iris.epa.gov/AtoZ/?list_type=alpha (accessed on 13 September 2023).
  34. World Health Organization. AirQ+: Software Tool for Health Risk Assessment of Air Pollution. Available online: https://www.who.int/europe/tools-and-toolkits/airq---software-tool-for-health-risk-assessment-of-air-pollution (accessed on 2 May 2023).
  35. Qu, C.; Sun, K.; Wang, S.; Huang, L.; Bi, J. Monte carlo simulation-based health risk assessment of heavy metal soil pollution: A case study in the Qixia mining area, China. Hum. Ecol. Risk Assess. Int. J. 2012, 18, 733–750. [Google Scholar] [CrossRef]
  36. Sanaei, F.; Amin, M.M.; Alavijeh, Z.P.; Esfahani, R.A.; Sadeghi, M.; Bandarrig, N.S.; Rezakazemi, M. Health risk assessment of potentially toxic elements intake via food crops consumption: Monte Carlo simulation-based probabilistic and heavy metal pollution index. Environ. Sci. Pollut. Res. 2021, 28, 1479–1490. [Google Scholar]
  37. Acharjee, A.; Ahmed, Z.; Kumar, P.; Alam, R.; Rahman, M.S.; Simal-Gandara, J. Assessment of the ecological risk from heavy metals in the surface sediment of River Surma, Bangladesh: Coupled approach of Monte Carlo simulation and multi-component statistical analysis. Water 2022, 14, 180. [Google Scholar] [CrossRef]
  38. Ghosh, S.; Rabha, R.; Chowdhury, M.; Padhy, P.K. Source and chemical species characterization of PM10 and human health risk assessment of semi-urban, urban and industrial areas of West Bengal, India. Chemosphere 2018, 207, 626–636. [Google Scholar]
  39. Ghosh, B.; De, M.; Rout, T.K.; Padhy, P.K. Study on spatiotemporal distribution and health risk assessment of BTEX in urban ambient air of Kolkata and Howrah, West Bengal, India: Evaluation of carcinogenic, non-carcinogenic and additional leukaemia cases. Atmos. Pollut. Res. 2023, 14, 101878. [Google Scholar]
  40. Ghosh, B.; Nayek, S.; Padhy, P.K. Effects of Nationwide Lockdown due to COVID-19 on Ambient Air Quality in the State of West Bengal, India. J. Sci. Res. 2023, 15, 183–200. [Google Scholar] [CrossRef]
  41. Duan, J.C.; Tan, J.H. Atmospheric heavy metals and Arsenic in China: Situation, sources and control policies. Atmos. Environ. 2013, 74, 93–101. [Google Scholar]
  42. Wu, R.; Yao, F.; Li, X.; Shi, C.; Zang, X.; Shu, X.; Zhang, W. Manganese pollution and its remediation: A review of biological removal and promising combination strategies. Microorganisms 2022, 10, 2411. [Google Scholar] [PubMed]
  43. Genchi, G.; Carocci, A.; Lauria, G.; Sinicropi, M.S.; Catalano, A. Nickel: Human Health and Environmental Toxicology. Int. J. Environ. Res. Public Health 2020, 17, 679. [Google Scholar] [PubMed]
  44. IARC Working Group on the Evaluation of Carcinogenic Risks to Humans. Arsenic, Metals, Fibres and Dusts. Lyon (FR): International Agency for Research on Cancer. (IARC Monographs on the Evaluation of Carcinogenic Risks to Humans, No. 100C.) NICKEL AND NICKEL COMPOUNDS. 2012. Available online: https://www.ncbi.nlm.nih.gov/books/NBK304378/ (accessed on 23 May 2023).
  45. De, A.; Roy, N. Arsenic in Environment-Sources, Implications and Remedies; Intechopen: London, UK, 2023. [Google Scholar]
  46. Chung, J.Y.; Yu, S.D.; Hong, Y.S. Environmental source of arsenic exposure. J. Prev. Med. Public Health 2014, 47, 253. [Google Scholar] [CrossRef]
  47. Mmari, A.G.; Hassan, H.A.; Bencs, L. Daytime concentrations of minor and trace elements in atmospheric aerosols at four sampling sites of Dar es Salaam, Tanzania. Air Qual. Atmos. Health 2020, 13, 739–750. [Google Scholar]
  48. Nayebare, S.R.; Aburizaiza, O.S.; Siddique, A.; Hussain, M.M.; Zeb, J.; Khatib, F.; Khwaja, H.A. Understanding the Sources of Ambient Fine Particulate Matter (PM2. 5) in Jeddah, Saudi Arabia. Atmosphere 2022, 13, 711. [Google Scholar] [CrossRef]
  49. Dey, S.; Mehta, N.S. Automobile pollution control using catalysis. Resour. Environ. Sustain. 2020, 2, 100006. [Google Scholar]
  50. Tuccillo, M.E.; Blue, J.; Koplos, J.; Kelly, J.; Wilkin, R.T. Complexities in attributing lead contamination to specific sources in an industrial area of Philadelphia, PA. Heliyon 2023, 9, e15666. [Google Scholar]
  51. Majumder, A.K.; Al Nayeem, A.; Islam, M.; Akter, M.M.; Carter, W.S. Critical Review of Lead Pollution in Bangladesh. J. Health Pollut. 2021, 11, 210902. [Google Scholar]
  52. World Health Organization. Manganese and Its Compounds: Environmental Aspects. Available online: https://apps.who.int/iris/bitstream/handle/10665/42992/9241530634.pdf;jsessionid=F4CB6A853E48DA54E0433A746017EE19?sequence=1 (accessed on 23 May 2023).
  53. Hutton, M. Sources of cadmium in the environment. Ecotoxicol. Environ. Safety 1983, 7, 9–24. [Google Scholar] [CrossRef] [PubMed]
  54. Junaid, M.; Hashmi, M.Z.; Tang, Y.M.; Malik, R.N.; Pei, D.S. Potential health risk of heavy metals in the leather manufacturing industries in Sialkot, Pakistan. Sci. Rep. 2017, 7, 8848. [Google Scholar] [PubMed]
  55. Rout, T.K.; Padhy, P.K.; Ebhin, R. Human Exposure Risks of Potentially Toxic Elements in the Dust: A Comparison Between Residential and Commercial Sites of a Coal Mining Town. In Emerging Issues in Environmental Science: Concerns and Management; New Delhi Publishers: New Delhi, India, 2017; pp. 91–100. [Google Scholar]
Figure 1. Study areas: semi-urban (Bolpur); urban (Kolkata); and industrial (Durgapur).
Environments 10 00190 g001
Figure 2. Relative distribution of heavy metals (HM) in Bolpur, Durgapur, and Kolkata.
Environments 10 00190 g002
Figure 3. Principle component analysis (PCA) of Bolpur (a), Durgapur (b), and Kolkata (c).
Environments 10 00190 g003
Figure 4. Monte Carlo histogram and sensitivity analysis of the (a) hazard index (HI) and (b) carcinogenic risk of heavy metals in Bolpur.
Environments 10 00190 g004
Figure 5. Monte Carlo histogram and sensitivity analysis of the (a) hazard index (HI) and (b) carcinogenic risk of heavy metals in Durgapur.
Environments 10 00190 g005
Figure 6. Monte Carlo histogram and sensitivity analysis of the (a) hazard index (HI) and (b) carcinogenic risk of heavy metals in Kolata.
Environments 10 00190 g006
Table 1. The standard value of exposure time (ET), exposure frequency (EF), exposure duration (ED), average time (AT), inhalation reference concentration (RfC), and unit risk (IUR) [29,30,31,32,33].
MetalET (h/Day)EF (Days/Year)ED (Years)AT (h)RfC (mg/m3)IUR
(m3/μg)
As835024613,2001.50E-054.30E-03
Cd835024613,2001.00E-051.80E-03
Cr (VI)835024613,2001.00E-048.40E-02
Mn835024613,2005.00E-05NP
Ni835024613,2001.40E-052.40E-04
Pb835024613,200NP1.20E-05
NP = Data not provided.
Table 2. Annual average mean and standard deviations (n = 84) of heavy metals of different sites (Bolpur, Durgapur, and Kolkata).
Heavy MetalBolpur
(Mean ± SD)
Durgapur
(Mean ± SD)
Kolkata
(Mean ± SD)
ANOVA
As (ng/m3)6.10 ± 0.7426.64 ± 9.759.51 ± 2.60p < 0.05
Cd (ng/m3)3.75 ± 1.275.55 ± 0.694.78 ± 0.97p < 0.05
Cr (ng/m3)0.60 ± 0.061.80 ± 0.620.83 ± 0.36p < 0.05
Mn (ng/m3)290.00 ± 56.82575.00 ± 164.04195.00 ± 26.35p < 0.05
Ni (ng/m3)35.06 ± 8.36401.00 ± 120.31384.00 ± 40.76p < 0.05
Pb (ng/m3)55.00 ± 7.0790.00 ±22.60205.00 ± 38.28p < 0.05
SD = Standard deviation.
Table 3. Carcinogenic and non-carcinogenic health risksof heavy metals in Bolpur, Durgapur, and Kolkata.
Study AreaMetalECHQHICRCRT
BolpurAs6.68E-040.04 2.87E-06
Cd4.10E-040.04 7.39E-07
Cr6.52E-050.000.995.48E-061.01E-05
Mn3.18E-020.64
Ni3.84E-030.27 9.21E-07
Pb7.53E-03 9.04E-08
DurgapurAs2.92E-030.19 1.26E-05
Cd6.08E-040.06 1.09E-06
Cr1.97E-040.004.661.66E-054.08E-05
Mn6.30E-021.26
Ni4.39E-023.14 1.05E-05
Pb1.23E-02 1.48E-07
KolkataAs1.04E-030.07 4.48E-06
Cd5.24E-040.05 9.43E-07
Cr9.04E-050.003.567.59E-062.35E-05
Mn2.14E-020.43
Ni4.21E-023.01 1.01E-05
Pb2.81E-02 3.37E-07
USEPA Standard <1<1<1.00E-06<1.00E-06
Table 4. Additional lifetime cancer cases of metal (Ni, Cr (VI), and As) in Bolpur, Durgapur, and Kolkata.
MetalAdditional Lifetime Cancer CasesAdditional Lifetime Cancer Cases per 100,000 Person-Years
BolpurDurgapurKolkataBolpurDurgapurKolkata
Ni1.47118.86904.000.020.220.21
Cr (VI)2.6456.16205.840.030.100.05
As1.0131.1788.440.010.060.02
Disclaimer/Publisher’s Note: The statements, opinions and data contained in all publications are solely those of the individual author(s) and contributor(s) and not of MDPI and/or the editor(s). MDPI and/or the editor(s) disclaim responsibility for any injury to people or property resulting from any ideas, methods, instructions or products referred to in the content.

