


Effects of Landscape Characteristic Perception of Campus on College Students’ Mental Restoration


Abstract
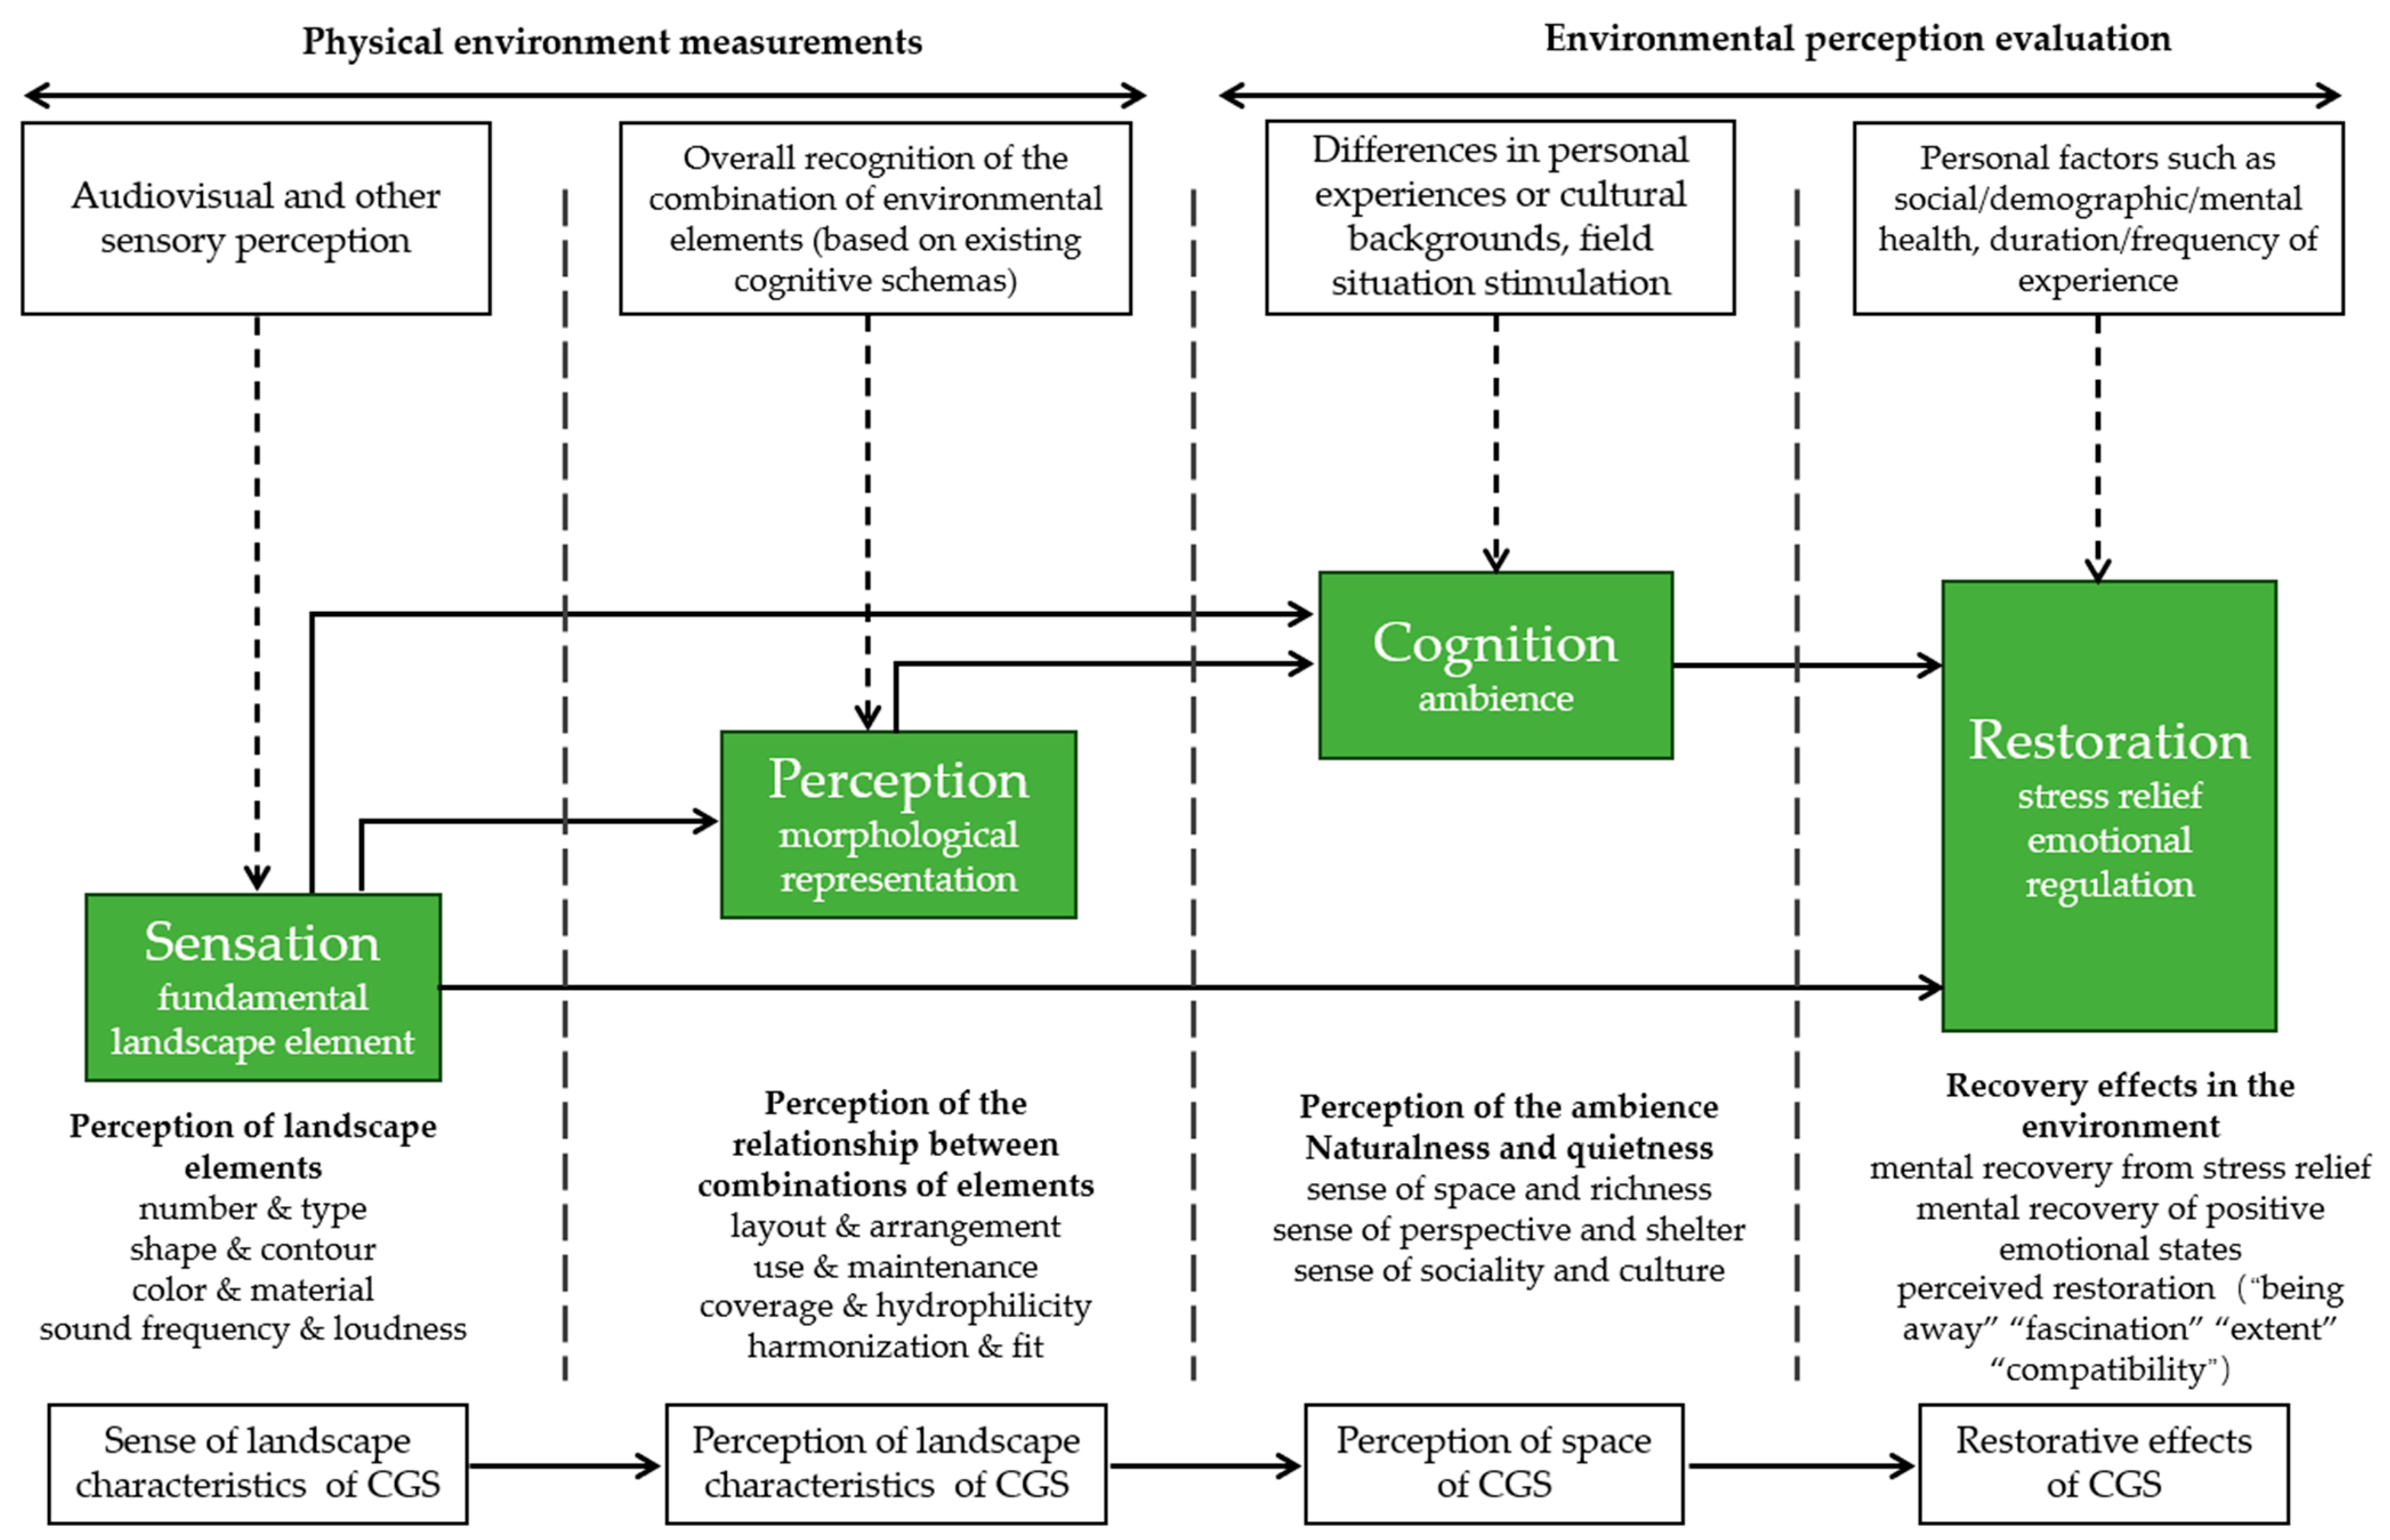
1. Introduction
1.1. Landscape Perception and Landscape Preference
1.2. Role of Perceived Restorativeness in Mental Restoration
1.3. Moderating Role of Campus Physical Landscape Elements
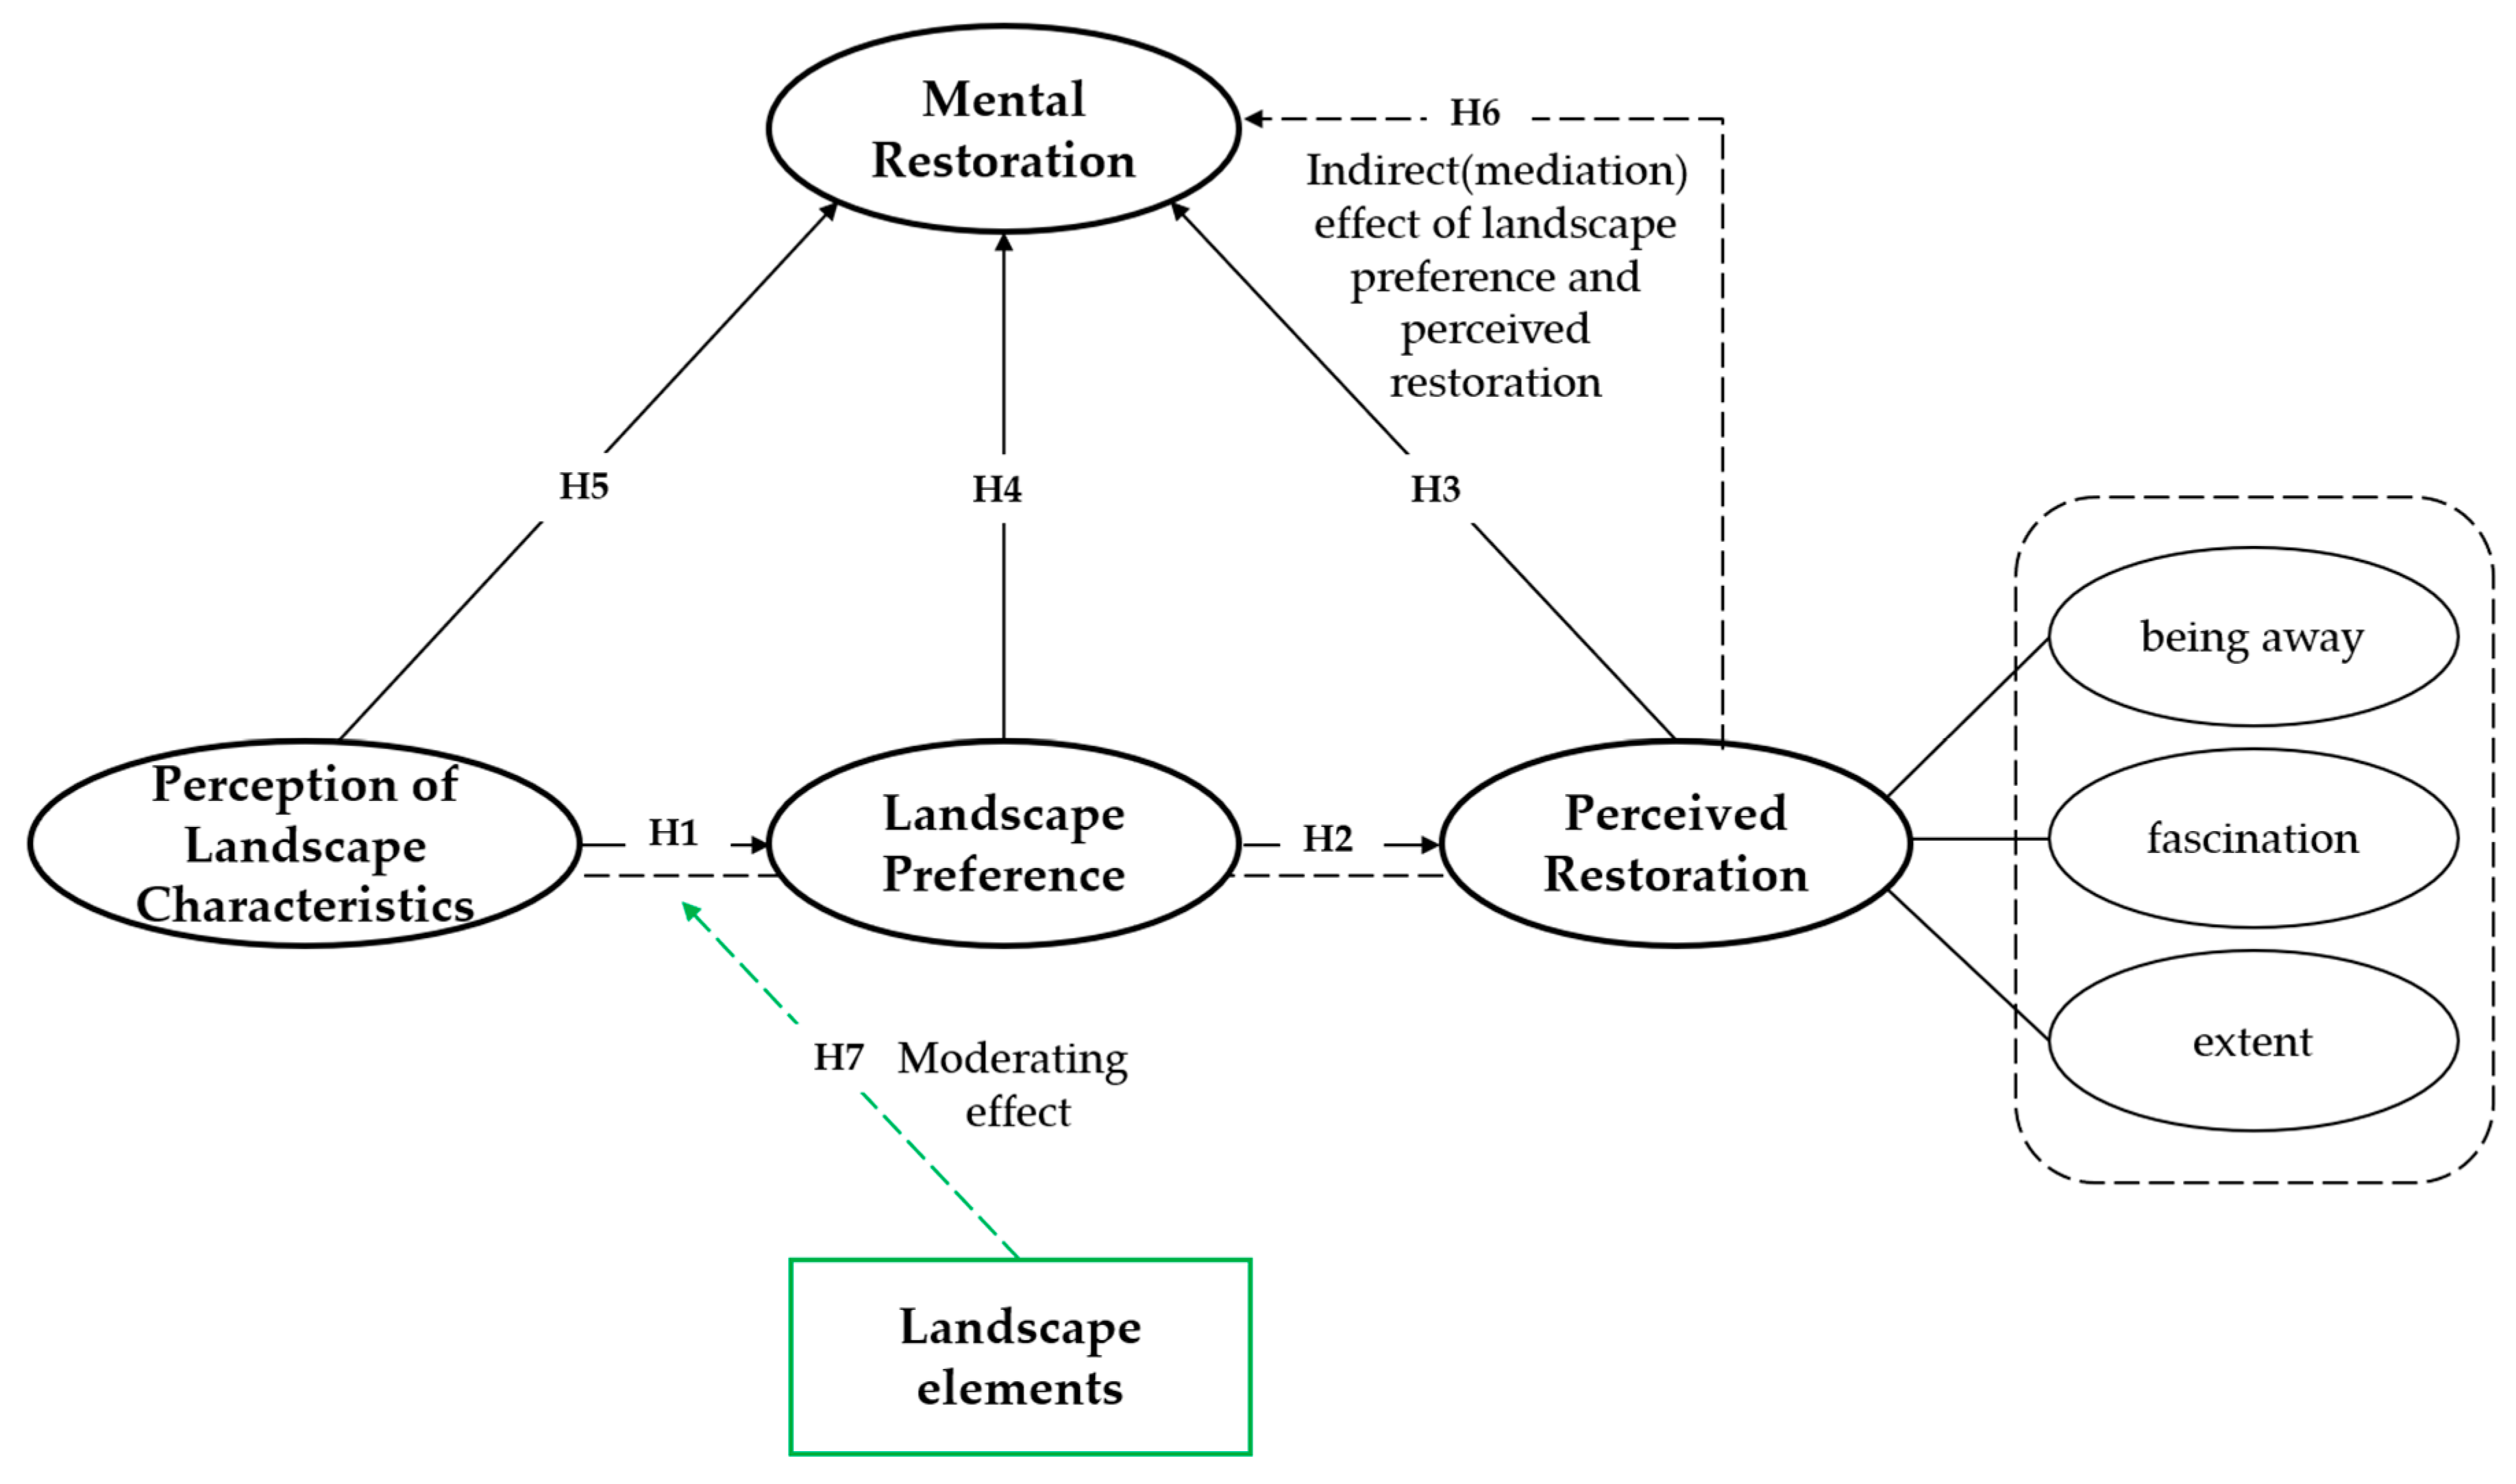
1.4. Aim of the Study
2. Materials and Methods
2.1. Research Design
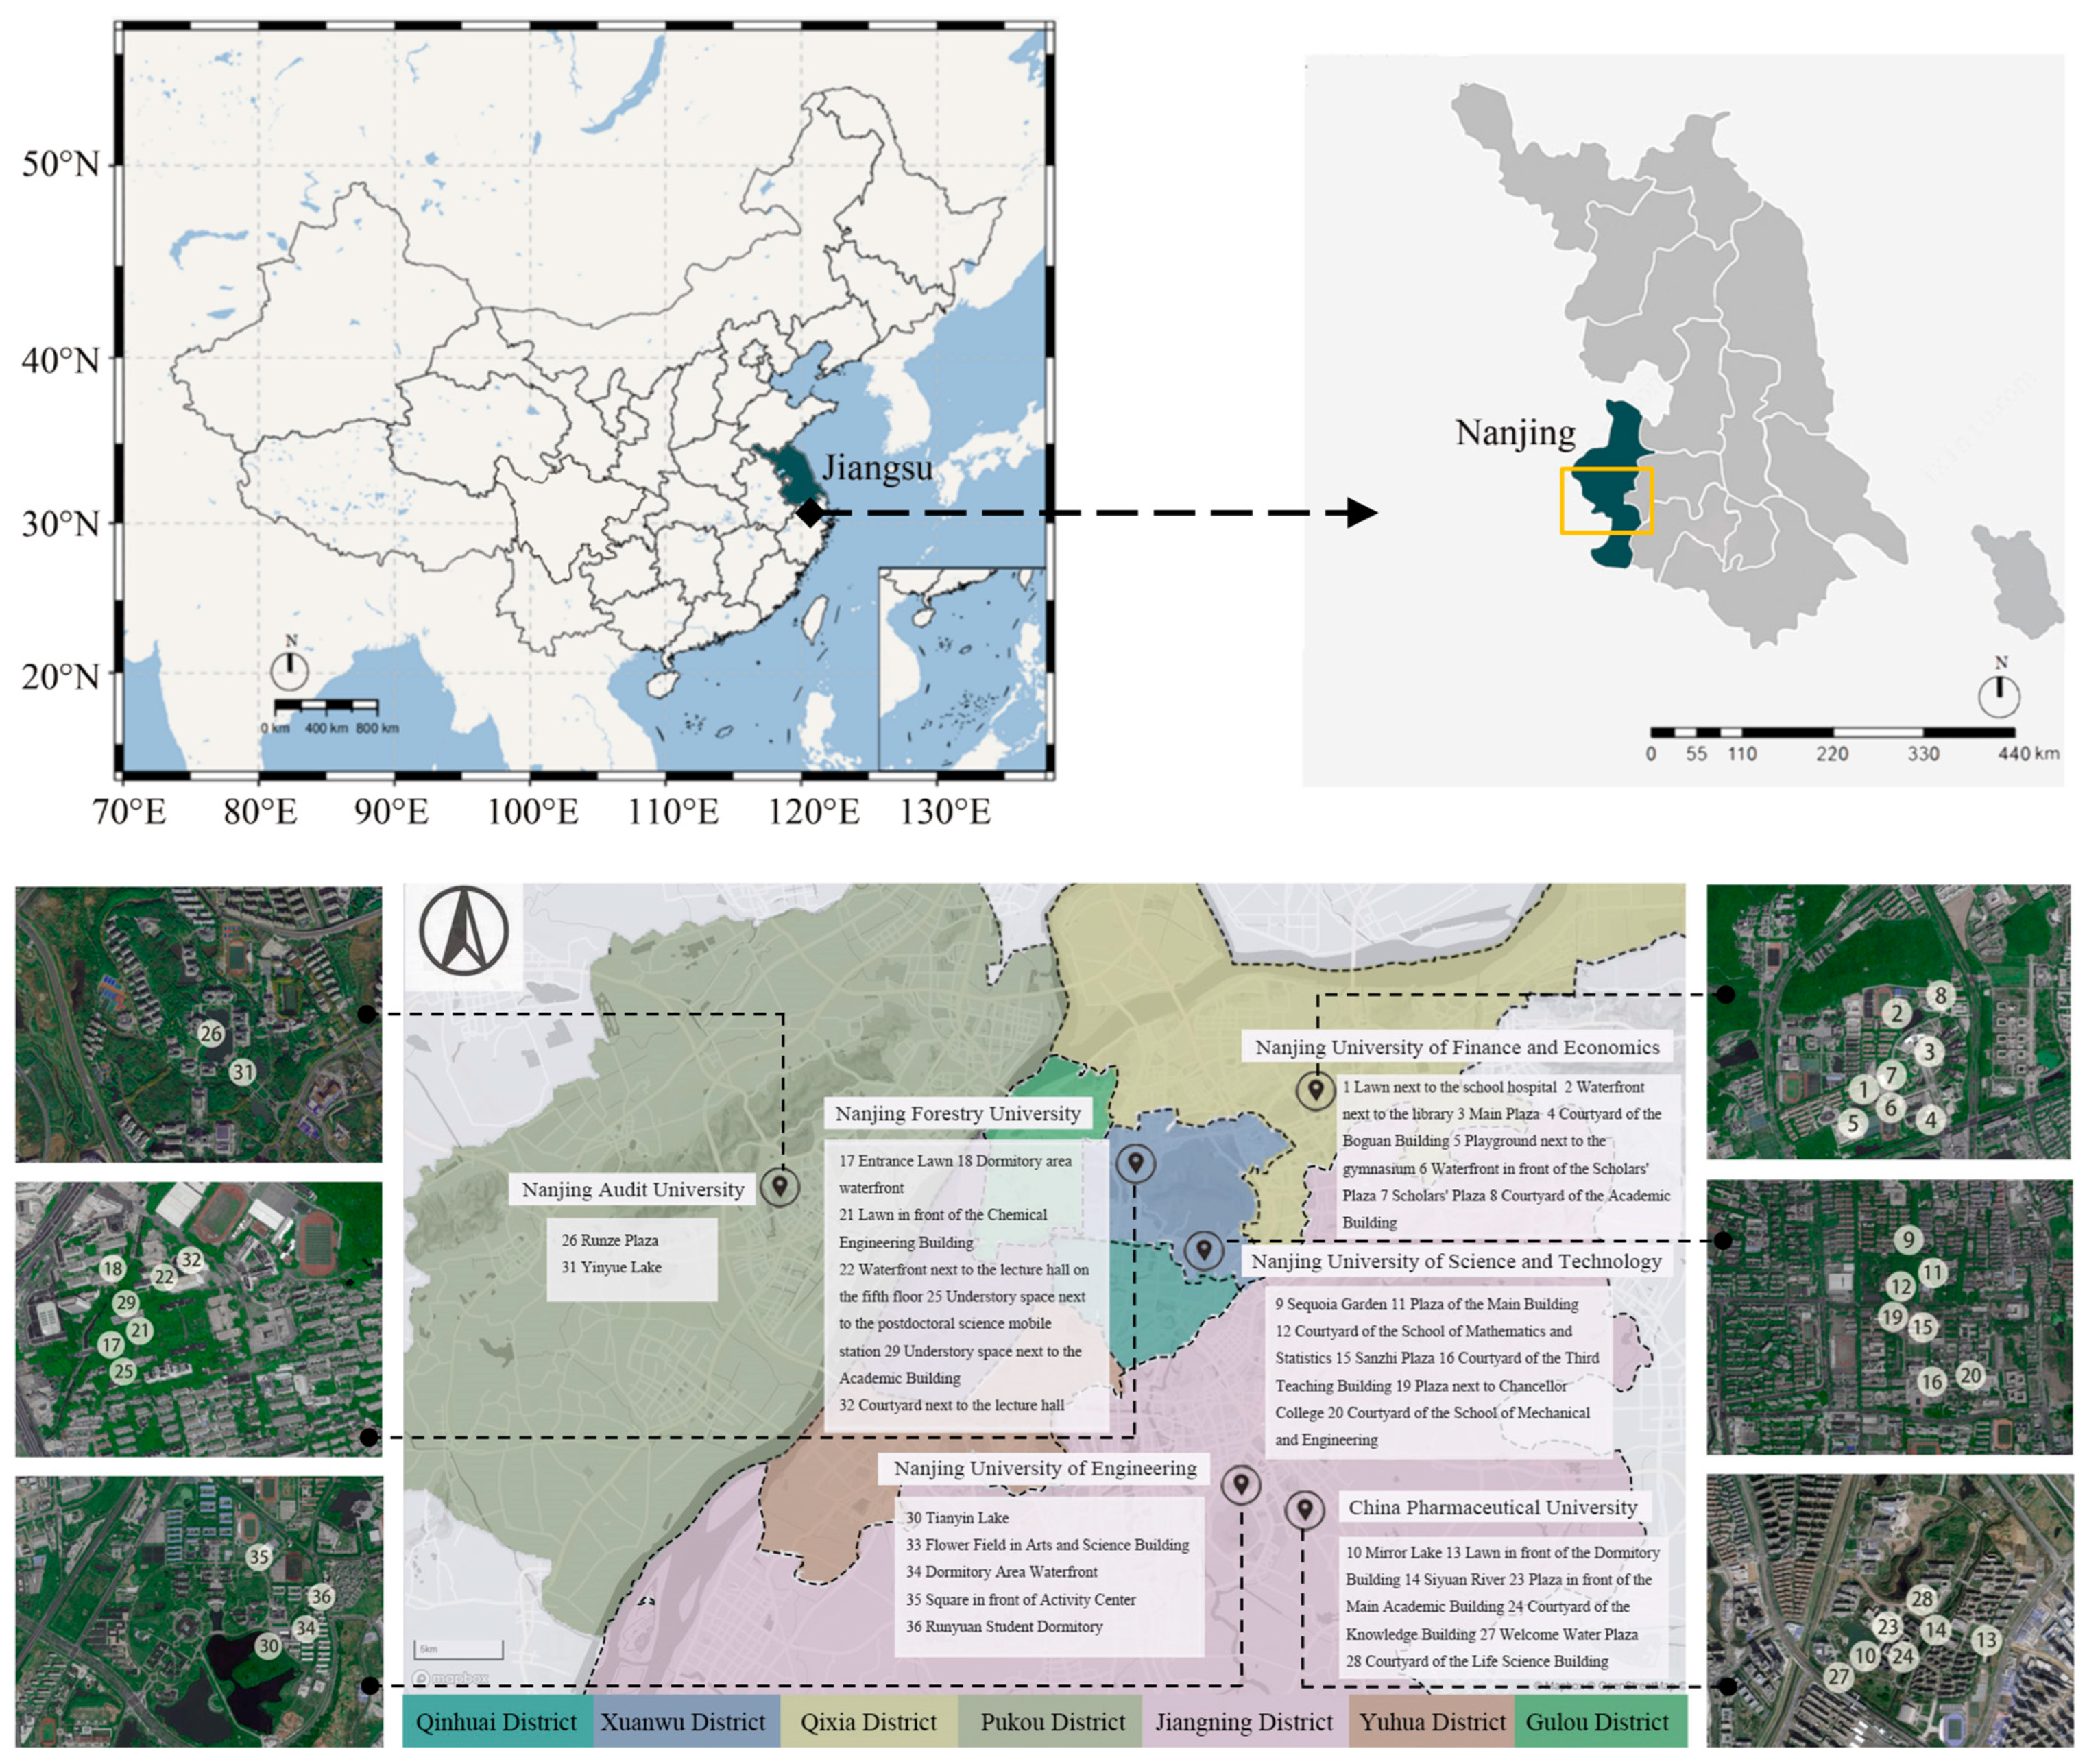
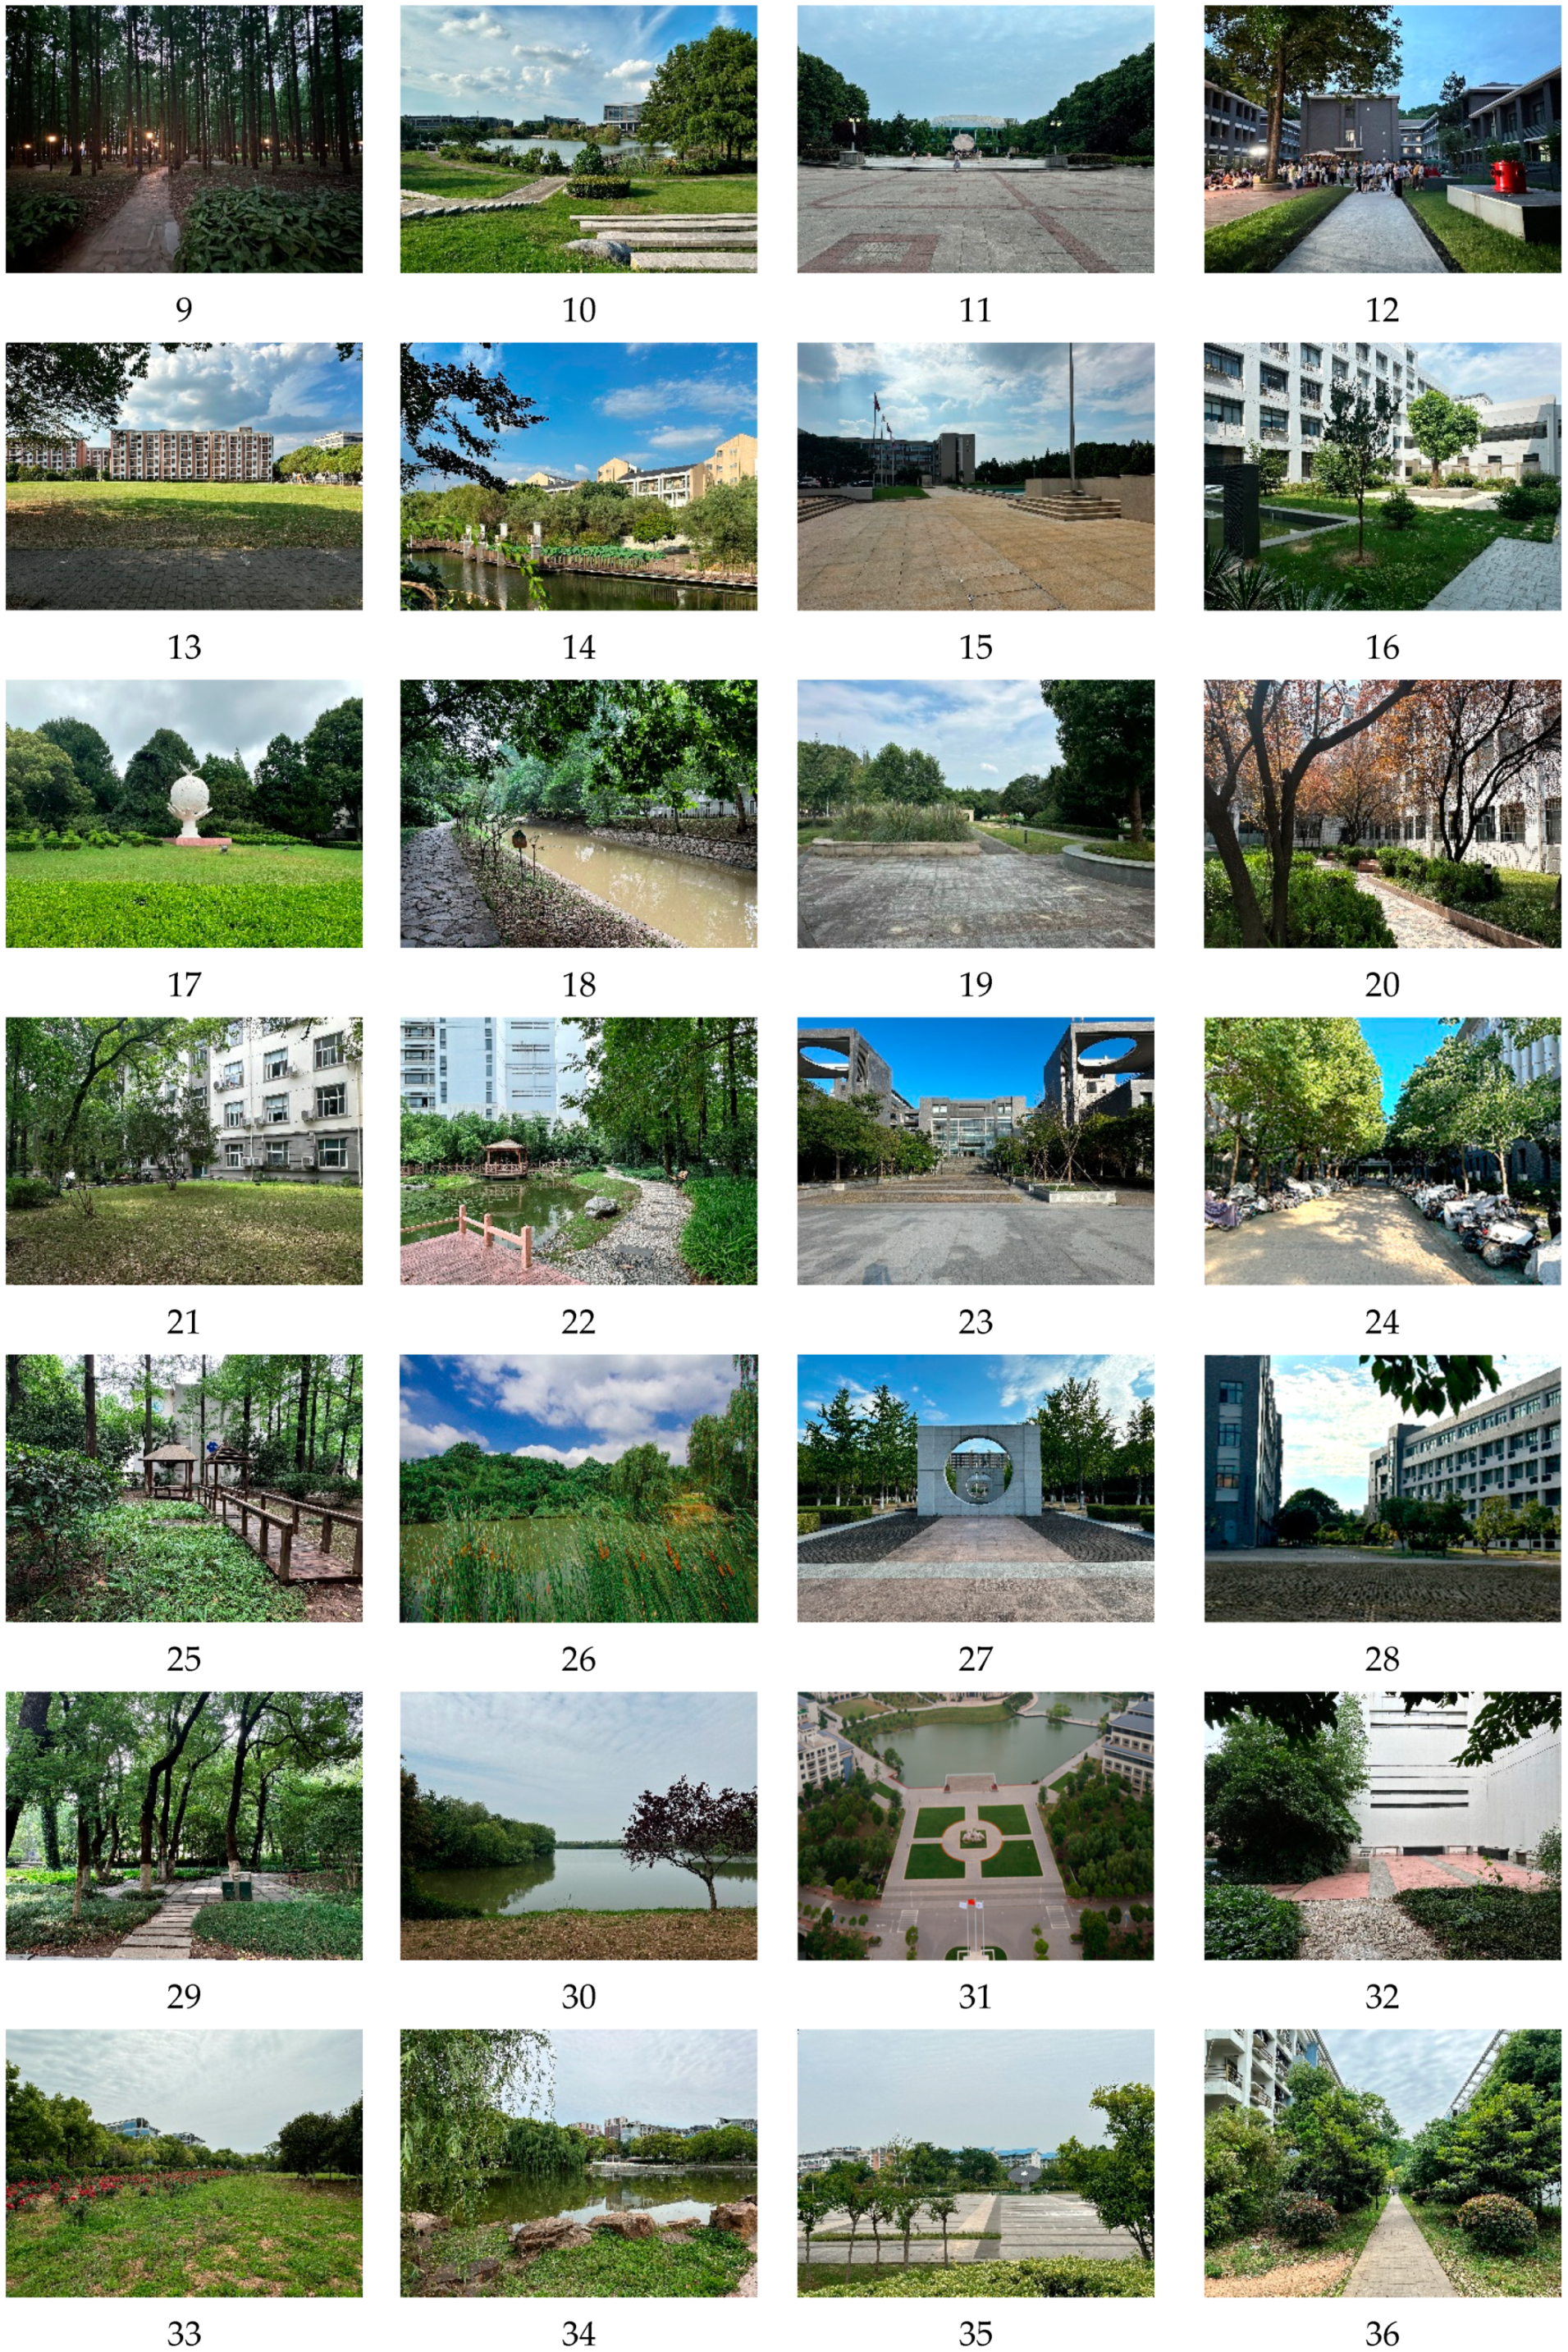
2.2. Study Sites and Materials
2.3. Part 1 of the Study
2.3.1. Questionnaire Design
2.3.2. Data Collection
2.4. Part 2 of the Study
2.4.1. Questionnaire Design
2.4.2. Data Collection
3. Results
3.1. Part 1 of the Study: Scale Development
3.1.1. Exploratory Factor Analysis and Examination
3.1.2. Reliability Test of Questionnaire
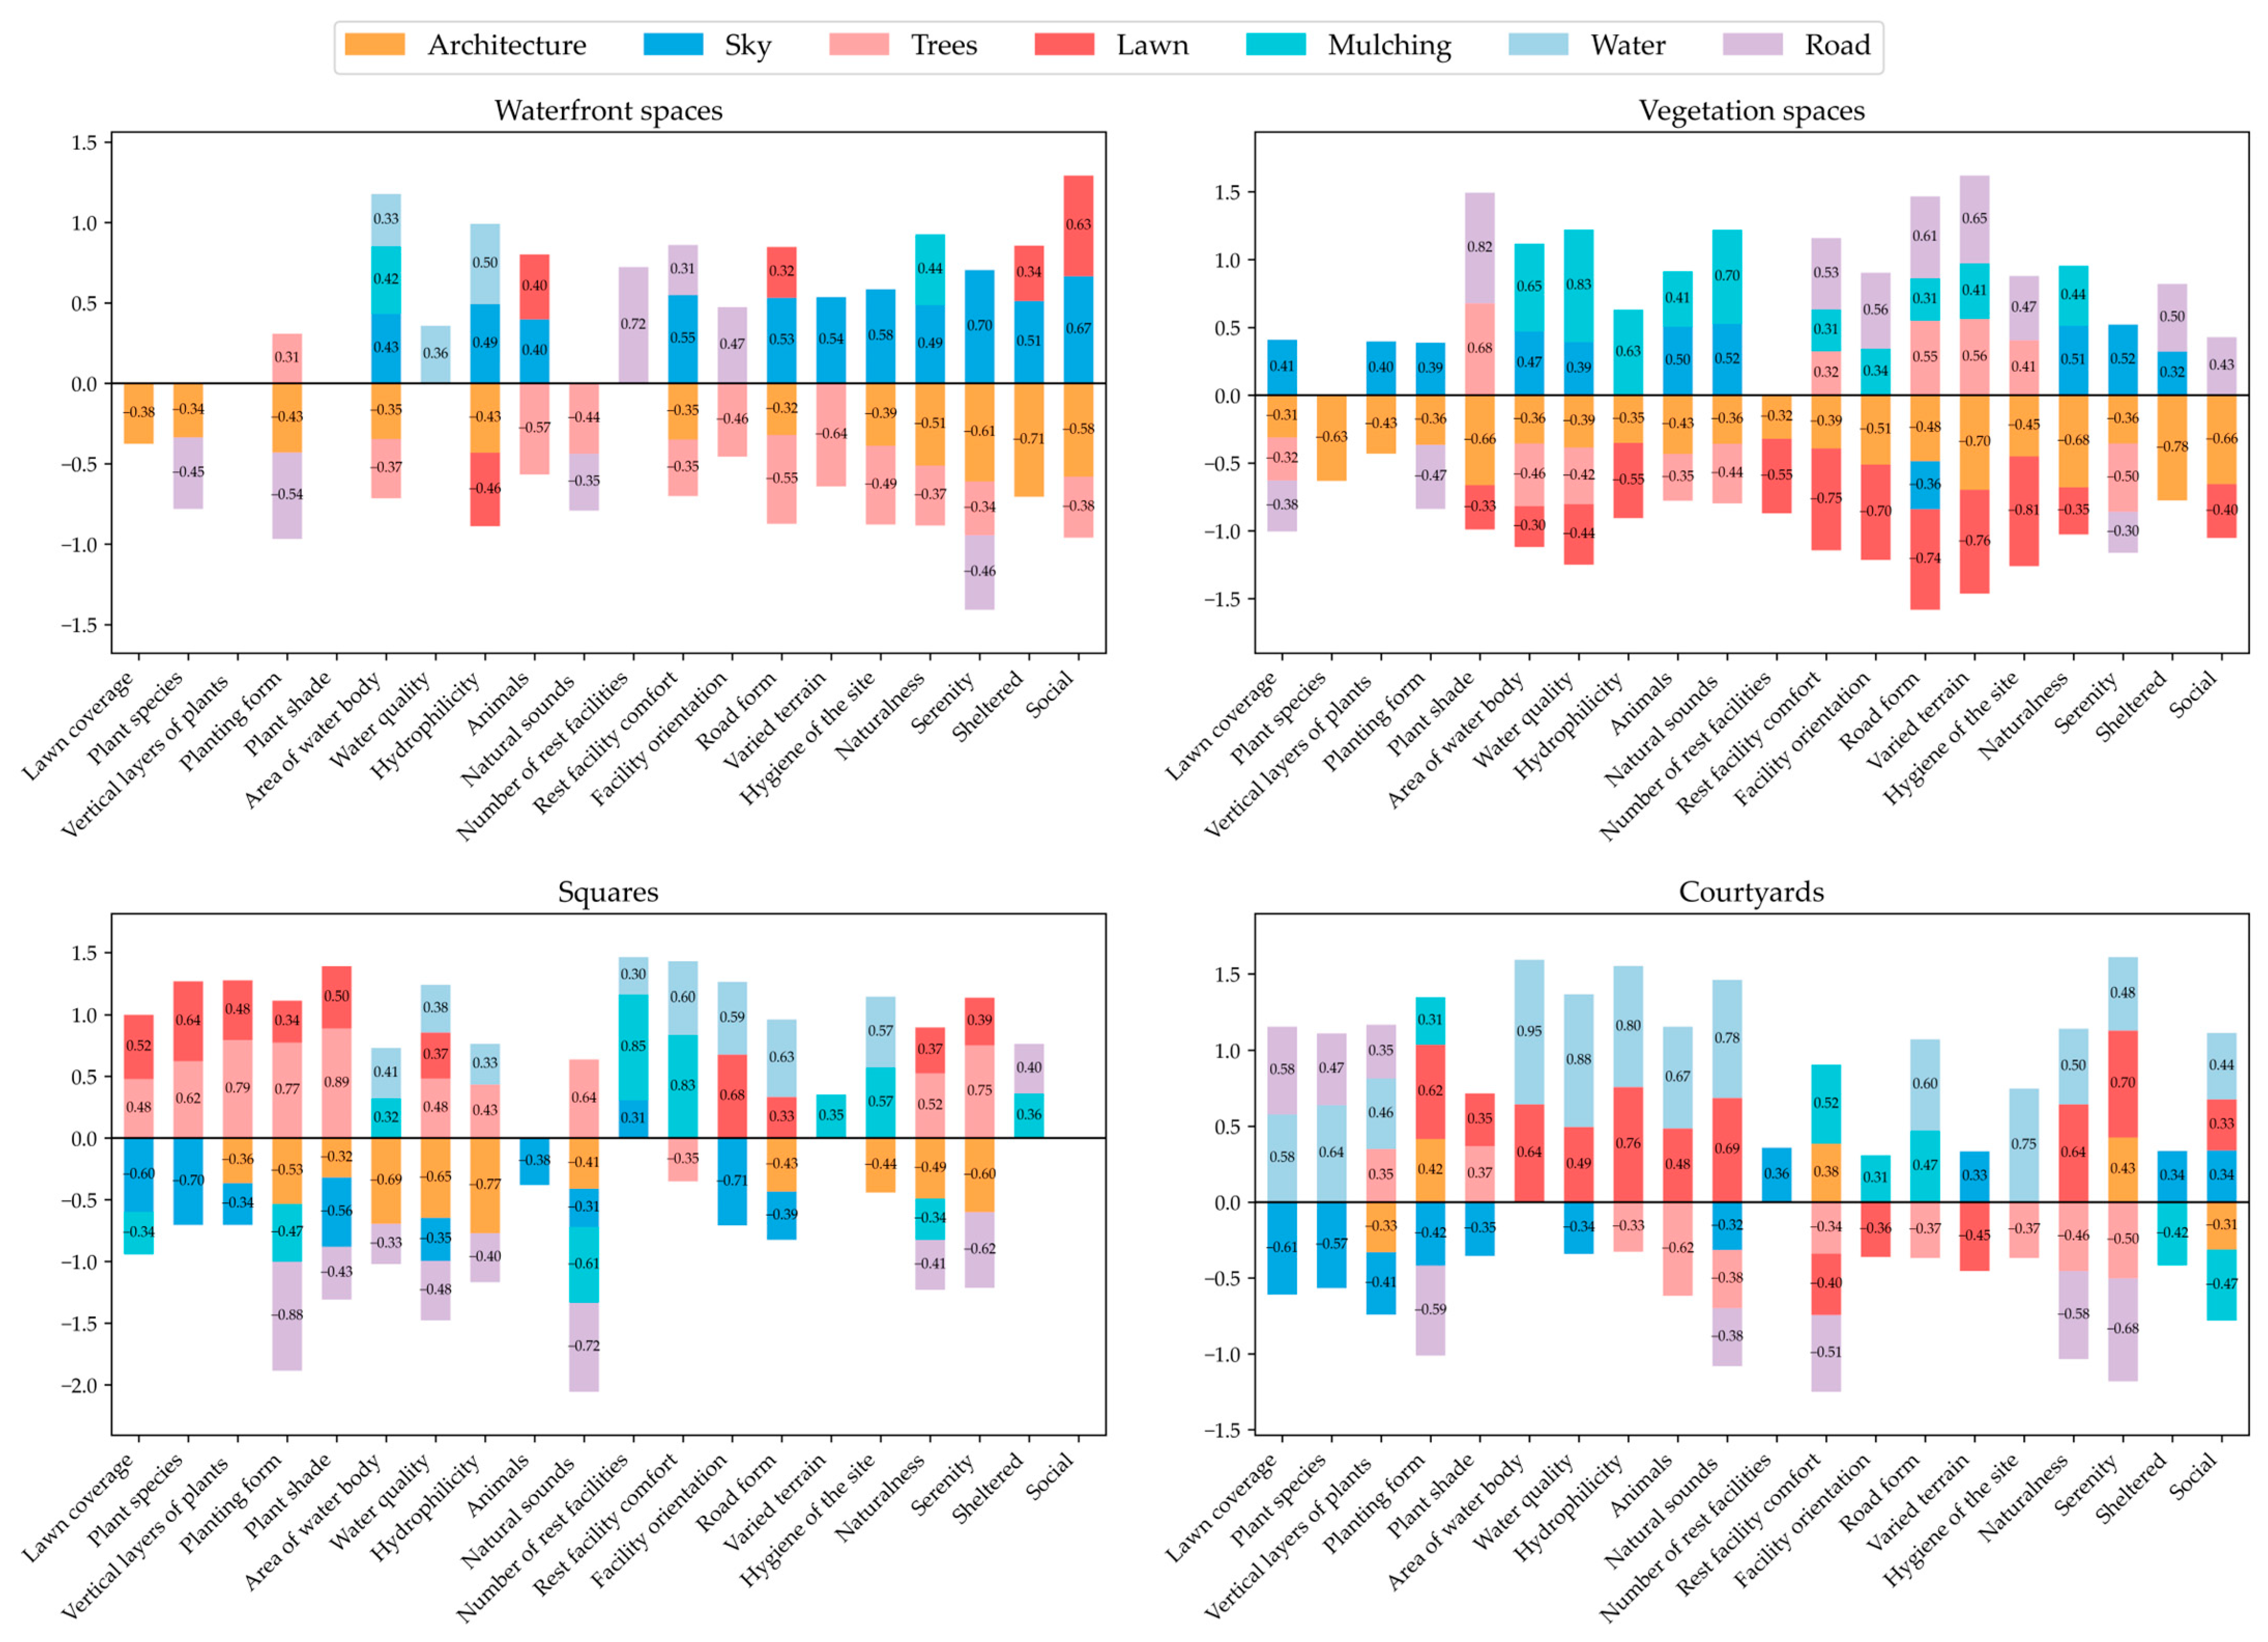
3.1.3. Correlation Between Landscape Elements and Perception Indicators
- (1)
- Waterfront Spaces
- (2)
- Vegetation Spaces
- (3)
- Squares
- (4)
- Courtyards
3.2. Part 2 of the Study: Mental Restorative Effects of Campus
3.2.1. Summary Statistics
3.2.2. Descriptive Statistics of Variables
3.2.3. Common Method Bias Test
3.2.4. Measurement Model
3.2.5. Structural Model
3.2.6. Moderating Effect of the Objective Landscape Elements
4. Discussion
4.1. Effects of Landscape Characteristics on Landscape Preference
4.2. Effects of Landscape Preference on Perceived Restorativeness
4.3. Effects of Landscape Characteristics on Mental Restoration
4.4. Explanation of Mediation Effects
4.5. Explanation of Moderating Effects
4.6. Limitations
5. Conclusions
Author Contributions
Funding
Institutional Review Board Statement
Informed Consent Statement
Data Availability Statement
Conflicts of Interest
Appendix A

| Image Name | Architecture (%) | Sky (%) | Trees (%) | Lawn (%) | Mulching (%) | Water (%) | Roads (%) |
|---|---|---|---|---|---|---|---|
| 1 | 3.66 | 30.37 | 13.36 | 22.58 | 25.59 | 0.00 | 3.78 |
| 2 | 0.77 | 25.47 | 22.01 | 0.12 | 0.00 | 22.06 | 0.00 |
| 3 | 9.11 | 31.52 | 4.66 | 0.00 | 21.67 | 15.85 | 14.59 |
| 4 | 32.74 | 10.16 | 12.81 | 0.00 | 17.58 | 0.00 | 0.00 |
| 5 | 0.02 | 32.26 | 25.42 | 34.40 | 2.12 | 0.00 | 0.22 |
| 6 | 2.54 | 22.63 | 20.40 | 0.00 | 6.76 | 26.97 | 20.14 |
| 7 | 19.15 | 21.78 | 4.60 | 0.00 | 9.79 | 0.00 | 41.70 |
| 8 | 43.90 | 2.12 | 8.20 | 27.63 | 14.54 | 0.00 | 0.00 |
| 9 | 0.00 | 2.10 | 52.14 | 8.40 | 20.22 | 0.00 | 13.80 |
| 10 | 2.41 | 36.33 | 18.19 | 23.17 | 10.32 | 3.14 | 6.16 |
| 11 | 1.64 | 34.06 | 18.70 | 0.00 | 2.10 | 0.00 | 0.00 |
| 12 | 29.48 | 12.98 | 16.80 | 2.54 | 12.15 | 0.00 | 17.90 |
| 13 | 12.84 | 23.88 | 14.02 | 26.92 | 1.03 | 0.00 | 0.04 |
| 14 | 5.41 | 29.52 | 25.12 | 0.00 | 22.17 | 16.49 | 0.00 |
| 15 | 5.06 | 37.92 | 8.14 | 1.63 | 0.00 | 0.00 | 0.00 |
| 16 | 21.80 | 8.15 | 5.19 | 28.88 | 12.24 | 6.20 | 15.50 |
| 17 | 1.17 | 21.74 | 32.83 | 19.67 | 21.90 | 0.00 | 0.00 |
| 18 | 0.79 | 0.08 | 51.21 | 0.04 | 0.00 | 18.32 | 4.11 |
| 19 | 0.08 | 22.82 | 27.56 | 6.37 | 5.59 | 0.00 | 0.13 |
| 20 | 35.52 | 2.10 | 26.88 | 0.00 | 20.81 | 0.00 | 12.10 |
| 21 | 27.65 | 0.00 | 32.38 | 39.33 | 0.02 | 0.00 | 0.41 |
| 22 | 35.02 | 0.02 | 18.62 | 3.57 | 0.00 | 15.51 | 11.86 |
| 23 | 21.32 | 18.35 | 18.65 | 1.09 | 0.01 | 0.00 | 0.00 |
| 24 | 2.45 | 12.33 | 36.19 | 4.17 | 7.32 | 0.00 | 26.16 |
| 25 | 9.80 | 4.92 | 28.48 | 0.04 | 17.10 | 0.00 | 0.03 |
| 26 | 0.00 | 22.80 | 28.09 | 0.00 | 25.55 | 21.82 | 0.00 |
| 27 | 2.24 | 23.46 | 22.32 | 0.55 | 3.90 | 0.00 | 0.00 |
| 28 | 18.64 | 25.06 | 18.70 | 9.50 | 8.62 | 0.00 | 11.00 |
| 29 | 0.10 | 3.34 | 62.34 | 19.95 | 3.67 | 0.00 | 9.82 |
| 30 | 0.00 | 43.55 | 19.97 | 1.42 | 0.00 | 16.82 | 0.00 |
| 31 | 6.79 | 0.08 | 26.21 | 18.04 | 10.00 | 28.32 | 6.11 |
| 32 | 30.79 | 0.00 | 15.21 | 0.04 | 12.80 | 0.00 | 24.11 |
| 33 | 1.23 | 34.03 | 16.49 | 31.40 | 16.01 | 0.00 | 0.00 |
| 34 | 3.79 | 20.08 | 17.21 | 8.04 | 15.72 | 23.32 | 4.80 |
| 35 | 3.83 | 41.54 | 22.85 | 5.15 | 11.23 | 0.00 | 0.00 |
| 36 | 9.55 | 13.23 | 42.08 | 21.69 | 6.15 | 0.00 | 6.95 |
References
- Akhtar, P., Ma, L., Waqas, A., Naveed, S., Li, Y., Rahman, A., & Wang, Y. (2020). Prevalence of depression among university students in low and middle income countries (LMICs): A systematic review and meta-analysis. Journal of Affective Disorders, 274, 911–919. [Google Scholar] [CrossRef] [PubMed]
- Ali, F., Rasoolimanesh, S. M., Sarstedt, M., Ringle, C. M., & Ryu, K. (2018). An assessment of the use of partial least squares structural equation modeling (PLS-SEM) in hospitality research. International Journal of Contemporary Hospitality Management, 30(1), 514–538. [Google Scholar]
- Auerbach, R. P., Mortier, P., Bruffaerts, R., Alonso, J., Benjet, C., Cuijpers, P., Demyttenaere, K., Ebert, D. D., Green, J. G., & Hasking, P. (2018). WHO world mental health surveys international college student project: Prevalence and distribution of mental disorders. Journal of Abnormal Psychology, 127(7), 623. [Google Scholar] [PubMed]
- Bagozzi, R. P. (1981). Evaluating structural equation models with unobservable variables and measurement error: A comment. Journal of Marketing Research, 18(3), 375–381. [Google Scholar] [CrossRef]
- Barnett, P., Arundell, L.-L., Saunders, R., Matthews, H., & Pilling, S. (2021). The efficacy of psychological interventions for the prevention and treatment of mental health disorders in university students: A systematic review and meta-analysis. Journal of Affective Disorders, 280, 381–406. [Google Scholar]
- Browning, M. H., Mimnaugh, K. J., Van Riper, C. J., Laurent, H. K., & LaValle, S. M. (2020). Can simulated nature support mental health? Comparing short, single-doses of 360-degree nature videos in virtual reality with the outdoors. Frontiers in Psychology, 10, 2667. [Google Scholar]
- Chin, W. W. (1998). The partial least squares approach to structural equation modeling. Modern Methods for Business Research/Lawrence Erlbaum Associates, 295(2), 295–336. [Google Scholar]
- Cohen, J. (2013). Statistical power analysis for the behavioral sciences. Routledge. [Google Scholar]
- Dessauvagie, A. S., Dang, H.-M., Nguyen, T. A. T., & Groen, G. (2022). Mental health of university students in southeastern asia: A systematic review. Asia Pacific Journal of Public Health, 34(2–3), 172–181. [Google Scholar]
- Di Domenico, S. I., & Ryan, R. M. (2017). The emerging neuroscience of intrinsic motivation: A new frontier in self-determination research. Frontiers in Human Neuroscience, 11, 145. [Google Scholar]
- Elena, S., Melanie, S.-B., Claire, B., Thomas, M., Natalie, C., Megan, W., Hannah, G., Karmen, S., Daniel, H., & Michael, B. (2021). Prevalence and risk factors for mental health problems in university undergraduate students: A systematic review with meta-analysis. Journal of Affective Disorders, 287(1), 112–114. [Google Scholar]
- Eriksson, L., & Nordlund, A. (2013). How is setting preference related to intention to engage in forest recreation activities? Urban Forestry & Urban Greening, 12(4), 481–489. [Google Scholar]
- Falk, J. H., & Balling, J. D. (2009). Evolutionary influence on human landscape preference. Environment and Behavior, 42(4), 479–493. [Google Scholar]
- Felsten, G. (2009). Where to take a study break on the college campus: An attention restoration theory perspective. Journal of Environmental Psychology, 29(1), 160–167. [Google Scholar] [CrossRef]
- Fisher, J. C., Irvine, K. N., Bicknell, J. E., Hayes, W. M., Fernandes, D., Mistry, J., & Davies, Z. G. (2021). Perceived biodiversity, sound, naturalness and safety enhance the restorative quality and wellbeing benefits of green and blue space in a neotropical city. Science of The Total Environment, 755, 143095. [Google Scholar] [PubMed]
- Foellmer, J., Kistemann, T., & Anthonj, C. (2021). Academic greenspace and well-being—Can campus landscape be therapeutic? Evidence from a german university. Wellbeing, Space and Society, 2, 100003. [Google Scholar]
- Fornell, C., & Bookstein, F. L. (1982). Two structural equation models: LISREL and PLS applied to consumer exit-voice theory. Journal of Marketing Research, 19(4), 440–452. [Google Scholar] [CrossRef]
- Galindo, M. P., & Hidalgo, M. C. (2005). Aesthetic preferences and the attribution of meaning: Environmental categorization processes in the evaluation of urban scenes. International Journal of Psychology, 40(1), 19–27. [Google Scholar] [CrossRef]
- Gardani, M., Bradford, D. R., Russell, K., Allan, S., Beattie, L., Ellis, J. G., & Akram, U. (2022). A systematic review and meta-analysis of poor sleep, insomnia symptoms and stress in undergraduate students. Sleep Medicine Reviews, 61, 101565. [Google Scholar] [CrossRef]
- Goldberg, D. P., & Hillier, V. F. (1979). A scaled version of the General Health Questionnaire. Psychological Medicine, 9(1), 139–145. [Google Scholar]
- Gong, X.-G., Wang, L.-P., Rong, G., Zhang, D.-N., Zhang, A.-Y., & Liu, C. (2023). Effects of online mindfulness-based interventions on the mental health of university students: A systematic review and meta-analysis. Frontiers in Psychology, 14, 1073647. [Google Scholar]
- Guo, W., Wen, H., & Liu, X. (2023). Research on the psychologically restorative effects of campus common spaces from the perspective of health. Frontiers in Public Health, 11, 1131180. [Google Scholar] [CrossRef] [PubMed]
- Ha, J., & Kim, H. J. (2021). The restorative effects of campus landscape biodiversity: Assessing visual and auditory perceptions among university students. Urban Forestry & Urban Greening, 64, 127259. [Google Scholar]
- Hagerhall, C. M., Purcell, T., & Taylor, R. (2004). Fractal dimension of landscape silhouette outlines as a predictor of landscape preference. Journal of Environmental Psychology, 24(2), 247–255. [Google Scholar] [CrossRef]
- Hair, J. F., Ringle, C. M., & Sarstedt, M. (2011). PLS-SEM: Indeed a silver bullet. Journal of Marketing Theory and Practice, 19(2), 139–152. [Google Scholar] [CrossRef]
- Han, K.-T. (2003). A reliable and valid self-rating measure of the restorative quality of natural environments. Landscape and Urban Planning, 64(4), 209–232. [Google Scholar] [CrossRef]
- Han, K.-T. (2010). An exploration of relationships among the responses to natural scenes: Scenic beauty, preference, and restoration. Environment and Behavior, 42(2), 243–270. [Google Scholar] [CrossRef]
- Harrer, M., Adam, S. H., Baumeister, H., Cuijpers, P., Karyotaki, E., Auerbach, R. P., Kessler, R. C., Bruffaerts, R., Berking, M., & Ebert, D. D. (2019). Internet interventions for mental health in university students: A systematic review and meta-analysis. International Journal of Methods in Psychiatric Research, 28(2), e1759. [Google Scholar] [CrossRef]
- Harrer, M., Adam, S. H., Messner, E., Baumeister, H., Cuijpers, P., Bruffaerts, R., Auerbach, R. P., Kessler, R. C., Jacobi, C., Taylor, C. B., & Ebert, D. D. (2020). Prevention of eating disorders at universities: A systematic review and meta-analysis. International Journal of Eating Disorders, 53(6), 813–833. [Google Scholar] [CrossRef]
- Hartig, T., Böök, A., Garvill, J., Olsson, T., & Gärling, T. (1996). Environmental influences on psychological restoration. Scandinavian Journal of Psychology, 37(4), 378–393. [Google Scholar] [CrossRef]
- Hartig, T., Korpela, K., Evans, G. W., & Gärling, T. (1997). A measure of restorative quality in environments. Scandinavian Housing and Planning Research, 14(4), 175–194. [Google Scholar] [CrossRef]
- Henseler, J., Ringle, C. M., & Sarstedt, M. (2015). A new criterion for assessing discriminant validity in variance-based structural equation modeling. Journal of the Academy of Marketing Science, 43(1), 115–135. [Google Scholar] [CrossRef]
- Herzog, T. R., Black, A. M., Fountaine, K. A., & Knotts, D. J. (1997). Reflection and attentional recovery as distinctive benefits of restorative environments. Journal of Environmental Psychology, 17(2), 165–170. [Google Scholar] [CrossRef]
- Hibbs, B. J., & Rostain, A. (2019). The stressed years of their lives: Helping your kid survive and thrive during their college years. St. Martin’s Press. Available online: https://book.douban.com/subject/32104652/ (accessed on 26 January 2024).
- Huang, J., Nigatu, Y. T., Smail-Crevier, R., Zhang, X., & Wang, J. (2018). Interventions for common mental health problems among university and college students: A systematic review and meta-analysis of randomized controlled trials. Journal of Psychiatric Research, 107, 1–10. [Google Scholar] [CrossRef] [PubMed]
- Kaplan, R. (1989). The experience of nature: A psychological perspective. Cambridge University Perss. [Google Scholar]
- Kaplan, R., Kaplan, S., & Brown, T. (1989). Environmental preference: A comparison of four domains of predictors. Environment and Behavior, 21(5), 509–530. [Google Scholar] [CrossRef]
- Kaplan, S. (1995). The restorative benefits of nature: Toward an integrative framework. Journal of Environmental Psychology, 15(3), 169–182. [Google Scholar] [CrossRef]
- Korpela, K., Borodulin, K., Neuvonen, M., Paronen, O., & Tyrväinen, L. (2014). Analyzing the mediators between nature-based outdoor recreation and emotional well-being. Journal of Environmental Psychology, 37, 1–7. [Google Scholar] [CrossRef]
- Korpela, K. M., Hartig, T., Kaiser, F. G., & Fuhrer, U. (2001). Restorative experience and self-regulation in favorite places. Environment and Behavior, 33(4), 572–589. [Google Scholar] [CrossRef]
- Korpela, K. M., & Ylén, M. P. (2009). Effectiveness of favorite-place prescriptions: A field experiment. American Journal of Preventive Medicine, 36(5), 435–438. [Google Scholar] [CrossRef]
- Lattie, E. G., Adkins, E. C., Winquist, N., Stiles-Shields, C., Wafford, Q. E., & Graham, A. K. (2019). Digital mental health interventions for depression, anxiety, and enhancement of psychological well-being among college students: Systematic review. Journal of Medical Internet Research, 21(7), e12869. [Google Scholar] [CrossRef]
- Li, K. (2024). The healing effect of campus activity space plant landscape on college students in Xi’an area [Doctoral dissertation, Northwest A&F University]. [Google Scholar]
- Li, X., Zhang, X., & Jia, T. (2023). Humanization of nature: Testing the influences of urban park characteristics and psychological factors on collegers’ perceived restoration. Urban Forestry & Urban Greening, 79, 127806. [Google Scholar] [CrossRef]
- Liu, H., Li, F., Li, J., & Zhang, Y. (2017). The relationships between urban parks, residents’ physical activity, and mental health benefits: A case study from Beijing, China. Journal of Environmental Management, 190, 223–230. [Google Scholar] [CrossRef] [PubMed]
- Liu, Q., Luo, S., Shen, Y., Zhu, Z., Yao, X., Li, Q., Tarin, M. W. K., Zheng, J., & Zhuo, Z. (2022). Relationships between students’ demographic characteristics, perceived naturalness and patterns of use associated with campus green space, and self-rated restoration and health. Urban Forestry & Urban Greening, 68, 127474. [Google Scholar]
- Liu, Q., You, D., Pan, M., Chi, M., Huang, Q., & Lan, S. (2017). Perceived place and restorative perceived place among recreation users: A case study of Fuzhou Hot Spring Park. Tourism Journal, 32(7), 77–88. [Google Scholar]
- Liu, Q., Zhang, Y., Lin, Y., You, D., Zhang, W., Huang, Q., Van Den Bosch, C. C. K., & Lan, S. (2018). The relationship between self-rated naturalness of university green space and students’ restoration and health. Urban Forestry & Urban Greening, 34, 259–268. [Google Scholar] [CrossRef]
- Lu, M., & Fu, J. (2019). Attention restoration space on a university campus: Exploring restorative campus design based on environmental preferences of students. International Journal of Environmental Research and Public Health, 16(14), 2629. [Google Scholar] [PubMed]
- Lu, Y., & Liu, Z. (2023). The influence mechanism of urban park place attachment based on eight perceived attributes of green space. China Urban Forestry, 21. [Google Scholar]
- Malekinezhad, F., Courtney, P., bin Lamit, H., & Vigani, M. (2020). Investigating the mental health impacts of university campus green space through perceived sensory dimensions and the mediation effects of perceived restorativeness on restoration experience. Frontiers in Public Health, 8, 578241. [Google Scholar]
- Mangone, G., Dopko, R. L., & Zelenski, J. M. (2021). Deciphering landscape preferences: Investigating the roles of familiarity and biome types. Landscape and Urban Planning, 214, 104189. [Google Scholar]
- Marselle, M. R., Irvine, K. N., Lorenzo-Arribas, A., & Warber, S. L. (2016). Does perceived restorativeness mediate the effects of perceived biodiversity and perceived naturalness on emotional well-being following group walks in nature? Journal of Environmental Psychology, 46, 217–232. [Google Scholar]
- Martínez-Soto, J., Montero-López Lena, M., & Córdova y Vázquez, A. (2014). Psychological restoration and urban nature: Some mental health implications. Salud Mental, 37(3), 217–224. [Google Scholar]
- McMahan, E. A., & Estes, D. (2015). The effect of contact with natural environments on positive and negative affect: A meta-analysis. The Journal of Positive Psychology, 10(6), 507–519. [Google Scholar] [CrossRef]
- Meng, L., Kang, N., Gong, C., & Li, S. (2022). A systematic review of the impact of biodiversity levels on mental health and well-being. Chinese Gardens, 38(11), 82–87. [Google Scholar]
- Meng, M., & Zhu, Q. (2018). Continuous use behavior of mobile social media users. Modern Intelligence, 38(1), 14. [Google Scholar]
- Nghiem, T. P. L., Wong, K. L., Jeevanandam, L., Chang, C. C., Tan, L. Y. C., Goh, Y., & Carrasco, L. R. (2021). Biodiverse urban forests, happy people: Experimental evidence linking perceived biodiversity, restoration, and emotional wellbeing. Urban Forestry & Urban Greening, 59, 127030. [Google Scholar]
- Ode, Å., Fry, G., Tveit, M. S., Messager, P., & Miller, D. (2009). Indicators of perceived naturalness as drivers of landscape preference. Journal of Environmental Management, 90(1), 375–383. [Google Scholar] [CrossRef] [PubMed]
- Peschardt, K. K., & Stigsdotter, U. K. (2013). Associations between park characteristics and perceived restorativeness of small public urban green spaces. Landscape and Urban Planning, 112, 26–39. [Google Scholar] [CrossRef]
- Podsakoff, P. M., MacKenzie, S. B., Lee, J.-Y., & Podsakoff, N. P. (2003). Common method biases in behavioral research: A critical review of the literature and recommended remedies. Journal of Applied Psychology, 88(5), 879. [Google Scholar] [CrossRef] [PubMed]
- Ratcliffe, E., & Korpela, K. M. (2018). Time- and self-related memories predict restorative perceptions of favorite places via place identity. Environment and Behavior, 50(6), 690–720. [Google Scholar] [CrossRef]
- Scopelliti, M., & Vittoria Giuliani, M. (2004). Choosing restorative environments across the lifespan: A matter of place experience. Journal of Environmental Psychology, 24(4), 423–437. [Google Scholar] [CrossRef]
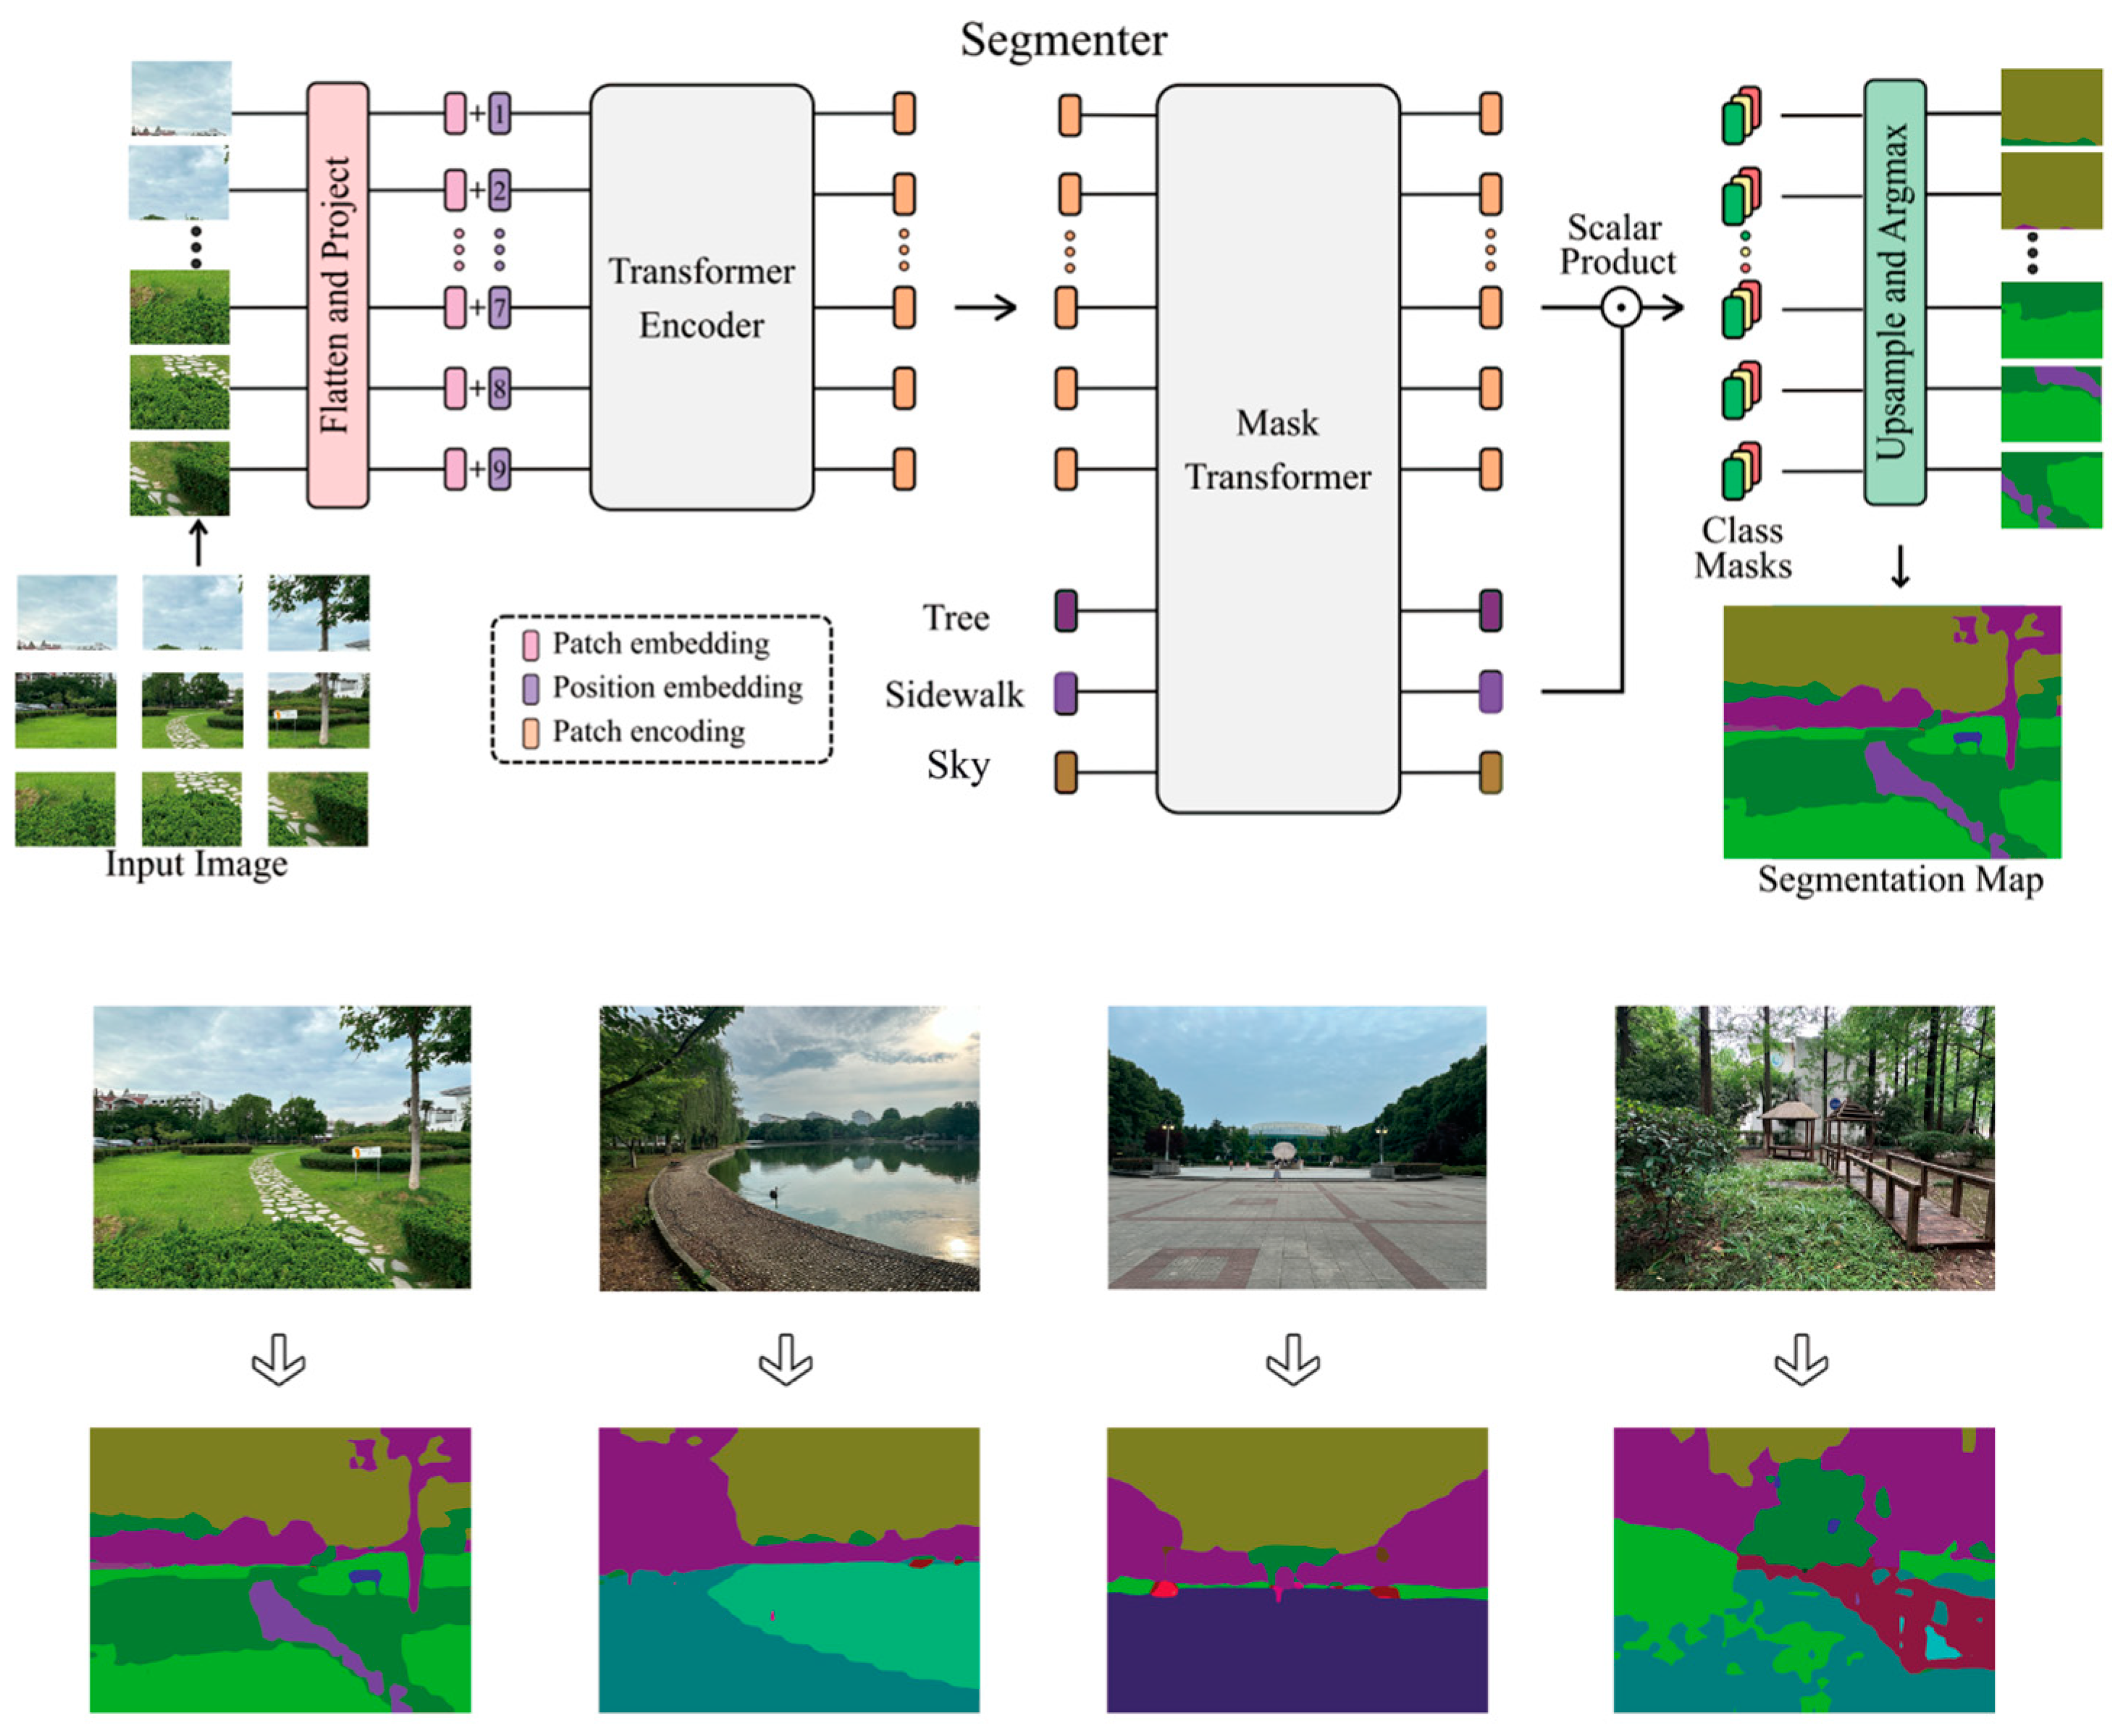
- Strudel, R., Garcia, R., Laptev, I., & Schmid, C. (2021). Segmenter: Transformer for semantic segmentation. arXiv, arXiv:2105.05633. [Google Scholar] [CrossRef]
- Tennant, R., Hiller, L., Fishwick, R., Platt, S., Joseph, S., Weich, S., Parkinson, J., Secker, J., & Stewart-Brown, S. (2007). The Warwick-Edinburgh Mental Well-Being Scale (WEMWBS): Development and UK validation. Health and Quality of Life Outcomes, 5(1), 63. [Google Scholar] [CrossRef] [PubMed]
- The EuroQol Group. (1990). EuroQol—A new facility for the measurement of health-related quality of life. Health Policy, 16(3), 199–208. [Google Scholar]
- Ulrich, R. S. (1984). View through a window may influence recovery from surgery. Science, 224(4647), 420–421. [Google Scholar] [CrossRef] [PubMed]
- Ulrich, R. S. (1991). Effects of interior design on wellness: Theory and recent scientific research. Journal of Health Care Interior Design: Proceedings from the… Symposium on Health Care Interior Design. Symposium on Health Care Interior Design, 3, 97–109. [Google Scholar]
- Van den Berg, A. E. (2005). Health impacts of healing environments; a review of evidence for benefits of nature, daylight, fresh air, and quiet in healthcare settings. UMCG. Available online: https://library.wur.nl/WebQuery/wurpubs/fulltext/25286 (accessed on 9 April 2024).
- Whitburn, J., Linklater, W., & Abrahamse, W. (2020). Meta-analysis of human connection to nature and proenvi-ronmental behavior. Conservation Biology, 34(1), 180–193. [Google Scholar] [CrossRef]
- Wohlwill, J. F. (1976). Environmental aesthetics: The environment as a source of affect. In I. Altman, & J. F. Wohlwill (Eds.), Human behavior and environment: Advances in theory and research (volume 1, pp. 37–86). Springer. [Google Scholar] [CrossRef]
- Wolf, I. D., & Wohlfart, T. (2014). Walking, hiking and running in parks: A multidisciplinary assessment of health and well-being benefits. Landscape and Urban Planning, 130, 89–103. [Google Scholar]
- Ye, J., Huang, J., & Xiao, L. (2023). Environmental restoration benefits of planting scenes in college campus living areas based on virtual reality technology. Chinese Garden, 39(11), 97–103. [Google Scholar]
- Yi, K., & Yang, D. (2022). Restoration perception benefits of campus green space based on SD method. China Urban Forestry, 20(5), 6. [Google Scholar]
- Zhou, Y., Luo, Y., & Guo, S. (2024). The impact mechanism of biodiversity perception on psychological recovery in large waterfront green spaces. Landscape Architecture, 31(2), 111–119. [Google Scholar] [CrossRef]
- Zhou, Y., Yang, L., Yu, J., & Guo, S. (2022). Do seasons matter? Exploring the dynamic link between blue-green space and mental restoration. Urban Forestry & Urban Greening, 73, 127612. [Google Scholar]
- Zurawicki, L. (2010). Exploring the Brain. In L. Zurawicki (Ed.), Neuromarketing: Exploring the brain of the consumer (pp. 1–53). Springer. [Google Scholar] [CrossRef]


| School | Location | Date of Establishment | Size and Population | Type of University District | Number of Sample Sites | Space Type |
|---|---|---|---|---|---|---|
| Nanjing University of Science and Technology | Xuanwu district | 1953 | 2,133,344 m2 28,000 people | O | 7 | WS, VS, SS, CS |
| Nanjing University of Finance and Economics (Qixia Campus) | Qixia district | 2003 | 1,000,005 m2 20,000 people | N | 8 | WS, VS, SS, CS |
| Nanjing Forestry University | Xuanwu district | 1955 | 837,997.19 m2 25,000 people | O | 8 | WS, VS, CS |
| China Pharmaceutical University (Jiangning Campus) | Jiangning district | 2012 | 1,333,340 m2 13,000 people | N | 7 | WS, VS, SS, CS |
| Nanjing Audit University | Pukou district | 2003 | 1,080,005.4 m2 15,000 people | N | 2 | SS, WS |
| Nanjing University of Engineering | Jiangning district | 2005 | 1,700,008.5 m2 24,000 people | N | 4 | WS, VS, SS, CS |
| Construct | Item | Reference | |
|---|---|---|---|
| Landscape Preference | LP1: This place has high quality of naturalness. | Mangone et al. (2021); Ode et al. (2009) | |
| LP2: The landscape is of quality of diversity | |||
| LP3: This place has high quality of planning and design. | |||
| LP4: The landscape is of liveliness and good visual order. | |||
| LP5: This is a fascinating place. | |||
| LP6: In overall, this place has quality of aesthetic appeal. | |||
| Mental Restoration | MR1: How would you rate the improvement in self-perceived energy levels after this CGS visit? | Zhou et al. (2022); H. Liu et al. (2017) | |
| MR2: How would you rate the improvement in self-perceived health status after this CGS visit? | |||
| MR3: How would you rate the improvement in self-perceived confidence after this CGS visit? | |||
| MR4: To what extent do you feel that this CGS visit relaxed you? | |||
| MR5: To what extent do you feel that this CGS visit restored your mood? | |||
| Perceived restorativeness | PR1: Being away | PR1-1: There’s a different vibe here. | Hartig et al. (1997) |
| PR1-2: I feel really detached from my daily routine. | |||
| PR1-3: Being here is an escape experience. | |||
| PR1-4: I can relax here. | |||
| PR1-5: I feel really detached from the stress of everyday life. | |||
| PR2: Extent | PR2-1: I’m confused here (reversed item). | ||
| PR2-2: There is too much going on (reversed item). | |||
| PR2-3: There is a great deal of distraction here (reversed item). | |||
| PR3: Fascination | PR3-1: Places like that are fascinating. | ||
| PR3-2: My attention is drawn to many interesting things. | |||
| PR3-3: I feel really drawn to details in this place. | |||
| PR3-4: I would like to spend more time looking at the surroundings. | |||
| Factors | Factor Loadings | ||||||
|---|---|---|---|---|---|---|---|
| Factor 1 | Factor 2 | Factor 3 | Factor 4 | Factor 5 | Factor 6 | Communality | |
| NC1-1 Large area of lawn coverage | 0.848 | 0.738 | |||||
| NC1-2 Rich plant species | 0.871 | 0.810 | |||||
| NC1-3 Vertical layers of plants are rich | 0.842 | 0.714 | |||||
| NC1-4 Natural planting form | 0.813 | 0.705 | |||||
| NC1-5 Good plant shade | 0.837 | 0.714 | |||||
| NC2-1 Large waterfront | 0.785 | 0.696 | |||||
| NC2-2 Good water quality | 0.787 | 0.728 | |||||
| NC2-3 Water landscape with good hydrophilicity | 0.804 | 0.697 | |||||
| NC3-1 Many animals | 0.868 | 0.815 | |||||
| NC3-2 Natural sounds such as cicadas and birds can be heard | 0.859 | 0.806 | |||||
| AC1-1 Adequate rest facilities | 0.820 | 0.748 | |||||
| AC1-2 Rest facilities are more comfortable | 0.848 | 0.802 | |||||
| AC1-3 Rest facilities are oriented towards the scenery | 0.752 | 0.711 | |||||
| AC2-1 Winding roads | 0.888 | 0.840 | |||||
| AC2-2 Varied terrain | 0.727 | 0.664 | |||||
| AC2-3 The site is clean and hygienic | 0.821 | 0.753 | |||||
| SA1 Feels natural (naturalness) | 0.722 | 0.603 | |||||
| SA2 Feels calm (serenity) | 0.841 | 0.735 | |||||
| SA3 Feels safe (sheltered) | 0.777 | 0.618 | |||||
| SA4 The site is suitable for students to interact socially (social) | 0.859 | 0.755 | |||||
| Eigenvalue | 4.642 | 3.390 | 2.220 | 1.612 | 1.559 | 1.227 | |
| Variance explained (%) | 19.291 | 13.334 | 11.466 | 10.891 | 10.080 | 8.191 | |
| Cumulative variance explained (%) | 19.291 | 32.625 | 44.091 | 54.982 | 65.062 | 73.253 | |
| Variables | Item | CITC | Cronbach’s α Values After Deletion of Terms | Cronbach’s α Values for Each Variable |
|---|---|---|---|---|
| Vegetation | NC1-1 | 0.788 | 0.881 | 0.906 |
| NC1-2 | 0.815 | 0.875 | ||
| NC1-3 | 0.749 | 0.889 | ||
| NC1-4 | 0.733 | 0.892 | ||
| NC1-5 | 0.743 | 0.890 | ||
| Water | NC2-1 | 0.605 | 0.607 | 0.740 |
| NC2-2 | 0.569 | 0.651 | ||
| NC2-3 | 0.524 | 0.706 | ||
| Animal Diversity | NC3-1 | 0.553 | — | 0.712 |
| NC3-2 | 0.553 | — | ||
| Rest | AC1-1 | 0.590 | 0.782 | 0.800 |
| AC1-2 | 0.732 | 0.632 | ||
| AC1-3 | 0.618 | 0.757 | ||
| Site | AC2-1 | 0.743 | 0.661 | 0.813 |
| AC2-2 | 0.570 | 0.838 | ||
| AC2-3 | 0.684 | 0.721 | ||
| Spatial Perception | SA1 | 0.589 | 0.810 | 0.826 |
| SA2 | 0.721 | 0.749 | ||
| SA3 | 0.595 | 0.806 | ||
| SA4 | 0.711 | 0.753 |
| Measures | Measure Types | N | % |
|---|---|---|---|
| Gender | Male | 386 | 50.9 |
| Female | 373 | 49.1 | |
| Education | Undergraduate | 401 | 52.8 |
| Master student | 286 | 37.7 | |
| Doctoral student | 72 | 9.5 | |
| Have a design background | Yes | 327 | 43.1 |
| No | 432 | 56.9 | |
| Hours spent on studying (classes, revision, and homework) in the last week | Average of 1–2 h per day | 173 | 22.8 |
| Average of 3–4 h per day | 237 | 31.2 | |
| Average of 5–6 h per day | 295 | 38.9 | |
| Average of 7 h and more per day | 54 | 7.1 | |
| Hours of sleep per day for the last week | Average of 10 h and more per day | 32 | 4.2 |
| Average of 8–9 h per day | 344 | 45.3 | |
| Average of 6–7 h per day | 333 | 43.9 | |
| Average of 4–5 h per day | 50 | 6.6 | |
| Self-stress evaluation | No pressure | 52 | 6.9 |
| Not much stress | 224 | 29.5 | |
| Occasional bad moods | 281 | 37 | |
| Often feel negative and depressed | 162 | 21.3 | |
| Stress is very high and seriously affects life | 40 | 5.3 | |
| Whether there will be problems with concentration | Hardly ever | 16 | 2.1 |
| Less frequently | 148 | 19.5 | |
| Occasionally | 303 | 39.9 | |
| Often | 243 | 32.0 | |
| Always | 49 | 6.5 | |
| When you have problems with stress, inattention, etc., do you want to make changes? | No, I don’t want to make a change | 47 | 6.2 |
| Maybe, but I don’t know by what means | 419 | 55.2 | |
| Yes, I can find a way to self-regulate | 293 | 38.6 | |
| Frequency of activities on CGSs | 3–5 times a week and above | 58 | 7.6 |
| 2–3 times a week | 187 | 24.6 | |
| About 5 times a month | 363 | 47.8 | |
| Almost not | 151 | 19.9 | |
| Time spent in CGSs | 15 min | 318 | 41.9 |
| 16–30 min | 324 | 42.7 | |
| 31 min–1 h | 89 | 11.7 | |
| More than 1 h | 28 | 3.7 | |
| How many people usually go to CGSs together | Alone | 168 | 22.1 |
| 2–3 persons | 503 | 66.3 | |
| 4–6 persons | 62 | 8.2 | |
| 7 and above | 26 | 3.4 |
| Second-Order Variable | First-Order Variable | Mean | Std. | Minimum | Maximum |
|---|---|---|---|---|---|
| Perception of natural landscape characteristics | Vegetation | 3.43 | 1.77 | 1.00 | 7.00 |
| Water | 3.90 | 1.50 | 1.00 | 7.00 | |
| Animal diversity | 3.71 | 1.57 | 1.00 | 7.00 | |
| Perception of artificial landscape characteristics | Rest | 3.64 | 1.54 | 1.00 | 7.00 |
| Site | 3.70 | 1.48 | 1.00 | 7.00 | |
| Spatial perception | 4.78 | 1.30 | 1.00 | 7.00 | |
| Landscape preference | 4.73 | 1.28 | 1.00 | 7.00 | |
| Mental restoration | 4.66 | 1.32 | 1.50 | 7.00 | |
| Perceived restorativeness | Being away | 4.42 | 1.44 | 1.20 | 7.00 |
| Extent | 4.80 | 1.26 | 1.00 | 7.00 | |
| Fascination | 4.22 | 1.42 | 1.25 | 7.00 | |
| Landscape elements | Architecture | 11.31 | 12.74 | 43.90 | 0.00 |
| Sky | 18.56 | 13.40 | 43.55 | 0.00 | |
| Trees | 22.80 | 12.17 | 62.34 | 4.60 | |
| Lawns | 9.96 | 12.17 | 39.33 | 0.00 | |
| Mulching | 10.13 | 8.12 | 25.59 | 0.00 | |
| Water | 5.91 | 9.44 | 28.32 | 0.00 | |
| Roads | 6.83 | 9.50 | 41.70 | 0.00 | |
| First-Order | Item | Loading | Cronbach’s α | C.R. | AVE | Second-Order | Loading | Cronbach’s α | C.R. | AVE |
|---|---|---|---|---|---|---|---|---|---|---|
| NC1 | NC1-1 | 0.853 | 0.903 | 0.928 | 0.722 | NC | 0.846 | 0.810 | 0.766 | 0.525 |
| NC1-2 | 0.887 | |||||||||
| NC1-3 | 0.806 | |||||||||
| NC1-4 | 0.852 | |||||||||
| NC1-5 | 0.847 | |||||||||
| NC2 | NC2-1 | 0.865 | 0.803 | 0.881 | 0.713 | 0.667 | ||||
| NC2-2 | 0.888 | |||||||||
| NC2-3 | 0.775 | |||||||||
| NC3 | NC3-1 | 0.836 | 0.722 | 0.874 | 0.777 | 0.644 | ||||
| NC3-2 | 0.925 | |||||||||
| AC1 | AC1-1 | 0.815 | 0.801 | 0.883 | 0.715 | AC | 0.839 | 0.816 | 0.834 | 0.716 |
| AC1-2 | 0.876 | |||||||||
| AC1-3 | 0.845 | |||||||||
| AC2 | AC2-1 | 0.905 | 0.826 | 0.896 | 0.743 | 0.853 | ||||
| AC2-2 | 0.832 | |||||||||
| AC2-3 | 0.847 | |||||||||
| SA | SA1 | 0.834 | 0.829 | 0.884 | 0.657 | |||||
| SA2 | 0.886 | |||||||||
| SA3 | 0.714 | |||||||||
| SA4 | 0.800 | |||||||||
| LP | LP1 | 0.891 | 0.921 | 0.940 | 0.760 | |||||
| LP2 | 0.834 | |||||||||
| LP3 | 0.876 | |||||||||
| LP4 | 0.888 | |||||||||
| LP6 | 0.867 | |||||||||
| MR | MR1 | 0.904 | 0.917 | 0.938 | 0.753 | |||||
| MR2 | 0.853 | |||||||||
| MR3 | 0.818 | |||||||||
| MR4 | 0.889 | |||||||||
| MR5 | 0.871 | |||||||||
| PR1 | PR1-1 | 0.858 | 0.920 | 0.940 | 0.759 | PR | 0.769 | 0.872 | 0.767 | 0.526 |
| PR1-2 | 0.902 | |||||||||
| PR1-3 | 0.875 | |||||||||
| PR1-4 | 0.839 | |||||||||
| PR1-5 | 0.880 | |||||||||
| PR2 | PR2-1 | 0.874 | 0.813 | 0.889 | 0.727 | 0.612 | ||||
| PR2-2 | 0.850 | |||||||||
| PR2-3 | 0.832 | |||||||||
| PR3 | PR3-1 | 0.880 | 0.923 | 0.945 | 0.812 | 0.783 | ||||
| PR3-2 | 0.899 | |||||||||
| PR3-3 | 0.918 | |||||||||
| PR3-4 | 0.906 |
| AC1 | AC2 | NC1 | NC2 | NC3 | PR1 | PR2 | PR3 | MR | LP | SA | |
|---|---|---|---|---|---|---|---|---|---|---|---|
| AC1 | 0.846 | ||||||||||
| AC2 | 0.432 | 0.862 | |||||||||
| NC1 | 0.158 | 0.297 | 0.849 | ||||||||
| NC2 | 0.270 | 0.271 | 0.276 | 0.844 | |||||||
| NC3 | 0.137 | 0.231 | 0.374 | 0.276 | 0.882 | ||||||
| PR1 | 0.28 | 0.143 | 0.132 | 0.154 | 0.187 | 0.871 | |||||
| PR2 | 0.189 | 0.171 | 0.142 | 0.198 | 0.144 | 0.257 | 0.852 | ||||
| PR3 | 0.253 | 0.255 | 0.297 | 0.361 | 0.252 | 0.303 | 0.342 | 0.901 | |||
| MR | 0.263 | 0.27 | 0.344 | 0.395 | 0.277 | 0.349 | 0.288 | 0.476 | 0.867 | ||
| LP | 0.298 | 0.275 | 0.264 | 0.358 | 0.292 | 0.241 | 0.418 | 0.385 | 0.391 | 0.871 | |
| SA | 0.262 | 0.21 | 0.221 | 0.225 | 0.194 | 0.251 | 0.222 | 0.354 | 0.333 | 0.349 | 0.811 |
| AC1 | AC2 | NC1 | NC2 | NC3 | PR1 | PR2 | PR3 | MR | LP | SA | |
|---|---|---|---|---|---|---|---|---|---|---|---|
| AC1 | |||||||||||
| AC2 | 0.527 | ||||||||||
| NC1 | 0.182 | 0.342 | |||||||||
| NC2 | 0.344 | 0.324 | 0.295 | ||||||||
| NC3 | 0.171 | 0.299 | 0.445 | 0.316 | |||||||
| PR1 | 0.324 | 0.164 | 0.145 | 0.188 | 0.232 | ||||||
| PR2 | 0.23 | 0.202 | 0.161 | 0.234 | 0.183 | 0.29 | |||||
| PR3 | 0.29 | 0.291 | 0.325 | 0.409 | 0.303 | 0.328 | 0.39 | ||||
| MR | 0.302 | 0.309 | 0.379 | 0.457 | 0.337 | 0.378 | 0.323 | 0.517 | |||
| LP | 0.341 | 0.31 | 0.288 | 0.41 | 0.358 | 0.262 | 0.476 | 0.412 | 0.422 | ||
| SA | 0.301 | 0.245 | 0.237 | 0.237 | 0.228 | 0.283 | 0.252 | 0.384 | 0.366 | 0.382 |
| Indicators | R2 Value | Adj. R2 | Q2 Value | f2 Value | VIF | ||||||||
|---|---|---|---|---|---|---|---|---|---|---|---|---|---|
| Constructs | — | — | — | NC | AC | SA | LP | PR | NC | AC | SA | LP | PR |
| MR | 0.370 | 0.366 | 0.275 | 0.078 | 0.003 | 0.010 | 0.010 | 0.119 | 1.336 | 1.276 | 1.257 | 1.428 | 1.456 |
| PR | 0.206 | 0.205 | 0.082 | — | — | — | 0.259 | — | — | — | — | 1.000 | — |
| LP | 0.243 | 0.240 | 0.180 | 0.077 | 0.035 | 0.059 | — | — | 1.206 | 1.202 | 1.130 | — | — |
| Hypothesis | Path | Effect | Std. | t | p | 95% CI | Bias-Corrected 95% CI | Test Result |
|---|---|---|---|---|---|---|---|---|
| H1a | NC → LP | 0.265 | 0.034 | 7.823 | <0.001 *** | [0.197, 0.333] | [0.198, 0.334] | Supported |
| H1b | AC → LP | 0.179 | 0.037 | 4.819 | <0.001 *** | [0.104, 0.249] | [0.103, 0.249] | Supported |
| H1c | SA → LP | 0.224 | 0.034 | 6.516 | <0.001 *** | [0.158, 0.292] | [0.155, 0.290] | Supported |
| H2 | LP → PR | 0.454 | 0.032 | 14.151 | <0.001 *** | [0.391, 0.515] | [0.388, 0.512] | Supported |
| H3 | PR → MR | 0.330 | 0.037 | 8.964 | <0.001 *** | [0.259, 0.403] | [0.255, 0.400] | Supported |
| H4 | LP → MR | 0.093 | 0.038 | 2.470 | 0.014 ** | [0.020, 0.168] | [0.022, 0.171] | Supported |
| H5a | NC → MR | 0.256 | 0.034 | 7.496 | <0.001 *** | [0.187, 0.325] | [0.187, 0.324] | Supported |
| H5b | AC → MR | 0.049 | 0.032 | 1.524 | 0.128 ns | [−0.014, 0.113] | [−0.015, 0.111] | Not supported |
| H5c | SA → MR | 0.087 | 0.034 | 2.603 | 0.009 *** | [0.021, 0.153] | [0.025, 0.156] | Supported |
| Hypothesis | Path | Effect | 95% CI | Bias-Corrected 95% CI | Test Result |
|---|---|---|---|---|---|
| H6a | NC → LP → PR → MR | 0.040 | [0.026, 0.057] | [0.026, 0.057] | Supported |
| H6b | AC → LP → PR → MR | 0.027 | [0.015, 0.040] | [0.015, 0.041] | Supported |
| H6c | SA → LP → PR → MR | 0.034 | [0.021, 0.049] | [0.020, 0.049] | Supported |
| Hypothesis | Path | Effect | 95% CI |
|---|---|---|---|
| H7 | Lawn * NC → LP | 0.089 | [0.004, 0.172] |
| Sky * NC → LP | 0.016 | [−0.078, 0.122] | |
| Trees * NC → LP | 0.055 | [−0.024, 0.133] | |
| Architecture * NC → LP | −0.106 | [−0.207, −0.010] | |
| Mulching * NC → LP | −0.100 | [−0.176, −0.022] | |
| Water * NC → LP | 0.030 | [−0.056, 0.117] | |
| Road * NC → LP | 0.033 | [−0.048, 0.109] | |
| Lawn * AC → LP | 0.063 | [−0.032, 0.154] | |
| Sky * AC → LP | −0.058 | [−0.157, 0.033] | |
| Trees * AC → LP | −0.063 | [−0.139, 0.009] | |
| Architecture * AC → LP | −0.024 | [−0.113, 0.064] | |
| Mulching * AC → LP | 0.028 | [−0.062, 0.108] | |
| Water * AC → LP | −0.028 | [−0.117, 0.057] | |
| Road * AC → LP | −0.007 | [−0.093, 0.078] | |
| Lawn * SA → LP | 0.081 | [−0.009, 0.179] | |
| Sky * SA → LP | −0.039 | [−0.127, 0.054] | |
| Trees * SA → LP | 0.071 | [0.005, 0.129] | |
| Architecture * SA → LP | −0.015 | [−0.102, 0.079] | |
| Mulching * SA → LP | 0.116 | [0.042, 0.179] | |
| Water * SA → LP | 0.050 | [−0.022, 0.129] | |
| Road * SA → LP | −0.091 | [−0.164, −0.013] |
Disclaimer/Publisher’s Note: The statements, opinions and data contained in all publications are solely those of the individual author(s) and contributor(s) and not of MDPI and/or the editor(s). MDPI and/or the editor(s) disclaim responsibility for any injury to people or property resulting from any ideas, methods, instructions or products referred to in the content. |
© 2025 by the authors. Licensee MDPI, Basel, Switzerland. This article is an open access article distributed under the terms and conditions of the Creative Commons Attribution (CC BY) license (https://creativecommons.org/licenses/by/4.0/).
Share and Cite
Gao, W.; Tang, B.M.; Liu, B. Effects of Landscape Characteristic Perception of Campus on College Students’ Mental Restoration. Behav. Sci. 2025, 15, 470. https://doi.org/10.3390/bs15040470
Gao W, Tang BM, Liu B. Effects of Landscape Characteristic Perception of Campus on College Students’ Mental Restoration. Behavioral Sciences. 2025; 15(4):470. https://doi.org/10.3390/bs15040470
Chicago/Turabian StyleGao, Wei, Binglin Martin Tang, and Bing Liu. 2025. "Effects of Landscape Characteristic Perception of Campus on College Students’ Mental Restoration" Behavioral Sciences 15, no. 4: 470. https://doi.org/10.3390/bs15040470
APA StyleGao, W., Tang, B. M., & Liu, B. (2025). Effects of Landscape Characteristic Perception of Campus on College Students’ Mental Restoration. Behavioral Sciences, 15(4), 470. https://doi.org/10.3390/bs15040470