

The Chain Mediating Role of Teachers’ Job Stress in the Influence of Distributed School Leadership on Job Satisfaction: Evidence from China, the United States, England, and Australia


Abstract
1. Introduction
1.1. Distributed Leadership and Teachers’ Job Satisfaction
1.2. Teachers’ Work Pressure and School Leadership Participation Time
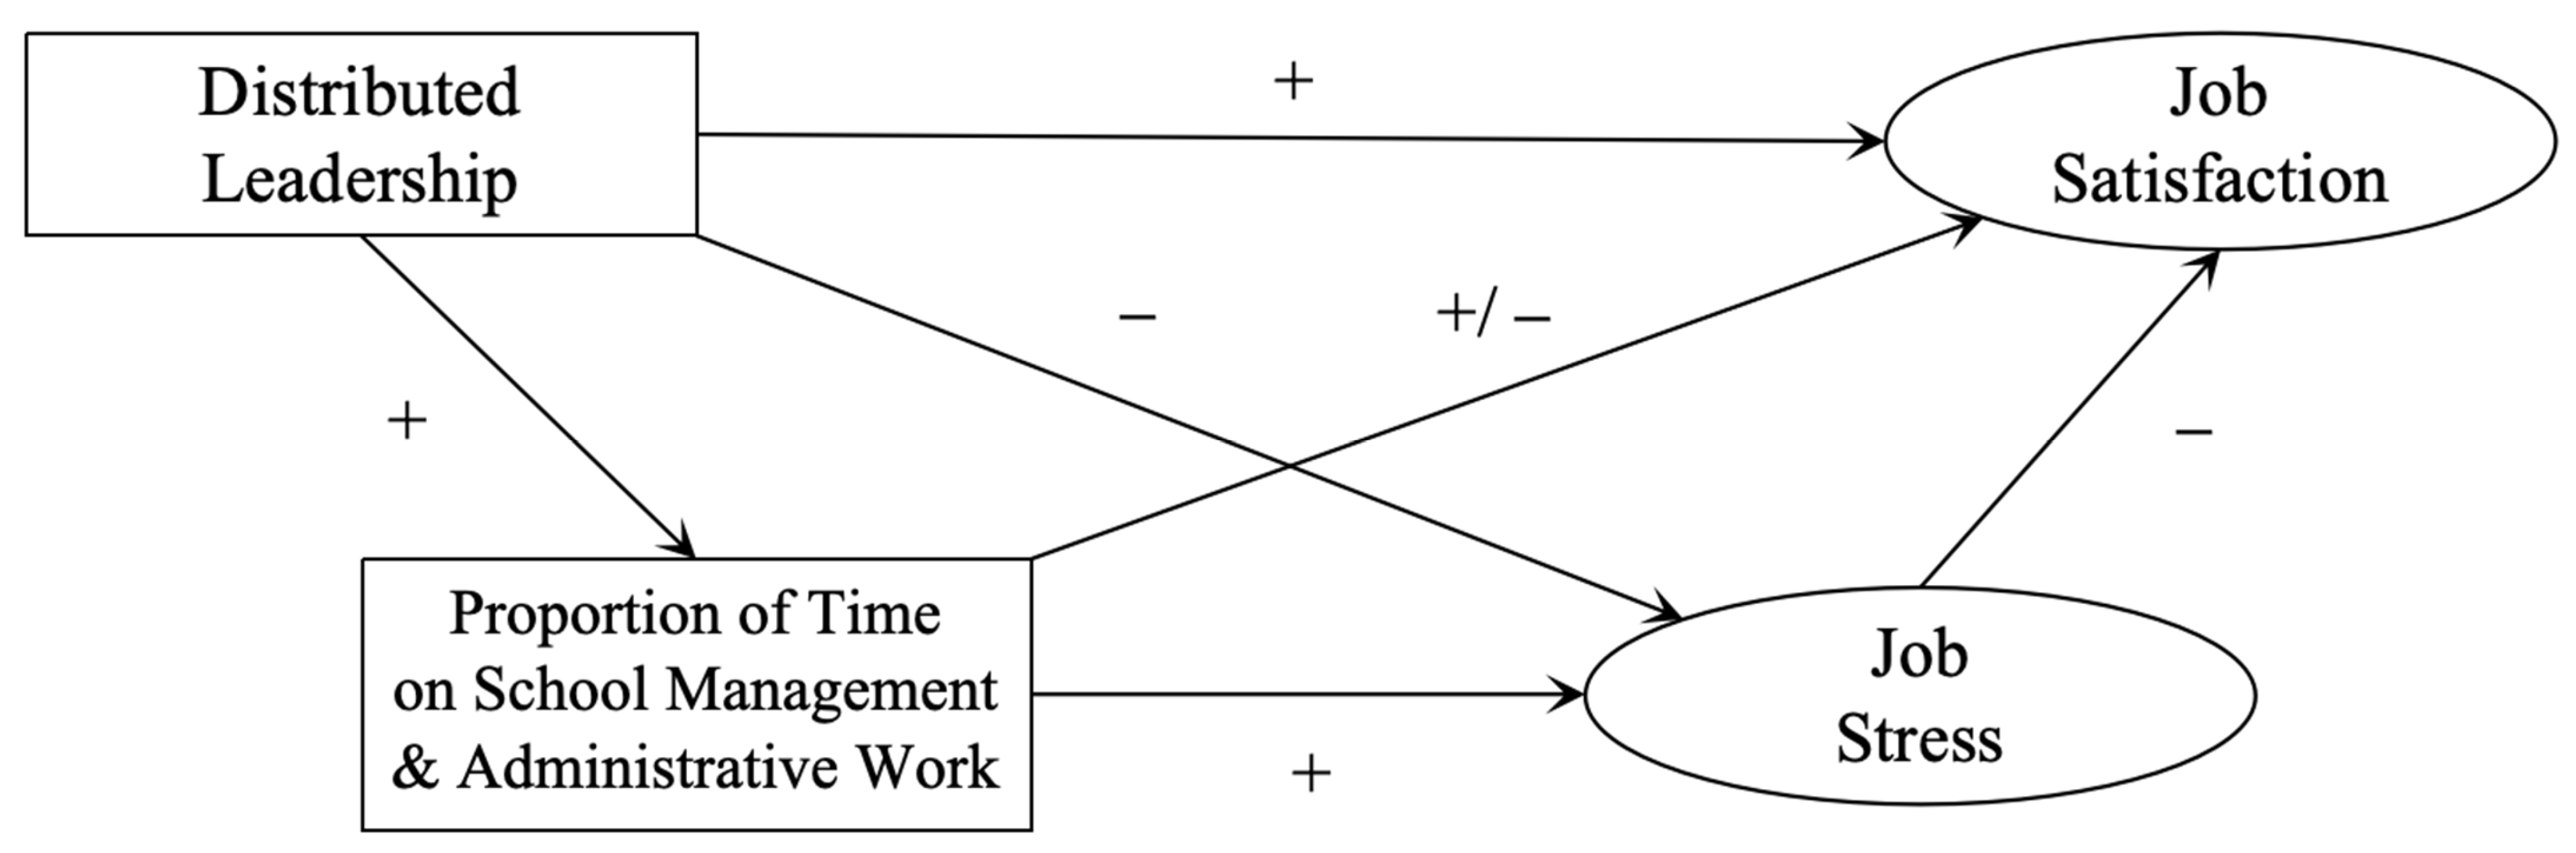
2. Methods
2.1. Data Source and Sample Composition
2.2. Variables and Measurements
2.3. Cross-Cultural Invariance
3. Results
3.1. Descriptive Statistics and Discriminative Validity Test of Variables
3.2. The Relationships between Distributed School Leadership and Teachers’ Job Satisfaction
4. Discussion
5. Limitations and Prospects for Future Research
Author Contributions
Funding
Institutional Review Board Statement
Informed Consent Statement
Data Availability Statement
Conflicts of Interest
References
- Hoang, A.D. A bibliometrics analysis of research on teachers’ satisfaction from 1956 to 2022. Int. J. Educ. Manag. 2023, 37, 164–185. [Google Scholar] [CrossRef]
- Aryawan, I.W.; Agung, A.A.G.; Ni Luh, G.E.S.; Werang, B.R. Exploring the Effect of Interpersonal Communication, Conflict Management, Asta Brata Leadership Style and Motivation on Job Satisfaction of Teachers. Pegem Egit. Ve Ogretim Derg. = Pegem J. Educ. Instr. 2024, 14, 331–339. [Google Scholar] [CrossRef]
- Boyaci, A.; Karacabey, M.F.; Bozkus, K. The role of organizational trust in the effect of leadership of school administrators on job satisfaction of teachers. Educ. Adm. Theory Pract. 2018, 24, 437–482. [Google Scholar]
- García Torres, D. Distributed leadership and teacher job satisfaction in Singapore. J. Educ. Adm. 2018, 56, 127–142. [Google Scholar] [CrossRef]
- Salazar-Botello, C.M.; Munoz-Jara, Y.A.; Ganga-Contreras, F.; Arias BI, C.; Suarez-Amaya, W. Relationship Between the Variables of Job Satisfaction, Burnout and Attitude Towards Change in Teachers of Educational Establishments in Chile. Interciencia 2023, 48, 315–322. [Google Scholar]
- Rachel, T. Teacher Job Satisfaction Lowest in Nearly 40 Years, Survey Finds. 2022. Available online: https://ny1.com/nyc/all-boroughs/news/2022/09/14/teacher-job-satisfaction-lowest-in-decades-edweek-survey- (accessed on 24 January 2024).
- Klassen, R.M.; Anderson, C.J.K. How Times Change: Secondary Teachers’ Job Satisfaction and Dissatisfaction in 1962 and 2007. Br. Educ. Res. J. 2009, 35, 745–759. [Google Scholar] [CrossRef]
- OECD. TALIS 2018 Results (Volume II): Teachers and School Leaders as Valued Professionals, TALIS; OECD Publishing: Paris, France, 2020. [Google Scholar]
- Hwang, S. Profiles of Mathematics Teachers’ Job Satisfaction and Stress and Their Association with Dialogic Instruction. Sustainability 2022, 14, 6925. [Google Scholar] [CrossRef]
- Kyriacou, C.; Sutcliffe, J. Teacher stress: Prevalence, sources, and symptoms. Br. J. Educ. Psychol. 1978, 48, 159–167. [Google Scholar] [CrossRef]
- Dyah, A.P.P.; Mardanung, P.C.; Endang, S. Effect of leadership on the job satisfaction with organizational commitment and trust in leader as mediators. Rev. Integr. Bus. Econ. Res. 2017, 6, 400–408. [Google Scholar]
- Torres, D.G. Distributed leadership, professional collaboration, and teachers’ job satisfaction in US schools. Teach. Teach. Educ. 2019, 79, 111–123. [Google Scholar] [CrossRef]
- Doan, S.; Steiner, E.D.; Pandey, R.; Woo, A. Teacher Well-Being and Intentions to Leave: Findings from the 2023 State of the American Teacher Survey; RAND Corporation: Santa Monica, CA, USA, 2023; Available online: https://www.rand.org/pubs/research_reports/RRA1108-8.html (accessed on 18 March 2024).
- Education Support. Teacher Wellbeing Index 2023. 2023. Available online: https://www.educationsupport.org.uk/media/0h4jd5pt/twix_2023.pdf (accessed on 18 March 2024).
- Sallyann, G. Crunch Time. Aust. Educ. 2022, 2022, 30–31. Available online: https://www.aeufederal.org.au/news-media/australian-educator (accessed on 18 March 2024).
- Spillane, J.P. Distributed Leadership; John Wiley Sons: Hoboken, NJ, USA, 2012. [Google Scholar]
- Bennett, N. Distributed leadership. In The SAGE Handbook of Educational Leadership; The University of North Carolina at Chapel Hill: Chapel Hill, NC, USA, 2016; pp. 373–386. [Google Scholar]
- Harris, A. Distributed leadership: The challenges and possibilities. In Distributed Leadership: New Perspectives; Springer: Amsterdam, The Netherlands, 2018; pp. 1–15. [Google Scholar]
- Spillane, J.P.; Sherer, J.Z. A distributed perspective on school leadership: Leadership practice as stretched over people and place. In Proceedings of the Annual Meeting of the American Education Association, San Diego, CA, USA, 12–16 April 2004. [Google Scholar]
- Harris, A. Distributed Leadership: According to the Evidence. J. Educ. Adm. 2008, 46, 172–188. [Google Scholar] [CrossRef]
- Gronn, P. The Future of Distributed Leadership. J. Educ. Adm. 2008, 46, 141–158. [Google Scholar] [CrossRef]
- Woods, P.A.; Bennett, N.; Harvey, J.A.; Wise, C. Variabilities and dualities in distributed leadership: Findings from a systematic literature review. Educ. Manag. Adm. Leadersh. 2004, 32, 439–457. [Google Scholar] [CrossRef]
- Gronn, P. Distributed leadership as a unit of analysis. Leadersh. Q. 2002, 13, 423–451. [Google Scholar] [CrossRef]
- Spillane, J.P. Towards a theory of leadership practice: A distributed perspective. In Rethinking Schooling; Routledge: New York, NY, USA, 2006; pp. 208–242. [Google Scholar]
- Schleicher, A. TALIS 2018: Insights and Interpretations; OECD: Paris, France, 2018; p. 52. [Google Scholar]
- Collie, R.J.; Shapka, J.D.; Perry, N.E. School climate and social–emotional learning: Predicting teacher stress, job satisfaction, and teaching efficacy. J. Educ. Psychol. 2012, 104, 1189–1204. [Google Scholar] [CrossRef]
- Klassen, R.M.; Chiu, M.M. Effects on teachers’ self-efficacy and job satisfaction: Teacher gender, years of experience, and job stress. J. Educ. Psychol. 2010, 102, 741–756. [Google Scholar] [CrossRef]
- Dinham, S.; Scott, C. A three domain model of teacher and school executive career satisfaction. J. Educ. Adm. 1998, 36, 362–378. [Google Scholar] [CrossRef]
- Griffith, J. Relation of Principal Transformational Leadership to School Staff Job Satisfaction, Staff Turnover, and School Performance. J. Educ. Adm. 2013, 42, 333–356. [Google Scholar] [CrossRef]
- Ingersoll, R.M.; May, H. The Magnitude, Destinations, and Determinants of Mathematics and Science Teacher Turnover. Educ. Eval. Policy Anal. 2012, 34, 435–464. [Google Scholar] [CrossRef]
- Li, S.; Dou, Z.; Ren, P. The Relationship Between Distributed Leadership and Teachers’ job Satisfaction: The Mediating Role of Teacher Cooperation and Teacher Professional Development—Based on the Data of Shanghai Teachers in TALIS 2013. Teach. Educ. Res. 2021, 4, 44–50+75. [Google Scholar]
- Hulpia, H.; Devos, G.; Rosseel, Y. The Relationship Between the Perception of Distributed Leadership in Secondary Schools and Teachers’ and Teacher Leaders’ Job Satisfaction and Organizational Commitment. Sch. Eff. Sch. Improv. 2009, 20, 291–317. [Google Scholar] [CrossRef]
- Liu, Y.; Watson, S. Whose Leadership Role is More Substantial for Teacher Professional Collaboration, Job Satisfaction and Organizational Commitment: A Lens of Distributed Leadership. Int. J. Leadersh. Educ. 2020, 26, 1082–1110. [Google Scholar] [CrossRef]
- Kong, F.; Deng, T.; Yangm, D.; Wan, M. Study on the Working Hours of Primary and Secondary School Teachers and lts Influence on Perceived Workload. J. South China Norm. Univ. 2023, 6, 95–106+207. [Google Scholar]
- Ballet, K.; Kelchtermans, G. Struggling with Workload: Primary Teacher’ Experience of Intensification. Teach. Teach. Educ. 2009, 8, 1150–1157. [Google Scholar] [CrossRef]
- Sun, R. Junior High School Teachers’ Working Time and Job Satisfaction Under the Background of “Double Reduction” Findings and lnsights Based on TALlS 2018 Data in Shanghai. Educ. Meas. Eval. 2023, 5, 12–25. [Google Scholar]
- Kyriacou, C. Teacher Stress: Directions for future research. Educ. Rev. 2001, 53, 27–35. [Google Scholar] [CrossRef]
- Zhou, Q.; Chen, S.; Deng, Y. The Impact of Exogenous Stressors on Primary and Secondary School Teachers’ Work Stress Performance: Masking Effect Based on Self-Efficacy. Educ. Sci. 2023, 4, 47–54. [Google Scholar]
- Maas, J.; Schoch, S.; Scholz, U.; Rackow, P.; Schüler, J.; Wegner, M.; Keller, R. Teachers’ perceived time pressure, emotional exhaustion and the role of social support from the school principal. Soc. Psychol. Educ. 2021, 24, 441–464. [Google Scholar] [CrossRef]
- Kollerová, L.; Květon, P.; Zábrodská, K.; Janošová, P. Teacher exhaustion: The effects of disruptive student behaviors, victimization by workplace bullying, and social support from colleagues. Soc. Psychol. Educ. 2023, 26, 885–902. [Google Scholar] [CrossRef]
- Herman, K.C.; Sebastian, J.; Eddy, C.L.; Reinke, W.M. School leadership, climate, and professional isolation as predictors of special education teachers’ stress and coping profiles. J. Emot. Behav. Disord. 2023, 31, 120–131. [Google Scholar] [CrossRef]
- Gundogan, S. The relationship of covid-19 student stress with school burnout, depression, and subjective well-being: Adaptation of the covid-19 student stress scale into turkish. Asia-Pac. Educ. Res. 2023, 32, 165–176. [Google Scholar] [CrossRef]
- Mosley, K.C.; Playfair, E.C.; Weppner, C.H.; Balat, A.; Mccarthy, C.J. ‘The bread and butter of a difficult profession’: Mentoring as a resource for teacher stress. Teach. Teach. 2023, 29, 20–36. [Google Scholar] [CrossRef]
- Luo, J.; Zhang, B.; Cao, M.; Roberts, B.W. The stressful personality: A meta-analytical review of the relation between personality and stress. Personal. Soc. Psychol. Rev. 2023, 27, 128–194. [Google Scholar] [CrossRef]
- Collie, R.J. COVID-19 and Teachers’ Somatic Burden, Stress, and Emotional Exhaustion: Examining the Role of Principal Leadership and Workplace Buoyancy. AERA Open 2021, 7. [Google Scholar] [CrossRef]
- Rabindarang, S.; Bing, K.W.; Yin, K. YThe influence of distributed leadership on job stress in technical and vocational education. Int. J. Acad. Res. Bus. Soc. Sci. 2014, 4, 490–499. [Google Scholar]
- Woods, S.; Sebastian, J.; Herman, K.C.; Huang, F.L.; Reinke, W.M.; Thompson, A.M. The relationship between teacher stress and job satisfaction as moderated by coping. Psychol. Sch. 2023, 60, 2237–2256. [Google Scholar] [CrossRef]
- Xu, X. A Study on the Relationship between the Mental Worker Job intrinsic-Extrinsic Stress and Job Satisfaction. Chin. J. Appl. Psychol. 2004, 3, 41–47. [Google Scholar]
- Li, X. The Overloading and Effective Adjustment of the Workload of Primary and Secondary School Teachers. J. Chin. Soc. Educ. 2016, 2, 56–60. [Google Scholar]
- MacIntyre, P.D.; Gregersen, T.; Mercer, S. Language teachers’ coping strategies during the COVID-19 conversion to online teaching: Correlations with stress, wellbeing and negative emotions. System 2020, 94, 102352. [Google Scholar] [CrossRef]
- Hickey, N.; Flaherty, A.; Mannix McNamara, P. Distributed Leadership in Irish Post-Primary Schools: Policy versus Practitioner Interpretations. Educ. Sci. 2023, 13, 388. [Google Scholar] [CrossRef]
- Yokota, H. Mapping four leadership styles in Japan: How has the role of the principal been shaped by policies? J. Educ. Adm. 2020, 58, 187–207. [Google Scholar] [CrossRef]
- Gunter, H.; Rayner, S. Modernizing the school workforce in England: Challenging transformation and leadership? Leadership 2007, 3, 47–64. [Google Scholar] [CrossRef]
- Bush, T.; Ng, A.Y.M. Distributed leadership and the Malaysia Education Blueprint: From prescription to partial school-based enactment in a highly centralised context. J. Educ. Adm. 2019, 57, 279–295. [Google Scholar] [CrossRef]
- Hallinger, P.; Heck, R. Collaborative leadership and school improvement: Understanding the impact on school capacity and student learning. Sch. Leadersh. Manag. Former. Sch. Organ. 2010, 30, 95–110. [Google Scholar] [CrossRef]
- Miller, M.J.; Sheu, H. Conceptual and measurement issues in multicultural psychology research. In Handbook of Counseling Psychology; John Wiley: Hoboken, NJ, USA, 2008; p. 103. [Google Scholar]
- Chen, F. Sensitivity of goodness of fit indexes to lack of measurement invariance. Struct. Equ. Model. 2007, 14, 464–504. [Google Scholar] [CrossRef]
- Hall, D. The Strange Case of the Emergence of Distributed Leadership in Schools in England. Educ. Rev. 2013, 65, 467–487. [Google Scholar] [CrossRef]
- Furner, C.; McCulla, N. An exploration of the influence of school context, ethos and culture on teacher career-stage professional learning. Prof. Dev. Educ. 2019, 45, 505–519. [Google Scholar] [CrossRef]


| Variable | Number of Teachers in Shanghai | Number of Teachers in the US | Number of Teachers in the UK | Number of Teachers in Australia |
|---|---|---|---|---|
| Total (collected) | 3976 | 2560 | 2376 | 3573 |
| Total | 2664 | 1758 | 1646 | 2333 |
| Teacher gender | ||||
| Female | 1958 | 1197 | 1049 | 1492 |
| Male | 706 | 561 | 597 | 841 |
| Teacher education | ||||
| Bachelor’s degree or below | 2293 | 646 | 1232 | 1895 |
| Graduate student | 371 | 1112 | 414 | 438 |
| School type | ||||
| Civilian run | 436 | 117 | 1059 | 825 |
| Government-run | 2228 | 1641 | 587 | 1508 |
| School location (after basic processing) | ||||
| Town and village | 325 | 546 | 413 | 290 |
| City | 2339 | 1212 | 1233 | 2043 |
| Scale Label | Invariance Level | RMSEA | CFI | TLI | SRMR | ∆CFI | ∆TLI |
|---|---|---|---|---|---|---|---|
| Job satisfaction with work environment, teacher | Metric | 0.056 | 0.969 | 0.962 | 0.092 | 0.017 | −0.005 |
| Job satisfaction with profession, teacher | Metric | 0.071 | 0.961 | 0.94 | 0.088 | 0.037 | 0.049 |
| Workload stress | Metric | 0.068 | 0.949 | 0.936 | 0.069 | 0.027 | 0.003 |
| Workplace stress | Metric | 0.088 | 0.948 | 0.936 | 0.09 | 0.035 | 0.012 |
| Stakeholder behavioral stress | Metric | 0.079 | 0.958 | 0.94 | 0.089 | 0.035 | 0.015 |
| Distributed leadership | Metric | 0.093 | 0.995 | 0.998 | 0.044 | 0.025 | 0.023 |
| Shanghai (China) | ||||||||||||
| N | M | SD | T | DL | WPS | WLS | SS | JSE | JSP | JSO | ||
| T | 2664 | 0.0824 | 0.1201 | -- | ||||||||
| DL | 2664 | 3.3419 | 0.64493 | r | 0.082 ** | -- | ||||||
| p | 0 | |||||||||||
| WPS | 2664 | 2.747 | 0.76007 | r | −0.008 | −0.265 ** | -- | |||||
| p | 0.685 | 0 | ||||||||||
| WLS | 2664 | 2.4572 | 0.75787 | r | 0.002 | −0.227 ** | 0.560 ** | -- | ||||
| p | 0.938 | 0 | 0 | |||||||||
| SS | 2664 | 2.9751 | 0.80455 | r | −0.043 * | −0.164 ** | 0.527 ** | 0.591 ** | -- | |||
| p | 0.027 | 0 | 0 | 0 | ||||||||
| JSE | 2664 | 3.5038 | 0.67559 | r | 0.068 ** | 0.531 ** | −0.438 ** | −0.322 ** | −0.261 ** | -- | ||
| p | 0 | 0 | 0 | 0 | 0 | |||||||
| JSP | 2664 | 4.2021 | 0.70233 | r | 0.049 * | 0.418 ** | −0.445 ** | −0.315 ** | −0.307 ** | 0.653 ** | -- | |
| p | 0.012 | 0 | 0 | 0 | 0 | 0 | ||||||
| JSO | 2664 | 3.11 | 0.574 | r | 0.028 | 0.345 ** | −0.288 ** | −0.198 ** | −0.177 ** | 0.548 ** | 0.620 ** | -- |
| p | 0.147 | 0 | 0 | 0 | 0 | 0 | 0 | |||||
| United States | ||||||||||||
| N | M | SD | T | DL | WPS | WLS | SS | JSE | JSP | JSO | ||
| T | 1758 | 0.0566 | 0.06759 | -- | ||||||||
| DL | 1758 | 3.2061 | 0.70566 | r | 0.037 | -- | ||||||
| p | 0.124 | |||||||||||
| WPS | 1758 | 2.7823 | 0.83141 | r | −0.005 | −0.263 ** | -- | |||||
| p | 0.849 | 0 | ||||||||||
| WLS | 1758 | 2.4514 | 0.78331 | r | −0.018 | −0.152 ** | 0.522 ** | -- | ||||
| p | 0.44 | 0 | 0 | |||||||||
| SS | 1758 | 3.1289 | 0.89172 | r | −0.04 | −0.192 ** | 0.567 ** | 0.494 ** | -- | |||
| p | 0.091 | 0 | 0 | 0 | ||||||||
| JSE | 1758 | 3.7153 | 0.73437 | r | 0.043 | 0.523 ** | −0.407 ** | −0.247 ** | −0.321 ** | -- | ||
| p | 0.072 | 0 | 0 | 0 | 0 | |||||||
| JSP | 1758 | 11.4253 | 2.46434 | r | 0.052 * | 0.262 ** | −0.462 ** | −0.285 ** | −0.366 ** | 0.439 ** | -- | |
| p | 0.028 | 0 | 0 | 0 | 0 | 0 | ||||||
| JSO | 1758 | 3.17 | 0.668 | r | 0.033 | 0.369 ** | −0.492 ** | −0.304 ** | −0.350 ** | 0.583 ** | 0.671 ** | -- |
| p | 0.164 | 0 | 0 | 0 | 0 | 0 | 0 | |||||
| England (United Kingdom) | ||||||||||||
| N | M | SD | T | DL | WPS | WLS | SS | JSE | JSP | JSO | ||
| T | 1646 | 0.1027 | 0.09356 | -- | ||||||||
| DL | 1646 | 3.1548 | 0.68925 | r | 0.087 ** | -- | ||||||
| p | 0 | |||||||||||
| WPS | 1646 | 3.2201 | 0.90489 | r | 0.032 | −0.342 ** | -- | |||||
| p | 0.196 | 0 | ||||||||||
| WLS | 1646 | 3.69 | 0.95797 | r | −0.116 ** | −0.255 ** | 0.548 ** | -- | ||||
| p | 0 | 0 | 0 | |||||||||
| SS | 1646 | 3.2875 | 0.81508 | r | −0.042 | −0.216 ** | 0.498 ** | 0.492 ** | -- | |||
| p | 0.088 | 0 | 0 | 0 | ||||||||
| JSE | 1646 | 3.4942 | 0.7509 | r | 0.047 | 0.556 ** | −0.471 ** | −0.331 ** | −0.345 ** | -- | ||
| p | 0.057 | 0 | 0 | 0 | 0 | |||||||
| JSP | 1646 | 3.6967 | 0.81449 | r | 0.02 | 0.350 ** | −0.541 ** | −0.418 ** | −0.423 ** | 0.532 ** | -- | |
| p | 0.407 | 0 | 0 | 0 | 0 | 0 | ||||||
| JSO | 1646 | 2.87 | 0.701 | r | 0.021 | 0.406 ** | −0.538 ** | −0.365 ** | −0.384 ** | 0.635 ** | 0.672 ** | -- |
| p | 0.405 | 0 | 0 | 0 | 0 | 0 | 0 | |||||
| Australia | ||||||||||||
| N | M | SD | T | DL | WPS | WLS | SS | JSE | JSP | JSO | ||
| T | 2333 | 0.1141 | 0.11181 | -- | ||||||||
| DL | 2333 | 3.1538 | 0.72168 | r | 0.026 | -- | ||||||
| p | 0.217 | |||||||||||
| WPS | 2333 | 2.961 | 0.84009 | r | 0.061 ** | −0.309 ** | -- | |||||
| p | 0.003 | 0 | ||||||||||
| WLS | 2333 | 3.1495 | 0.94048 | r | −0.046 * | −0.225 ** | 0.522 ** | -- | ||||
| p | 0.026 | 0 | 0 | |||||||||
| SS | 2333 | 3.1071 | 0.89875 | r | −0.041 * | −0.223 ** | 0.485 ** | 0.493 ** | -- | |||
| p | 0.047 | 0 | 0 | 0 | ||||||||
| JSE | 2333 | 3.5706 | 0.76379 | r | 0.007 | 0.524 ** | −0.436 ** | −0.253 ** | −0.320 ** | -- | ||
| p | 0.753 | 0 | 0 | 0 | 0 | |||||||
| JSP | 2333 | 4.1515 | 0.7417 | r | −0.017 | 0.326 ** | −0.460 ** | −0.353 ** | −0.370 ** | 0.524 ** | -- | |
| p | 0.404 | 0 | 0 | 0 | 0 | 0 | ||||||
| JSO | 2333 | 3.12 | 0.63 | r | −0.002 | 0.390 ** | −0.462 ** | −0.290 ** | −0.338 ** | 0.635 ** | 0.658 ** | -- |
| p | 0.934 | 0 | 0 | 0 | 0 | 0 | 0 | |||||
| Shanghai (China) | ||||||||
| Model | Δχ2 | Δdf | χ2/df | p | RMSEA | NFI | CFI | GFI |
| Reference model | 213.033 | 10 | 21.303 | 0.000 | 0.087 | 0.962 | 0.964 | 0.977 |
| Model 1 | 798.650 | 12 | 66.554 | 0.000 | 0.157 | 0.857 | 0.859 | 0.922 |
| Model 2 | 231.853 | 12 | 19.321 | 0.000 | 0.083 | 0.959 | 0.961 | 0.975 |
| Model 3 | 213.842 | 11 | 19.440 | 0.000 | 0.083 | 0.962 | 0.964 | 0.977 |
| Model 4 | 806.800 | 13 | 62.062 | 0.000 | 0.151 | 0.856 | 0.858 | 0.920 |
| Model 5 | 1457.708 | 14 | 104.122 | 0.000 | 0.197 | 0.739 | 0.741 | 0.834 |
| United States | ||||||||
| Model | Δχ2 | Δdf | χ2/df | p | RMSEA | NFI | CFI | GFI |
| Reference model | 159.103 | 10 | 15.910 | 0.000 | 0.092 | 0.946 | 0.949 | 0.976 |
| Model 1 | 425.722 | 12 | 35.477 | 0.000 | 0.140 | 0.855 | 0.858 | 0.937 |
| Model 2 | 163.051 | 12 | 13.588 | 0.000 | 0.085 | 0.944 | 0.948 | 0.975 |
| Model 3 | 158.211 | 11 | 14.474 | 0.000 | 0.088 | 0.946 | 0.949 | - |
| Model 4 | 429.669 | 13 | 33.051 | 0.000 | 0.135 | 0.853 | 0.857 | 0.937 |
| Model 5 | 502.138 | 14 | 35.867 | 0.000 | 0.141 | 0.829 | 0.832 | 0.920 |
| England (United Kingdom) | ||||||||
| Model | Δχ2 | Δdf | χ2/df | p | RMSEA | NFI | CFI | GFI |
| Reference model | 215.012 | 10 | 21.501 | 0.000 | 0.112 | 0.934 | 0.936 | 0.964 |
| Model 1 | 407.445 | 12 | 33.954 | 0.000 | 0.142 | 0.874 | 0.877 | 0.934 |
| Model 2 | 225.503 | 12 | 18.792 | 0.000 | 0.104 | 0.930 | 0.934 | 0.963 |
| Model 3 | 215.057 | 11 | 19.551 | 0.000 | 0.106 | 0.934 | 0.937 | 0.964 |
| Model 4 | 407.446 | 13 | 31.342 | 0.000 | 0.136 | 0.874 | 0.878 | 0.934 |
| Model 5 | 448.670 | 14 | 32.000 | 0.000 | 0.137 | 0.862 | 0.865 | 0.923 |
| Australia | ||||||||
| Model | Δχ2 | Δdf | χ2/df | p | RMSEA | NFI | CFI | GFI |
| Reference model | 253.689 | 10 | 25.369 | 0.000 | 0.102 | 0.937 | 0.939 | 0.970 |
| Model 1 | 534.465 | 12 | 44.539 | 0.000 | 0.137 | 0.868 | 0.870 | 0.938 |
| Model 2 | 256.097 | 12 | 21.341 | 0.000 | 0.093 | 0.937 | 0.939 | 0.969 |
| Model 3 | 253.786 | 11 | 23.071 | 0.000 | 0.097 | 0.937 | 0.940 | 0.970 |
| Model 4 | 534.591 | 13 | 41.122 | 0.000 | 0.131 | 0.868 | 0.870 | 0.938 |
| Model 5 | 673.026 | 14 | 48.073 | 0.000 | 0.142 | 0.833 | 0.836 | 0.917 |
| Shanghai (China) | ||||||||
| Model | Δχ2 | Δdf | χ2/df | p | GFI | CFI | NFI | RMSEA |
| Reference model | 202.555 | 7 | 28.936 | 0.000 | 0.974 | 0.965 | 0.964 | 0.102 |
| Model 1 | 778.676 | 8 | 97.334 | 0.000 | 0.912 | 0.861 | 0.860 | 0.190 |
| Model 2 | 1434.792 | 9 | 159.421 | 0.000 | 0.813 | 0.743 | 0.742 | 0.244 |
| United States | ||||||||
| Model | Δχ2 | Δdf | χ2/df | p | GFI | CFI | NFI | RMSEA |
| Reference model | 154.439 | 7 | 22.063 | 0.000 | 0.972 | 0.949 | 0.947 | 0.109 |
| Model 1 | 421.502 | 8 | 52.688 | 0.000 | 0.928 | 0.858 | 0.856 | 0.172 |
| Model 2 | 494.439 | 9 | 54.938 | 0.000 | 0.910 | 0.833 | 0.831 | 0.175 |
| England (United Kingdom) | ||||||||
| Model | Δχ2 | Δdf | χ2/df | p | GFI | CFI | NFI | RMSEA |
| Reference model | 168.452 | 7 | 24.065 | 0.000 | 0.968 | 0.949 | 0.947 | 0.118 |
| Model 1 | 351.417 | 8 | 43.927 | 0.000 | 0.933 | 0.892 | 0.890 | 0.162 |
| Model 2 | 392.984 | 9 | 43.665 | 0.000 | 0.920 | 0.879 | 0.877 | 0.161 |
| Australia | ||||||||
| Model | Δχ2 | Δdf | χ2/df | p | GFI | CFI | NFI | RMSEA |
| Reference model | 215.953 | 7 | 30.850 | 0.000 | 0.970 | 0.948 | 0.946 | 0.113 |
| Model 1 | 494.409 | 8 | 61.801 | 0.000 | 0.934 | 0.878 | 9.876 | 0.161 |
| Model 2 | 632.834 | 9 | 70.315 | 0.000 | 0.909 | 0.843 | 0.842 | 0.172 |
| Shanghai (China) | |||||
| Effect size | SE | p | 95%CI | ||
| Lower | Upper | ||||
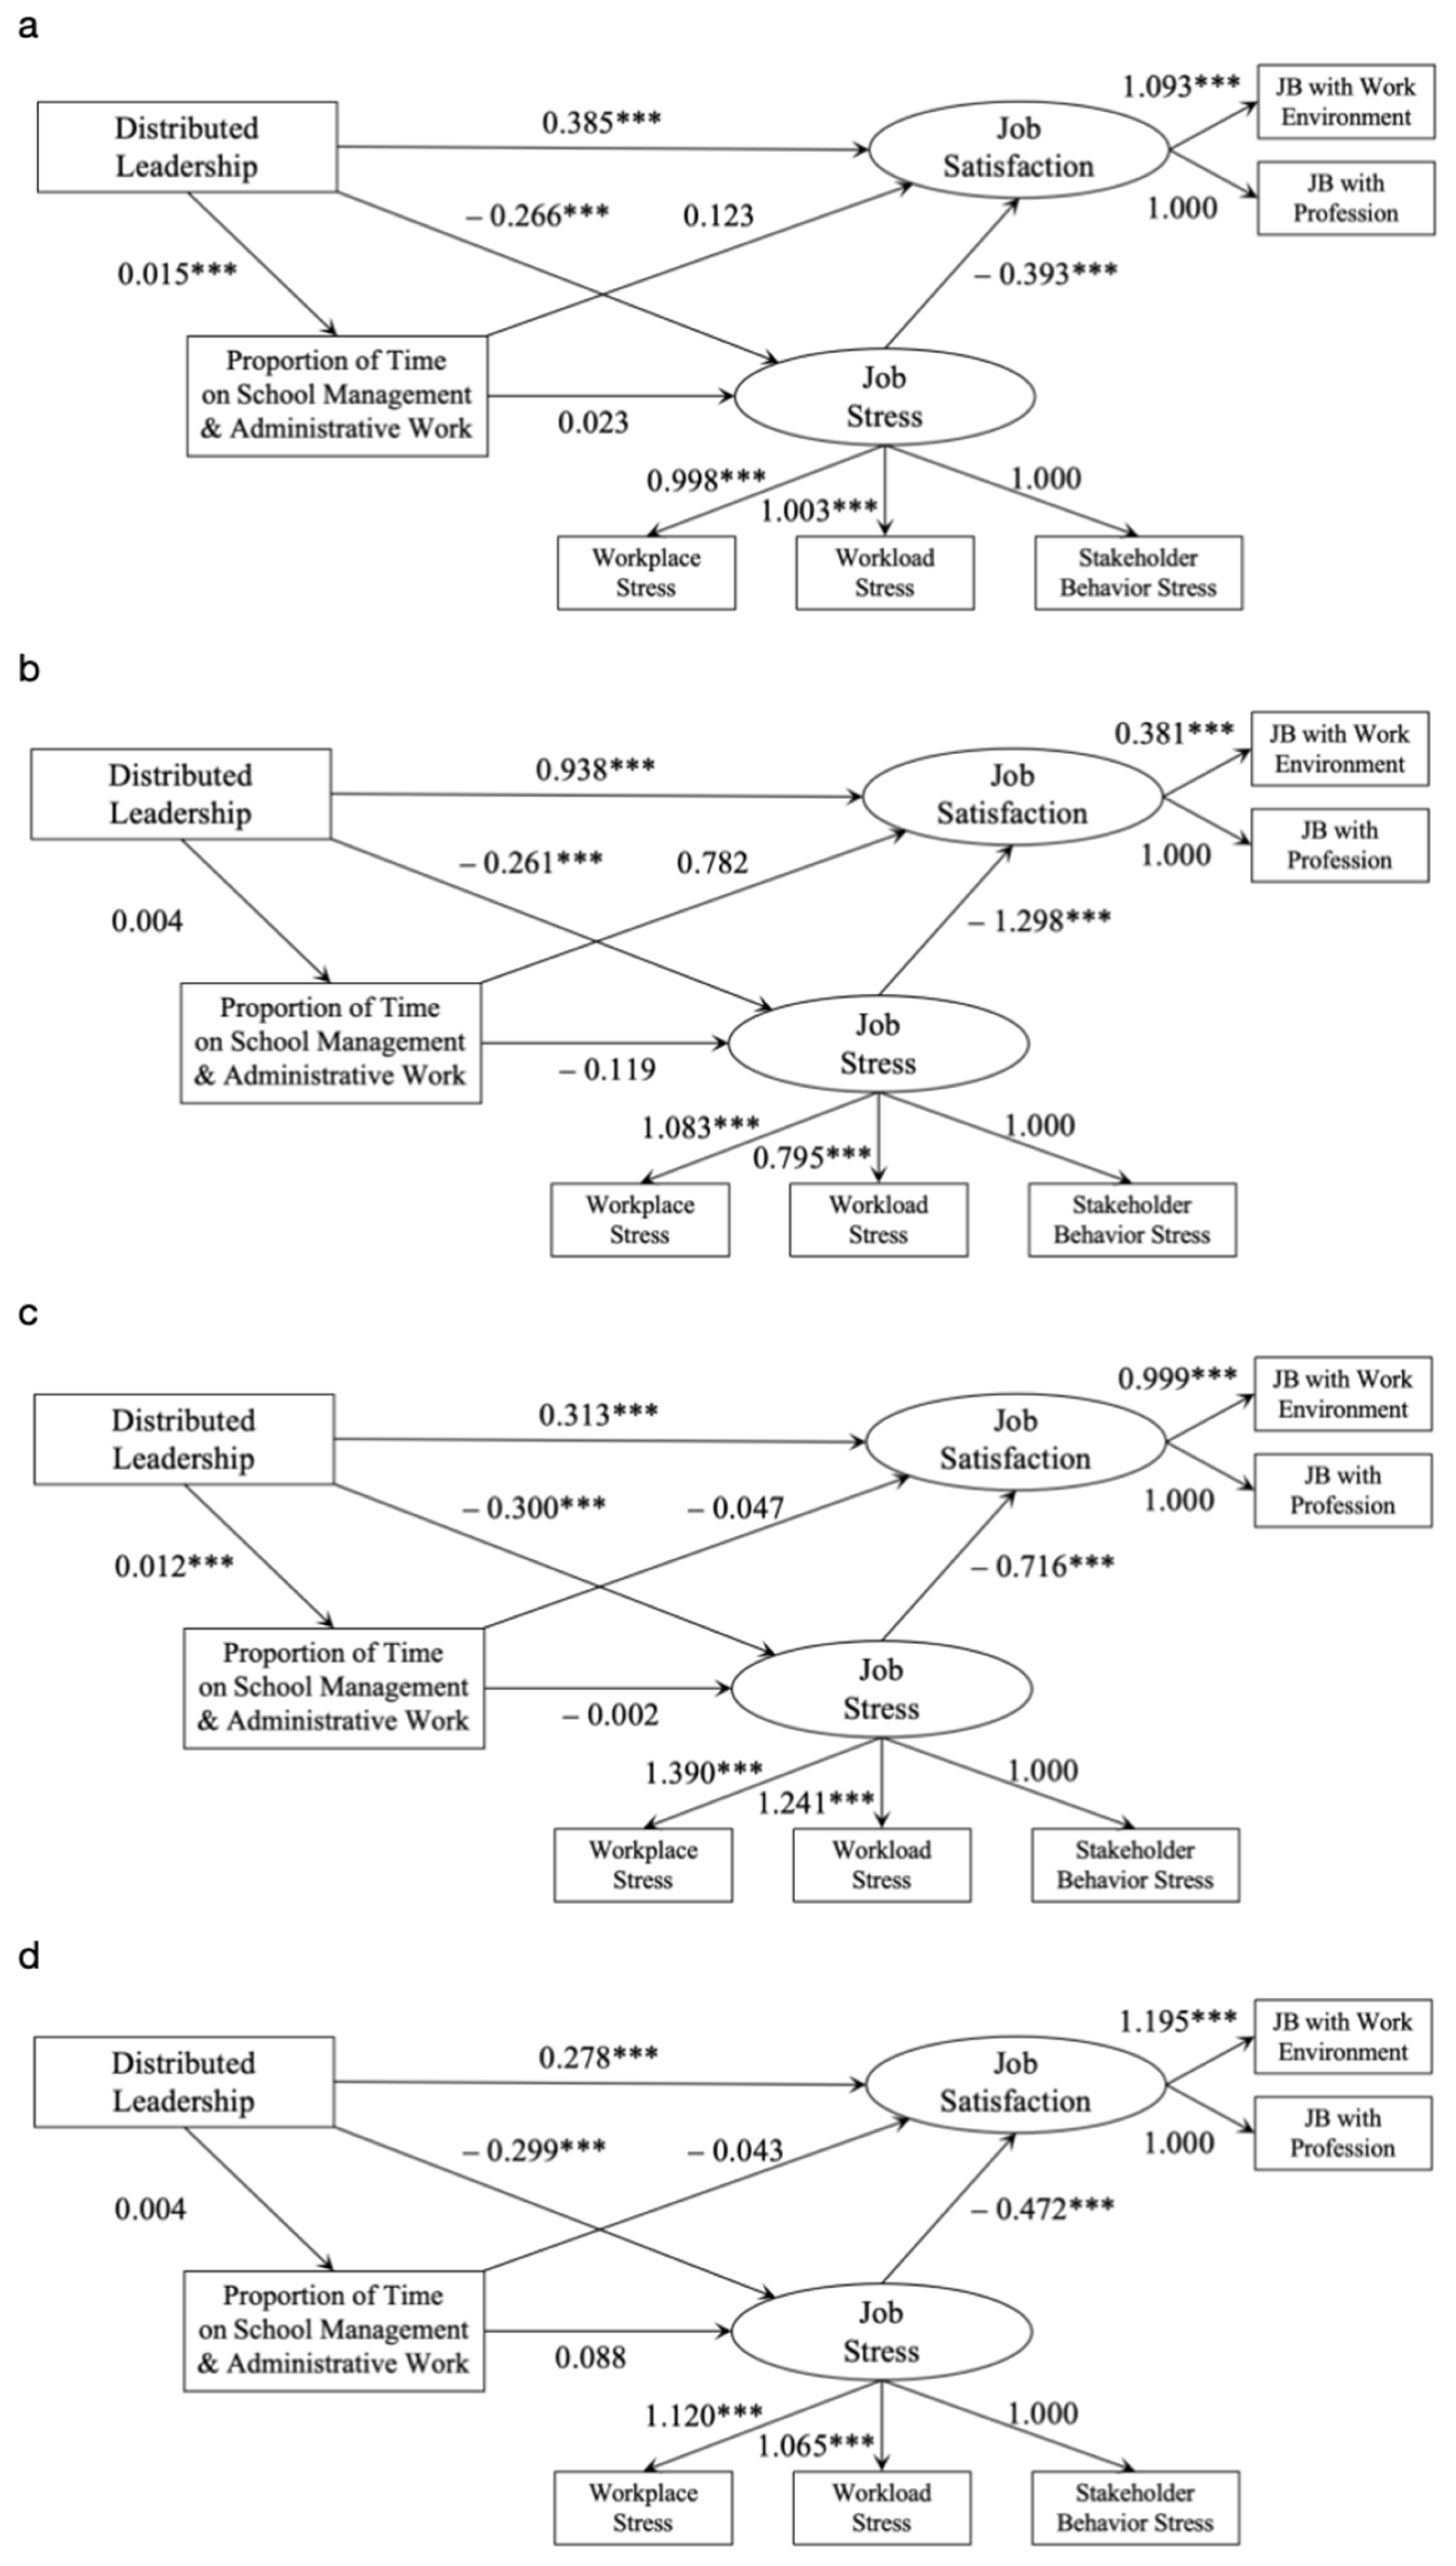
| Direct | 0.385 | 0.020 | 0.000 | 0.347 | 0.426 |
| Indirect | 0.106 | 0.012 | 0.000 | 0.084 | 0.130 |
| Total | 0.492 | 0.022 | 0.000 | 0.450 | 0.536 |
| United States | |||||
| Effect size | SE | p | 95%CI | ||
| Lower | Upper | ||||
| Direct | 0.938 | 0.062 | 0.000 | 0.818 | 1.061 |
| Indirect | 0.342 | 0.048 | 0.000 | 0.253 | 0.443 |
| Total | 1.280 | 0.069 | 0.000 | 1.149 | 1.421 |
| England (United Kingdom) | |||||
| Effect size | SE | p | 95%CI | ||
| Lower | Upper | ||||
| Direct | 0.313 | 0.021 | 0.000 | 0.273 | 0.354 |
| Indirect | 0.214 | 0.021 | 0.000 | 0.176 | 0.256 |
| Total | 0.527 | 0.023 | 0.000 | 0.484 | 0.575 |
| Australia | |||||
| Effect size | SE | p | 95%CI | ||
| Lower | Upper | ||||
| Direct | 0.278 | 0.016 | 0.000 | 0.247 | 0.310 |
| Indirect | 0.141 | 0.015 | 0.000 | 0.114 | 0.172 |
| Total | 0.420 | 0.017 | 0.000 | 0.386 | 0.455 |
Disclaimer/Publisher’s Note: The statements, opinions and data contained in all publications are solely those of the individual author(s) and contributor(s) and not of MDPI and/or the editor(s). MDPI and/or the editor(s) disclaim responsibility for any injury to people or property resulting from any ideas, methods, instructions or products referred to in the content. |
© 2024 by the authors. Licensee MDPI, Basel, Switzerland. This article is an open access article distributed under the terms and conditions of the Creative Commons Attribution (CC BY) license (https://creativecommons.org/licenses/by/4.0/).
Share and Cite
Li, J.; Xue, E.; Liu, Y. The Chain Mediating Role of Teachers’ Job Stress in the Influence of Distributed School Leadership on Job Satisfaction: Evidence from China, the United States, England, and Australia. Behav. Sci. 2024, 14, 279. https://doi.org/10.3390/bs14040279
Li J, Xue E, Liu Y. The Chain Mediating Role of Teachers’ Job Stress in the Influence of Distributed School Leadership on Job Satisfaction: Evidence from China, the United States, England, and Australia. Behavioral Sciences. 2024; 14(4):279. https://doi.org/10.3390/bs14040279
Chicago/Turabian StyleLi, Jian, Eryong Xue, and Yuxuan Liu. 2024. "The Chain Mediating Role of Teachers’ Job Stress in the Influence of Distributed School Leadership on Job Satisfaction: Evidence from China, the United States, England, and Australia" Behavioral Sciences 14, no. 4: 279. https://doi.org/10.3390/bs14040279
APA StyleLi, J., Xue, E., & Liu, Y. (2024). The Chain Mediating Role of Teachers’ Job Stress in the Influence of Distributed School Leadership on Job Satisfaction: Evidence from China, the United States, England, and Australia. Behavioral Sciences, 14(4), 279. https://doi.org/10.3390/bs14040279